- 1The Yellow River Civilization and The Sustainable Development Research Center, Henan University, Kaifeng, China
- 2College of Geography and Environmental Science, Henan University, Kaifeng, China
- 3Key Laboratory of Geospatial Technology for the Middle and Lower Yellow River Regions, Ministry of Education, Henan University, Kaifeng, China
Climate transition zones are ecologically sensitive regions that respond to changes in complex natural conditions. Analyzing the spatiotemporal evolution trends and impact factors of landscape ecological risk is crucial for maintaining regional ecosystem security. However, research predominantly focused on the past analytical paradigm, which often needed more strategic predictions for future scenarios tailored to diverse developmental requirements. This study analyzed land use changes in the Huai River Basin during 2000, 2010, and 2020 and used the Future Land Use Simulation model to conduct a multi-scenario simulation for 2030. Subsequently, this study assessed the landscape ecological risk from 2000 to 2030 and analyzed the influencing mechanisms using the ridge regression model. The results showed that: (1) The primary transitions were concentrated between cropland and construction land. By 2030, the area of construction land was projected to continue to expand, with the greatest increase of 2906 km2 anticipated in the natural development scenario. (2) The overall spatial pattern of landscape ecological risk showed a “high in the east and low in the west” distribution, with the lowest risk areas predominating (accounting for over 43%). Over the past 20 years, the risk initially increased and then decreased, and by 2030, the risk was expected to decline further. (3) The risk exhibited significant positive spatial autocorrelation. By 2030, the constraint of spatial location on risk distribution would decrease. Local spatial clustering was mainly characterized by “Low-Low” regions (accounting for 20%). (4) Vegetation cover consistently correlated negatively with ecological risk and was the most influential factor, with relative contribution rates all exceeding 21%. The findings have provided a scientific reference for the ecological and environmental management of areas with intense human activity under complex climatic conditions.
1 Introduction
The ecological environment provides crucial material support and services for human survival and societal development. Maintaining ecosystem security is fundamental to achieving sustainable development (Ai et al., 2022). Escalating pressures on ecosystems driven by global climate change and complex human activities result in numerous ecological risks. These effects include environmental pollution (Bank et al., 2022), soil erosion (Li and Fang, 2016), urban heat island effects (Akbari and Kolokotsa, 2016), and biodiversity reduction (Outhwaite et al., 2022). Preventing and mitigating these ecological risks are common challenges faced by countries worldwide. In response to the challenges, the United Nations includes among its 17 Sustainable Development Goals for 2030 the objective to “protect, restore, and promote sustainable use of terrestrial ecosystems, sustainably manage forests, combat desertification, halt and reverse land degradation, and halt biodiversity loss” (Goal 15) (Adhikari et al., 2023). As a composite of natural surfaces, the landscape constitutes a collection of regional ecosystems with pronounced spatial heterogeneity. Its heterogeneity is closely associated with an ecosystem’s capacity to resist disturbances, stability, and diversity (He et al., 2020; Liu et al., 2022). The expression of heterogeneity provides a key perspective for assessing landscape ecological risks. Incorporating scale effects to examine the relationship between landscape patterns and ecological evolutionary forms the basis for evaluating the adverse impacts of internal risk sources and external complex disturbances on ecosystem functions and structures (Qian et al., 2022; Shi et al., 2024). Therefore, detailed assessments and analyses of landscape ecological risks are vital for maintaining regional ecological security.
The selection of appropriate evaluation units is fundamental for assessing landscape ecological risks. Evaluation units are currently divided into two main types: administrative divisions (Wang et al., 2023d) and risk subzones (Xue et al., 2019). The administrative divisions are primarily at the city and county levels, whereas the average study area patch size generally constrains the risk subzones. In comparison, the risk subzones provide a more detailed division of units, which enhances the integrity and consistency of ecosystems following human-induced segmentation (Qu et al., 2022). The primary approaches for evaluation are based on risk source-sink and landscape patterns (Dai et al., 2021; Wu et al., 2021b). The risk source-sink method can evaluate the degree of regional landscape ecological risks through risk source identification, receptor analysis, exposure, and a hazard response model. The landscape pattern method transcends the traditional ecosystem evaluation paradigms. In this approach, risk receptors are not limited to single elements within regional ecosystems (Zhang et al., 2020). Risk sources extend beyond environmental pollutants, natural disasters, and anthropogenic disturbances. This method evaluates the ecological risk effects arising from the deviation between the landscape mosaic and the optimal pattern of the system (Xu et al., 2021). It provides a detailed representation of multiple risks by integrating potential ecological losses with risk probability. Landscape ecological risk assessments have yielded research findings in various regions, including plateaus (Chang et al., 2023), mountainous areas (Cui et al., 2018), wetlands (Chen and Ma, 2023), urban areas (Luo et al., 2018), and nature reserves (Zhang et al., 2023).
Research on landscape ecological risk mostly focuses on the “past” analytical approach, summarizing the spatiotemporal patterns of past risk evolution by analyzing historical data (Hou et al., 2020; Zeng et al., 2022). However, as the complexity of external disturbances increases, the uncertainty of ecological risks also intensifies. Relying entirely on past data and analytical approaches limits the development of scientifically adaptive management strategies and may also increase the social and economic costs of addressing potential ecological threats. Therefore, it is essential to formulate different development plans tailored to various future development needs. In the construction of multi-scenario simulations, the natural development (ND) scenario, the cropland protection (CP) scenario, and the ecological protection (EP) scenario provide a crucial framework for balancing social development, agricultural production, and environmental security. The ND scenario captures the natural evolution of landscapes based on historical trends, providing a reference for assessing future development outcomes without targeted interventions (Sui et al., 2024). The CP scenario prioritizes stabilizing and expanding cropland reserves, laying the foundation for mitigating agricultural land loss and ensuring sustainable agricultural production. The EP scenario reduces ecosystem degradation caused by human activities, thereby promoting biodiversity and improving ecological environmental quality (Zhu et al., 2022). In conclusion, incorporating the ND, CP, and EP scenarios into past landscape ecological risk analyses can bridge the gap between historical understanding and forward-looking decision-making, providing a more comprehensive perspective for sustainable landscape management.
In the context of mechanisms influencing landscape ecological risks, methods such as least-squares regression (Mann et al., 2021), Pearson correlation coefficient (Tian et al., 2022b), and geographically weighted regression are widely used (Mondal et al., 2021). However, these traditional methods have limitations in addressing collinearity among feature variables, particularly with high correlations between variables. This may lead to overfitting the regression coefficients of the driving factors (Lin et al., 2022b). To address this issue, ridge regression has been introduced as a biased estimation regression method to resolve multicollinearity problems. The model incorporates a regularized 2-norm into the regression process, sacrificing some of the unbiased information inherent in the least-squares method to obtain regression coefficients that approximate the actual conditions more closely (Garcia et al., 2015). Ridge regression has achieved successful research outcomes in medicine and economics (Lohiniva et al., 2022; Yang et al., 2022b). However, its application in landscape ecology has yet to be fully explored. Therefore, applying the model to analyze the mechanisms influencing landscape ecological risk can offer new perspectives and insights, particularly in determining the interactions and mechanisms among complex environmental variables.
Located in the transitional zone between warm temperate and northern subtropical regions, the Huai River Basin has substantial differences in climate, hydrology, soil, and vegetation types between its northern and southern banks (Yan et al., 2011; Tian et al., 2022a). It is an ecologically sensitive area that responds to complex variations in natural conditions. This basin has the highest population density among the seven major river basins in China, with its grain output accounting for one-sixth of the national population (Yang et al., 2022a). However, owing to specific climatic and geographical conditions coupled with intense anthropogenic disturbances, the rapid expansion of urban areas and high-intensity development of land have exacerbated conflicts with sensitive ecosystems. This has strongly impeded the sustainable development of the basin, necessitating an assessment of the adverse effects that disturbance sources pose for regional ecosystem structure and function from a landscape ecological perspective. Therefore, understanding the trends and driving mechanisms of landscape ecological risk evolution in this region can guide ecological and environmental management. This is particularly important for global regions with similarly complex climatic conditions and intense human activity.
Based on land use changes over the last 20 years, this study considered the strategic position of the basin in grain production, with the aim of actively responding to the United Nations’ call to achieve Sustainable Development Goal 15 by 2030. Therefore, three development modes in 2030 were set by the Future Land Use Simulation (FLUS) model: the ND scenario, the CP scenario, and the EP scenario. Subsequently, landscape ecological risk evaluation and ridge regression statistical models were constructed separately. The objectives of this study were to: (1) analyze the land use conversion relationships in the basin from 2000 to 2020 and predict the land use spatial patterns in 2030 under different development scenarios; (2) assess past and future landscape ecological risks and analyze their spatiotemporal variation; and (3) investigate the influencing factors and driving mechanisms of landscape ecological risk.
2 Materials and methods
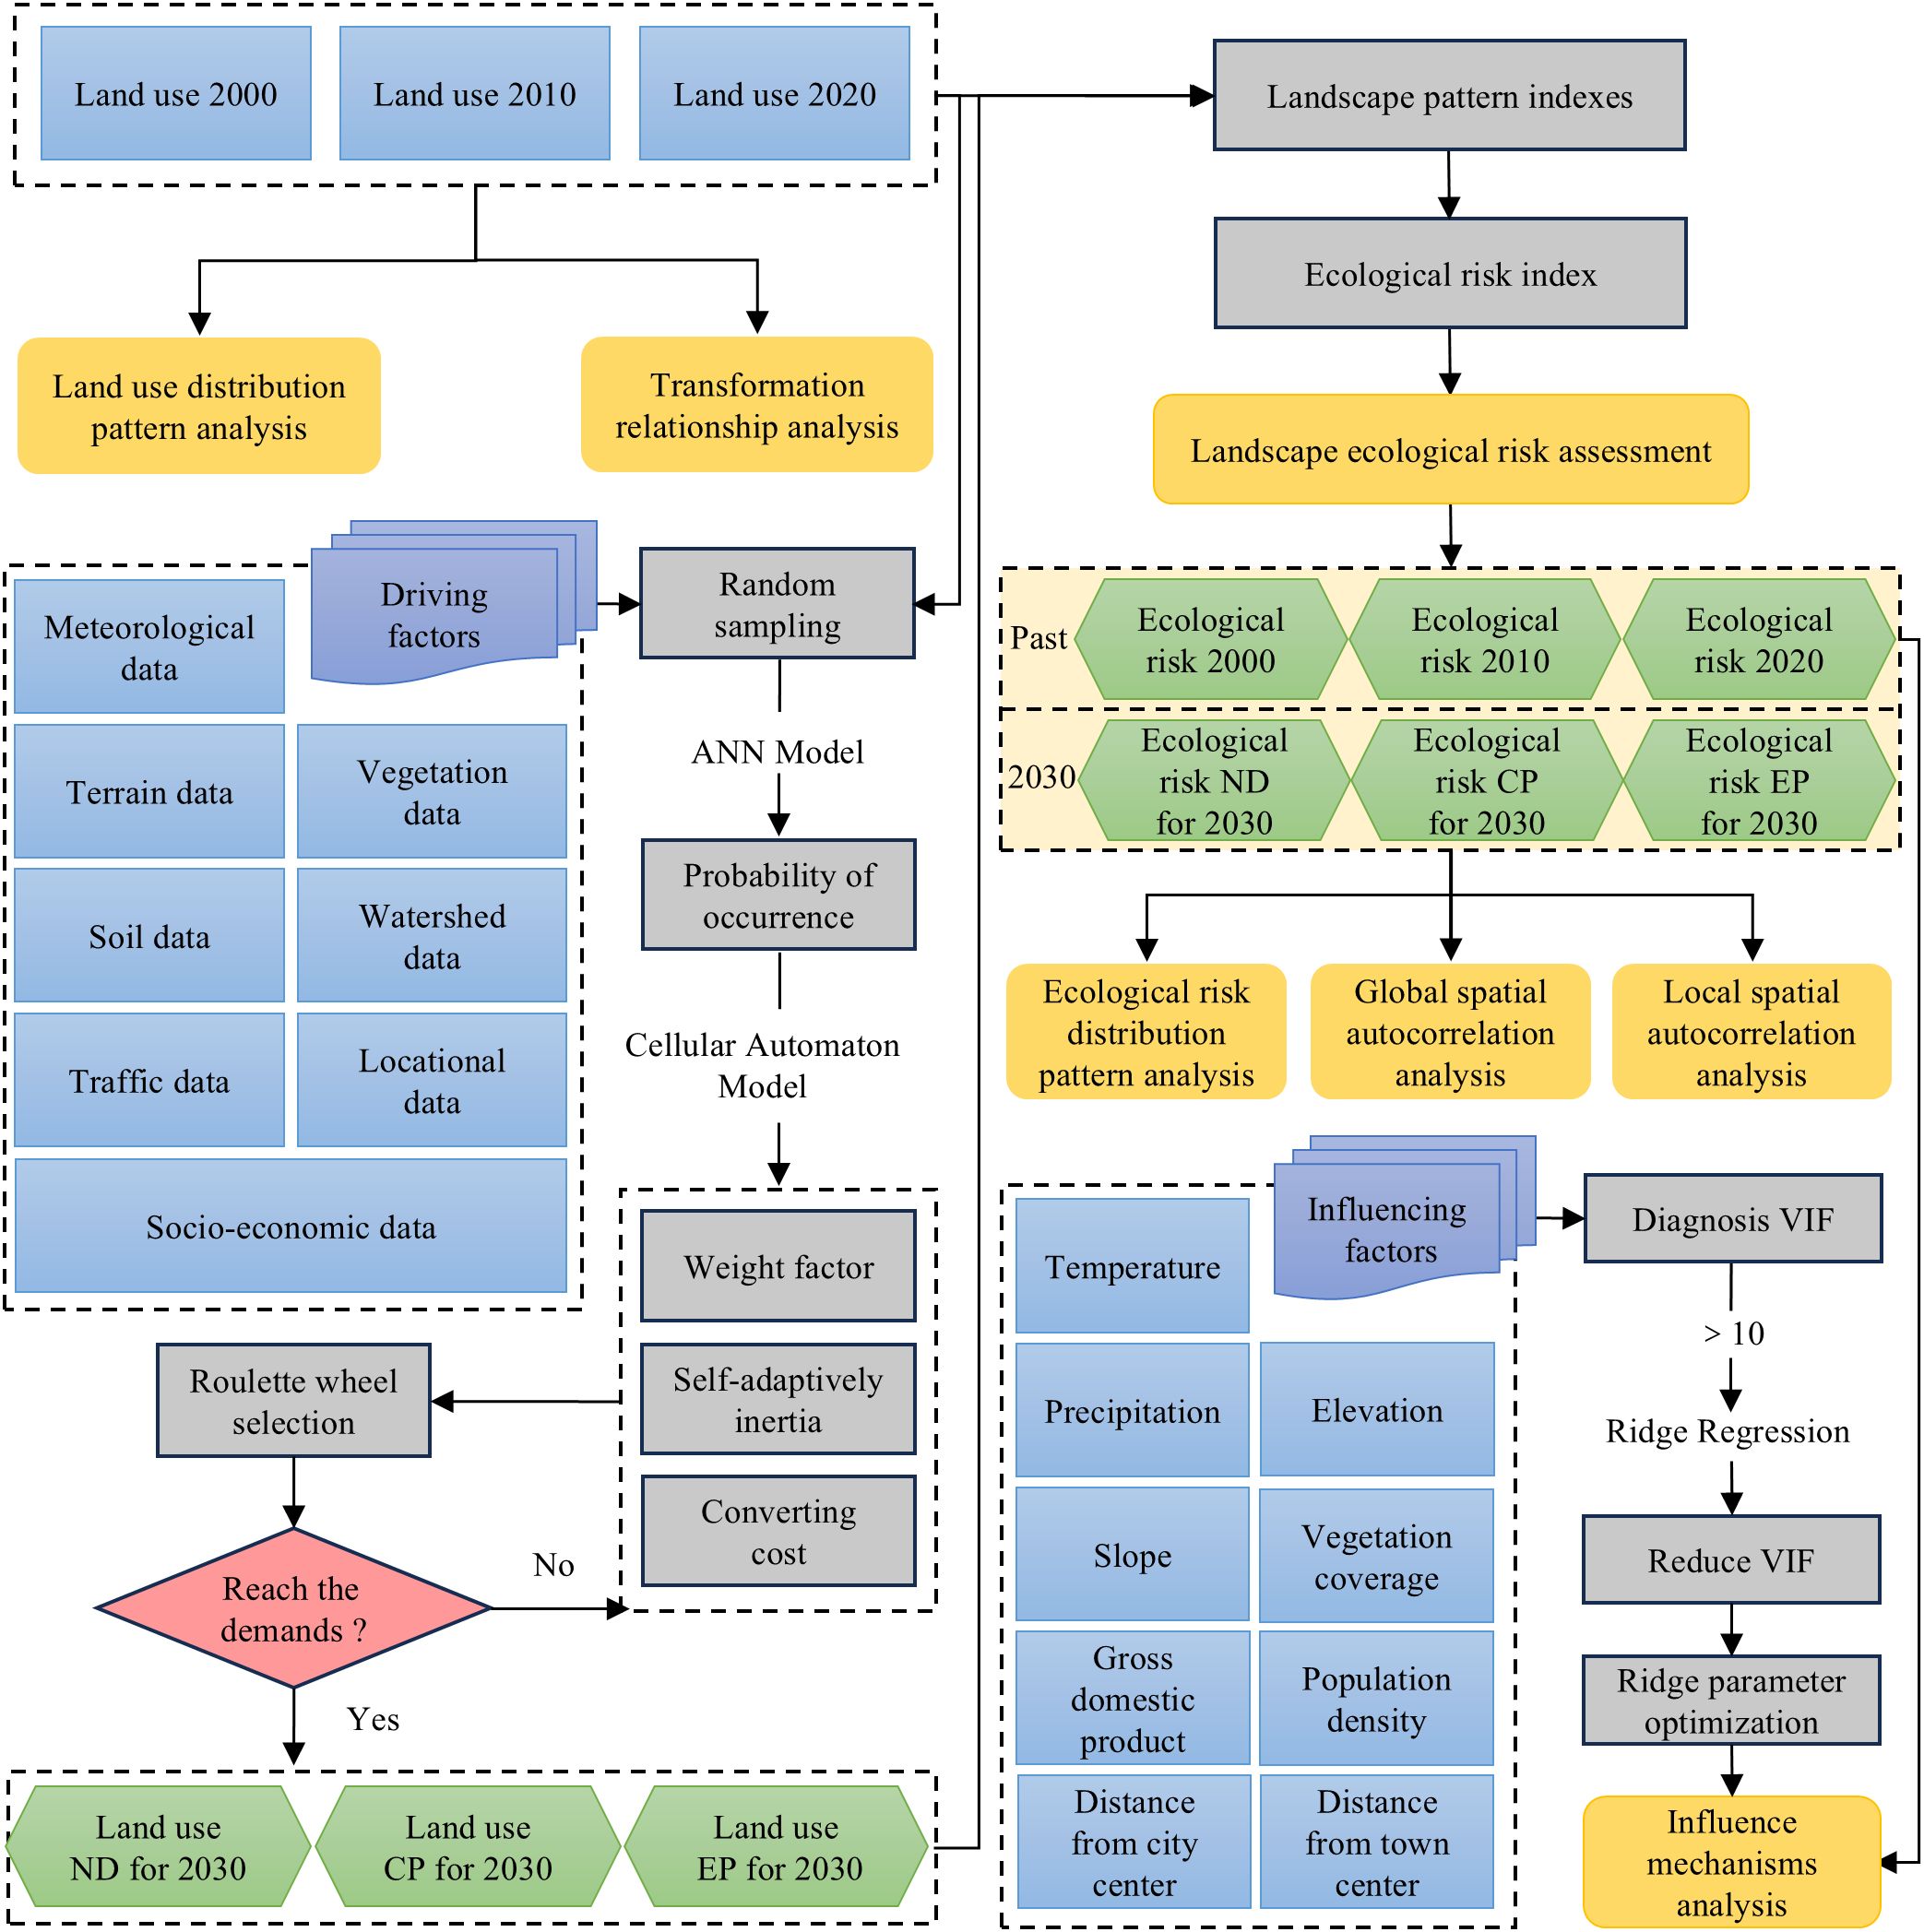
The overarching framework of this study encompassed three key components: multi-scenario land use simulation, landscape ecological risk assessment, and influencing factor analysis (Figure 1). Firstly, the FLUS model was used to forecast the spatial pattern of land use within the basin by 2030 in the ND, CP, and EP scenarios. Secondly, a landscape ecological risk assessment framework was established to evaluate the basin’s ecological risks from 2000 to 2030. This integrated a spatial autocorrelation model to analyze the temporal and spatial dynamics. Finally, the study constructed a ridge regression statistical model to analyze the mechanisms driving risk evolution.
2.1 Study area
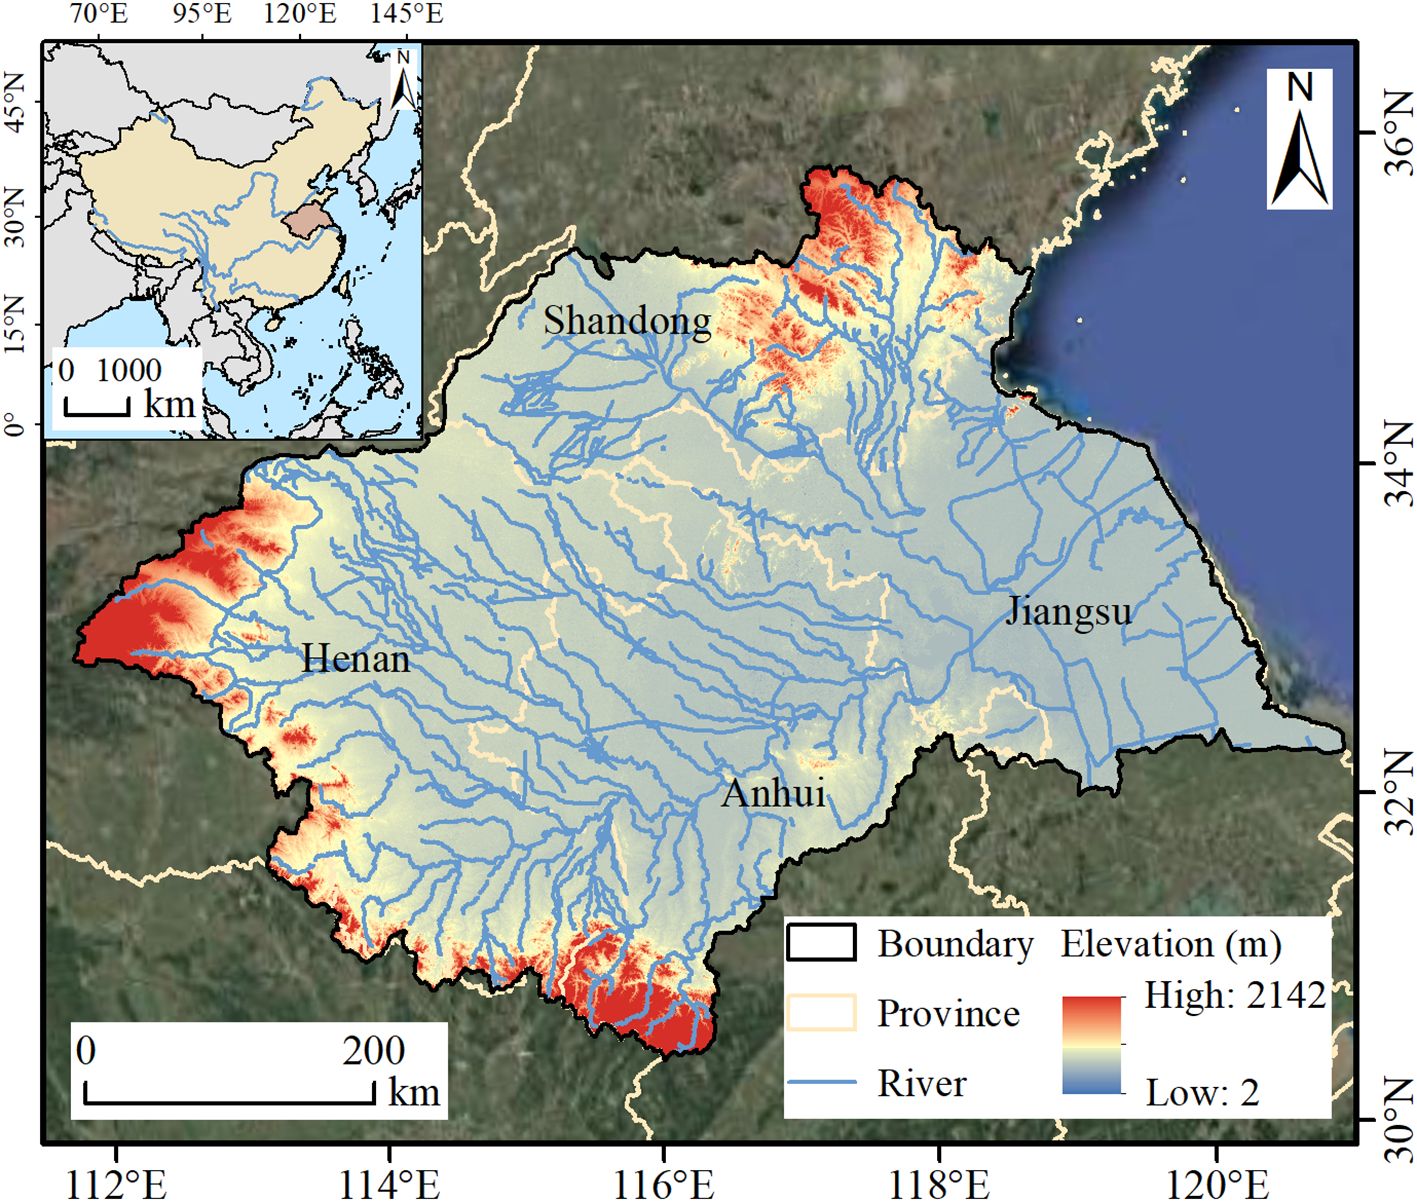
Situated at the transitional zone between the warm temperate and the northern subtropical regions, the Huai River Basin (111°55′E–121°20′E, 30°55′N–36°20′N) encompasses the warm temperate semi-humid area to the north and the subtropical humid area to the south (Figure 2). It is the third largest river in China, covering a total area of approximately 2.7 × 10⁵ km2 (Wang et al., 2023c). The basin has complex and variable climatic conditions, with an annual average temperature ranging from 7.8 to 13.5°C and an average yearly precipitation between 400 and 800 mm (Tian et al., 2022a). The topography within the basin has a high level of heterogeneity, with mountainous and hilly regions predominantly distributed in the western, southwestern, and northeastern sectors. In contrast, the central area is primarily characterized by plains. The basin is a substantial demographic agglomeration in China with a population density of approximately 615 persons/km2. It is the most densely populated of the seven major river basins in China (An et al., 2021). This area is an important grain production hub in China, where two-thirds of the plains are suitable for farming. Grain output from this region constitutes one-sixth of the country’s total grain production (Gao et al., 2019). As a crucial link between the Yangtze River Delta and the Bohai Rim, which are two major economic zones in China, the basin plays a vital role in the country’s agricultural production and economic development. However, owing to its climatic and geographical conditions coupled with intense anthropogenic disturbances, the escalating conflict between high-intensity land exploitation and sensitive ecosystems is intensifying (Wang et al., 2023a). Issues, including soil erosion and vegetation degradation, are becoming increasingly prominent and have strongly impeded the sustainable development of the basin.
2.2 Data sources and preprocessing
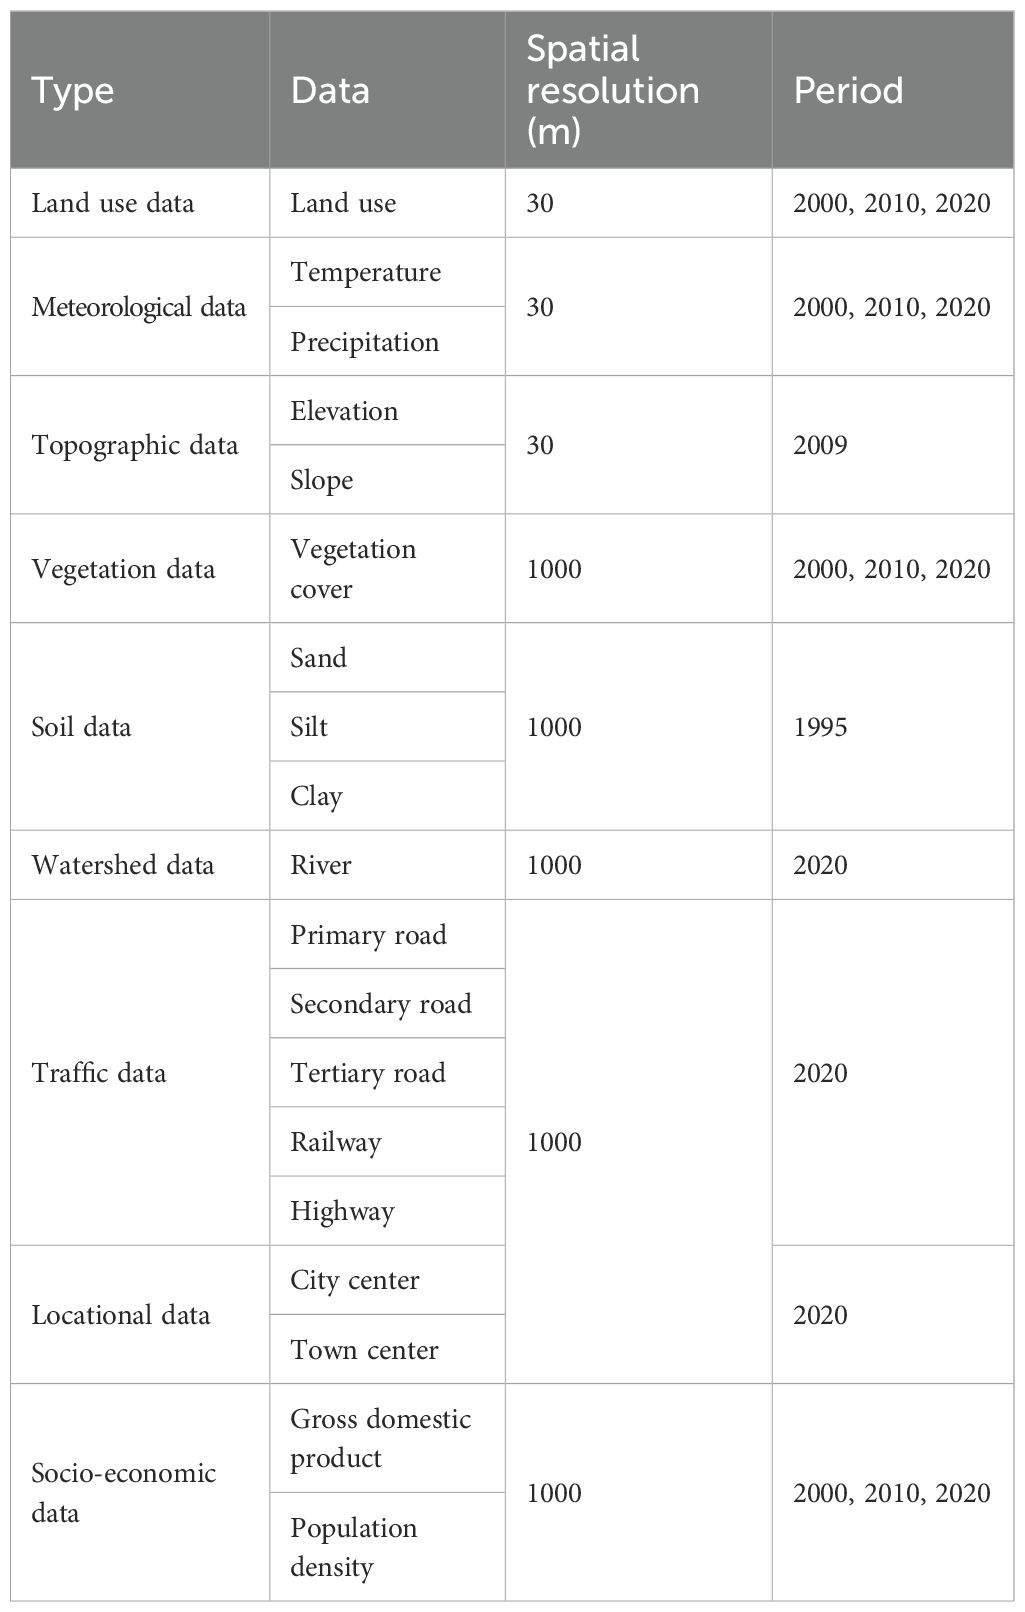
The data sources for this study encompassed land use and driving factors data. The land use data from 2000 to 2020 were from the Resource and Environment Science and Data Center (https://www.resdc.cn/), a 30m resolution thematic database of China’s land use jointly drawn by multiple departments (Zhou et al., 2021). Based on the “GBT21010-2017 Current Land Use Classification” (Bao et al., 2022), the land use types in the study area were reclassified into six categories: cropland, forestland, grassland, water, construction land, and unused land (Figure 3A). The data on driving factors included eight categories: meteorological, topographical, vegetation cover, soil, hydrological, transportation, locational, and socioeconomic data. The meteorological data, including monthly average temperature and precipitation data, were obtained from the National Tibetan Plateau Science Data Center (https://data.tpdc.ac.cn/). The topographical data included elevation and slope. The elevation data was from the Geospatial Data Cloud (http://www.gscloud.cn/), and the slope information was extracted based on the elevation distribution. The vegetation cover (VC) data were monthly-averaged Normalized Difference Vegetation Index (NDVI) data from the MOD13A3 dataset, published by the National Aeronautics and Space Administration (https://www.earthdata.nasa.gov/). The soil data included sand, silt, and clay derived from the Resource and Environment Science and Data Center, the percentage reflected the content of different soil textures (Yang et al., 2007). The water, transportation, and location data were derived from the Open Street Map (https://www.openstreetmap.org/). Euclidean distances were calculated to obtain raster data representing the proximity of each pixel to the nearest river; primary, secondary, and tertiary roads; railways; highways; city centers; and town centers. Socioeconomic data, including the gross domestic product (GDP) and population density (PD), were derived from two sources: GDP data from the Resource and Environment Science and Data Center, and PD data from the Worldpop (https://www.worldpop.org/). Using ArcGIS 10.2, the aforementioned data were resampled to a 1 km resolution, with a matrix size of 882 × 621 pixels, to meet the computational requirements of the FLUS model. Table 1 provided detailed information on the data sources.
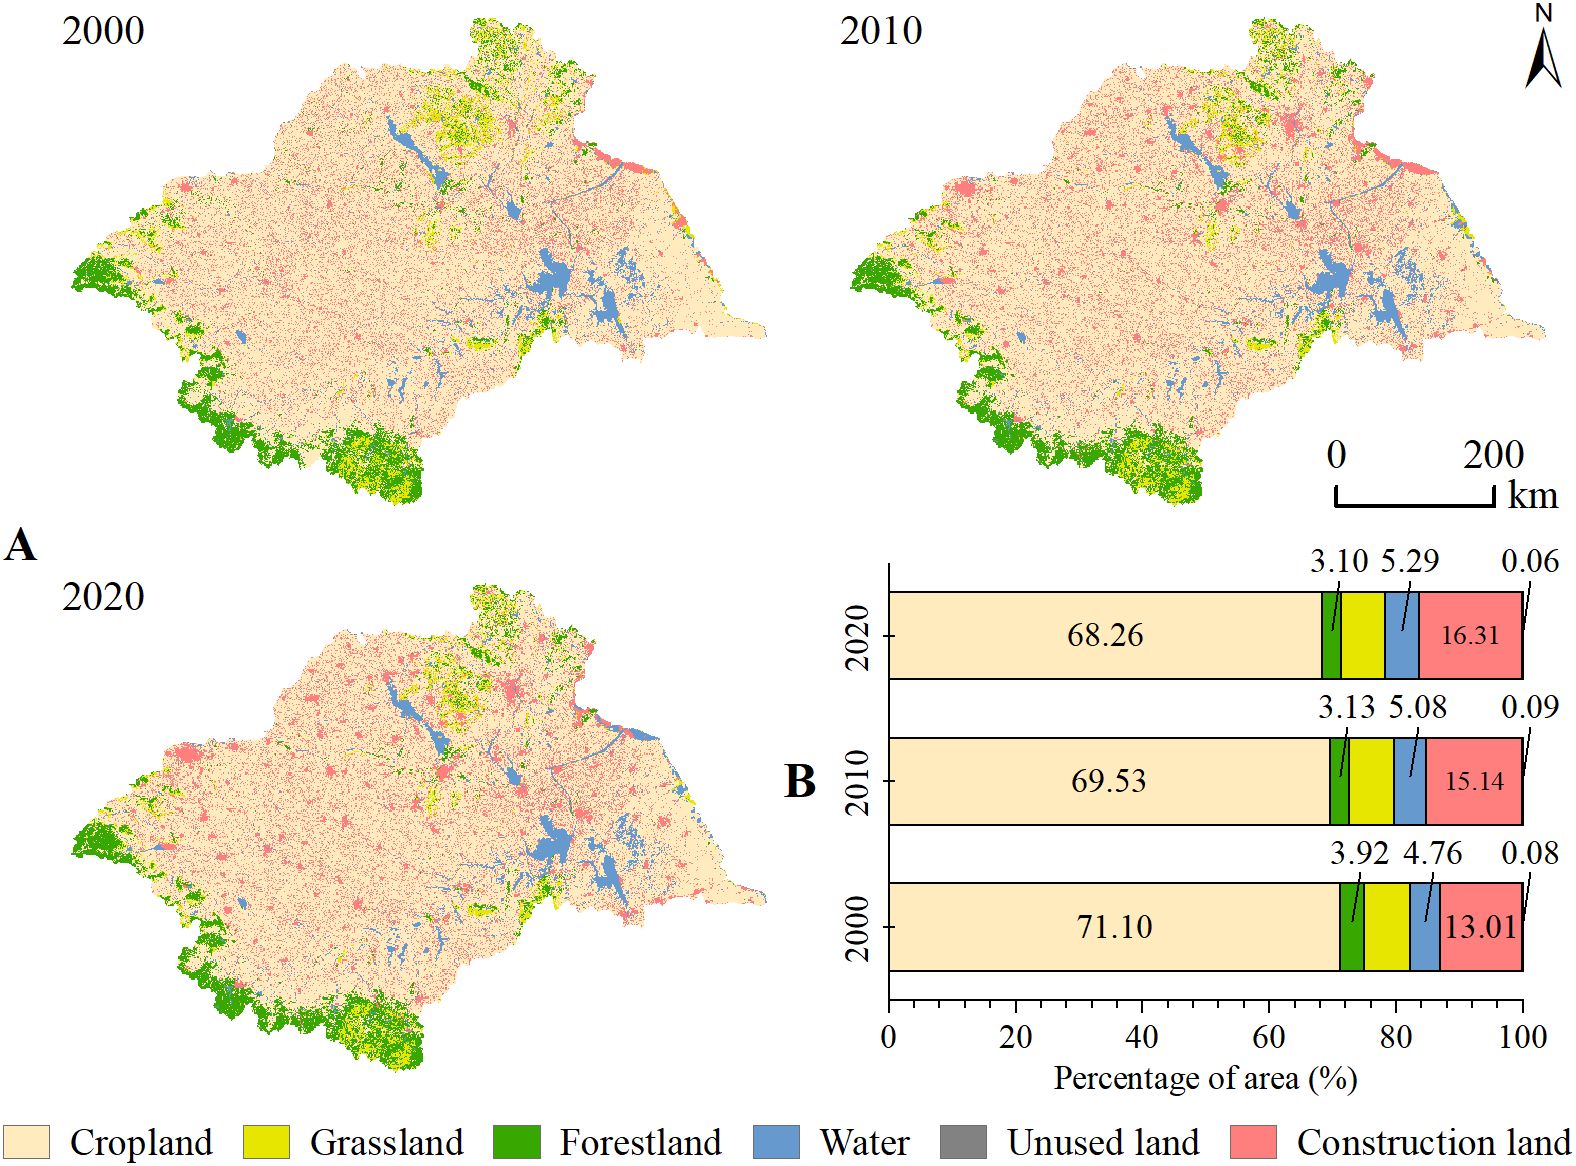
Figure 3. Land use distribution and area statistics of the study area, (A) the land use distribution from 2000 to 2020, and (B) the area statistics for various land use types.
2.3 Research methodology
2.3.1 FLUS model
The FLUS model is a dynamic system for simulating future land use scenarios under the influence of natural and anthropogenic factors. It comprises an Artificial Neural Network (ANN) and Cellular Automaton (CA) with an adaptive inertia competition mechanism (Liang et al., 2018; Lin et al., 2022a). The ANN component is used to calculate the probability of suitability for the transition of each land use type under the influence of the driving factors. Based on these suitability probabilities, CA integrates neighborhood weights, transition costs, and adaptive inertia coefficients to simulate the future spatial distribution of land use (He et al., 2023). The formula used is as follows:
where TPSlk,t is the aggregate probability of grid k being converted into land use type t at time l. The term p(k, t, l) represents the probability of suitability of this transformation. Inertialt is defined as the adaptive inertia coefficient. 1-scc→t is the level of difficulty in land conversion. Ωlk,t indicates the neighborhood weight. S represents the cost of transition and P is the probability of the transition occurring.
This study was based on the FLUS model’s capability to effectively simulate and predict the spatial patterns of complex land use types over long periods, customizing different development scenarios for the basin according to local conditions. The simulation results could provide significant references for predicting land distribution patterns and landscape distribution patterns in areas of intense human activity under similar complex global climate conditions. This study forecasted three developmental scenarios for 2030 by establishing neighborhood factor weights and transition cost matrixes. The ND scenario was based on land use change rates from 2010 to 2020 and was not influenced by policies or environmental constraints. The CP scenario focused on maintaining the total amount of cropland to ensure food security. The EP scenario aimed to enhance areas of forestland and grassland, and promote sustainable environmental development. The land neighborhood factor weights and transfer cost matrix parameters were presented in Table 2.
2.3.2 Landscape ecological risk assessment model
The ecological risk index (ERI) is a crucial indicator for gauging the potential adverse impacts on ecosystem function and structure from internal risk sources and complex external disturbances (Qu et al., 2022). It is formulated by integrating the landscape disturbance index (Si), landscape vulnerability index (Fi), landscape loss index (Ri), and area ratios of different land use types (Cheng et al., 2023). The specific formula for calculating the ERI is as follows:
where Ahi refers to the area of landscape type i within assessment unit h. Ah denotes the total area of assessment unit h. Based on prior studies, this research posited that unused land had the highest vulnerability, assigned a value of 6. This was followed in descending order by vulnerability to water 5, cropland 4, forestland 3, grassland 2, and construction land 1 (Zhang et al., 2023). A normalization method was used to derive the corresponding vulnerability indices. Coefficients a, b, and c represent the weights for landscape fragmentation (Ci), landscape separation (Ni), and landscape dominance (Di), respectively, with the requirement that a + b + c = 1. Based on the literature recommendations, the values were proposed as a = 0.5, b = 0.3, and c = 0.2 (Wang et al., 2023d).
Selecting appropriate risk units was a fundamental step in assessing landscape ecological risks. Considering the actual conditions of the basin, a 15 km × 15 km grid was selected, dividing the study area into 1319 evaluation units. The ecological risk values for each pixel center were calculated and subsequently assigned to the corresponding assessment units. The resulting landscape ecological risk values were categorized into five levels using the natural break method: the lowest risk (0< ERI ≤ 0.028), the lower risk (0.028< ERI ≤ 0.036), the middle risk (0.036< ERI ≤ 0.052), the higher risk (0.052< ERI ≤ 0.083), and the highest risk (0.083< ERI ≤ 0.127).
2.3.3 Spatial autocorrelation model
The spatial autocorrelation model comprises Moran’s Index of Spatial Autocorrelation Indicator (Moran’s I) and Local Indicator of Spatial Association (LISA). Moran’s I is applied to evaluate whether the spatial distribution of the overall ERI is dependent on neighbouring locations (Wang et al., 2016). I > 0 indicates a positive spatial correlation, whereas I< 0 indicates a negative spatial correlation. The LISA is used to evaluate the clustering of high and low values of the ERI at specific spatial locations (Li et al., 2023). The formula used is as follows:
where xi and xj represent the ERI at spatial locations i and j. x− denotes the mean value of ERI, and Wij is the spatial weight matrix.
2.3.4 Ridge regression model
Ridge regression is a biased estimation regression model used to analyze data with multicollinearity. It addresses multicollinearity among selected feature variables by incorporating a regularized 2-norm into the multivariate linear regression equation of the least-squares method (Lin et al., 2022b). This model achieves more stable regression results and lower root mean square error, albeit at the cost of eliminating unbiased information. The formula used is as follows:
where β(n) is the standardized regression coefficient for the driving factor n. XTX denotes the coefficient matrix, with k representing the ridge parameter and I being the identity matrix. Y is the vector matrix for ERI, and Cn indicates the relative contribution rate of driving factor n.
This study employed the ridge regression model to avoid the overfitting issues that arise in ordinary linear regression due to complex interactions among influencing factors. This study considered the basin’s unique natural geographical location and social development conditions. Among the natural factors, temperature (T), precipitation (P), elevation (E), slope (S), and vegetation cover (VC) were selected; among the social factors, population density (PD) and gross domestic product (GDP) were chosen; and among the locational factors, distance from city center (DfCC) and distance from town center (DfTC) were included, making a total of nine driving factors. These were used to explore the mechanisms influencing landscape ecological risk in the basin over the past 20 years. Consistent with the risk units, the above driving data were spatially balanced sampled at 15 km intervals, dividing the basin into 1319 sample units. When there were high correlations among driving factors, ordinary linear regression could lead to overfitting of regression coefficients. It was necessary to diagnose the collinearity of the influencing factors before constructing the regression model.
3 Results
3.1 Land use changes and multi-scenario prediction
3.1.1 Land use changes
The area proportion statistics for different periods in the study area showed that cropland remained the primary land use type, accounting for more than 68% of the total area (Figure 3B). The second largest category was construction land, which exceeded 13%. Unused land comprised the smallest proportion at less than 0.1%. From 2000 to 2010, the basin experienced significant changes in land use types. Cropland, forestland, and grassland areas decreased, whereas construction land, water, and unused land areas increased. From 2010 to 2020, decreasing trends were observed for cropland, forestland, grassland, and unused land. Among these, the most significant reduction was in cropland, which decreased by 3423 km2. In contrast, the areas of construction land and water expanded by 3139 km2 and 549 km2, respectively. Over the last two decades, significant changes in land use within the basin had mainly focused on cropland and construction land areas. Cropland area consistently decreased, with a cumulative proportion of 2.84%, whereas construction land continuously expanded, increasing its share by 3.30%.
To analyze the interconversion relationships between different land use types, this study built a land use transition matrix for 2000–2020 and the results had been presented in Figure 4. From 2000 to 2010, significant land use changes occurred mainly between cropland, construction land, and grassland. The largest transition occurred from cropland to construction land, reaching 9326 km2, while 1812 km2 of grassland was converted to cropland. This indicated that there was a period of rapid urbanization and encroachment of large tracts of grassland into cropland. From 2010 to 2020, land use transitions occurred primarily between cropland and construction land. Compared to the previous ten years, the area of arable land converted to construction land had decreased to 4476 km2. Meanwhile, some cropland had begun to convert to grassland, with an area of 148 km2. This change suggested a deceleration in urbanization and effective implementation of policies promoting the restoration of cropland to grassland.
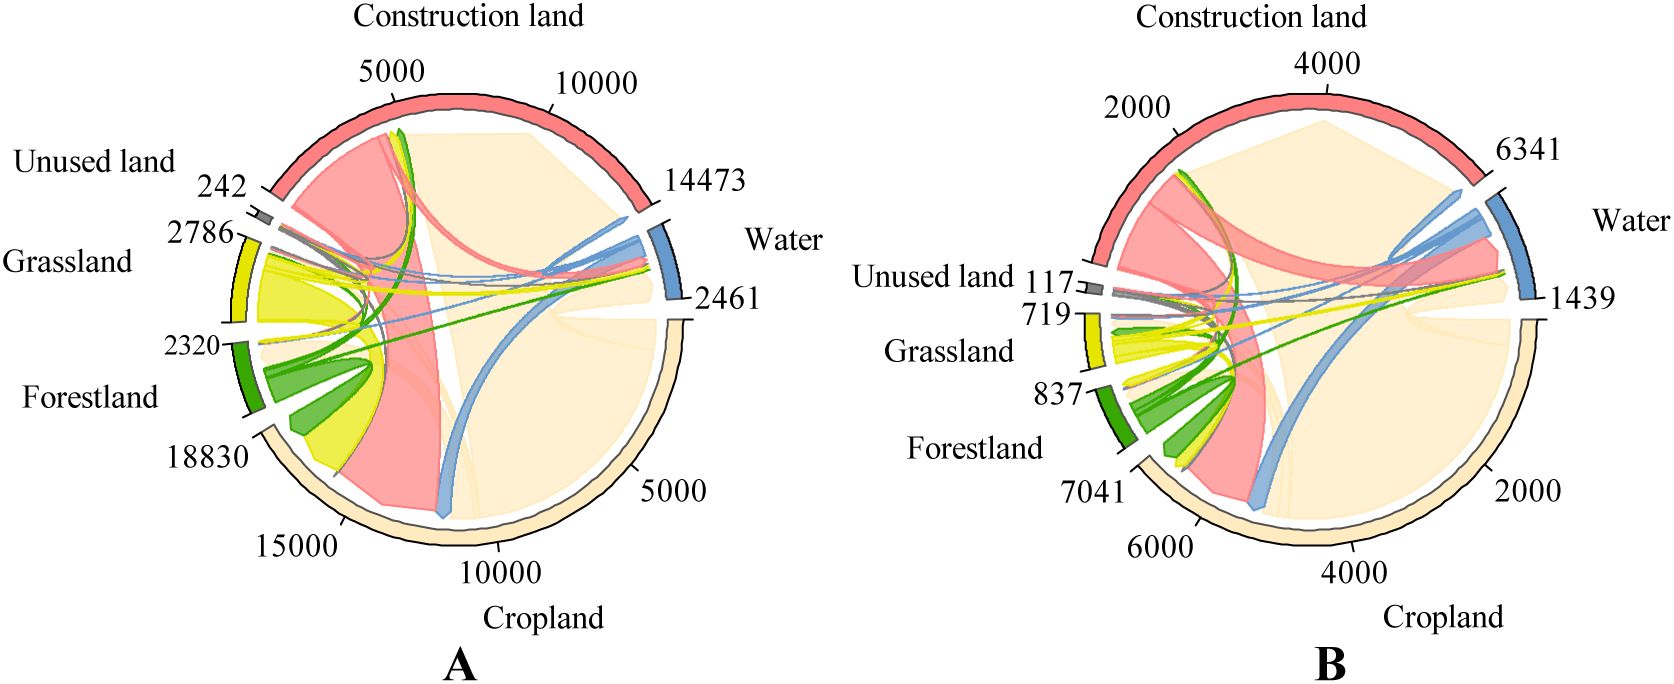
Figure 4. Chord diagram of land use type conversion from 2000 to 2020, (A) from 2000 to 2010, and (B) from 2010 to 2020.
3.1.2 Multi-scenario land use projection
Based on land use data from the basin for 2000 and 2010, this study simulated the 2020 land use spatial pattern in the ND scenario using the GeoSOS-FLUS software (Figure 5A). Comparing the simulation results with the actual conditions of 2020 showed that the Overall Accuracy (OA) was 0.92, the kappa coefficient was 0.91, and the Figure of Merit (FOM) was 0.30%. These results had demonstrated the high reliability of the FLUS model predictions, indicating its capability to accurately forecast the land use spatial patterns of the basin for the year 2030. To visually compare the differences between the three development scenarios for 2030, this study focused on three areas in the east, west, and south of the basin and examined them using a 100 km × 100 km grid (Figures 5B–E). Combining the area statistics of the three regions under different scenarios (Supplementary Table S1), compared to the actual 2020 land distribution, construction land in all three regions was expected to expand in the ND scenario for 2030. The most significant expansion was in Region 1, where construction land was projected to increase by 177 km², with patches becoming more spatially aggregated. Construction land in Regions 2 and 3 was expected to expand slightly, with areas increasing by more than 10 km2, respectively. In the CP scenario, cropland expansion was observed in all three regions, with a significant increase of 305 km2 in Region 3 and 167 km2 in Region 2. Compared to the ND scenario, the extensive cropland loss in Region 1 was mitigated, with an 8 km2 increase in cropland area from 2020 to 2030. In the EP scenario, forestland and grassland in all three regions experienced varying degrees of restoration. Grassland restoration was the most significant in Region 3, with an increase of 81 km2, while forestland restoration was the most pronounced in Region 2, with an increase of 11 km2. In Region 1, forestland and grassland areas were scarce, showing minimal change.
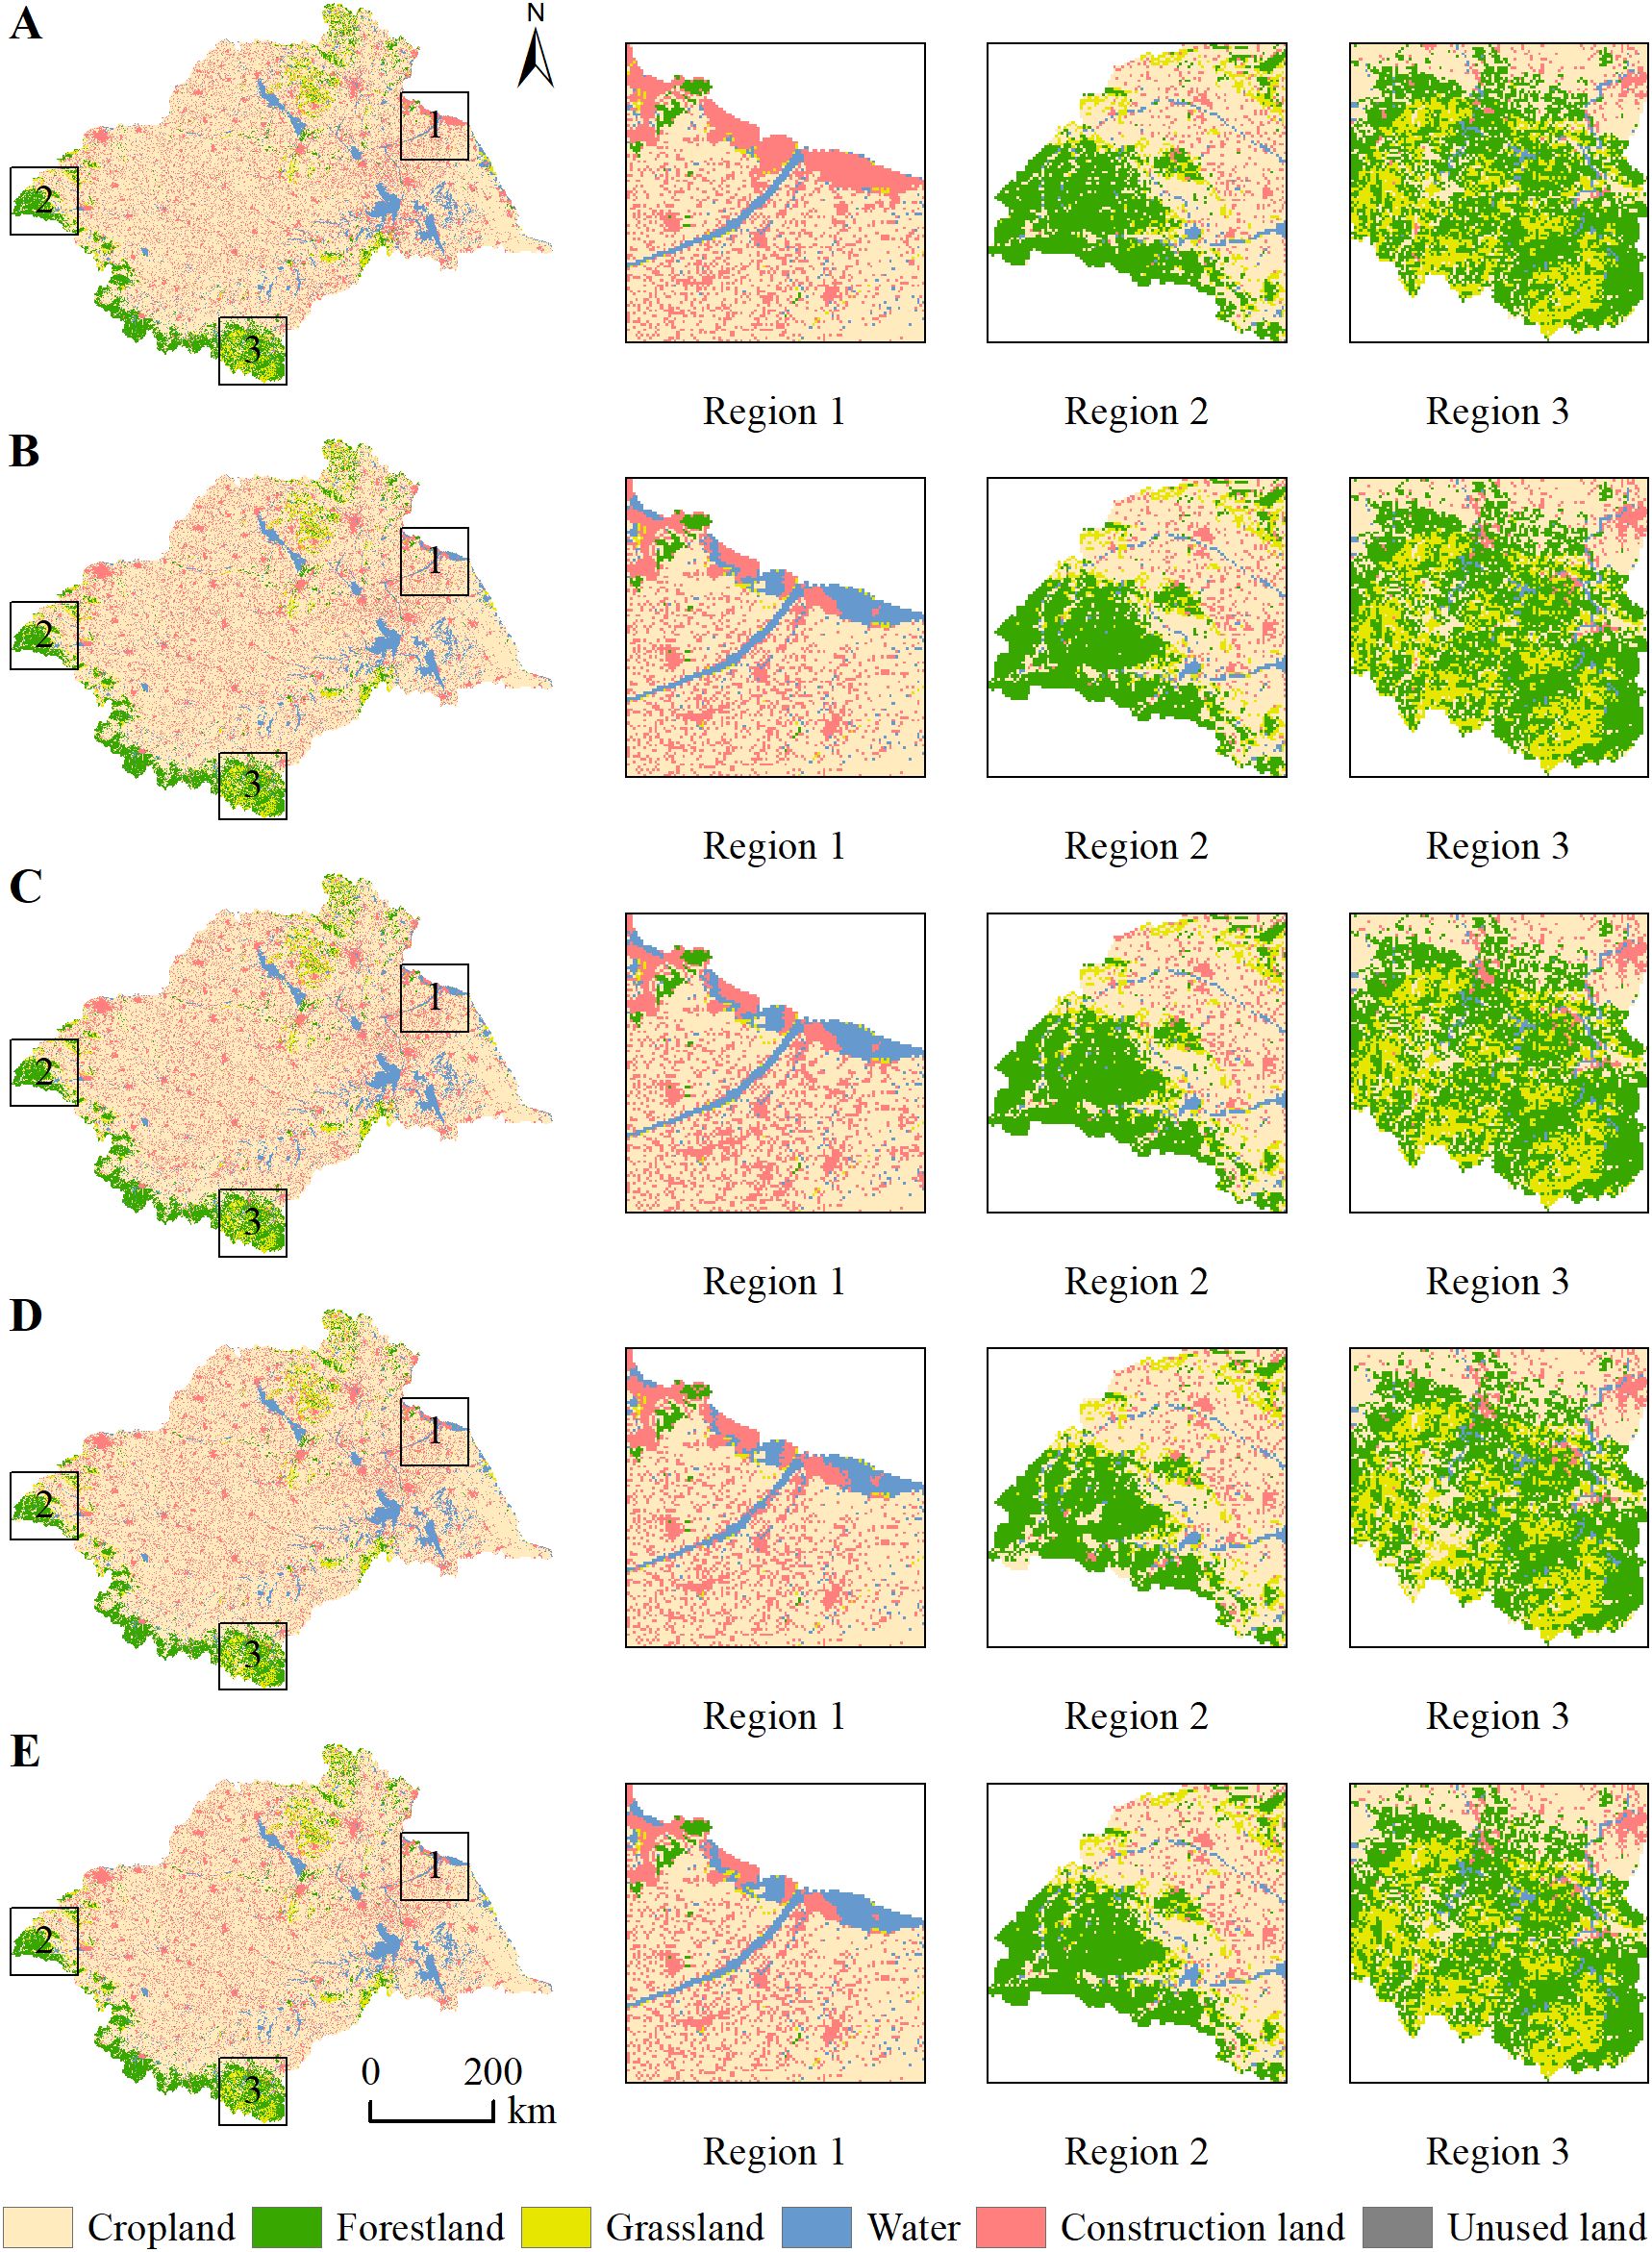
Figure 5. Detailed localized land use maps under different states, (A) the ND for 2020, (B) the actual 2020, (C) the ND for 2030, (D) the CP for 2030, and (E) the EP for 2030.
The area statistics for the different land use types for 2030 in the three development scenarios were shown in Table 3. Compared to 2020, the pattern of land distribution under the three development scenarios would be significantly different in 2030. In the ND scenario, the trend in land use area changes remained consistent with the period from 2010 to 2020. Cropland, forestland, grassland, and unused land areas were projected to decrease further, with the largest reduction in cropland estimated at 3252 km2. Construction land and water areas were expected to expand by 3206 km2 and 261 km2, respectively. In the CP scenario, cropland was expected to recover significantly, with an increase of 1237 km2. The expansion of construction land was projected to continue, albeit at a reduced rate, with an increase of 1321 km2. Forestland, grassland, water, and unused land showed a decreasing trend. Forestland had the most significant reduction, estimated at 1830 km2. In the EP scenario, the return of cropland to forestland and grassland began to bear fruit, and the areas of forestland and grassland would increase by 432 km2 and 287 km2, respectively. The expansion of construction land was expected to curb effectively, and the efficiency of the development of unused land would be further improved.
3.2 Landscape ecological risk changes
3.2.1 Changes of landscape ecological risk distribution
The spatial variation in the ecological risk across the basin landscape was significant, with a distribution pattern that was higher in the east and lower in the west (Figure 6A). The highest and higher risk zones were concentrated in the northern cities of Jining and Zaozhuang, and the eastern cities of Huai’an and Yangzhou. Highly vulnerable unused land and water were mainly distributed here, with low resistance to external disturbances. The medium risk zones were concentrated in the northern city of Linyi, the eastern city of Chuzhou, and the southern city of Lu’an. Conversely, the lowest and lowest risk zones were distributed in the central and western regions of the basin. This study had statistically analyzed the risk areas for various periods (Figure 6B), and the results showed that the overall risk in the basin was relatively low, with the lowest risk accounting for more than 43% of the total area. This was followed by the lower risk at approximately 28%. The area with the highest risk had the lowest, accounting for less than 2%. Over the past 20 years, the risk had shown a trend of first increasing and then decreasing. From 2000 to 2010, there were significant changes in medium, higher, and highest-risk zones. The areas increased by 3403.38 km2, 2470.32 km2, and 1383.68 km2, respectively, with the average risk value increasing by 0.0021. From 2010 to 2020, the lowest risk zones in the western regions saw significant recovery, with an increase of 13131.52 km2, and the average risk value decreased by 0.0007. From 2020 to 2030, landscape ecological risk would decrease to varying degrees under different development scenarios. In the ND scenario, the lowest and medium risk areas were expected to increase 3828.63 km2 and 2508.12 km2, respectively, and the average risk value would continue to decline by 0.0005. In the CP scenario, more of the highest and higher risk zones in the north were converted to medium risk, resulting in an increase of 4670.08 km2 in medium risk zones. This indicated that the CP scenario could effectively reduce ecological risks in the basin. In the EP scenario, the lowest risk area in the center would increase by 20129.50 km2, with the average risk value reaching 0.0289. This suggested that the implementation of policies such as returning cropland to forestland and grassland, enhancing the transformation efficiency of unused land, and curbing the expansion of construction land was beneficial for maintaining the ecological stability of the basin.
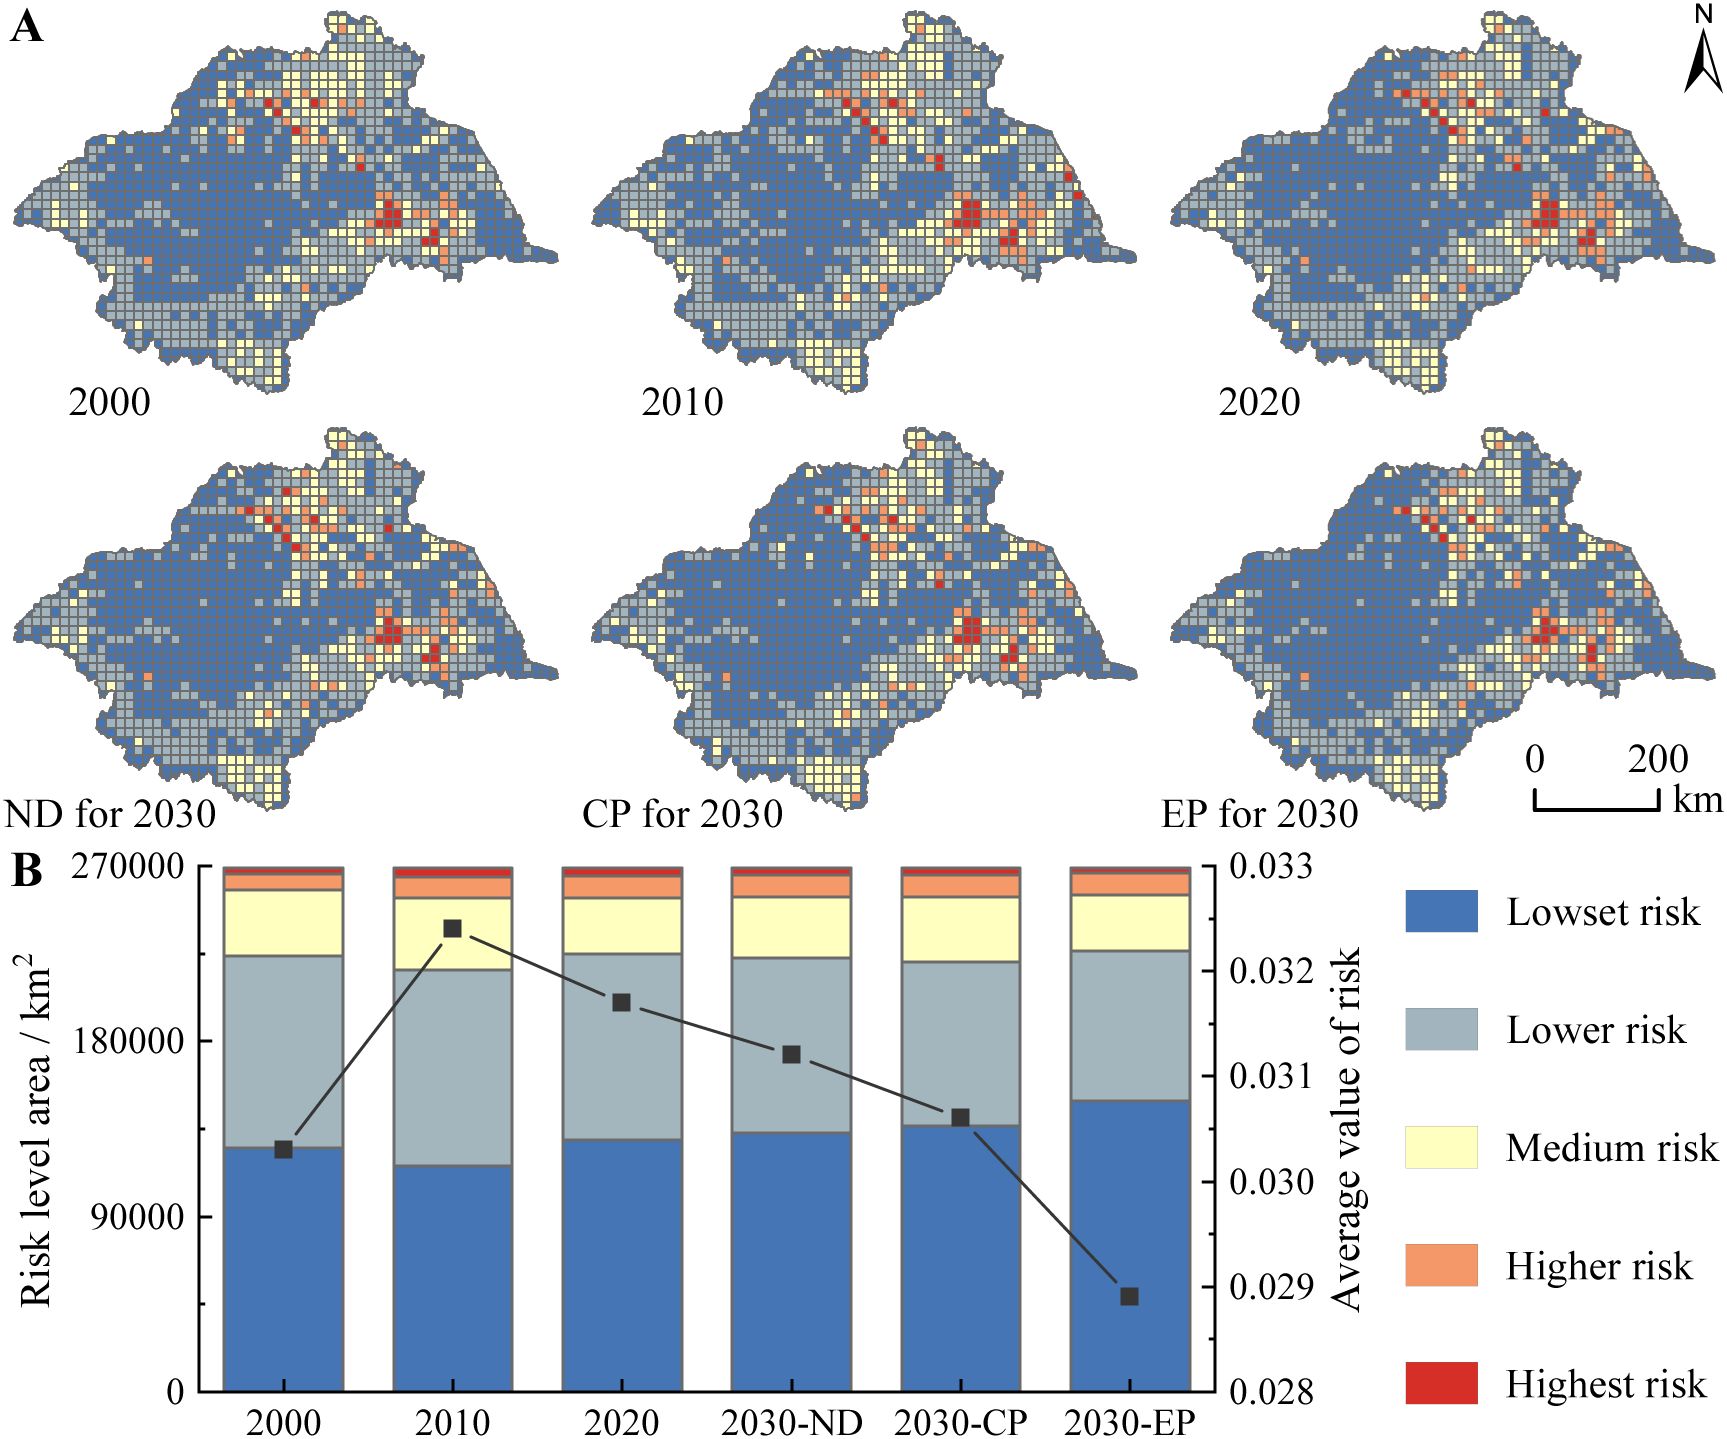
Figure 6. Distribution map of landscape ecological risk levels from 2000 to 2030, (A) risk distribution, and (B) area statistics.
3.2.2 Spatial autocorrelation of landscape ecological risk
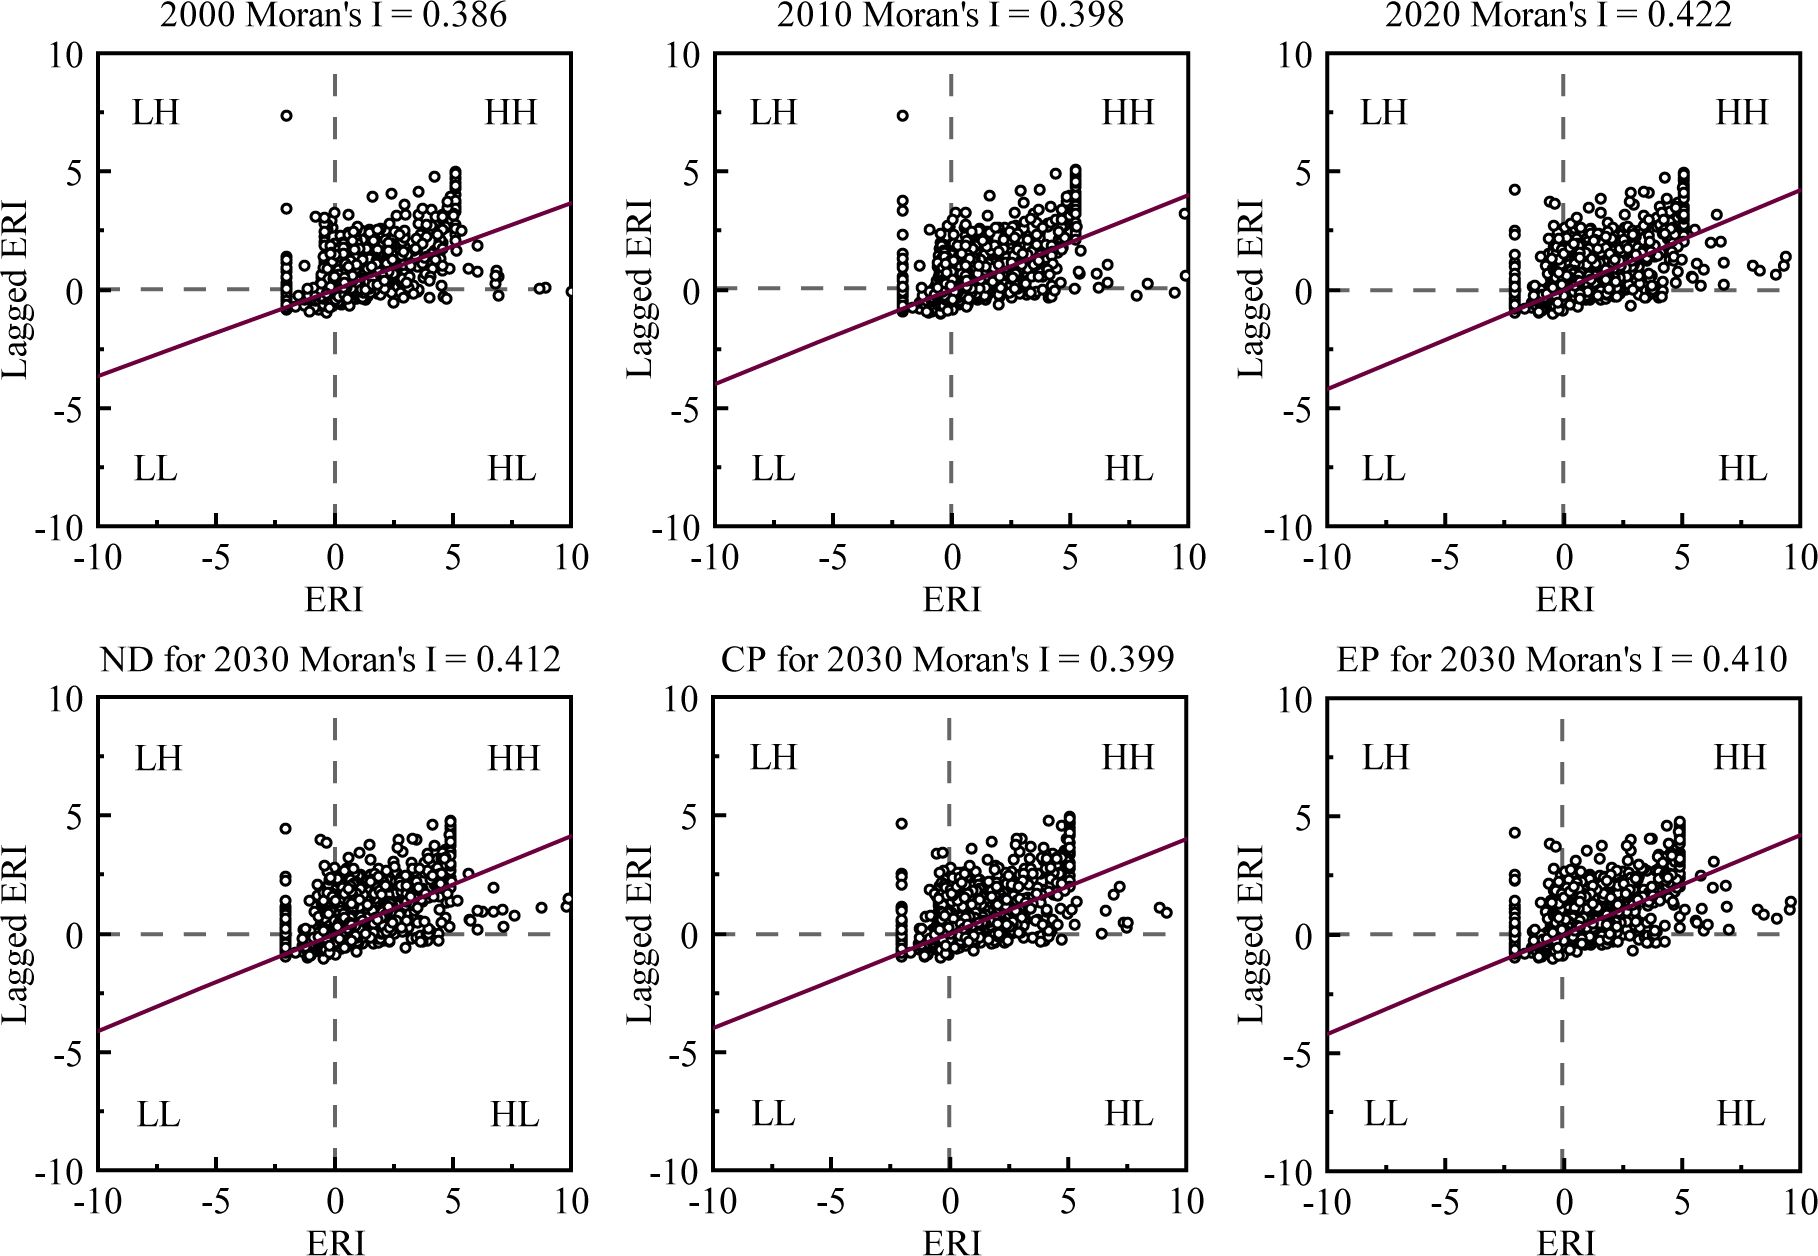
To test whether spatial autocorrelation exists in the risk distribution, this study calculated Moran’s I for each period based on the GeoDa platform through 999 permutations (p = 0.001). The global Moran’s I for landscape ecological risk in each period was above 0.38 (Figure 7), which indicated a strong positive spatial correlation in the distribution of ecological risk. The clustering of scatter points near the regression line suggested a significant spatially clustered distribution of landscape ecological risk. From 2000 to 2020, Moran’s I cumulatively increased by 0.036, indicating that spatial locations had increasingly influenced the distribution of ecological risks in the basin. From 2020 to 2030, the Moran’s I will decline, and the Moran’s I for the CP and EP scenarios will be significantly lower than that of the ND scenario.
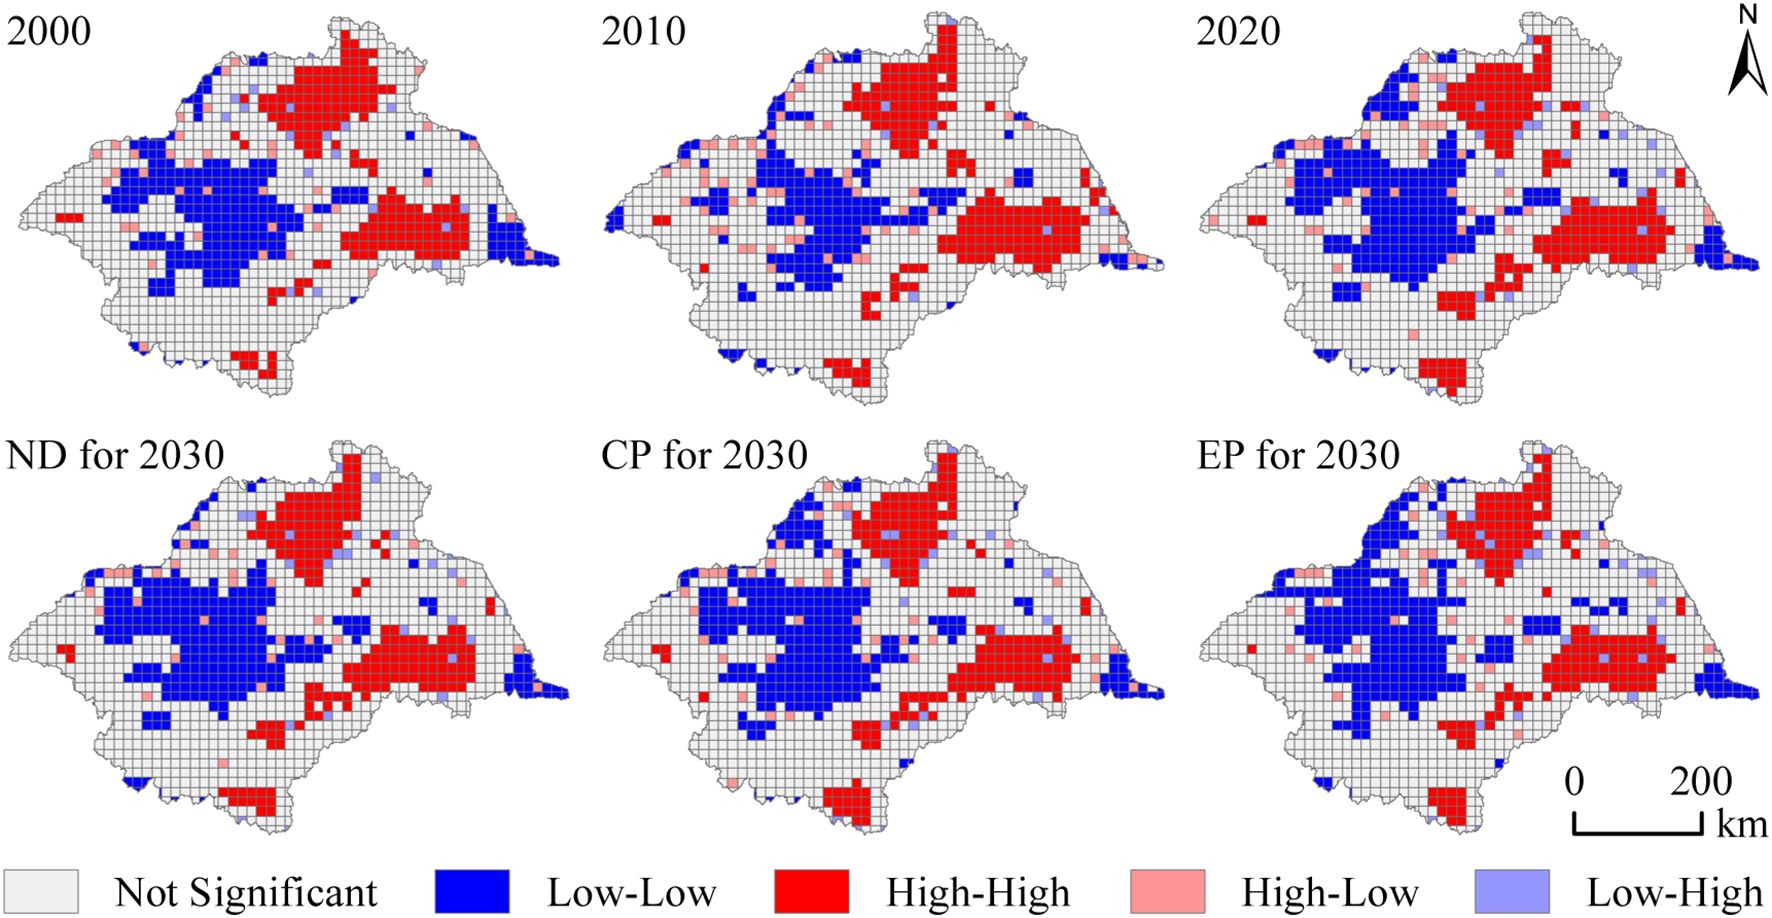
This study calculated LISA for various periods to further ascertain the spatial clustering of landscape ecological risk (Figure 8). Excluding non-significant units, “Low-Low” regions dominated, accounting for about 20 percent of the total area, mainly distributed in high-altitude areas in the western regions such as Zhoukou. The landscape types were mainly forestland and grassland, with high internal connectivity, spatially clustered, and not easily subject to change. From 2000 to 2030, the area of “Low-Low” regions showed a trend of first decreasing and then increasing. It was highly consistent with the spatiotemporal changes of the lowest risk regions during this period, with changes concentrated in adjacent not significant units. In the EP scenario, the “Low-Low” area would reach its highest, accounting for 22.09% of the total area. “High-High” regions accounted for about 15%, influenced by the distribution of the highest, higher, and medium risks, primarily clustered in the eastern and northern regions such as Linyi and Yangzhou. The landscape types were complex and diverse, including highly vulnerable unused land and water, which were affected by human disturbances and had a high degree of local fragmentation. In 2010, the area of “High-High” regions was the largest, reaching 45100.19 km2. After 2020, the area decreased, making it a key area for soil erosion prevention and control in the basin.
3.3 Impact mechanisms of landscape ecological risk
The collinearity diagnostic results of the driving factors showed that the variance inflation factors (VIF) for E, S, PD, and GDP exceeded 10 (Supplementary Figure S1), indicating severe multicollinearity among the driving factors. Therefore, this study used the ridge regression model, sacrificing a portion of the unbiased information to achieve regression results that were more aligned with practical scenarios. The ridge trace plot indicated that the ridge traces of the driving factors tended to stabilize when the ridge parameter K was between 0.38 and 0.52 (Supplemetary Figure S2). After examining the VIF values within this interval, it was inferred that there was minimal collinearity among the independent variables when the VIF was less than 5. Consequently, 0.45 was established as the optimal K value. The VIF diagnostic results following ridge regression indicated a significant reduction in multicollinearity among the influencing factors. The coefficients of determination (R2) for the three phases were 0.74, 0.67, and 0.82, respectively. This demonstrated that the selected natural, social, and locational factors effectively explained the evolutionary changes in landscape ecological risk.
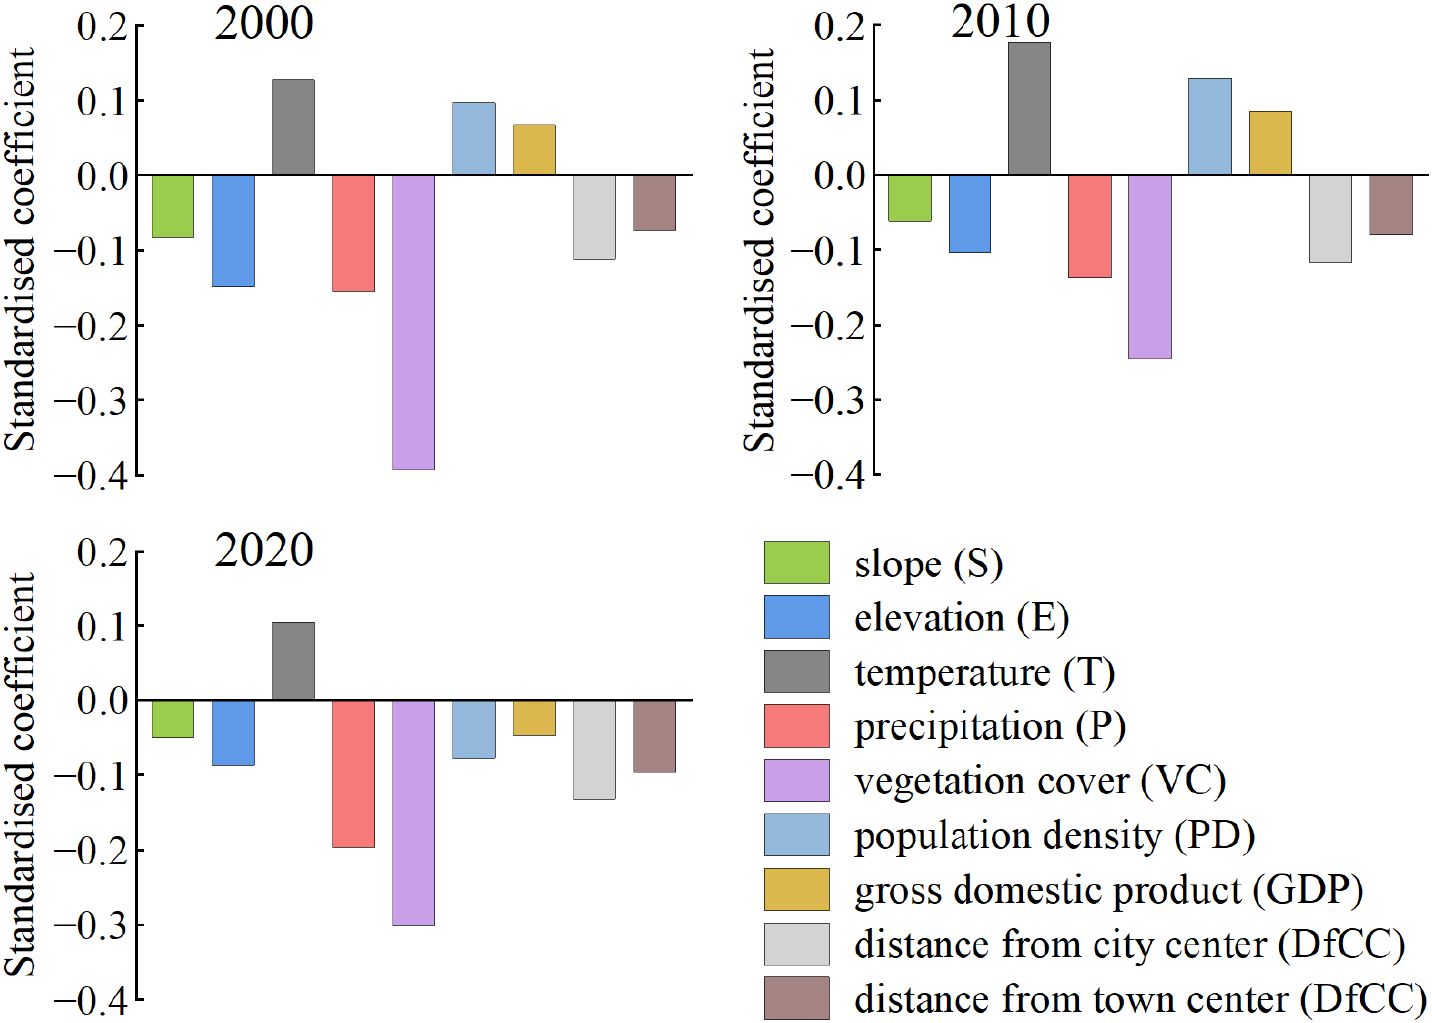
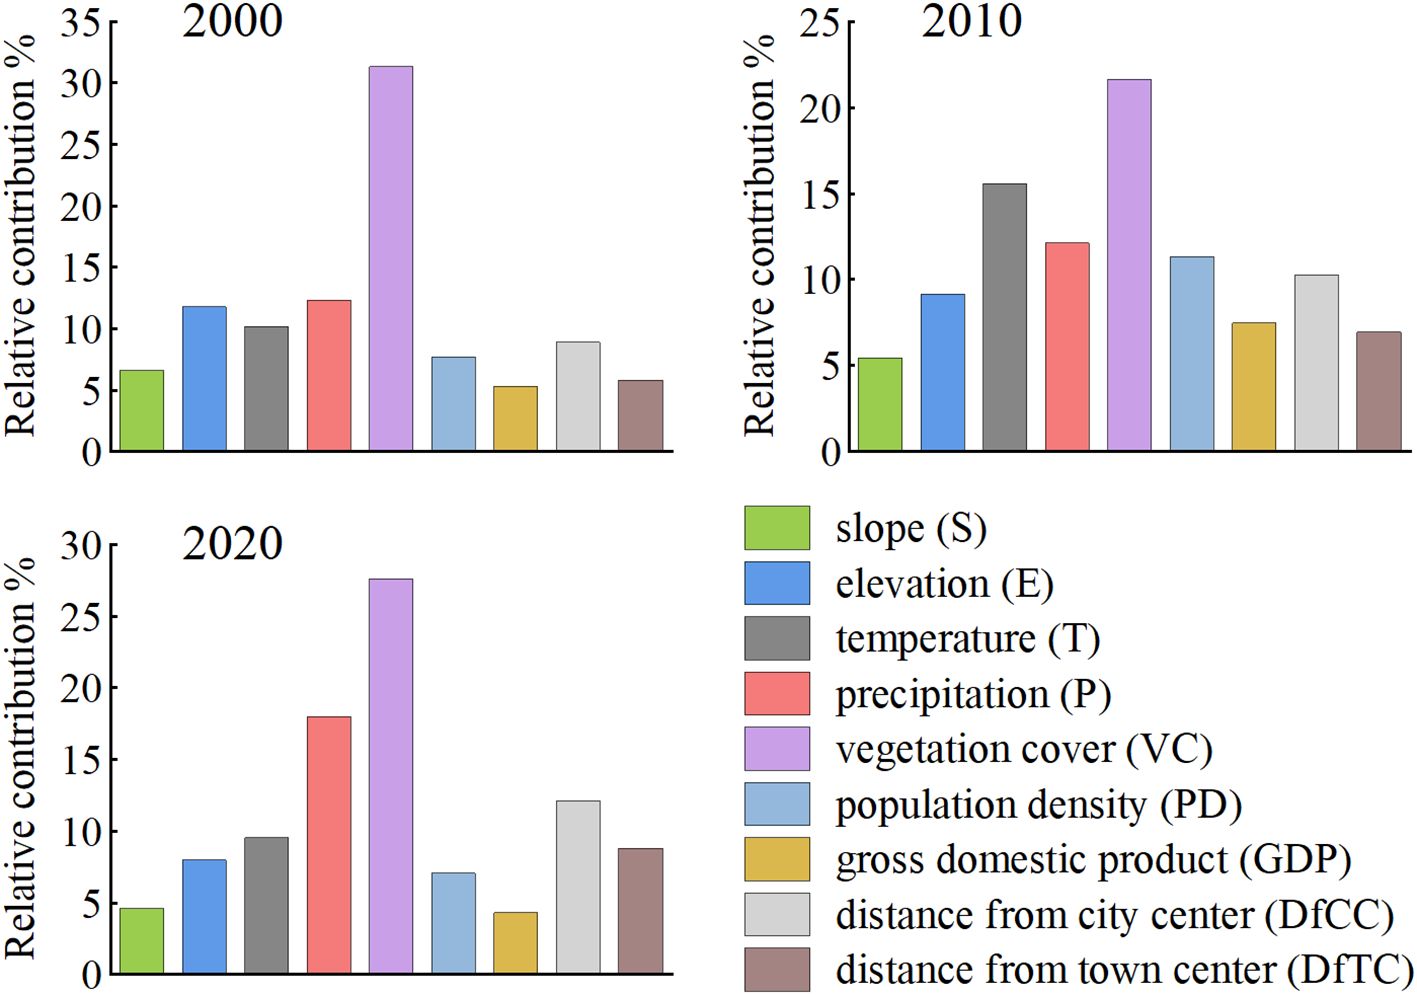
Over the last two decades, the standardized regression coefficients for P, E, S, VC, DfCC, and DfTC were less than 0 (Figure 9), indicating a negative correlation. It suggested that an increase in these factors contributed to reducing the landscape ecological risk. In 2000 and 2010, the regression coefficients for T, GDP, and PD were greater than 0. It indicated that during the first decade of the study period, an increase in these factors contributed to elevated regional ecological risk. By 2020, the regression coefficients for GDP and PD changed and evolved into a negative correlation. Based on the calculated standard regression coefficients, the relative contribution rates of each driving factor were determined (Figure 10). VC had the most substantial impact on the ecological risk of the basin, with a relative contribution rate exceeding 21% in all three phases. This was followed by P, T, DfCC, E, PD, DfTC, and GDP. The relative contribution of the S was the smallest, at approximately 5%. During 2000–2010, with the rapid development of urbanization, the relative contribution rates of natural factors, such as P, E, S, and VC, decreased. In contrast, the relative contribution rates of social and locational factors increased. From 2010 to 2020, because of the deceleration of urbanization and the conversion of cropland back to forestland and grassland, the relative contributions of P and VC to natural factors improved. The relative contribution rate of social factors decreased, whereas that of locational factors continued to increase.
4 Discussion
4.1 Landscape ecological risk changes
The increasing demand for land resources and the escalating complexity of external disturbances had led to changes in the regional ecological environment. As a typical densely populated area within the transition zone between warm temperate and northern subtropical regions, the basin had shown greater sensitivity to these complex disturbances (Zhu and Cai, 2023). The landscape ecological risk had progressed through two distinct stages. ERI increased from 2000 to 2010. Construction land experienced massive, unorganized expansion, rising by 5755 km2, amounting to a 16.44% growth. The GDP saw an increase of approximately 2.35 × 10⁵ million yuan. The rapid progression of urbanization had led to a heightened conflict between intensive land development and sensitive ecological systems. This had resulted in increased fragmentation of the cropland landscape in the central plains and grassland and forestland landscapes in the northern and southwestern low mountain and hilly areas. The ecological risk decreased from 2010 to 2020. This period was crucial for the construction of an ecological civilization and economic transformation in the basin. Different cities devised development strategies tailored to specific conditions. Cities in the eastern part of the basin, such as Huai’an and Yancheng, had leveraged convenient water transportation to strengthen economic interactions with surrounding regions, such as the Yangtze River Delta and the Wanjiang City Belt (Wu et al., 2021a). In the southwestern part, cities such as Xinyang and Fuyang had focused on transitioning from resource-based cities to accelerating agricultural modernization (Luo et al., 2021). While fostering economic development, these initiatives also propelled the return of croplands to forest and grassland. Consequently, the natural landscape had been restored. The uncontrolled expansion of construction land was restrained, and the expansion rate declined to 7.70%. This resulted in enhanced internal connectivity and stability of the landscape within the basin. This finding was consistent with the previous study (Wang et al., 2022), which argued that with the development of urbanization in the Huai River Basin, landscape fragmentation exhibited a trend of initially rising and then declining around 2015.
Improvement of the ecological environment was closely linked to government macro-regulation. Since the end of 2013, the Chinese government had issued a series of regulatory policies intensifying efforts toward aggregated development, categorized protection, and the comprehensive management of land resources. In 2014, the Ministry of Land and Resources of China issued the Regulations on the Economic and Intensive Use of Land. Subsequently, the State Council released the Overall Plan for Ecological Civilization System Reform in 2015 and the National Land Planning Outline (2016–2030) in 2017 (Sang et al., 2021). These policies had provided a foundation for maintaining regional ecological stability and promoting sustainable development of the ecological environment. The Huai River Ecological Economic Belt Development Plan was promulgated in 2018 (Wang et al., 2023b). This had charted a new development model for promoting strategic management across the entire basin and for future exploration of ecological civilization construction in major river basins. In the landscape ecological risk assessment projected for 2030, the CP scenario presented a lower ecological risk than the NP scenario. This indicated that implementing a cropland preservation strategy could foster the stable development of the basin’s ecosystem. In the EP scenario, forestland, grassland, and water landscapes were restored, and the conversion efficiency of unused land was improved, further reducing the landscape ecological risk. The Moran’s I for the CP and EP scenarios would be significantly lower than that of the ND scenario. The reason could be that with the implementation of different external development plans, the basin’s ecological risks would be increasingly influenced by human interventions such as policies, reducing the constraint of spatial locations on internal risk. Although there were variations in the delineation of risk intervals among research findings, this is a relative range. The distribution of landscape ecological risk within the river basin showed considerable spatial heterogeneity, with a pattern of higher risk in the east and lower risk in the west. This was because of the dominance of highly vulnerable unused land and water in the eastern urban clusters, including lakes such as Hongze, Weishan, and Gaoyou. These areas, characterized by relatively flat terrain, abundant water resources, and high PD, had a lower capacity to resist external disturbances, resulting in heightened local ecological risks.
4.2 Impact factors of landscape ecological risk
This study developed the ridge regression model through the diagnosis and reduction of multicollinearity among feature variables, coupled with optimization of the ridge parameter. The study found that over 20 years, natural factors such as P, E, S, and VC negatively correlated with landscape ecological risk. Among these factors, VC had the greatest relative contribution. The VC was a combined indicator of plant growth and photosynthetic intensity (Martinez and Labib, 2023). A higher value of VC indicated a larger proportion of natural landscapes, such as forestland and grassland, in the region, positively influencing the development of ecological projects. The P and T also exhibited relatively high contribution rates. In contrast to the effects of other natural factors, T was positively correlated with ecological risk. Known as the rain–heat effect, the dual impact of decreased rainfall and increased temperature likely reduced the spatial distribution of forestland and grassland landscapes, resulting in a more vulnerable regional ecosystem (Kayumba et al., 2021). The influences of E and S were relatively modest. In the basin, high-elevation areas are primarily concentrated around Tai’an and Zibo in the north, and Huanggang and Qing’an in the south. These areas were predominantly occupied by low-vulnerability grassland and forestland and were characterized by high internal structural stability and connectivity. This could facilitate stable ecosystem development.
DfCC and DfTC showed negative correlations with the risk. This was attributed to the continuous advancement of urbanization, leading to substantial population migration to cities and towns (Yang et al., 2022a). Consequently, the increasing demand for land resources had intensified the risk of landscape fragmentation in the central areas of built-up urban regions. In 2020, the regression coefficients for the GDP and PD shifted from higher positive to lower negative correlations. This could be attributed to the saturation of construction land in the relatively developed cities of Yangzhou in the east and Linyi in the north, as well as in the surrounding areas. In the central and southern parts of the basin, the pattern of urban construction land had evolved to become more compact, with the expansion of patches having a more regular shape. This suggested that the strategic expansion of construction land driven by social development was beneficial for enhancing the stability of regional ecology. By integrating the land use transition matrix from 2010 to 2020, fluctuations in grassland were predominantly reflected in the transformation between forest land and water. The human disturbance did not reduce its quantity. In contrast, influenced by the policy of converting cropland back to grassland, 148 km2 of cropland was transformed into grassland, facilitating the restoration of lower-risk areas. With the growing demand for land resources, the development efficiency of highly vulnerable unused land had increased, reducing its area by 62.65 km2. This contributed to the suppression of development in the highest risk areas. When the urbanization process had developed over time, increases in GDP and PD positively affected regional ecosystem stability.
4.3 Recommendations for future risk management
Considering the basin’s important role in national grain production and in response to the United Nations’ call to achieve the 15th Sustainable Development Goals by 2030, this study established ND, CP, and EP development scenarios in 2030. Upon comparing the simulated outcomes for 2020 with the actual conditions, it was discovered that the OA coefficient was 0.92, the kappa coefficient was 0.91, and the FOM index was 0.30%. This signified a high level of reliability in the predictive results. It was essential to determine how to reduce regional ecological risk while safeguarding socio-economic development effectively. Therefore, integrating the above three developmental outcomes, this study had proposed the following recommendations. For the highest and higher risk areas, there should be a focus on intensifying the use of unused land, especially those predominantly located in the northern cities of Jining and Zaozhuang. Developing small parcels of unused land near water and cropland in cultivated areas was encouraged. In these areas, unused land was advantageous for irrigation and suitable for cultivation, enhancing land use efficiency and generating higher economic benefits. It was important to minimize human disturbances in highly vulnerable waters, intensify efforts in lake management and wetland conservation, and reduce the environmental risks associated with soil and water erosion in eastern cities such as Yancheng and Taizhou. For medium-risk regions, it was imperative to plan scientifically for the cropland area. This involved adhering to reforestation and grassland restoration policies while establishing basic cropland protection zones. Such measures aimed to reduce the risk of agricultural land fragmentation and ensure food production stability. Enhancing environmental governance and establishing ecological buffer zones were essential for areas with the lowest risk. This approach aimed to reduce the potential degradation of forestland and grassland and prevent land desertification. It was important to develop the scale of construction land in the central part of the basin and scientifically advance the urbanization process.
4.4 Limitations and future work
The evolution of landscape ecological risk was influenced by multiple factors, with human activities being the most directly observable (Rao et al., 2024). As a population agglomeration area between the warm temperate and northern subtropical regions, there was a vital research value for evolving landscape ecological risk from human solid activities in the basin. This study considered the impacts of PD and GDP as social driving factors. In future research, the complexity of social factors could be more comprehensively explored by integrating human activity intensity index (HAI) and additional socio-economic indicators such as nighttime lighting data (Li et al., 2022; Han et al., 2023). Secondly, the basin spans four provinces: Anhui, Jiangsu, Shandong, and Henan. The land development plans of each province differ, and restrictive data on ecological redline protection areas and basic cropland protection areas had yet to be obtained. This might lead to some non-convertible cropland and ecological land being modified in future simulation results. In summary, these would all be tasks for our continued in-depth research in the future.
5 Conclusion
This study utilized the FLUS model to conduct multi-scenario simulations of the land use spatial pattern in 2030, constructed a landscape ecological risk assessment system for the Huai River Basin, analyzed the spatiotemporal characteristics of ecological risks from 2000 to 2030, and clarified the influencing mechanisms of risk evolution over the past 20 years through the ridge regression model. The following conclusions were obtained:
1. Cropland was the predominant land-use type (accounting for over 68%), and the primary transitions were concentrated between cropland and construction land. By 2030, the area of construction land projected to continue to expand, with the greatest increase of 2906 km2 anticipated in the ND scenario. In the CP scenario, the area of cropland would recover by 1237 km2. In the EP scenario, forestland and grassland would recover, and the efficiency of developing unused land would be the highest.
2. The overall spatial pattern of landscape ecological risk showed a “high in the east and low in the west” distribution, with the lowest risk areas predominating (accounting for over 43%). From 2000 to 2010, the average risk increased by 0.0021; from 2010 to 2020, the average risk decreased by 0.0007. By 2030, the risk is expected to decline further, with the risk hierarchy being the EP scenario< the CP scenario< the ND scenario.
3. The risk exhibited significant positive spatial autocorrelation, with Moran’s I above 0.38. By 2030, the limitation of risk distribution by spatial location would decrease due to the increased impact of external development plans. Local spatial clustering was mainly characterized by “Low-Low” regions, accounting for 20% of the basin.
4. Over the past 20 years, VC, P, E, S, DfCC, and DfTC had shown negative correlations with the risk, while T had a positive correlation. Notably, in 2020, GDP and PD turned to a negative correlation, indicating that not all human activities adversely affect regional ecological risk. Moreover, VC had been the main influencing factor, with relative contributions in all three periods exceeding 21%.
In summary, this study avoided the limitation of related research that focused on past periods by using multi-scenario simulations and expanded the exploration of the influencing mechanisms of landscape ecological risk. Furthermore, this study integrated different development scenarios to propose feasible suggestions for reasonably reducing landscape ecological risk in the basin and promoting sustainable development in the future. This study could provide scientific references for environmental management in areas with similar complex climatic conditions and intense human activities globally.
Data availability statement
The original contributions presented in the study are included in the article/Supplementary material. Further inquiries can be directed to the corresponding author.
Author contributions
CL: Conceptualization, Methodology, Writing – original draft. FQ: Conceptualization, Methodology, Writing – review & editing. ZL: Investigation, Writing – review & editing. ZP: Data curation, Investigation, Writing – review & editing. DG: Software, Visualization, Writing – original draft. ZH: Software, Supervision, Writing – original draft.
Funding
The author(s) declare that financial support was received for the research, authorship, and/or publication of this article. This research was funded by the High-Resolution Satellite Project of the State Administration of Science, Technology, and Industry for National Defense of the PRC (80Y50G19-9001-22/23), the National Science and Technology Platform Construction Project (2005DKA32300), and the Major Research Projects of the Ministry of Education (16JJD770019).
Acknowledgments
We sincerely thank the National Earth System Science Data Sharing Infrastructure, National Science and Technology Infrastructure of China-Data Center of Lower Yellow River Regions for providing data support.
Conflict of interest
The authors declare that the research was conducted in the absence of any commercial or financial relationships that could be construed as a potential conflict of interest.
Publisher’s note
All claims expressed in this article are solely those of the authors and do not necessarily represent those of their affiliated organizations, or those of the publisher, the editors and the reviewers. Any product that may be evaluated in this article, or claim that may be made by its manufacturer, is not guaranteed or endorsed by the publisher.
Supplementary material
The Supplementary Material for this article can be found online at: https://www.frontiersin.org/articles/10.3389/fevo.2024.1471164/full#supplementary-material
References
Adhikari B., Urbach D., Chettri N., Sharma E., Breu T., Geschke J., et al. (2023). A multi-methods approach for assessing how conserving biodiversity interacts with other sustainable development goals in Nepal. Sustain. Dev. 31, 3239–3253. doi: 10.1002/sd.2582
Ai J., Yu K., Zeng Z., Yang L., Liu Y., Liu J. (2022). Assessing the dynamic landscape ecological risk and its driving forces in an island city based on optimal spatial scales: Haitan Island, China. Ecol. Indic. 137, 108771. doi: 10.1016/j.ecolind.2022.108771
Akbari H., Kolokotsa D. (2016). Three decades of urban heat islands and mitigation technologies research. Energy Build. 133, 834–842. doi: 10.1016/j.enbuild.2016.09.067
An M., Fan L., Huang J., Yang W., Wu H., Wang X., et al. (2021). The gap of water supply-demand and its driving factors: From water footprint view in Huaihe River Basin. PloS One 16, e0247604. doi: 10.1371/journal.pone.0247604
Bank M. S., Swarzenski P. W., Tolosa I. (2022). Seafood safety and environmental pollution in a changing environment. Environ. pollut. 306, 119475. doi: 10.1016/j.envpol.2022.119475
Bao T., Wang R., Song L., Liu X., Zhong S., Liu J., et al. (2022). Spatio-temporal multi-scale analysis of landscape ecological risk in Minjiang River Basin based on adaptive cycle. Remote Sens. 14, 5540. doi: 10.3390/rs14215540
Chang S., Dai Z. Z., Wang X., Zhu Z. Y., Feng Y. Z. (2023). Landscape pattern identification and ecological risk assessment employing land use dynamics on the Loess Plateau. Agronomy-Basel 13, 2247. doi: 10.3390/agronomy13092247
Chen L., Ma Y. (2023). Ecological risk identification and ecological security pattern construction of productive wetland landscape. Water Resour. Manage. 37, 4709–4731. doi: 10.1007/s11269-023-03574-1
Cheng X., Zhang Y., Yang G., Nie W., Wang Y., Wang J., et al. (2023). Landscape ecological risk assessment and influencing factor analysis of basins in suburban areas of large cities - A case study of the Fuchunjiang River Basin, China. Front. Ecol. Evol. 11. doi: 10.3389/fevo.2023.1184273
Cui L., Zhao Y., Liu J., Han L., Ao Y., Yin S. (2018). Landscape ecological risk assessment in Qinling Mountain. Geol. J. 53, 342–351. doi: 10.1002/gj.3115
Dai L., Liu Y., Luo X. (2021). Integrating the MCR and DOI models to construct an ecological security network for the urban agglomeration around Poyang Lake, China. Sci. Total Environ. 754, 141868. doi: 10.1016/j.scitotenv.2020.141868
Gao C., Li X., Sun Y., Zhou T., Luo G., Chen C. (2019). Water requirement of summer maize at different growth stages and the spatiotemporal characteristics of agricultural drought in the Huaihe River Basin, China. Theor. Appl. Climatol. 136, 1289–1302. doi: 10.1007/s00704-018-2558-6
Garcia C. B., Garcia J., Lopez Martin M. M., Salmeron R. (2015). Collinearity: revisiting the variance inflation factor in ridge regression. J. Appl. Stat. 42, 648–661. doi: 10.1080/02664763.2014.980789
Han W., Su X., Lu H., Li T., Jin T., Zhang M., et al. (2023). Impacts of human activity intensity on ecosystem services for conservation in the Lhasa River Basin. Ecosyst. Health Sustainability 9, 0088. doi: 10.34133/ehs.0088
He Y., Ma J., Zhang C., Yang H. (2023). Spatio-temporal evolution and prediction of carbon storage in Guilin based on FLUS and InVEST models. Remote Sens. 15, 1445. doi: 10.3390/rs15051445
He S., Yu S., Li G., Zhang J. (2020). Exploring the influence of urban form on land-use efficiency from a spatiotemporal heterogeneity perspective: Evidence from 336 Chinese cities. Land Use Policy 95, 104576. doi: 10.1016/j.landusepol.2020.104576
Hou M., Ge J., Gao J., Meng B., Li Y., Yin J., et al. (2020). Ecological risk assessment and impact factor analysis of alpine wetland ecosystem based on LUCC and boosted regression tree on the zoige plateau, China. Remote Sens. 12, 368. doi: 10.3390/rs12030368
Kayumba P. M., Chen Y., Mind'je R., Mindje M., Li X., Maniraho A. P., et al. (2021). Geospatial land surface-based thermal scenarios for wetland ecological risk assessment and its landscape dynamics simulation in Bayanbulak Wetland, Northwestern China. Landscape Ecol. 36, 1699–1723. doi: 10.1007/s10980-021-01240-8
Li Z., Fang H. (2016). Impacts of climate change on water erosion: A review. Earth Sci. Rev. 163, 94–117. doi: 10.1016/j.earscirev.2016.10.004
Li X., Fang B., Yin M., Jin T., Xu X. (2022). Multi-dimensional urbanization coordinated evolution process and ecological risk response in the Yangtze River Delta. Land 11, 723. doi: 10.3390/land11050723
Li W., Lin Q., Hao J., Wu X., Zhou Z., Lou P., et al. (2023). Landscape ecological risk assessment and analysis of influencing factors in Selenga River Basin. Remote Sens. 15, 4262. doi: 10.3390/rs15174262
Liang X., Liu X., Li X., Chen Y., Tian H., Yao Y. (2018). Delineating multi-scenario urban growth boundaries with a CA-based FLUS model and morphological method. Landscape Urban Plann. 177, 47–63. doi: 10.1016/j.landurbplan.2018.04.016
Lin J., He P., Yang L., He X., Lu S., Liu D. (2022a). Predicting future urban waterlogging-prone areas by coupling the maximum entropy and FLUS model. Sustain. Cities Soc 80, 103812. doi: 10.1016/j.scs.2022.103812
Lin N., Jiang R., Liu Q., Yang H., Liu H., Yang Q. (2022b). Quantifying the spatiotemporal variation of evapotranspiration of different land cover types and the contribution of its associated factors in the Xiliao River Plain. Remote Sens. 14, 252. doi: 10.3390/rs14020252
Liu J., Xu Q., Yi J., Huang X. (2022). Analysis of the heterogeneity of urban expansion landscape patterns and driving factors based on a combined Multi-Order Adjacency Index and Geodetector model. Ecol. Indic. 136, 108655. doi: 10.1016/j.ecolind.2022.108655
Lohiniva A. L., Toura S., Arifulla D., Ollgren J., Lyytikainen O. (2022). Exploring behavioural factors influencing COVID-19-specific infection prevention and control measures in Finland: a mixed-methods study, December 2020 to March 2021. Eurosurveillance 27, 7–15. doi: 10.2807/1560-7917.Es.2022.27.40.2100915
Luo H., Li L., Lei Y., Wu S., Yan D., Fu X., et al. (2021). Decoupling analysis between economic growth and resources environment in Central Plains Urban Agglomeration. Sci. Total Environ. 752, 142284. doi: 10.1016/j.scitotenv.2020.142284
Luo F., Liu Y., Peng J., Wu J. (2018). Assessing urban landscape ecological risk through an adaptive cycle framework. Landscape Urban Plann. 180, 125–134. doi: 10.1016/j.landurbplan.2018.08.014
Mann D., Anees M. M., Rankavat S., Joshi P. K. (2021). Spatio-temporal variations in landscape ecological risk related to road network in the Central Himalaya. Hum. Ecol. Risk Assess. 27, 289–306. doi: 10.1080/10807039.2019.1710693
Martinez A., Labib S. M. (2023). Demystifying normalized difference vegetation index (NDVI) for greenness exposure assessments and policy interventions in urban greening. Environ. Res. 220, 115155. doi: 10.1016/j.envres.2022.115155
Mondal B., Sharma P., Kundu D., Bansal S. (2021). ). Spatio-temporal assessment of landscape ecological risk and associated drivers: A case study of Delhi. Environ. Urbanization Asia 12, S85–S106. doi: 10.1177/09754253211007830
Outhwaite C. L., McCann P., Newbold T. (2022). Agriculture and climate change are reshaping insect biodiversity worldwide. Nature 605, 97–102. doi: 10.1038/s41586-022-04644-x
Qian Y., Dong Z., Yan Y., Tang L. (2022). Ecological risk assessment models for simulating impacts of land use and landscape pattern on ecosystem services. Sci. Total Environ. 833, 155218. doi: 10.1016/j.scitotenv.2022.155218
Qu Z., Zhao Y., Luo M., Han L., Yang S., Zhang L. (2022). The effect of the human footprint and climate change on landscape ecological risks: A case study of the Loess Plateau, China. Land 11, 217. doi: 10.3390/land11020217
Rao J., Ouyang X., Pan P., Huang C., Li J., Ye Q. (2024). Ecological risk assessment of forest landscapes in Lushan National Nature Reserve in Jiangxi Province, China. Forests 15, 484. doi: 10.3390/f15030484
Sang S., Wu T., Wang S., Yang Y., Liu Y., Li M., et al. (2021). Ecological safety assessment and analysis of regional spatiotemporal differences based on Earth Observation Satellite Data in support of SDGs: The case of the Huaihe River Basin. Remote Sens. 13, 3942. doi: 10.3390/rs13193942
Shi Y., Gao H., Tan S., Qin H., Tian Z., Meng J., et al. (2024). Pattern change and ecological risk analysis of Shilin World Geopark landscape. Front. Ecol. Evol. 12, 1341969. doi: 10.3389/fevo.2024.1341969
Sui L., Yan Z., Li K., Wang C., Shi Y., Du Y. (2024). Prediction of ecological security network in Northeast China based on landscape ecological risk. Ecol. Indic. 160, 111783. doi: 10.1016/j.ecolind.2024.111783
Tian Y., Wen Z., Zhang X., Cheng M., Xu M. (2022b). Exploring a multisource-data framework for assessing ecological environment conditions in the Yellow River Basin, China. Sci. Total Environ. 848, 157730. doi: 10.1016/j.scitotenv.2022.157730
Tian H., Zhang J., Zhu L., Qin J., Liu M., Shi J., et al. (2022a). Revealing the scale- and location-specific relationship between soil organic carbon and environmental factors in China's north-south transition zone. Geoderma 409, 115600. doi: 10.1016/j.geoderma.2021.115600
Wang H., Feng R., Li X., Yang Y., Pan Y. (2023a). Land use change and its impact on ecological risk in the Huaihe River Eco-economic Belt. Land 12, 1247. doi: 10.3390/land12061247
Wang H., Zhang M., Wang C., Wang K., Zhou Y., Sun W. (2023b). A novel method for quantifying human disturbances: A case study of Huaihe River Basin, China. Front. Public Health 10, 1120576. doi: 10.3389/fpubh.2022.1120576
Wang L., Han X., Zhang Y., Zhang Q., Wan X., Liang T., et al. (2023c). Impacts of land uses on spatio-temporal variations of seasonal water quality in a regulated river basin, Huai River, China. Sci. Total Environ. 857, 159584. doi: 10.1016/j.scitotenv.2022.159584
Wang Y., Yang Z., Yu M., Lin R., Zhu L., Bai F. (2023d). Integrating ecosystem health and services for assessing ecological risk and its response to typical land-use patterns in the eco-fragile region, North China. Environ. Manage. 71, 867–884. doi: 10.1007/s00267-022-01742-4
Wang H., Zhang M., Wang C., Wang K., Wang C., Li Y., et al. (2022). Spatial and temporal changes of landscape patterns and their effects on ecosystem services in the huaihe river basin, China. Land 11, 513. doi: 10.3390/land11040513
Wang H., Zhang J., Zhu F., Zhang W. (2016). Analysis of spatial pattern of aerosol optical depth and affecting factors using spatial autocorrelation and spatial autoregressive model. Environ. Earth Sci. 75, 822. doi: 10.1007/s12665-016-5656-8
Wu J., Zhu Q., Qiao N., Wang Z., Sha W., Luo K., et al. (2021b). Ecological risk assessment of coal mine area based on "source-sink" landscape theory e A case study of Pingshuo mining area. J. Cleaner Prod. 295, 126371. doi: 10.1016/j.jclepro.2021.126371
Wu F., Zhuang Z., Liu H.-L., Shiau Y.-C. (2021a). Evaluation of water resources carrying capacity using principal component analysis: An empirical study in Huai'an, Jiangsu, China. Water 13, 2587. doi: 10.3390/w13182587
Xu W., Wang J., Zhang M., Li S. (2021). Construction of landscape ecological network based on landscape ecological risk assessment in a large-scale opencast coal mine area. J. Cleaner Prod. 286, 125523. doi: 10.1016/j.jclepro.2020.125523
Xue L., Zhu B., Wu Y., Wei G., Liao S., Yang C., et al. (2019). Dynamic projection of ecological risk in the Manas River basin based on terrain gradients. Sci. Total Environ. 653, 283–293. doi: 10.1016/j.scitotenv.2018.10.382
Yan Z., Xia J., Gottschalk L. (2011). Mapping runoff based on hydro-stochastic approach for the Huaihe River Basin, China. J. Geog. Sci. 21, 441–457. doi: 10.1007/s11442-011-0856-3
Yang Y., Mohammat A., Feng J., Zhou R., Fang J. (2007). Storage, patterns and environmental controls of soil organic carbon in China. Biogeochemistry 84, 131–141. doi: 10.1007/s10533-007-9109-z
Yang Z., Tang J., Yu M., Zhang Y., Abbas A., Wang S., et al. (2022b). Sustainable cotton production through Increased competitiveness: analysis of comparative advantage and influencing factors of cotton production in Xinjiang, China. Agronomy-Basel 12, 2239. doi: 10.3390/agronomy12102239
Yang L., Zhao G., Tian P., Mu X., Tian X., Feng J., et al. (2022a). Runoff changes in the major river basins of China and their responses to potential driving forces. J. Hydrol. 607, 127536. doi: 10.1016/j.jhydrol.2022.127536
Zeng C., He J., He Q., Mao Y., Yu B. (2022). Assessment of land use pattern and landscape ecological risk in the chengdu-chongqing economic circle, southwestern China. Land 11, 659. doi: 10.3390/land11050659
Zhang W., Chang W. J., Zhu Z. C., Hui Z. (2020). Landscape ecological risk assessment of Chinese coastal cities based on land use change. Appl. Geogr. 117, 102174. doi: 10.1016/j.apgeog.2020.102174
Zhang N., Yuan R., Jarvie S., Zhang Q. (2023). Landscape ecological risk of China's nature reserves declined over the past 30 years. Ecol. Indic. 156, 111155. doi: 10.1016/j.ecolind.2023.111155
Zhou L., Dang X., Mu H., Wang B., Wang S. (2021). Cities are going uphill: Slope gradient analysis of urban expansion and its driving factors in China. Sci. total Environ. 775, 145836–145836. doi: 10.1016/j.scitotenv.2021.145836
Zhu Q., Cai Y. (2023). Integrating ecological risk, ecosystem health, and ecosystem services for assessing regional ecological security and its driving factors: Insights from a large river basin in China. Ecol. Indic. 155, 110954. doi: 10.1016/j.ecolind.2023.110954
Keywords: climatic transition zones, landscape ecological risk, multi-scenario simulation, ridge regression, Huai river basin
Citation: Li C, Qin F, Liu Z, Pan Z, Gao D and Han Z (2024) Multi-scenario assessment of landscape ecological risk in the transitional zone between the warm temperate zone and the northern subtropical zone. Front. Ecol. Evol. 12:1471164. doi: 10.3389/fevo.2024.1471164
Received: 31 July 2024; Accepted: 28 November 2024;
Published: 13 December 2024.
Edited by:
Fangyan Cheng, Zhejiang Agriculture and Forestry University, ChinaReviewed by:
Shuisen Chen, Guangzhou Institute of Geography, ChinaLiang Yuan, China Three Gorges University, China
Wanting Wang, Beijing Normal University, China
Copyright © 2024 Li, Qin, Liu, Pan, Gao and Han. This is an open-access article distributed under the terms of the Creative Commons Attribution License (CC BY). The use, distribution or reproduction in other forums is permitted, provided the original author(s) and the copyright owner(s) are credited and that the original publication in this journal is cited, in accordance with accepted academic practice. No use, distribution or reproduction is permitted which does not comply with these terms.
*Correspondence: Fen Qin, cWluZmVuQGhlbnUuZWR1LmNu
 Chenghang Li
 Fen Qin
 Zhenzhen Liu2,3