 Ding Wen
- 1South China Institute of Environmental Science, Ministry of Ecology and Environment, Guangzhou, China
- 2National Key Laboratory of Urban Ecological Environment Simulation and Protection, Ministry of Ecology and Environment, Guangzhou, China
- 3School of Geography and Ecotourism, Southwest Forestry University, Kunming, China
Carbon storage in terrestrial ecosystems is crucial to advance carbon neutrality and support sustainable development. Extensive studies have explored the effect of land use change on carbon storage, especially urban expansion. As one of the world’s top urban agglomerations, the Pearl River Delta Urban Agglomeration (PRDUA) is facing a dramatic loss of carbon storage along with urbanization. Coordinating economic development and ecological protection and achieving low-carbon green development are urgently needed to alleviate the decline in urban carbon storage. Here, we quantified land use change in the historical period (2000, 2010, 2020) and in 2030 and then estimated carbon storage dynamics at different scales by combining the PLUS model and the InVEST model. We found that: (1) Construction land significantly increased simultaneously with considerable losses of farmland (2273.29 km2) and forestland (949.98 km2) from 2010–2020. In 2030, construction land will expand by 997.83 km2 (12.51%), 1419.97 km2 (17.79%), and 238.60 km2 (2.99%) under the natural growth (NG), urban expansion (UE), and low carbon development (LCD) scenarios, respectively. (2) Compared to 2020, carbon storage under the LCD will reach 6.51×10⁸ Mg, with the lowest decline rate (0.35%). (3) At the city level, Shenzhen had the highest decline rate under various scenarios, followed by Zhuhai and Guangzhou. At the county scale, carbon storage followed the order NG > UE > LCD in 2000–2030. At the grid scale, carbon storage showed a declining trend from the central PRDUA region to marginal areas. Thus, comprehensive considering the multiscale effects of land use change on carbon storage was beneficial to formulate reasonable measures for specific areas. Differentiated development categories at different scales and low-carbon industrial upgrading should be implemented to maintain ecosystem services and achieve sustainable development.
1 Introduction
Carbon dioxide has significantly contributed to global warming due to its increasing concentration in the atmosphere (Searchinger et al., 2018). Terrestrial ecosystems is vital to sequestering and storing carbon globally (Piao et al., 2009). Globally, terrestrial ecosystems have fixed 31% of anthropogenic carbon emissions over the past 10 years (Friedlingstein et al., 2019). Thus, land use change significantly affects carbon dioxide emissions and carbon storage (Foley et al., 2005). Cities, release over 70% of anthropogenic carbon emissions (Cai and Zhang, 2014; Sun et al., 2023). With accelerated urbanization, urban areas will further occupy farmland and natural land (Li et al., 2022a). Previous studies estimated that global urban areas increased from 36.2×10⁴ km2 to 65.3×10⁴ km2 from 1985 to 2015 (Liu et al., 2020). Additionally, the global urbanization rate will increase from 56% in 2021 to 68% in 2050, and newly increasing urban areas will mainly occur in Asia and Africa (Liu et al., 2020). Therefore, considering carbon storage in the fields of effective land use management and rational urban planning is vital for maintaining ecosystem services and promoting sustainable development (Chien and Krumins, 2022; Balaguer et al., 2023; Cao et al., 2023; Yang et al., 2023).
To achieve carbon neutrality and sustainable development, it is essential to conduct a fine assessment of carbon storage. There are several approaches to assess carbon storage, such as field investigation, remote sensing, and empirical statistical models(Houghton et al., 1999; Baccini et al., 2017; Hong et al., 2021). Field investigation is expensive and time-consuming for large-scale research. For example, Tang et al. (2018) set 1.4×10⁴ fixed quadrates to estimate carbon pools in China. Although remote sensing technology promotes carbon science development, the assessment results are full of uncertainty due to factors such as inversion algorithms and water vapor. Based on biophysical processes, some advance models have been developed, such as the BIOME-BGC model. However, these models are weak in localization due to lots of input parameters. In contrast, land-use specific carbon emission coefficients and the Integrated Valuation of Ecosystem Services and Trade-offs (InVEST) model have been used to evaluate carbon emissions and carbon storage at various scales due to their direct, convincing, sustainable and affordable nature (Costanza et al., 2017; Gomes et al., 2021; Wang et al., 2021). Based on the InVEST model, numerous studies have estimated the carbon budget at global, regional, and city scales. For example, in the Yangtze River Delta, the amount of carbon storage decreased by 1.2×10⁹ Mg in 1990–2015, and there tended to be continuous losses under different development modes (Gao and Wang, 2019). Other studies found that with ecologically and economically balanced development, carbon storage would reach 2.6×10⁹ Mg in 2030 in the Beijing–Tianjin–Hebei Urban Agglomeration (Guo et al., 2022). Therefore, carbon storage dynamics were determined by development models and geographical conditions. Currently, most existing studies paid attention to single scale rather than multi scales, which lead to ignore multi scales effect. Further, appropriate strategies are difficult to achieve optimal benefits at different scales. Additionally, few studies have focused on the multiscale effect of different development scenarios on carbon storage and explored its implications for carbon neutrality (Liu et al., 2022b; Wu et al., 2023). Thus, in-depth understanding the multiscale effects of land use change on carbon storage is essential for policy-making, particularly the urban agglomerations.
Integrating land use change models and the InVEST model can achieve carbon storage management under currently policy or future possible scenario to guide regional high-quality development (Liu and Wu, 2022). Scenario simulation is fundamental to assess the impact of different development strategies on land use/carbon storage and seek the best development path. Land use change are complex and many efforts were paid to improve the land use change models. Generally, land use models can mainly be classified into Markov models, the CLUMondo model, and cellular automata-based models. Markov models have been widely applied but cannot realize spatial visualization. The CLUMondo model adopted logistic regression to establish the relationships between different land use types and their influencing factors (Van Asselen and Verburg, 2013). Cellular automata have the advantages of flexibility, simplicity, and spatialization. The patch-generating land use simulation (PLUS) model, which established based on cellular automata, is excellent in simulating multiple land use type spatial pattern changes by integrating natural and human-related driving forces using competition mechanisms among different land use types (Liang et al., 2021; Nie et al., 2023). The InVEST model can effectively evaluate carbon storage with fewer input parameters and high accuracy. Thus, we adopted the PLUS model and the InVEST model to estimate carbon storage dynamics under multiple scenarios.
Urban agglomerations are not only the engine of economic growth but also occupy substantial natural land, resulting in multiscale environmental impacts (Zhou et al., 2022). Ecosystem services decline at the urban agglomeration scale, with high heterogeneity in the region. The Pearl River Delta Urban Agglomeration (PRDUA) is the most developed region in China(Zhang et al., 2022). Given the roll out of many favorable plans, such as the Leading area for deepening reform and the Guangdong–Hong Kong–Macao Greater Bay Area Outline Development Plan, high-quality and sustainable development has become the future development path of the PRDUA (Li et al., 2019). Due to differences in geographical and resource endowments, the development level of the PRDUA varies among cities, which also determines the differences in the supply and demand relationship of ecosystem services between cities. Thus, it is meaningful to take the PRDUA as a case to quantify historical and future carbon storage changes across different scales under various scenarios and develop appropriate management strategies for urban ecosystems under different development scenarios. The findings about balance the conflict of maintain carbon storage and urban development paths can provide references for other similar urban agglomeration around the world.
Hence, we first quantified historical land use change and carbon storage in PRDUA. Then, we predicted future land use change in 2030 under multiple scenarios. Next, these land use maps were applied to simulate carbon storage change in 2030. The innovation of our study was multi scale impacts of future land use change under different scenarios on carbon storage in urban agglomeration. The specific aims of our study were to: (1) identify characteristics of historical and future land use change. (2) assess carbon storage change in 2030 under multiple scenarios at the city, county, and grid scales. (3) clarify carbon storage patterns by adopting spatial autocorrelation analysis. The results would be beneficial for policy-making related to ecosystem management and sustainable development in urban agglomerations.
2 Materials and methods
2.1 Study site
The PRDUA (111°20′–115°24′ E, 21°32′–24°26′ N) lies in southern China (Figure 1). It has a tropical and subtropical monsoon climate. The PRDUA is surrounded by mountains, with an alluvial plain located in the central part. It comprises nine cities and 45 counties (Supplementary Figure A1). Following the Chinese Criteria of Urban Classification (https://www.gov.cn), these cities can be classified into three categories: megacities (with permanent resident populations beyond 10 million), supercities (with permanent resident populations ranging from 5 to 10 million), and large cities (with permanent resident populations exceeding 3 million). In 2020, the population in the PRDUA reached 78 million, and the gross domestic product (GDP) was approximately 13 trillion yuan (China National Bureau of Statistics 2021). With increasing demand for construction land, the PRDUA has experienced significant losses of forestland and farmland, and ecosystem services have continuously decreased (Chen et al., 2021). The Chinese government announced the “Carbon Peak, Carbon Neutralization” strategy in 2019, and achievement of its goals is dependent on carbon emissions and carbon sinks. In the PRDUA, the amount of carbon emissions increased by 1.8×10⁸ Mg during 2000–2016. Furthermore, PRDUA is the first Chinese cluster of national forest cities with abundant carbon storage (Li et al., 2022b). Additionally, ecological protection redlines, which aim to preserve the ecosystem’s functional security and structural stability, account for approximately one-third of the total area. Thus, exploring carbon storage in the PRDUA can promote high-quality economic development.
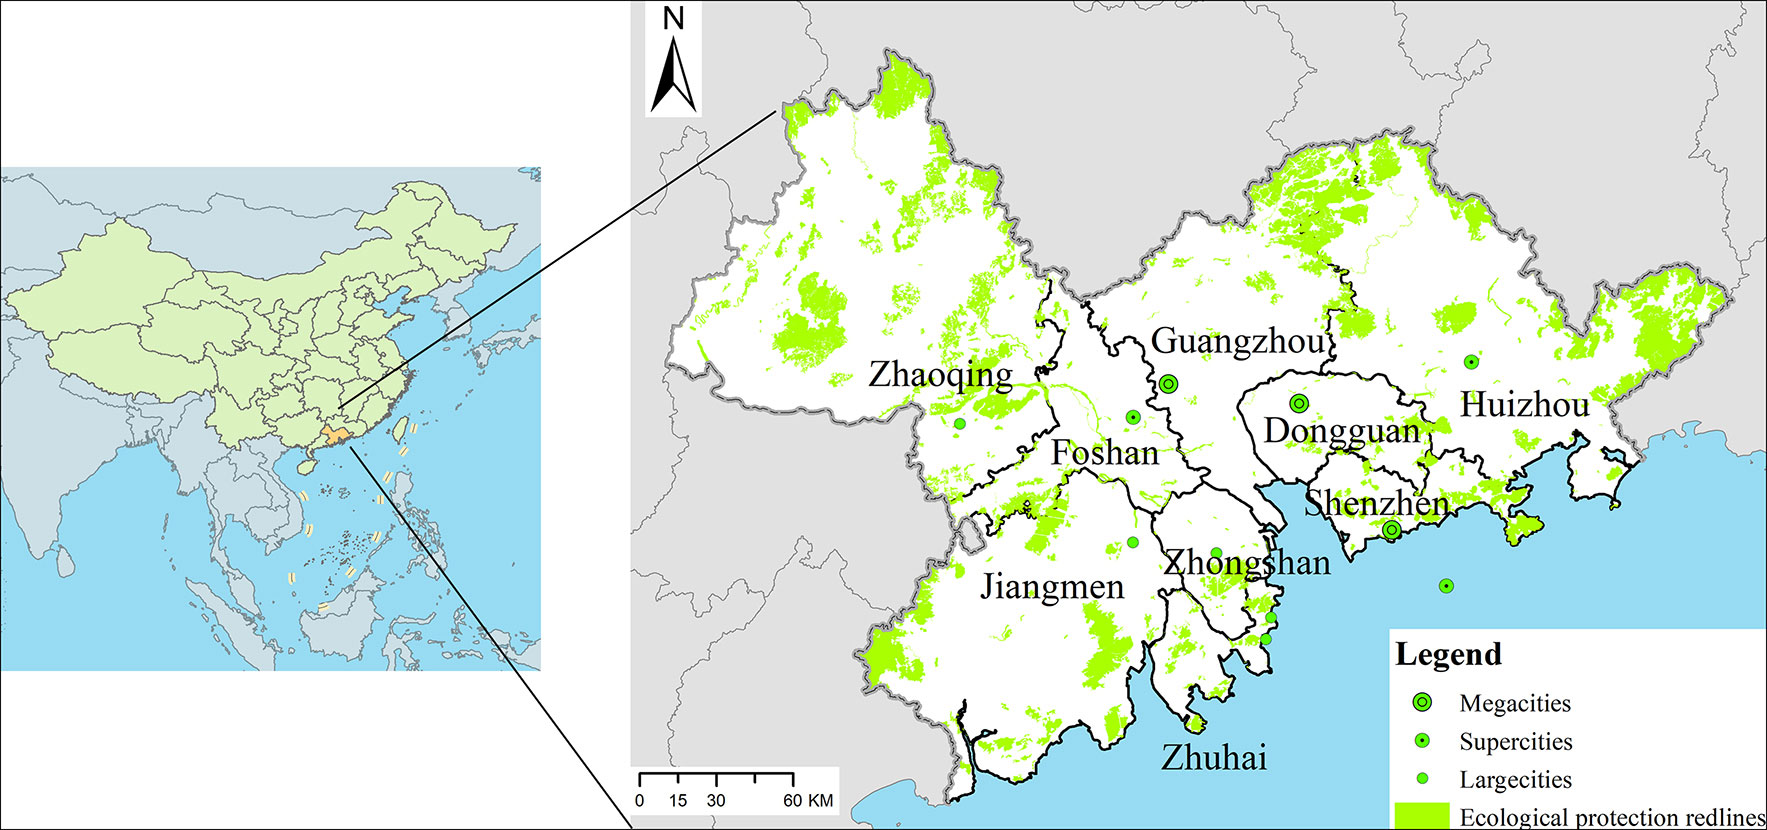
Figure 1 Location and distribution of cities.
2.2 Data acquisition and collection
Historical land use data (2000, 2010, and 2020) were collected from the Chinese Academy of Sciences (http://www.resdc.cn/), including farmland, grassland, forestland, construction land, wetland, and unused land(Liu et al., 2010). The elevation data were acquired from the Geospatial Data Cloud (http://www.gscloud.cn/). Then, the slope was calculated using ArcGIS “surface analysis” tools. The precipitation and temperature data were obtained from the Resources and Environment Science Data Center of the Chinese Academy of Sciences (http://www.resdc.cn/). Different road levels were acquired from the National Earth System Science Data Center (https://www.Geodata.cn). Factors related to location variables, such as distance to rivers, were calculated using ArcGIS “Euclidean distance analysis” tools. The population density and GDP were acquired from the Resources and Environmental Scientific Data Center (RESDC) (http://www.resdc.cn/). The night light data were downloaded from the International Organization for Earth Observation (https://earthobservations.org/index.php), with a resolution of 1 km. Ecological protection redlines were collected from the Department of Ecology and Environment of Guangdong Province (http://gdee.gd.gov.cn/).
2.3 Method
This study integrated the PLUS and InVEST models to estimate historical and future carbon storage. Specifically, the PLUS model was validated and then adopted to simulate future land use in 2030. Then, the InVEST model was used to estimate historical and future carbon storage in the PRDUA.
2.3.1 Land use change simulation
The PLUS model improves the accuracy of prediction by considering the effect of a series of driving forces on the dynamics of geographical cells. The localization PLUS model was conducted from driving factors, neighborhood weights, simulated scenarios, and validation.
2.3.2 Driving forces
Land use change in China mainly affected by social and economic development, national policies, and topography (Zhuang et al., 2022). In our study, we comprehensively consider various driving forces and their availability. According to previous studies, a total of 4 categories of 11 driving factors were selected: climatic variables, location variables, socioeconomic variables, and topographic variables (Table 1) (Zhang et al., 2019; Wang et al., 2021). The climatic variables included precipitation and temperature. The location variables included distance to expressways, railways, ordinary roads, and waterbodies. The socioeconomic variables included population density, GDP and night light intensity. The topographic variables included elevation and slope. Finally, the land use and driving force were resampled to 100 m × 100 m.
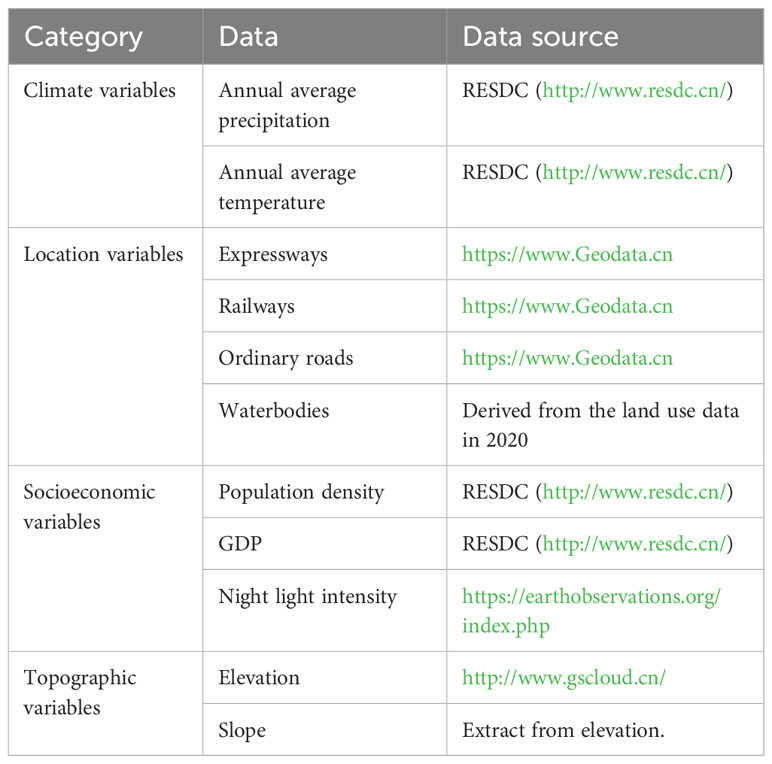
Table 1 Source for driving force.
2.3.3 Neighborhood weight
The neighborhood weight represents the expansion ability of the land use category. Large value of neighborhood weight means a stronger expansion ability. The determination of neighborhood weight mostly relies on expertise because it is difficult to obtain directly. Existing studies have indicated that the patch area dynamics and number of patches are suitable to quantify the expansion degree (Liang et al., 2021). Therefore, the change in patch area was adopted in this study to determine the neighborhood weight, and its formula is expressed as:
where Wi is the neighborhood weight, TAi is the changed area, and TAmax and Tmin are the maximum and minimum changed areas, respectively.
2.3.4 Multiple scenarios setting
According to different economic development goals, we set three scenarios: natural growth (NG), urban expansion (UE), and low carbon development (LCD). The descriptions of the three scenarios are as follows:
(1) NG: The land use will change following the past land use change pattern. There are no large-scale land use policy adjustments in this scenario. Area demand for 2030 was calculated based on the Markov model according to the conversion probability matrix for the 2010–2020 period.
(2) UE: Considering that there are significant strategic opportunities for rapid development in the PRDUA, rapid growth in construction land is bound to occur. Thus, the probability of other land uses being converted into construction land increases by 20%.
(3) LCD: Considering that the PRDUA faces the assessment of double carbon goals, it will strive to achieve carbon neutrality. Thus, an ecological protection redline was added to this scenario. The probability of farmland and forestland conversion into construction land decreases by 30%, whereas the probability of construction land conversion into forestland increases by 10%. Additionally, ecological protection redline areas were used as constraints to restrict their arbitrary conversion.
2.3.5 Validation
Regarding amount of each land use types in 2020 as the demand area of corresponding land use types in the model to simulate land use change in 2020. Then, the actual land use map in 2020 was compared with the simulate land use map for the same year. The Kappa index, which has widely used to assess the accuracy of land use simulation, was adopted to measure the accuracy of the simulation results (Pontius and Schneider, 2001). The Kappa index formula is:
where P0, Pc, and Pp are the observed proportion correct, the expected proportion correct due to chance, and the proportion correct when classification is perfect, respectively.
2.3.6 Carbon storage estimation
InVEST includes four types of carbon pools: aboveground (Cabove), belowground (Cbelow), dead organic matter (Cdead), and soil organic matter (Csoil) (Wu et al., 2023). The aboveground biomass mainly refers to the carbon of trees, shrubs, and grasses. The underground biomass represents the carbon in plant root system. Dead organic matter mainly contains litter and dead vegetation. Soil organic refers to organic carbon in the soil. The calculation formula is:
where Ck is the amount carbon storage of each land use type; Ct is the total carbon storage in specific areas; Ak is the area of specific land use type.
Generally, carbon density can be obtained from field measurements or published studies. Therefore, we collected many related articles to acquire relatively accurate carbon density data (Table 2) (Liu et al., 2022c; Liu et al., 2023; Zhang et al., 2023).
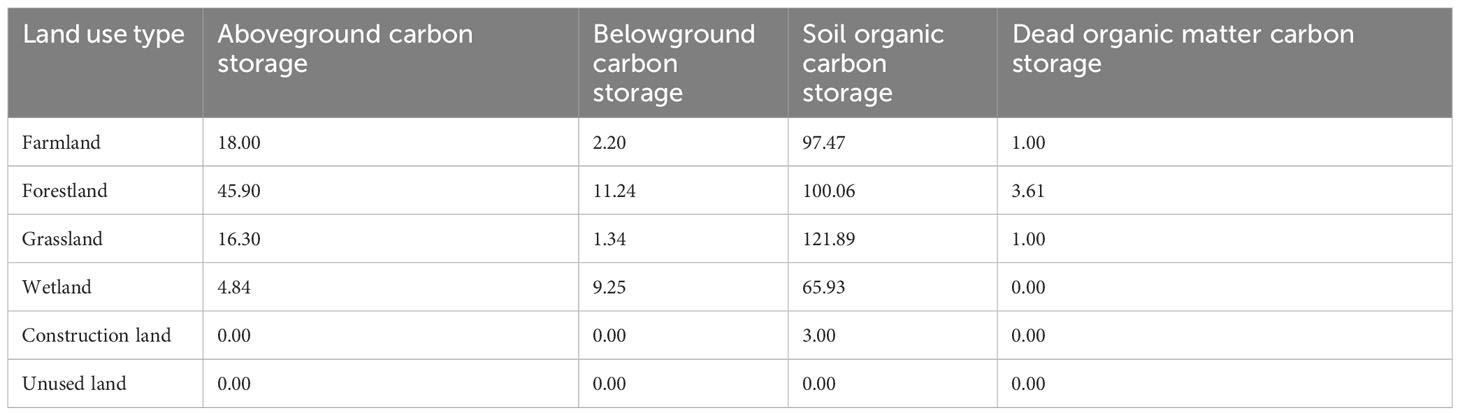
Table 2 Carbon density of each land use cover type in the PRDUA (Mg/hm2).
2.3.7 Spatial autocorrelation analysis
We adopted the local Moran’s I index to identify the pattern of carbon storage. The cluster types mainly included high–high cluster, high–low cluster, low–high cluster, low–low cluster, and not significant. The formula can be expressed as:
where xi and ˉx are the observation and the average of all observations, respectively.
3 Results
3.1 Model validation
Verified through on-site investigation and high-resolution remote sensing of Google earth, the overall accuracy of all land use data were exceeded 0.90. Accuracy of simulation results was high, with a Kappa index of 0.86 (Figure 2). Additionally, the intensity and direction of urban expansion in the simulation scenario were similar to those of actual land use in 2020. This finding was also consistent with previous studies (Zhao et al., 2021; Zhang and Li, 2022).
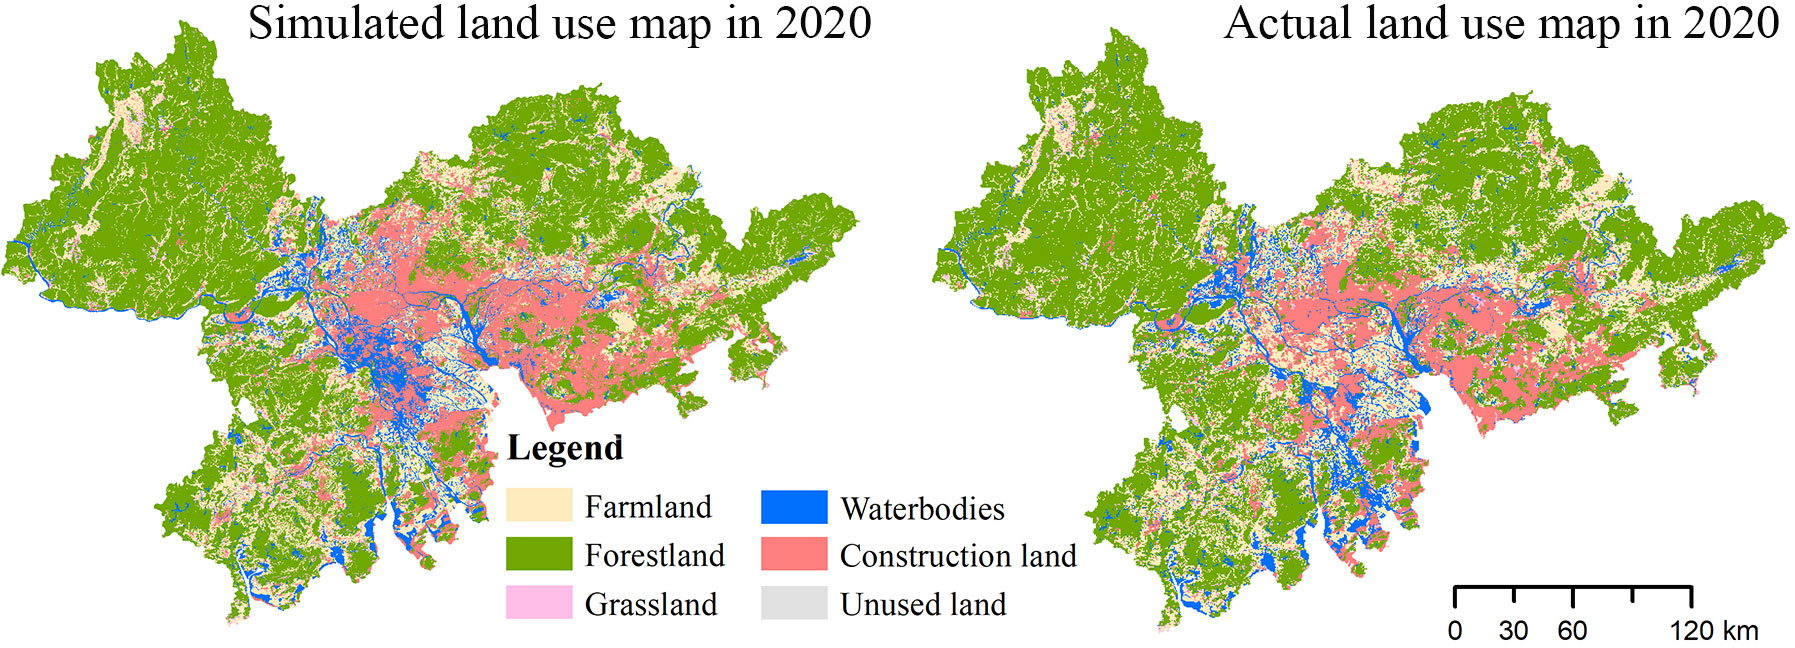
Figure 2 Comparison of the simulated results and actual land use in 2020.
3.2 Historical and future land use dynamics
3.2.1 Land use change from 2000 to 2020
Forestland is distributed in the marginal areas, whereas construction land are concentrated in the central part (Figure 3). The waterbodies are mainly distributed west of the Pearl River. There is less grassland and unused land in the PRDUA. Forestland is the predominant landscape in the PRDUA, accounting for 53.51–55.62% of the total area, followed by farmland and construction land, accounting for 22.41–26.81% and 7.86–14.87%, respectively, of the total area (Table 3). From 2000 to 2020, there was considerable urban expansion and farmland shrinkage. Generally, the construction land increased 2708.67 km2 and 1075.26 km2, with change rates of 64.58% and 15.58% during 2000–2010 and 2010–2020, respectively. Farmland experienced continuous decreases, with 1705.03 km2 and 568.26 km2 net losses during 2000–2010 and 2010–2020, respectively. The waterbodies covered areas of 4193.82 km2 (7.68%), 4074.73 km2 (7.64%) and 3912.72 km2 (7.29%) in 2000, 2010, and 2020, respectively. Grassland experienced an initial slow decrease during 2000–2010 and then slightly recovered during 2010–2020.
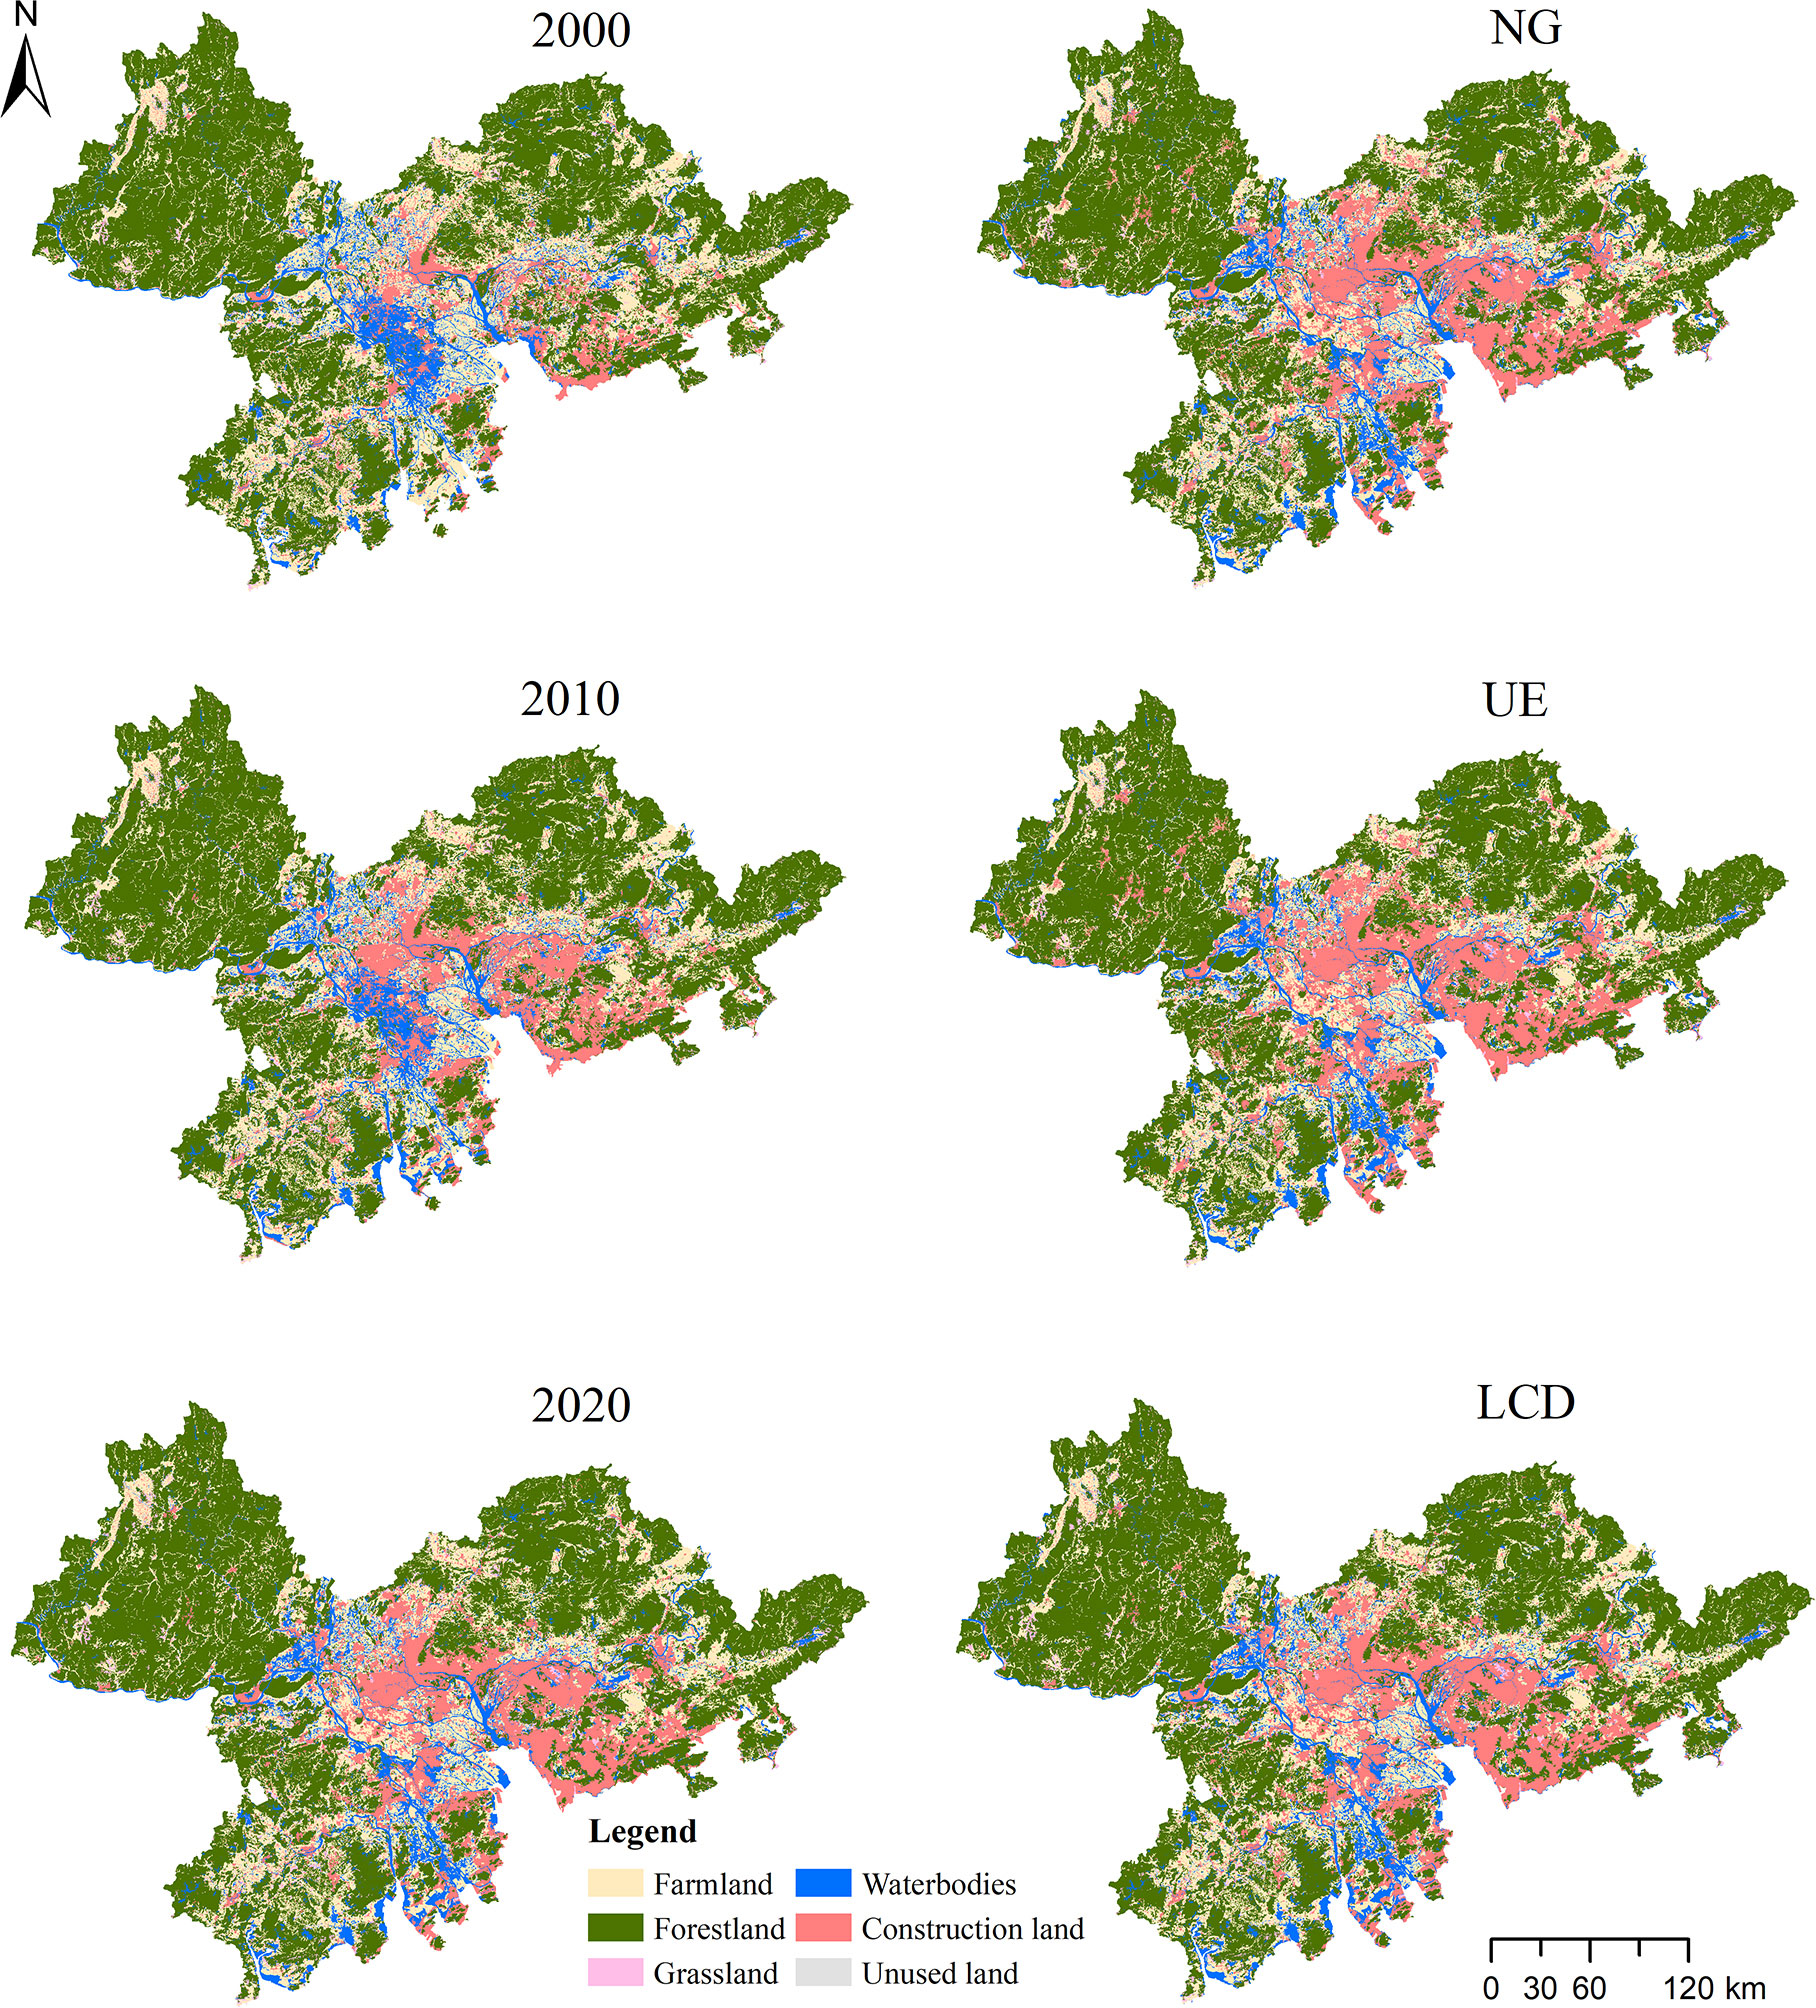
Figure 3 Spatial distribution of land use during 2000-2030.
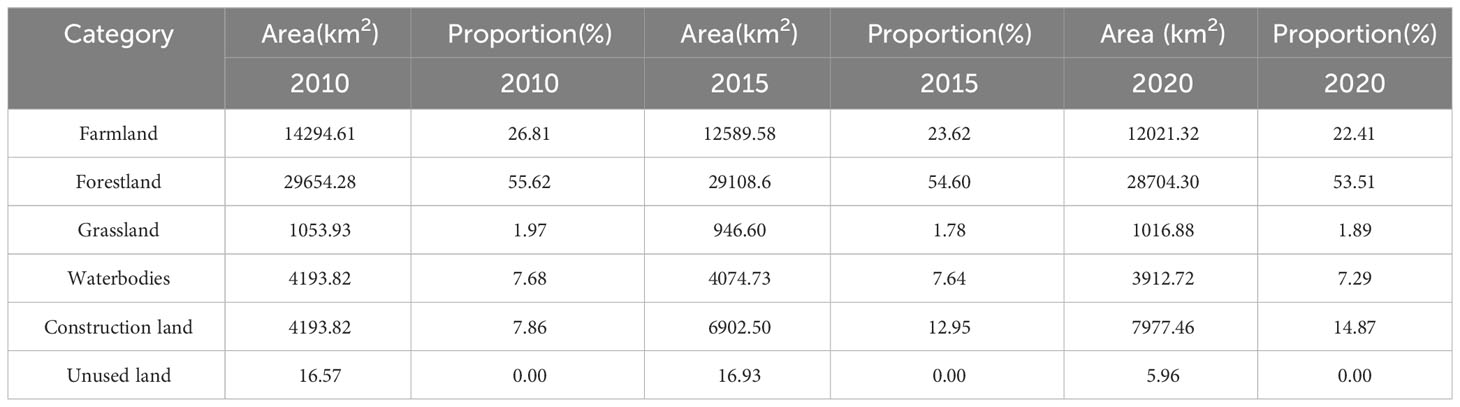
Table 3 Characteristics of land use change from 2000 to 2020.
The chord diagram was used to describe the intensity and flow direction of land use change at different periods. From 2000 to 2010, the newly increasing construction land was primarily source from farmland (1478.57 km2; 48.80%), forestland (677.43 km2; 22.36%), and waterbodies (412.27 km2; 13.61%), accounting for 84.77% of the total area of conversion (Figure 4). The main land use change during 2010–2020 was similar to the land use change trend during 2000–2010, but with some differences. The newly increasing construction land remain occupied farmland (1067.00 km2; 24.39%), forestland (394.84 km2; 12.09%), and waterbodies (412.27 km2; 9.03%), accounting for 45.51% of the total area of conversion. The area of farmland converted to waterbodies (500.38 km2; 11.44%) was approximately the area of waterbodies converted to farmland (490.67 km2; 11.22%). Additionally, construction land was replaced by farmland (471.71 km2; 10.78%), forestland (263.54 km2; 6.02%), and waterbodies (167.21 km2; 3.82%), indicating that ecological protection achieved some success at some extent.
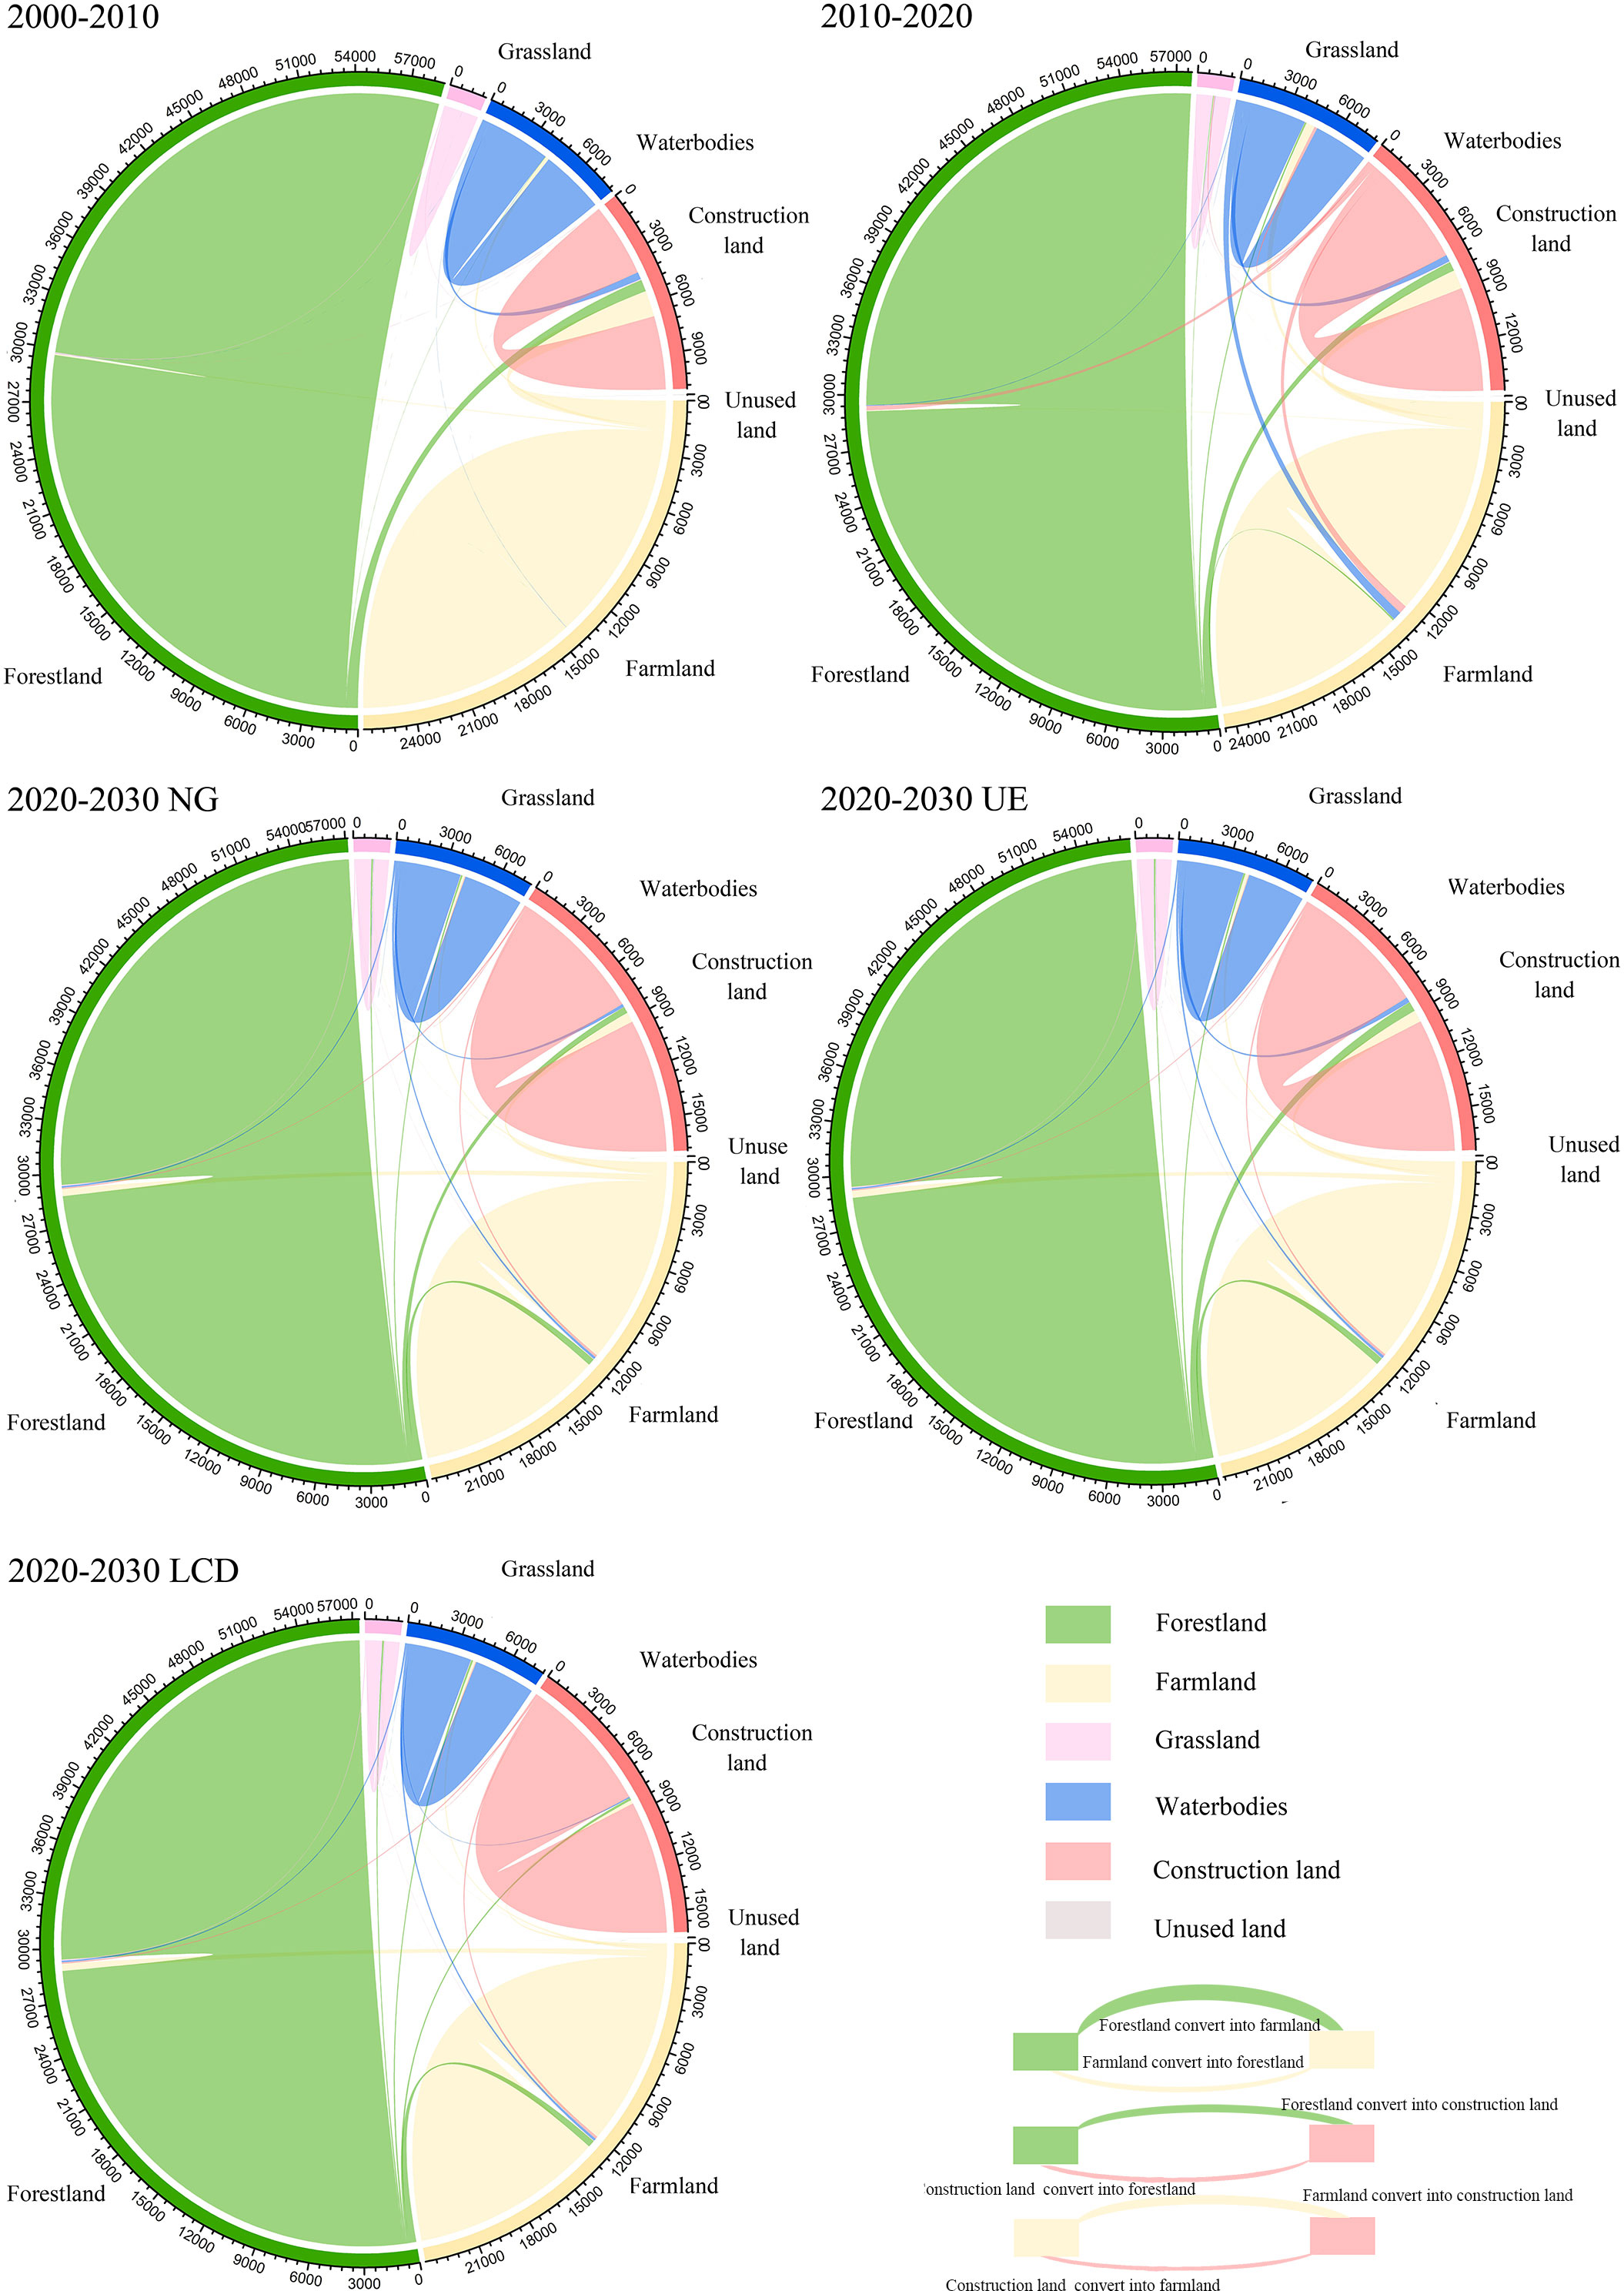
Figure 4 Chord diagram of land use change in PRDUA during 2000–2030.
3.2.2 Land use dynamics in 2030
The land use patterns under NG, UE, and LCD in 2030 were consistent (Figure 3). Under the three scenarios, forestland still has the largest area, followed by farmland and construction land. The significant land use change is increased construction land, with expansions of 997.83 km2 (12.51%), 1419.97 km2 (17.79%), and 238.60 km2 (2.99%) under scenarios NG, UE, and LCD, respectively. Under NG, the farmland loss was 441.15 km2, and the forestland loss was 333.75 km2 compared with 2020 (Table 4). Under UE, the loss of farmland was the largest, reaching 579.00 km2, followed by forestland at 555.03 km2 and waterbodies at 118.33 km2. Under LCD, the areas of farmland and forestland decreased slowly, with total reductions of 80.35 km2 and 87.56 km2, respectively. In contrast, the waterbodies increased by 106.40 km2 under LCD, whereas the waterbodies decreased by 76.66 km2 and 118.33 km2 under NG and UE, respectively. Under three scenarios (Figure 4), the increase of construction land is mainly the transfer of farmland and forestland. Additionally, there will be a trend of mutual transformation between forestland and farmland.
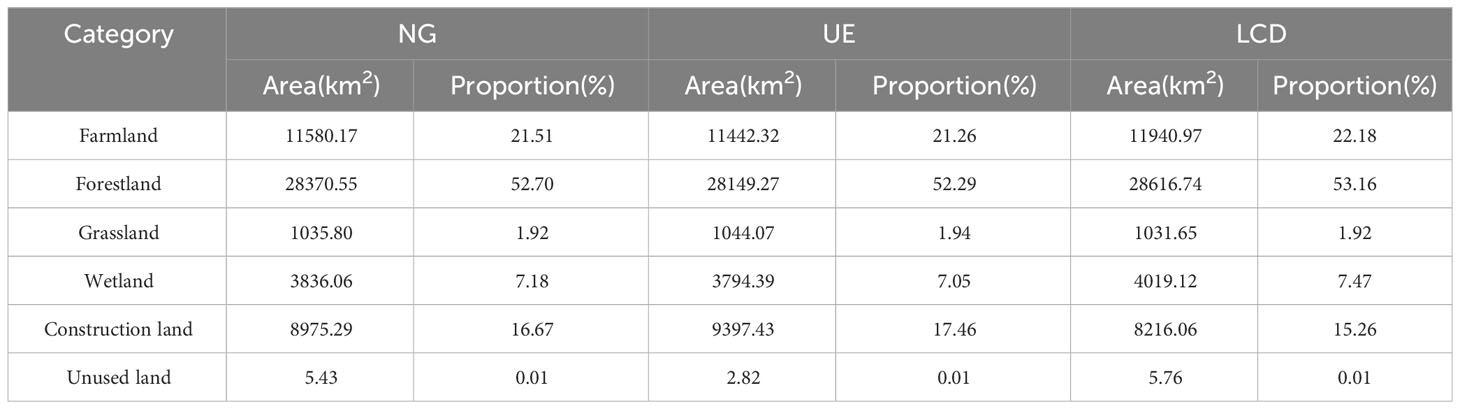
Table 4 Characteristics of land use change under different scenarios in 2030.
3.3 Historical and future carbon storage changes
Higher carbon storage is distributed in the marginal regions of the PRDUA, where the elevation tends to be higher with relatively higher vegetation cover (Figure 5). Lower carbon storage is mainly distributed in the central region, where intense anthropogenic activities, such as industrial activities, are developed. The total carbon storage in 2000, 2010, and 2020 was 6.99×10⁸ Mg, 6.67×10⁸ Mg, and 6.53×10⁸ Mg, respectively. The total carbon storage decreased by 4.66×10⁷ Mg during 2010-2020. The decline rates were 4.67% from 2000 to 2010 and 2.08% from 2010 to 2020. The patterns of carbon storage under multiple scenarios in 2030 are similar to those in 2020. Carbon storage in the PRDUA declined with urbanization, especially in the central region of the agglomeration. In 2030, carbon storage will reach 6.42×10⁸ Mg, 6.36×10⁸ Mg, and 6.51×10⁸ Mg under the NG, UE, and LCD scenarios, respectively (Figure 5). Compared to 2020, the carbon storage will decline by 1.76%, 2.60%, and 0.35% under the NG, UE, and LCD scenarios, respectively. This indicates that the three development patterns would cause the carbon storage to decrease with different intensities, and LCD leads to a relatively lower loss.
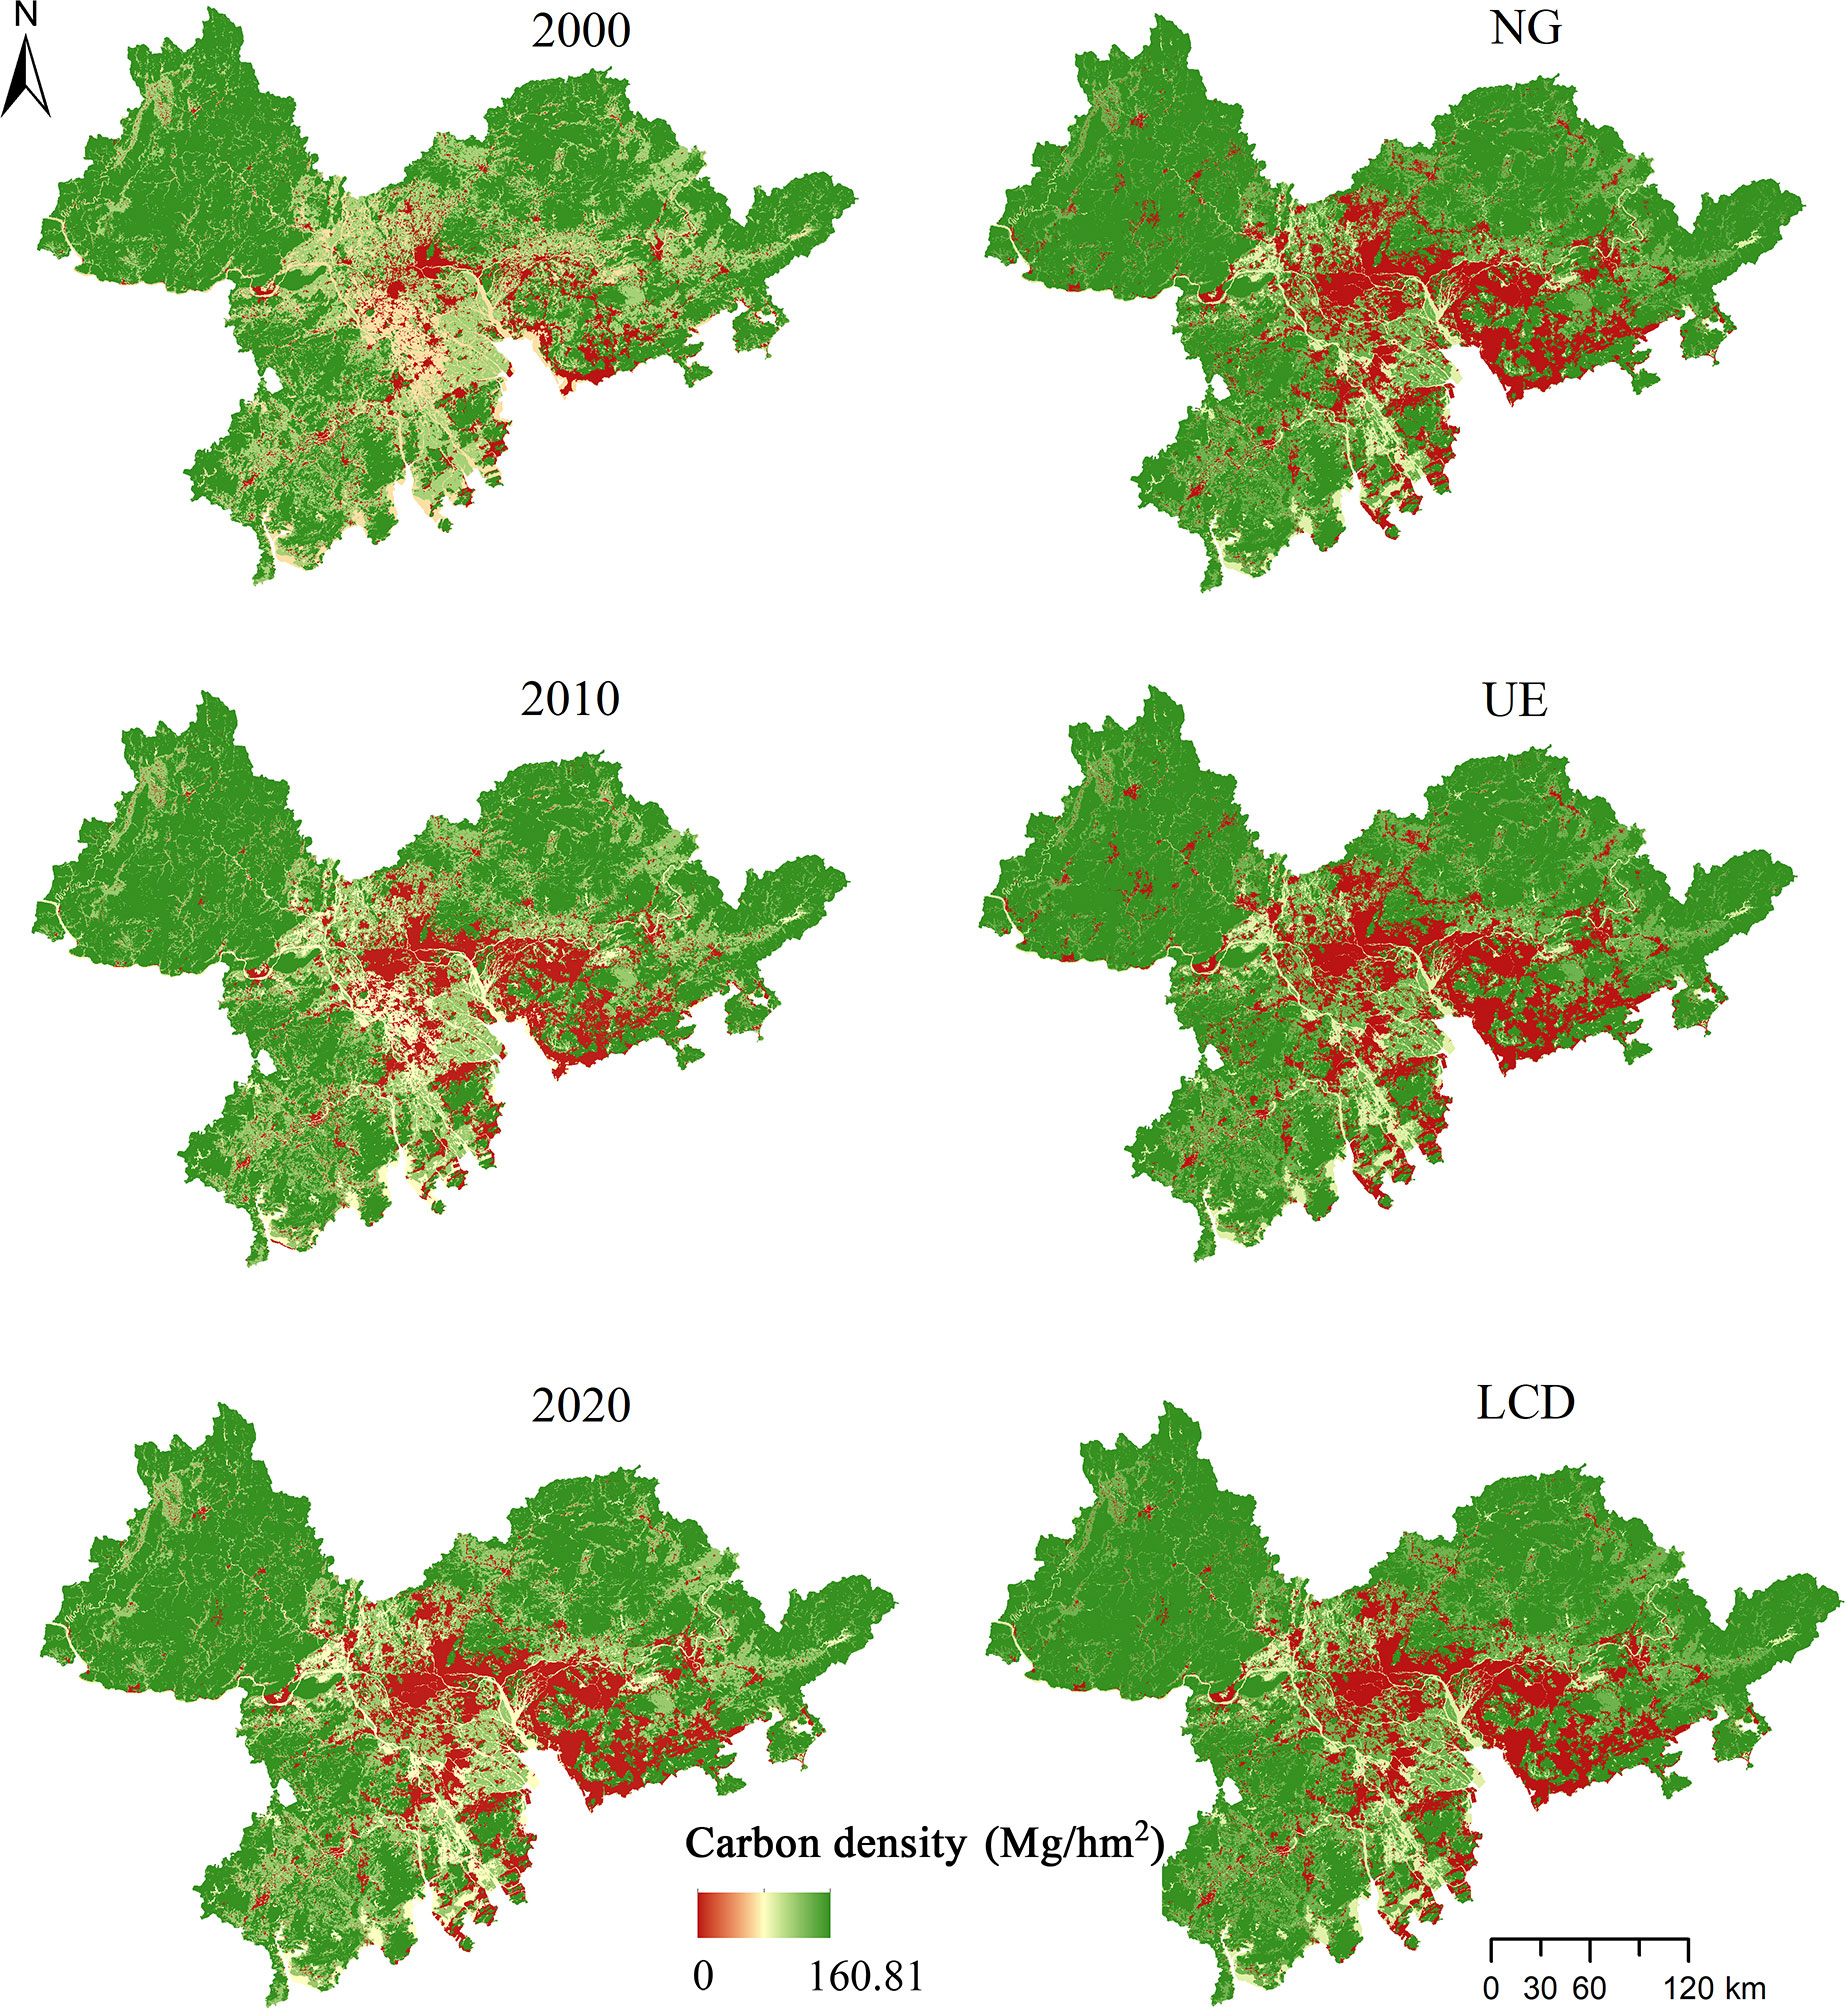
Figure 5 Spatial distribution of carbon storage during 2000–2030.
At the city scale, carbon storage exhibited a decreasing trend in the nine cities from 2000 to 2020 (Figure 6). Zhaoqing always had the highest carbon storage (2.19×10⁸ Mg), followed by Huizhou (1.59×10⁸ Mg) and Jiangmen (1.19×10⁸ Mg). The decline rates varied with time and space. For instance, from 2000 to 2010, the decline rates of Dongguan, Shenzhen, and Zhongshan exceeded 15%, whereas those of Huizhou, Jiangmen, and Zhaoqing were no more than 3%. The decline rates of Zhaoqing, Jiangmen, and Zhuhai were fast from 2000 to 2010 and then slowed from 2010 to 2020. Other cities exhibited an accelerated declining trend. In 2030, the carbon storage under the different scenarios was lower than that in 2020 but to different degrees (Figure 6B). Under NG, Shenzhen had the largest decline rate (4.35%), followed by Zhuhai (3.67%) and Guangzhou (3.45%). Under UE, the decline rates of Shenzhen, Zhuhai, and Guangzhou exceeded 4.67%. Similarly, the top three cities in terms of decline rate are Shenzhen, Zhuhai, and Guangzhou, with decline rates lower than 1.15% under LCD.
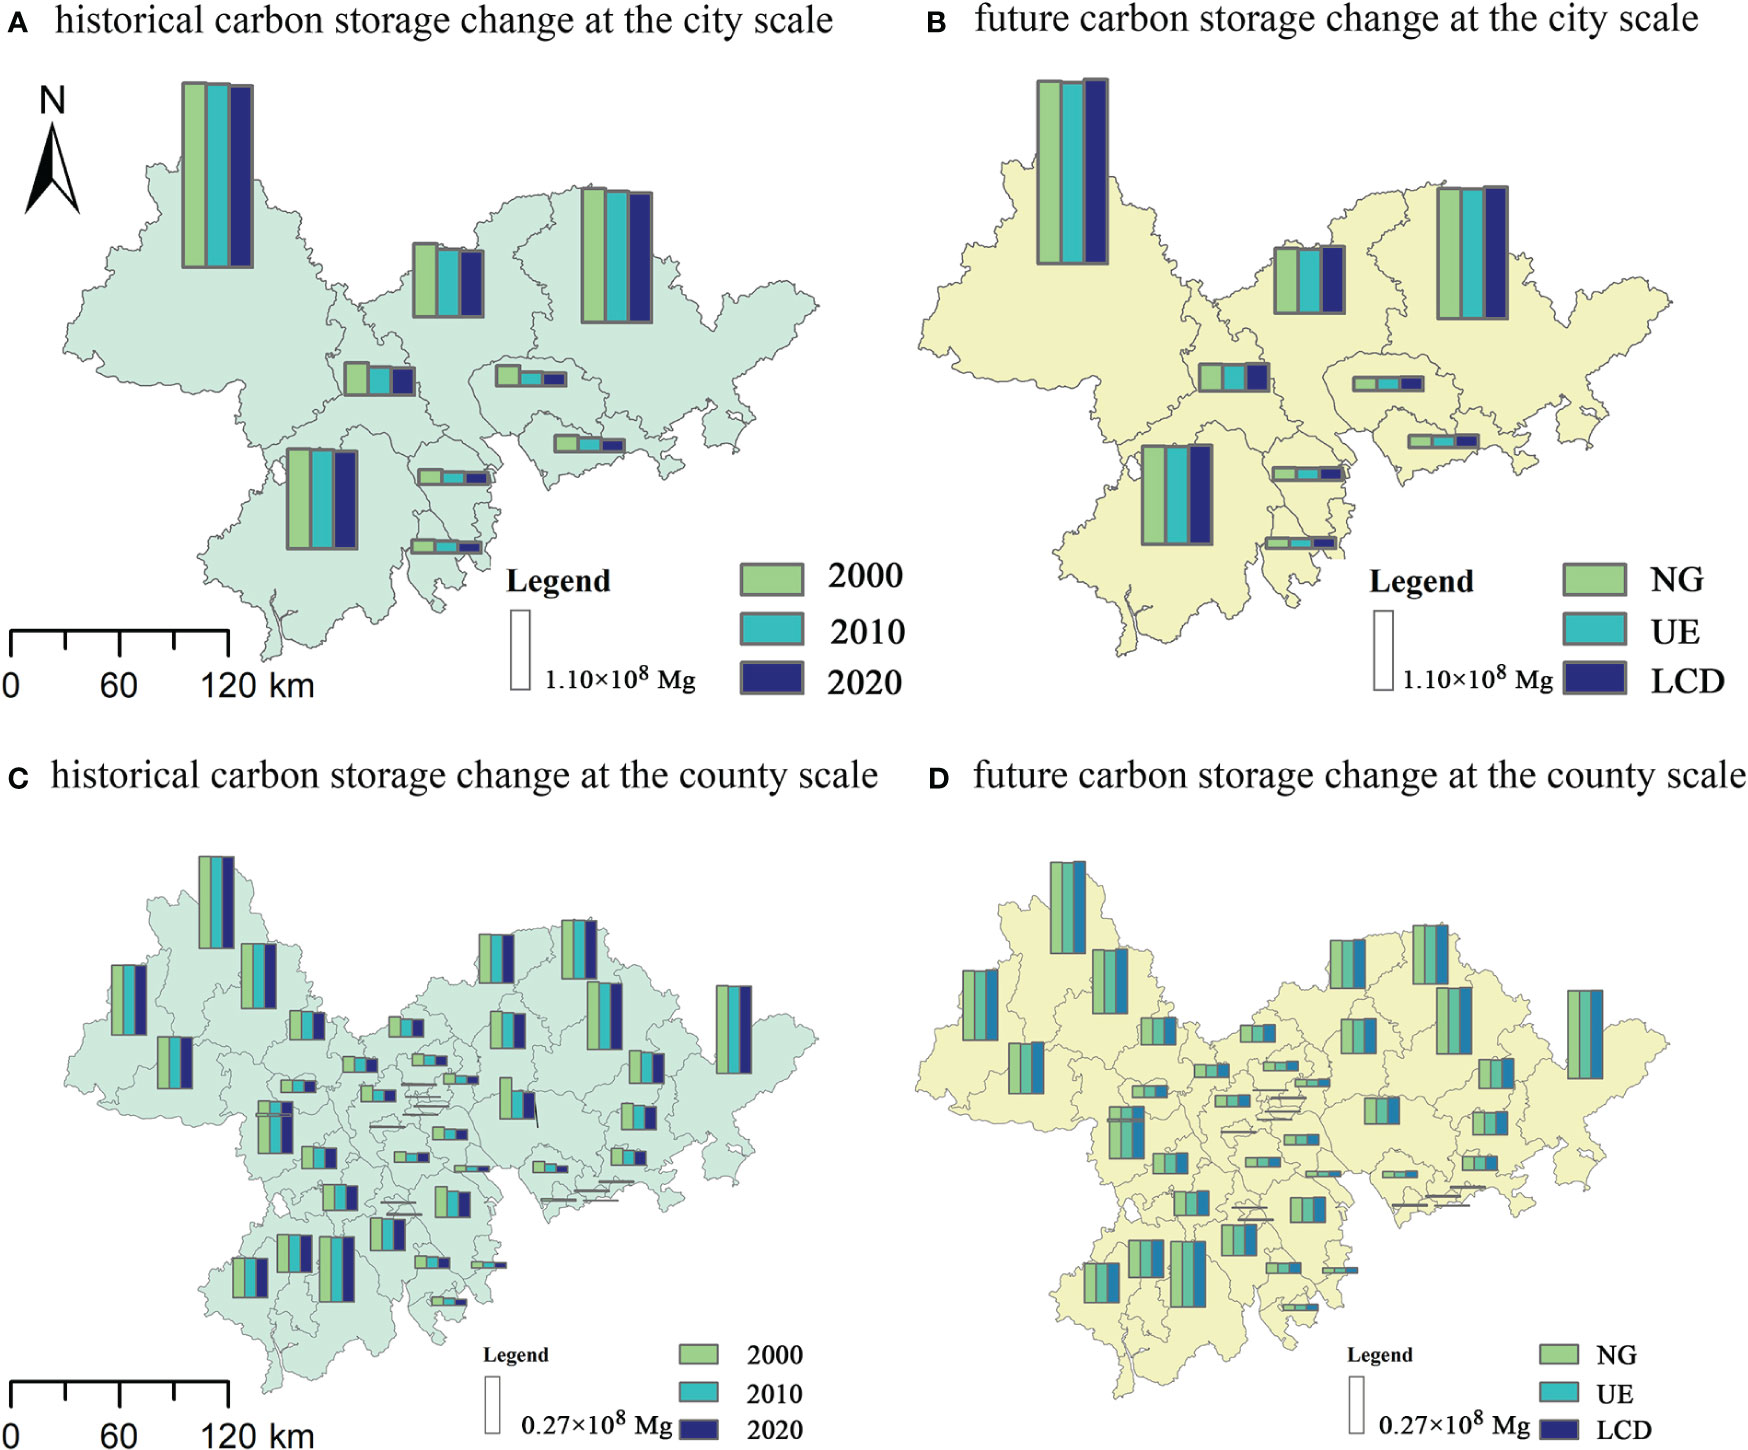
Figure 6 Carbon storage change at city and county scale during 2000–2030.
At the county scale, we found a decrease in carbon storage of all counties during 2000–2010 (excluding Fengkai) and a continuing decline from 2010 to 2020 (excluding Futian, Shunde, and Yuexiu) (Figure 6). From 2000 to 2010, there were significant carbon storage changes in Liwan, Dancheng, Dongguan, Haizhu, Nanhai, and other places (decline rates > 25%). From 2010 to 2020, there were significant carbon storage changes in Liwan and Bao’an (decline rates > 25%). In 2030, the carbon storage followed the order NG > UE > LCD (Figure 7D), indicating that LCD can protect against carbon storage loss. From 2020 to 2030, carbon storage had different decreasing rates. Slight differences (less than 1.00×10⁶ Mg) under the NG and LCD scenarios were found in Yuexiu, Zengcheng, Dancheng and Liwan. Significant differences (greater than 5.00×10⁷ Mg) were observed in counties such as Deqing and Guangning.
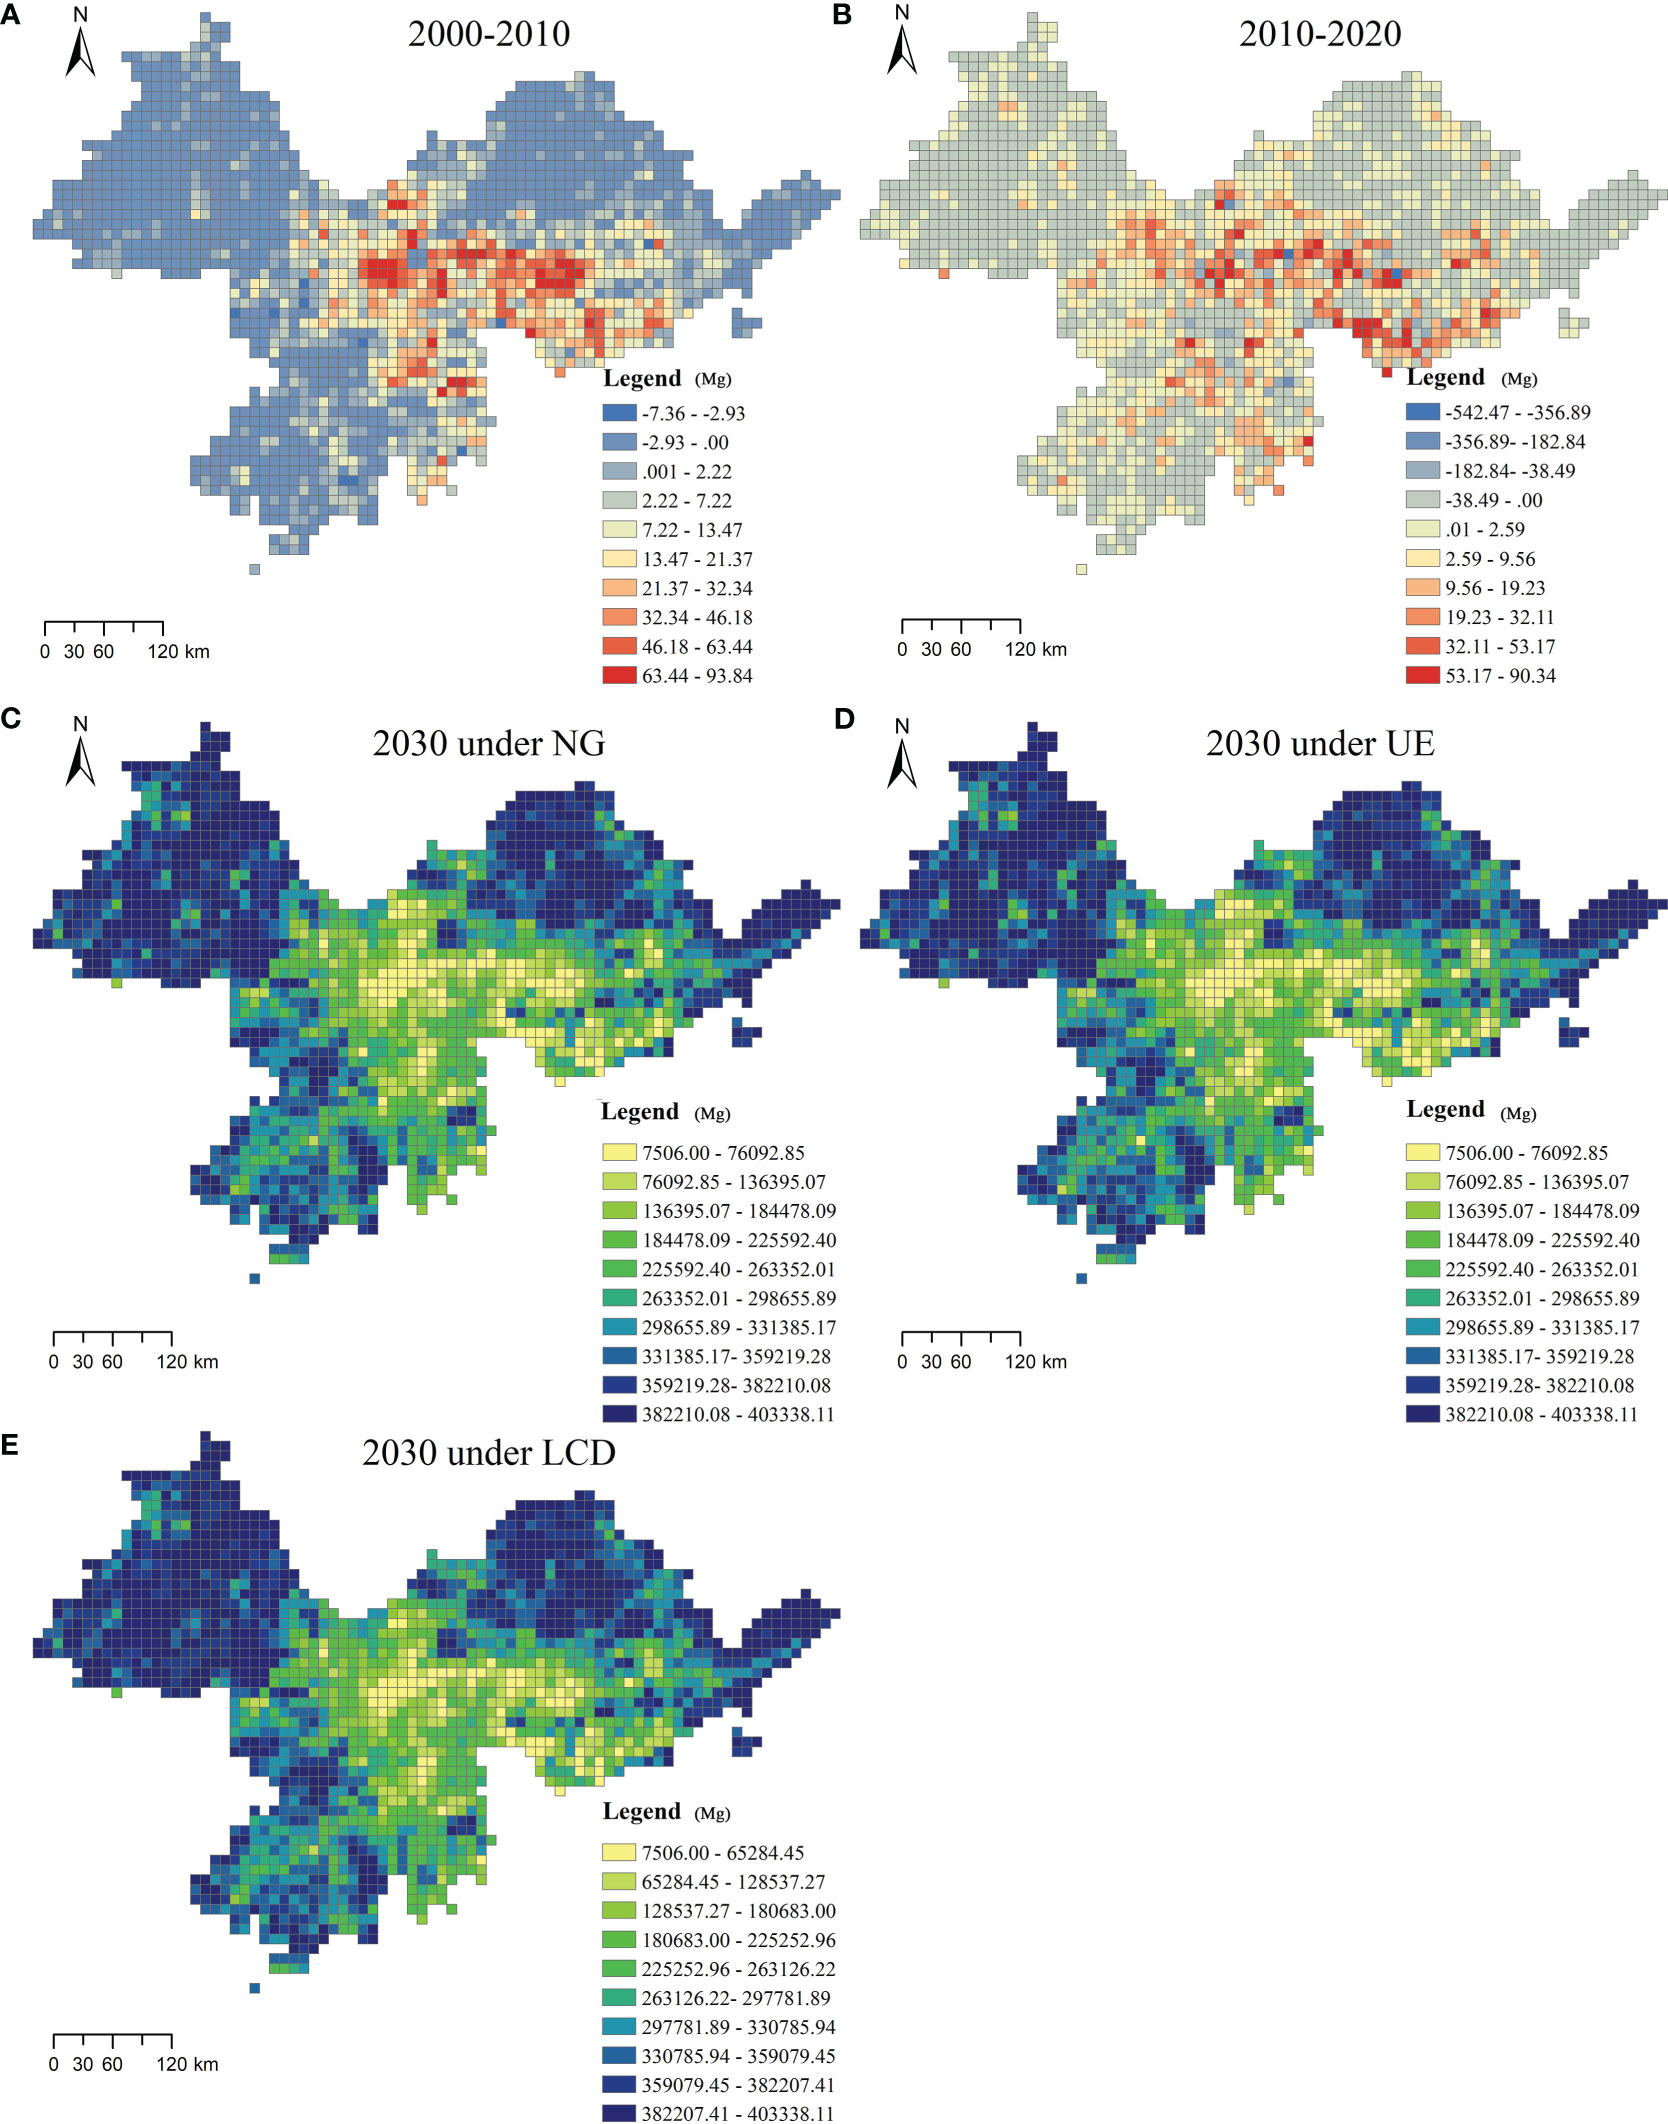
Figure 7 Historical carbon storage change and spatial distribution of future carbon storage at the grid scale.
At the grid scale (5 km×5 km), the decline rate of carbon storage was classified into ten categories (Figure 7). From 2000 to 2010, significantly changed areas were observed in the central of Guangzhou, Dongguan, Shenzhen, Foshan, and Jiangmen. Most of the marginal areas, carbon storage experienced slightly increased (vary 0 to 2.93×10⁶ Mg). From 2010 to 2020, significantly changed areas were witnessed in the suburbs of megacities (Guangzhou, Dongguan, and Shenzhen). Rare areas in the central cities increased remarkable. More areas of the marginal areas tend to slight reduction in carbon storage (vary 0 to 2.59×10⁶ Mg). In 2030, carbon storage was classified into ten categories (Figure 7). The distribution of the categories was similar under different development scenarios, indicating that the variation in carbon storage was less marginal.
3.4 Autocorrelation analysis of carbon storage
Local indicators of spatial association in carbon storage in the PRDUA are shown in Figure 8. The results show that the historical (2000, 2010, and 2020) and future (NG, UE, and LCD) carbon storage patterns are similar. The northwest and northeast higher carbon storage, and the central part distributed lower carbon storage.
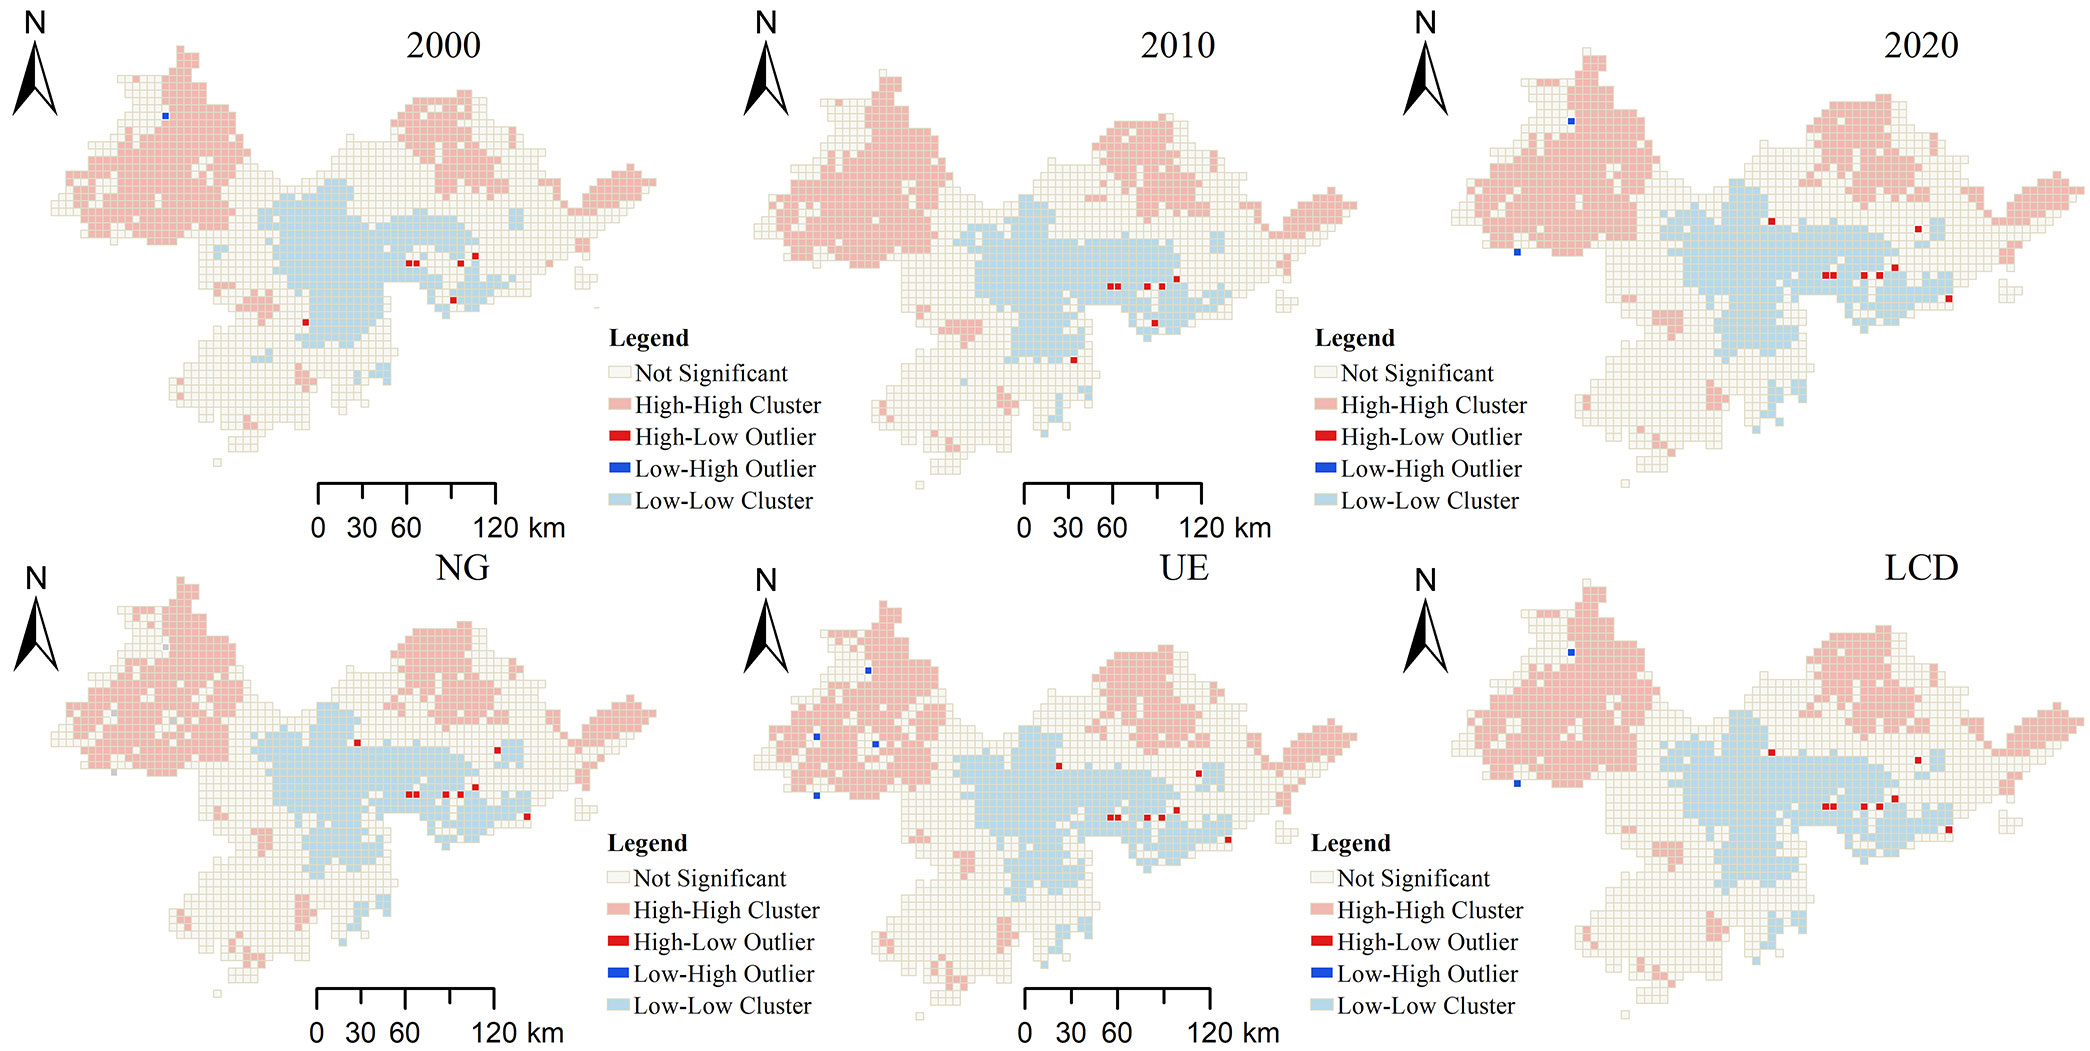
Figure 8 Cluster patterns of carbon storage.
4 Discussion
4.1 The impact of land use change on carbon storage
The Pearl River Delta region lies in an alluvial plain, which is beneficial to land use and development. Another major regional advantage is its adjacent position to the South China Sea, which promotes foreign trade. Additionally, the PRDUA was the first region in China to open up and attract outsiders. The combination of these factors stimulated urbanization and accelerated land use change. From 2000 to 2020, construction land increased by 90.22%. However, the increase in construction land gradually slowed over time (64.58% during 2000–2010; 15.58% during 2010–2020). Previous studies have been illustrated that urban expansion came at the expense of farmland in China, especially the urban agglomeration (Gao and Wang, 2019; Li et al., 2022b). This indicates that with the launch of the Reform and Opening Up policy, the economy prospered and urbanization accelerated; thus, construction land exhibited continuous expansion. It is expected that with the roll out of the Guangdong–Hong Kong–Macao Greater Bay Area Outline Development Plan and the High Quality Economic Development Plan, the economy of the PRDUA will further develop, land use efficiency will improve, and construction land will increase at a relatively low speed in the future. From 2000 to 2010, only 14.60 km2 of construction land was converted into forestland (9.61 km2) and waterbodies (4.99 km2). However, significant conversion of construction land occurred during 2010–2020, including farmland (471.71 km2), forestland (263.54 km2), waterbodies (167.21 km2), and grassland (63.74 km2). After the 2000s, the Chinese government implemented many ecological protection and restoration policies to balance economic development and environmental protection, such as ecological protection redlines, urban development boundaries, and foundation farmland. Therefore, natural land use was protected to some extent.
Different development strategies influenced land use change to varying degrees. According to our results, the area of construction land would increase by 12.51%, 17.79%, and 2.99% under scenarios NG, UE, and LCD, respectively. Inevitably, farmland and forestland will further decrease. Area of forestland and grassland converted to construction land decreases significantly under LCD. This means that ecological land will further be protected under LCD. Therefore, it is necessary to optimize urban development patterns by reasonably controlling the scale of megacities and promoting the development of medium-sized cities. High-quality economic development also needs to be achieved, including through industrial upgrading and land use efficiency improvement. Additionally, the protection of important ecological functional areas should be strengthened, and ecosystem function should be improved.
Urbanization has a multiscale impact on ecosystem carbon storage (Zhou et al., 2022; Li et al., 2023). On the one hand, urban expansion occupied the surrounding forestland, and farmland caused a great loss of carbon storage and sequestered belowground carbon. As cities become forested, carbon storage is compensated to some extent. On the other hand, areas far from cities tend to recover with reduced human pressure because cities attract more residents. The patterns, variation, and amount of carbon storage from 2000 to 2020 were consistent with previous studies (Liu et al., 2023; Zhang et al., 2023). Loss of forestland and farmland will cause great loss of carbon storage. Conversions of forestland to agricultural and construction land have significantly reduced carbon storage, mainly in Guangzhou-Dongguan and Shenzhen’s northern regions. Our results provide further understanding of how carbon storage loss is related to land use change at the city, county, and grid scales and call for enhanced land use management.
Carbon storage tends to drop, varying from 0.35% to 2.60% in the three scenarios, and the LCD scenario had the lowest loss of carbon storage. The decline rate under the LCD scenario is 0.22×10⁶ Mg/y, which is lower than that under the harmonious development scenario in the Yangtze River Delta and under the gold scenario in the Beijing–Tianjin–Hebei Urban Agglomeration (Gao and Wang, 2019; Wu et al., 2023). Thus, optimizing the carbon compensation mechanism, strengthening ecosystem management, and improving carbon sinks can be treated as supplementary measures to achieve regional carbon neutrality.
4.2 Zone development strategy
Carbon storage in terrestrial ecosystems can be affected by natural factors as well as by human activity (Sun et al., 2022; Wu et al., 2023; Zhang et al., 2023). Land use decisions need to incorporate the multiscale effects of land use on carbon storage(Liu et al., 2022a; Liu et al., 2022b). The future carbon storage differences followed the order “county scale > city scale > grid scale” (Table 5). The future carbon storage at same sclae under different scenarios followed the order “UE > NG > LCD”. In this study, we quantified the future carbon storage and its dynamics at city scale, county scale, and grid scale.
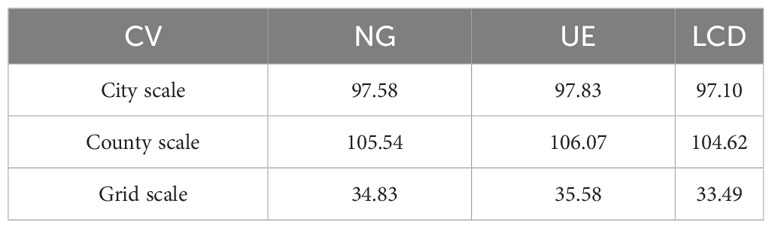
Table 5 Coefficient of variation (CV) of future carbon storage at multi scales.
At the city scale, it should integrate the development of metropolitan areas and enhance cooperation among the cities of inner metropolitan areas, such as the Guangzhou–Foshan–Zhaoqing megalopolis, Shenzhen–Dongguan–Huizhou megalopolis, and Zhuhai–Zhongshan–Jiangmen megalopolis. Urban development positioning, industrial synergy and complementarity, and land use complementation and coordination need to be comprehensively considered in land use planning. According to our results, urban expansion in Zhaoqing, Huizhou, and Jiangmen should be restricted. However, Dongguan, Shenzhen, Guangzhou, and Zhongshan witnessed rapid declines in carbon storage since 2000. The differences in carbon storage of the above cities under future scenarios are small, which indicates that the regulation capacity is limited. Dispersed green land within urban areas may be suitable for maintaining carbon storage.
At the county scale, optimized land use structure can be implemented to maintain carbon storage. Land resources should be reasonably utilized according to the land use structure of counties and their development goals. In counties with carbon sinks, such as Huidong County, carbon storage experienced little decline under LCD. The current land use patterns should promote the maintenance and development of low-carbon industries. Natural land (forestland, wetland and grassland) must be protected. For counties with a high decline in carbon storage under the LCD scenario, such as Guangning County, ecological restoration, for example, returning farmland to forestland, is recommended. For counties with sharp declines in carbon storage and a high urbanization rate, such as Huicheng County, it is wise to reasonably plant during urban construction renewal.
At the grid scale, forestland, grassland, and wetland should be strictly protected to avoid urban expansion. Moreover, science-based ecosystem management needs to be strengthened to enlarge the carbon storage capacity. For farmland, the area of farmland will continuously decrease under future scenarios. However, the Chinese government has permanently established a foundation farmland scheme that does not allow farmland loss. Therefore, intentionally directing urban expansion, such as toward the occupation of low-quality farmland, can prevent great loss of carbon storage. Additionally, the development of multifunctional farmland, including production, living, and ecological functions, is encouraged. For construction land, the primary task is to improve production efficiency. However, mine restoration should be implemented to leave space for ecological land.
4.3 Limitations and future research
Some limitations must be noted. First, the influencing factors at multiple scales require further study. Second, more field surveys are still needed to determine carbon density and eventually improve the estimation accuracy. Moreover, the InVEST model ignores the function of ecosystem management, which can effectively increase the carbon sink of forestland, grassland, and wetland. Third, partitioned simulation not only improves the accuracy of land use simulation but can also provide greater guidance for national spatial planning (Feng et al., 2019). Additionally, it can also reduce the uncertainty due to spatial heterogeneity. Furthermore, how climate change impacts land use and carbon density is worthy of further investigation to better understand ecosystem climate adaptation. Nevertheless, we found that the carbon storage decreased by 46.56 Tg and the decline rates became slow during 2000-2020. The carbon storage tend to decrease with decline rates varing from 0.35% to 2.60% under different development scenarios. At multi scales (city scale, county scale, and grid scale), the future carbon storage represents different characteristics. In future, policymakers should focus on the multiscale effects of land use change on carbon storage: such as integrate the development of metropolitan areas and enhance cooperation among the cities of inner metropolitan areas at city scale, optimized land use structure at county scale, and science-based ecosystem management for adding carbon sinks at grid scale. It is necessary to strictly comply with various ecological protection boundaries, reasonably control the size of megacities, promote the development of small and medium-sized cities and implement ecological restoration.
5 Conclusions
This study explored the impact of land use changes on carbon storage across multiple scales in the PRDUA. The main conclusions can be summarize as follows.
(1) The construction land area increased by 2708.67 km2 and 1075.26 km2, during 2000–2010 and 2010–2020, respectively. In 2030, significant urban expansion will continue to take place with different characteristics under multi scenarios.
(2) Carbon storage in the PRDUA decreased by 46.56 Tg from 2000 to 2020. The decline rate of carbon storage slowed during 2000-2020. The LCD (0.35%) scenario had a lower loss of carbon storage than the NG (1.76%) and UE (2.60%) scenarios.
(3) In the future development and construction, policymakers should enhance collaboration between regions, ensure ecological resources in areas with high carbon storage and concentration, reduce the intensity of urban land development and increase carbon sink in the core city.
Data availability statement
The original contributions presented in the study are included in the article/Supplementary Material. Further inquiries can be directed to the corresponding author.
Author contributions
DW: Conceptualization, Data curation, Funding acquisition, Software, Writing – original draft, Writing – review & editing. XL: Writing – original draft, Writing – review & editing. XW: Data curation, Methodology, Writing – original draft. MH: Data curation, Formal Analysis, Validation, Writing – original draft. WZ: Data curation, Formal Analysis, Methodology, Writing – review & editing. NX: Conceptualization, Funding acquisition, Methodology, Software, Writing – review & editing.
Funding
The author(s) declare financial support was received for the research, authorship, and/or publication of this article. This research was funded by Guangzhou Basic and Applied Basic Research Foundation (No. 2023A04J0945) and Basal Specific Research of the Central Public-Interest Scientific Institute (No. PM-zx703-202204-076).
Conflict of interest
The authors declare that the research was conducted in the absence of any commercial or financial relationships that could be construed as a potential conflict of interest.
Publisher’s note
All claims expressed in this article are solely those of the authors and do not necessarily represent those of their affiliated organizations, or those of the publisher, the editors and the reviewers. Any product that may be evaluated in this article, or claim that may be made by its manufacturer, is not guaranteed or endorsed by the publisher.
Supplementary material
The Supplementary Material for this article can be found online at: https://www.frontiersin.org/articles/10.3389/fevo.2023.1259369/full#supplementary-material
References
Baccini A., Walker W., Carvalho L., Farina M., Sulla-Menashe D., Houghton R. A. (2017). Tropical forests are a net carbon source based on aboveground measurements of gain and loss. Science 358, 230–233. doi: 10.1126/science.aam5962
Balaguer L. P., Garcia M., Reverte F. C., Ribeiro L. (2023). To what extent are ecosystem services provided by geodiversity affected by anthropogenic impacts? A quantitative study in Caraguatatuba, Southeast coast of Brazil. Land Use Pol. 131, 106708. doi: 10.1016/j.landusepol.2023.106708
Cai B., Zhang L. (2014). Urban CO2 emissions in China: Spatial boundary and performance comparison. Energy Policy 66, 557–567. doi: 10.1016/j.enpol.2013.10.072
Cao M., Tian Y., Wu K., Chen M., Chen Y., Hu X., et al. (2023). Future land-use change and its impact on terrestrial ecosystem carbon pool evolution along the Silk Road under SDG scenarios. Sci. Bull. 68, 740–749. doi: 10.1016/j.scib.2023.03.012
Chen X., Li F., Li X., Liu H., Hu Y., Hu P. (2021). Integrating ecological assessments to target priority restoration areas: A case study in the pearl river delta urban agglomeration, China. Remote Sens 13, 2424. doi: 10.3390/rs13122424
Chien S.-C., Krumins J. A. (2022). Natural versus urban global soil organic carbon stocks: A meta-analysis. Sci. Total Environ., 807. doi: 10.1016/j.scitotenv.2021.150999
Costanza R., de Groot R., Braat L., Kubiszewski I., Fioramonti L., Sutton P., et al. (2017). Twenty years of ecosystem services: How far have we come and how far do we still need to go? Ecosys. Serv. 28, 1–16. doi: 10.1016/j.ecoser.2017.09.008
Feng Y., Wang R., Tong X., Shafizadeh-Moghadam H. (2019). How much can temporally stationary factors explain cellular automata-based simulations of past and future urban growth? Comput. Environ. Urban Syst. 76, 150–162. doi: 10.1016/j.compenvurbsys.2019.04.010
Foley J. A., DeFries R., Asner G. P., Barford C., Bonan G., Carpenter S. R., et al. (2005). Global consequences of land use. Science 309, 570–574. doi: 10.1126/science.1111772
Friedlingstein P., Jones M. W., O’Sullivan M., Andrew R. M., Hauck J., Peters G. P., et al. (2019). Global carbon budget 2019. Earth Sys. Sci. Data 11, 1783–1838. doi: 10.5194/essd-11-1783-2019
Gao J., Wang L. (2019). Embedding spatiotemporal changes in carbon storage into urban agglomeration ecosystem management - A case study of the Yangtze River Delta, China. J. Clean. Product., 237, 117764. doi: 10.1016/j.jclepro.2019.117764
Gomes E., Inacio M., Bogdzevi K., Kalinauskas M., Karnauskait D., Pereira P. (2021). Future land-use changes and its impacts on terrestrial ecosystem services: A review. Sci. Total Environ., 781, 146716. doi: 10.1016/j.scitotenv.2021.146716
Guo W., Teng Y., Yan Y., Zhao C., Zhang W., Ji X. (2022). Simulation of land use and carbon storage evolution in multi-scenario: A case study in Beijing-Tianjin-Hebei urban agglomeration, China. Sustainability 14, 13436. doi: 10.3390/su142013436
Hong C., Burney J. A., Pongratz J., Nabel J. E. M. S., Mueller N. D., Jackson R. B., et al. (2021). Global and regional drivers of land-use emissions in 1961-2017. Nature 589, 554. doi: 10.1038/s41586-020-03138-y
Houghton R. A., Hackler J. L., Lawrence K. T. (1999). The US carbon budget: Contributions from land-use change. Science 285, 574–578. doi: 10.1126/science.285.5427.574
Li J., Guldmann J. M., Gong J., Su H. (2023). Urban growth boundaries optimization under low-carbon development: Combining multi-objective programming and patch cellular automata models. J. Environ. Manage. 340, 117934. doi: 10.1016/j.jenvman.2023.117934
Li Q., Yu Y., Jiang X., Guan Y. (2019). Multifactor-based environmental risk assessment for sustainable land-use planning in Shenzhen, China. Sci. Total Environ. 657, 1051–1063. doi: 10.1016/j.scitotenv.2018.12.118
Li X., Chen G., Zhang Y., Yu L., Du Z., Hu G., et al. (2022a). The impacts of spatial resolutions on global urban-related change analyses and modeling. Iscience 25, 105660. doi: 10.1016/j.isci.2022.105660
Li X., Luo Y., Wu J. (2022b). Decoupling relationship between urbanization and carbon sequestration in the pearl river delta from 2000 to 2020. Remote Sens. 14, 526. doi: 10.3390/rs14030526
Liang X., Guan Q., Clarke K. C., Liu S., Wang B., Yao Y. (2021). Understanding the drivers of sustainable land expansion using a patch-generating land use simulation (PLUS) model: A case study in Wuhan, China. Comput. Environ. Urban Syst. 85, 101569. doi: 10.1016/j.compenvurbsys.2020.101569
Liu X., Huang Y., Xu X., Li X., Li X., Ciais P., et al. (2020). High-spatiotemporal-resolution mapping of global urban change from 1985 to 2015. Nat. Sustain. 3, 564. doi: 10.1038/s41893-020-0521-x
Liu W., Liu D., Liu Y. (2023). Spatially heterogeneous response of carbon storage to land use changes in pearl river delta urban agglomeration, China. Chin. Geogr. Sci. 33, 271–286. doi: 10.1007/s11769-023-1343-3
Liu J., Peng K., Zuo C., Li Q. (2022b). Spatiotemporal variation of land-use carbon emissions and its implications for low carbon and ecological civilization strategies: Evidence from Xiamen-Zhangzhou-Quanzhou metropolitan circle, China. Sustain. Cities Soc. 86, 104083. doi: 10.1016/j.scs.2022.104083
Liu L., Wu J. (2022). Scenario analysis in urban ecosystem services research: Progress, prospects, and implications for urban planning and management. Landscape Urban Plann. 224, 104433. doi: 10.1016/j.landurbplan.2022.104433
Liu W., Zhan J., Zhao F., Wang C., Zhang F., Teng Y., et al. (2022c). Spatio-temporal variations of ecosystem services and their drivers in the Pearl River Delta, China. J. Clean. Product. 337, 130466. doi: 10.1016/j.jclepro.2022.130466
Liu H., Zhang M., Du J., Zhou Y., Yi Y. (2022a). Exploring zonation strategy in land management of urban agglomeration. Ecol. Indic. 145, 109664. doi: 10.1016/j.ecolind.2022.109664
Nie W., Bin Xu B., Yang F., Shi Y., Liu B., Wu R., et al. (2023). Simulating future land use by coupling ecological security patterns and multiple scenarios. Sci. Total Environ. 859, 160262. doi: 10.1016/j.scitotenw.2022.160262
Piao S., Fang J., Ciais P., Peylin P., Huang Y., Sitch S., et al. (2009). The carbon balance of terrestrial ecosystems in China. Nature 458, 1009–U1082. doi: 10.1038/nature07944
Pontius R. G., Schneider L. C. (2001). Land-cover change model validation by an ROC method for the Ipswich watershed, Massachusetts, USA. Agric. Ecosyst. Environ. 85, 239–248. doi: 10.1016/S0167-8809(01)00187-6
Searchinger T. D., Wirsenius S., Beringer T., Dumas P. (2018). Assessing the efficiency of changes in land use for mitigating climate change. Nature 564, 249. doi: 10.1038/s41586-018-0757-z
Sun X., Lian W., Gao T., Chen Z., Duan H. (2023). Spatial-temporal characteristics of carbon emission intensity in electricity generation and spatial spillover effects of driving factors across China?s provinces. J. Clean. Product. 405, 136908. doi: 10.1016/jjclepro.2023.136908
Sun X., Wu J., Tang H., Yang P. (2022). An urban hierarchy-based approach integrating ecosystem services into multiscale sustainable land use planning: The case of China. Resour. Conserv. Recycling 178, 106097. doi: 10.1016/j.resconrec.2021.106097
Van Asselen S., Verburg P. H. (2013). Land cover change or land-use intensification: simulating land system change with a global-scale land change model. Glob. Change Biol. 19, 3648–3667. doi: 10.1111/gcb.12331
Wang X., Wen Y., Liu X., Wen D., Long Y., Zhao P., et al. (2021). Protection effect and vacancy of the ecological protection redline: A case study in Guangdong-Hong Kong-Macao greater bay area, China. Remote Sens 13, 5171. doi: 10.3390/rs13245171
Wu W., Xu L., Zheng H., Zhang X. (2023). How much carbon storage will the ecological space leave in a rapid urbanization area? Scenario analysis from Beijing-Tianjin-Hebei Urban Agglomeration. Resour. Conserv. Recycling 189, 106774. doi: 10.1016/j.resconrec.2022.106774
Yang M., Gao X., Siddique K. H. M., Wu P., Zhao X. (2023). Spatiotemporal exploration of ecosystem service, urbanization, and their interactive coercing relationship in the Yellow River Basin over the past 40 years. Sci. Total Environ. 858, 159757. doi: 10.1016/j.scitotenv.2022.159757
Zhang D., Huang Q., He C., Yin D., Liu Z. (2019). Planning urban landscape to maintain key ecosystem services in a rapidly urbanizing area: A scenario analysis in the Beijing-Tianjin-Hebei urban agglomeration, China. Ecol. Indic. 96, 559–571. doi: 10.1016/j.ecolind.2018.09.030
Zhang Z., Jiang W., Peng K., Wu Z., Ling Z., Li Z. (2023). Assessment of the impact of wetland changes on carbon storage in coastal urban agglomerations from 1990 to 2035 in support of SDG15.1. Sci. total Environ. 877, 162824–162824. doi: 10.1016/j.scitotenv.2023.162824
Zhang Z., Li J. (2022). Spatial suitability and multi-scenarios for land use: Simulation and policy insights from the production-living-ecological perspective. Land Use Pol. 119, 106219. doi: 10.1016/j.landusepol.2022.106219
Zhang J., Li X., Zhang C., Yu L., Wang J., Wu X., et al. (2022). Assessing spatiotemporal variations and predicting changes in ecosystem service values in the Guangdong-Hong Kong-Macao Greater Bay Area. Gisci. Remote Sens. 59, 184–199. doi: 10.1080/15481603.2021.2022427
Zhao Y., Xie D., Zhang X., Ma S. (2021). Integrating spatial markov chains and geographically weighted regression-based cellular automata to simulate urban agglomeration growth: A case study of the Guangdong-Hong Kong-Macao greater bay area. Land 10, 633. doi: 10.3390/land10060633
Zhou W., Yu W., Qian Y., Han L., Pickett S. T. A., Wang J., et al. (2022). Beyond city expansion: multi-scale environmental impacts of urban megaregion formation in China. Natl. Sci. Rev. 9, nwab107. doi: 10.1093/nsr/nwab107
Keywords: land use change, PLUS, carbon storage, scenario simulation, urban expansion
Citation: Wen D, Li X, Wang X, Hong M, Zhou W and Xu N (2023) Evaluating the impact of multi scenario land use change simulation on carbon storage at different scales: a case study of Pearl River Delta Urban Agglomeration. Front. Ecol. Evol. 11:1259369. doi: 10.3389/fevo.2023.1259369
Received: 15 July 2023; Accepted: 27 October 2023;
Published: 13 November 2023.
Edited by:
Ümüt Halik, Xinjiang University, ChinaCopyright © 2023 Wen, Li, Wang, Hong, Zhou and Xu. This is an open-access article distributed under the terms of the Creative Commons Attribution License (CC BY). The use, distribution or reproduction in other forums is permitted, provided the original author(s) and the copyright owner(s) are credited and that the original publication in this journal is cited, in accordance with accepted academic practice. No use, distribution or reproduction is permitted which does not comply with these terms.
*Correspondence: Naizhong Xu, xunaizhong@scies.org