 Benjamin L. Orlinick
- Tyson Research Center, Washington University in Saint Louis, Eureka, MO, United States
Introduction: Vector-borne diseases (VBDs) are an increasingly important global health concern in the face of climate change. Understanding the ecology and evolution of vector species is critical to predicting and combating VBD. Vectorial capacity models, used to forecast disease transmission, traditionally assume traits are constant among populations, and little is known about whether different vector populations vary in thermal tolerance. To test for geographic variation in upper thermal tolerance, we determined the critical thermal maximum (CTmax) of Aedes albopictus, a globally distributed mosquito and competent vector for many viruses including West Nile, chikungunya, and dengue.
Methods: We studied CTmax for eight different populations spanning four climate zones across the Eastern United States using common garden experiments to isolate genetic variation. To explore potential drivers of this variation we then tested the relationship between climatic variables measured near each population source and CTmax.
Results: We found significant differences across populations for both adults and larvae, and these differences were more pronounced for adults. Larvae had higher CTmax values compared to adults. Several climatic variables improved models of CTmax for both adults and larvae including mean and max seasonal temperature, annual precipitation, and relative humidity. Annual precipitation appears to be particularly important and has a positive linear relationship with CTmax.
Discussion: The differences between life stages likely result from different selection pressures experienced in their terrestrial and aquatic habitats. Importantly, the assumption that mosquito populations within a species have the same upper thermal limits does not hold in this case, thus it is important to use population-specific CTmax values, among other important physiological parameters that may vary, to more accurately model and forecast VBDs.
Introduction
Vector-borne diseases (VBDs) pose an increasing public health threat in the face of unmitigated climate change. West Nile virus, chikungunya, and dengue are on the rise with warming temperatures, and the geographic distribution of vectors, as well as the pathogens they transmit, are expected to expand further poleward in this century (IPCC 2022). In recent years, there has been a threefold increase in the number of reported cases of disease from mosquito, flea, and tick bites in the United States alone (Centers for Disease Control and Prevention, 2018). While VBDs are a major public health concern in the US, the burden is much higher in other parts of the world with more suitable climates for vectors and poorer infrastructure to prevent outbreaks. Current estimates are that VBDs constitute 17% of infectious disease cases globally (World Health Organization, 2020), and while rising temperatures cannot be considered a primary driver of VBD on a global scale due to the influence of non-climatic factors (e.g. habitat destruction, urbanization, and poverty), climate change is expected to exacerbate current challenges (Rocklöv and Dubrow, 2020). Thus, understanding the thermal limits of mosquitoes is critical to predicting the spread of VBD in the coming decades.
Despite this, little is known about how different vector populations are adapted to their local climate, nor the potential for vectors to adapt to a rapidly changing climate (Couper et al., 2021; Lahondère and Bonizzoni, 2022). Standing genetic variation is essential for rapid adaptation to increasingly hostile environments (e.g. prolonged heat waves), and understanding if populations are locally adapted, or not, is important to accurately model how a given species will respond to rising temperatures. Vectorial capacity models currently assume no population differences in heat tolerance within a species, which limits predictions of future population and disease dynamics (Couper et al., 2021). Understanding intraspecific, genetic based differences in thermal tolerance for vectors has public health implications also but furthers our broader understanding of adaptation to different climatic conditions along geographic and climatic gradients.
Extreme episodic temperatures can be a ubiquitous selective force on temperature limits and are thus important in generating differences in thermal tolerance (Parmesan et al., 2000; Sunday et al., 2019). With the 1 °C rise in average global temperatures since industrialization we now experience more extreme heat events and disrupted global precipitation patterns (Rocklöv and Dubrow, 2020). Importantly, heat tolerance is an important ecological constraint for any organism, but especially for ectotherms, and mass mortality events will likely become more common (Piatt et al., 2020). Mosquitoes are ectotherms with both aquatic and terrestrial life stages, so their physiology is directly impacted by the ambient temperature in a range of environments (Lahondère and Bonizzoni, 2022). The thermal breadth for any given organism can be represented graphically through a thermal performance curve (TPC), and the critical thermal maximum (CTmax) is the upper boundary of the curve. CTmax is generally defined as the upper temperature where an organism’s movement becomes uncoordinated and eventually immobile (Piyaphongkul et al., 2012; Oliveira et al., 2021). This study focuses on CTmax as a measure of tolerance to high temperatures in a globally invasive mosquito.
Surprisingly, population differences in CTmax have not been studied extensively in mosquitoes (but see Vorhees et al., 2013). There is evidence of local thermal adaptation and latitudinal clines in CTmax in many ectotherms, however. For example, population differences in CTmax have been recorded in ectotherms as disparate as the leaf cutter ant Atta cephalotes, the zooplankter Daphnia magna and larger species like many Iberian lizards (Geerts et al., 2015; Herrando-Pérez et al., 2019; Baudier and O’Donnell, 2020). Additionally, geographic clines and various climatic factors have been correlated with CTmax in some species suggesting different populations have the ability to adapt to local climates. Maximum summer air temperature corresponded with increased CTmax in D. magna along a latitudinal gradient (Geerts et al., 2015) and heat tolerance and latitude had an inverse relationship in Drosophila melanogaster (Hoffmann et al., 2002; Sternberg and Thomas, 2014). In addition, temperature seasonality could be a possible predictor of CTmax; for example, CTmax was weakly negatively associated with temperature seasonality in the Mediterranean fruit fly Ceratitis capitata (Weldon et al., 2018). Heat resistance in Drosophila spp. also shows a negative association with annual precipitation, signaling this as an important climatic factor in predicting CTmax (Kellermann et al., 2012). In the mosquito Culex tarsalis, CTmax differed significantly by population, and correlated positively with average daily max temperature but not daily mean temperature (Vorhees et al., 2013). Overall, predictors of CTmax vary across species, and likely in complicated ways, and it remains unclear how CTmax may be impacted by changing climatic factors and the mechanisms by which these correlations arise (Macdonald et al., 2018).
CTmax appears to have limited evolutionary lability and less variability across populations compared to critical thermal minima (CTmin) (Addo-Bediako et al., 2000; Sternberg and Thomas, 2014). In fact, many studies find little evidence of population differentiation in CTmax (Araújo et al., 2013; García-Robledo et al., 2016). Upper thermal tolerance may be limited by hard physiological boundaries like the destabilizing effects of heat on an organism’s membranes and proteins (Addo-Bediako et al., 2000; Araújo et al., 2013). Thermal tolerance is a complex trait, which is traditionally associated with low heritability (Couper et al., 2021), but it is important to acknowledge methodological limitations in calculating CTmax (Rezende et al., 2011; Santos et al., 2012; Castañeda et al., 2019; Leong et al., 2022). Longer assays with slower ramp rates can obscure the genetic component of CTmax and give an underestimate of thermal tolerance by introducing undue physiological stressors. Recent studies suggest that fast ramping rates give a more accurate picture of CTmax, by avoiding the confounding effects of desiccation, and are preferable when measuring the evolutionary potential of CTmax (Rezende et al., 2011; Santos et al., 2012; Castañeda et al., 2019).
The tiger mosquito, Aedes albopictus, is an invasive, container-breeding species present throughout much of the Eastern United States, and its range has continued to expand north since its invasion (Armstrong et al., 2017). Not only is Ae. albopictus an invasive species, but it is a competent vector of arboviruses, and is a nuisance in urban environments. A fair amount is known about how Ae. albopictus has adapted to the climate of the US during the winter months. For example, North American populations rapidly evolved a latitudinal cline in diapause incidence with higher diapause incidence and higher winter egg survival at higher latitudes near their range edge (Urbanski et al., 2012; Medley et al., 2019). Furthermore, Ae. albopictus has become established further north in the US than predicted by niche models suggesting rapid local adaptation despite substantial gene flow (Medley, 2010; Gloria-Soria et al., 2022). While diapause and winter survival have been well studied in this species, very little is known about their upper thermal tolerance.
In this paper, we tested for geographic variation in the upper thermal tolerance of Ae. albopictus. Specifically, we measured CTmax in Ae. albopictus adults and larvae from eight different populations spanning four climate zones across the eastern United States. Using common garden experiments, we tested these differences for both larvae (aquatic) and adults (terrestrial) to examine life stage differences that may result from different selection pressures. We predicted that adult male and female mosquitoes and adult and larval mosquitoes would differ in their CTmax. As aquatic organisms, mosquito larvae experience more thermal inertia than adults (Gray, 2013), which affects the magnitude of extreme temperatures and duration of exposure in these habitats. Moreover, it is important to consider that larvae are constrained to their container, whereas adults are mobile and thus may be able to escape extreme temperatures via behavioral thermoregulation or the use of microclimates (Barnes et al., 2019). To explore the potential drivers of differences in CTmax, we modeled the relationship between CTmax and several climatic variables that have been important for geographic differences in CTmax in other organisms (Rocca et al., 2009; Vorhees et al., 2013; Geerts et al., 2015; García-Robledo et al., 2016; Weldon et al., 2018; Sunday et al., 2019; Baudier and O’Donnell, 2020). Understanding CTmax is crucial for understanding population vulnerability to warming and future population dynamics (Deutsch et al., 2008; Sasaki and Dam, 2019; Couper et al., 2021) which has public health implications for vector species like Ae. albopictus.
Methods
Mosquito collections and colony maintenance
Aedes albopictus eggs were collected from eight locations spanning four climate zones across Ae. albopictus’ eastern range in the eastern United States. Climate zones are defined by the International Energy Conservation Code and are a composite of humidity, precipitation, and temperature patterns (see details at https://codes.iccsafe.org/content/IECC2012P5/chapter-3-ce-general-requirements). From North to South, the populations originated from Allegheny County, PA; Urbana, IL; College Park, MD; St. Louis, MO; Stillwater, OK; Huntsville, AL; New Orleans, LA; and St. Augustine, FL (Figure 1). Eggs were collected in the summer and fall of 2021 using black oviposition cups lined with seed germination paper. Within each location, eggs were collected from multiple sites, from multiple weeks, or both to ensure genetic diversity. A minimum of 200 individuals from each location were used to establish each colony. All field (F0) collected eggs were hatched in 0.3 g/L Difco™ nutrient broth with the resulting larvae reared in deionized water (DI) in the lab with ad libitum bovine liver powder (MP Biomedicals). Once pupated, containers were placed into 30.5 × 30.5 × 30.5 cm wire mesh cages, by population, and allowed to eclose freely. Once eclosed, adults were fed daily on defibrinated bovine blood which was tied into a ball in hog casing and warmed to 60°C. The blood ball was placed on top of the cage for feeding. Adults were given constant access to 10% sucrose solution delivered via cotton wicks. Black plastic cups filled with leaf infusion and lined with seed germination paper were placed in each cage to allow for oviposition. Water and papers were changed two times per week. All egg papers were allowed to dry, and stored, in clear plastic boxes kept at 80–95% relative humidity. All eggs, larvae, and adults were kept in environmental chambers set at a 16:8 light:dark photophase and 25°C. F1–F3 generations were reared with a standardized protocol to ensure that the larvae and adults used in our CTmax experiments came from the same nutritional starting point and to control for maternal effects. When larvae were ≤ 24h old, they were sieved from the nutrient broth solution and 400 1st instar larvae were counted and placed in clear plastic rearing pans with 3 L DI water and 0.6 g liver powder. On day 9, we added 0.3 g liver powder and fresh DI water to bring the volumes back to 3 L.
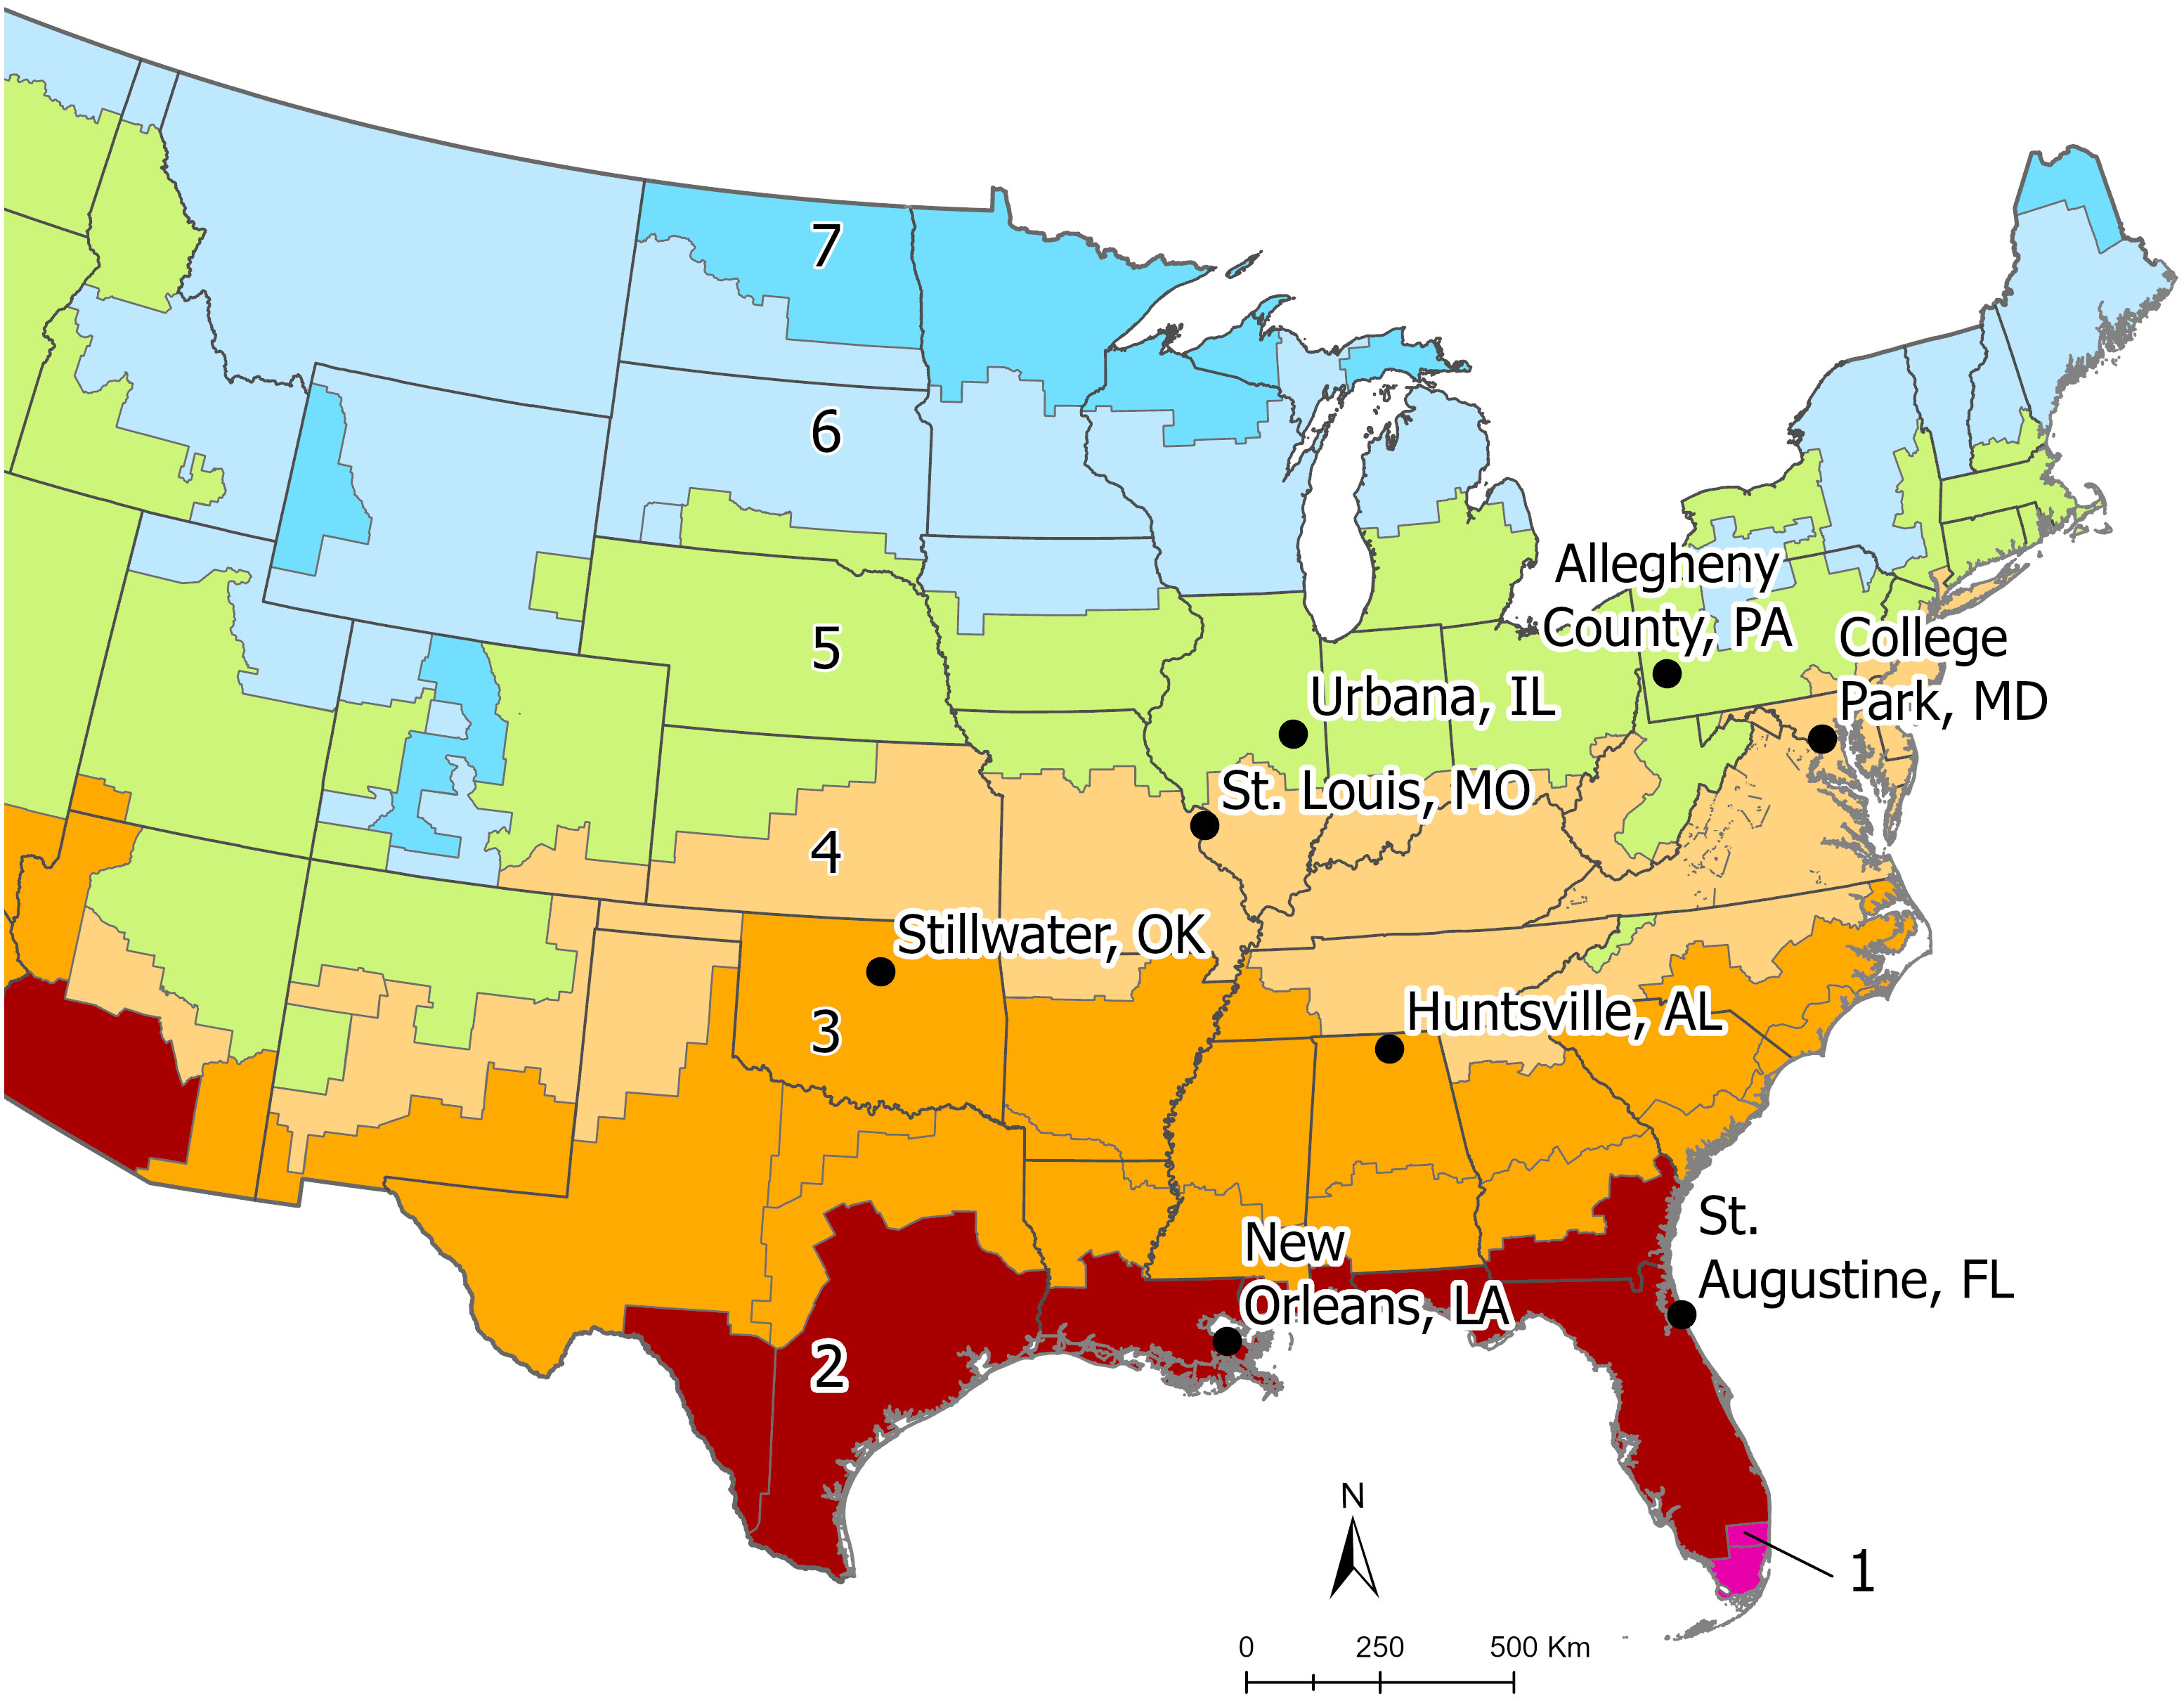
Figure 1 This map of the eastern United States illustrates the location for each Aedes albopictus population used in the common garden experiments. Each color indicates the range of a numbered climate zone. The sample populations ranged from climate zones 2 to 5 and originate in one of the eight sites indicated above. Climate zones are defined by the International Energy Conservation Code and are a composite of humidity, precipitation, and temperature patterns (see details at https://codes.iccsafe.org/content/IECC2012P5/chapter-3-ce-general-requirements).
CTmax trials
F4 eggs were hatched and divided into cohorts of five larvae with 10 replicates for each population (50 larvae total per population). These cohorts were reared in a 50 mL solution of DI water containing 1.5 mg of liver powder per larva which is analogous to the standard colony protocol described above. These cohorts were kept in environmental chambers set at a 16:8 light:dark photophase and 25°C and had their positions randomized every 48 hours to remove chamber location effects. For adult trials, pupae were removed and placed into vials filled halfway with DI water and plugged with cotton to ensure adequate space for the mosquito as a pupa and adult. Once pupae matured to adulthood, adults were aspirated and moved to an assigned cup for their cohort and fed 10% sugar water by volume on a cotton ball through a mesh screen. After 3–6 days individuals were sexed and a male and female from each cohort were randomly selected for trials. When conducting larval trials, an identical protocol was used, but one larva was randomly selected as a 4th instar for trials rather than allowing for pupation.
We observed individual CTmax using a dynamic ramping assay according to Castañeda et al. (2019), Mesas et al. (2021), and Oliveira et al. (2021). Assays were conducted by placing individual mosquitoes in 30 mL glass vials with a water-tight cap and immersing the vials into an 11L water bath. Adult vials contained only air whereas larval vials were filled with 25 mL of DI water. Air and water temperature inside the vials were measured using an aquarium thermometer placed in a single capped vial identical to those that contained individual mosquitoes. The water bath temperature started between 23°C and 26°C and trials began when air or water temperature in the vials stabilized. We selected a relatively fast ramp rate of 1°C/min for each trial to give us the best estimation of CTmax (Leong et al., 2022) and because we were able to have a very consistent ramp rate using a sous vide immersion circulator precision cooker (RidoHusi brand, 1100 watt, Model #MZJ-01). Since our primary objective for the study was detect genetic based differences in CTmax, having a highly consistent repeatable ramp rate for our common garden experiments was crucial. The sous vide allowed for quick heating of the water and provided significant agitation of the water to ensure consistent temperature throughout the water bath. During heating, vials were continually disturbed to assess mosquito movement. For adults, CTmax was determined when the mosquitoes were on their backs and no longer able to right themselves. Larvae tended to seize before CTmax, so CTmax was determined when there was no physical activity upon disturbance.
Climate data collection
To explore possible correlations between CTmax and climatic variables, we accessed NOAA National Centers for Environmental Information Climate Data Online datasets and downloaded data for each city of origin during the active 2021 mosquito season (April to September) which was the year Ae. albopictus were field collected. We selected variables based on the relationships between heat tolerance and climate in ectotherms, discussed above in the introduction, to determine which climate variables had the most explanatory power in our models. The 6 variables we compiled for each population were: mean temperature, mean maximum temperature, mean minimum temperature, the variance in maximum temperature, annual precipitation and average relative humidity. To avoid issues of multicollinearity among correlated climate variables we calculated the Variance Inflation Factor (VIF) using the 6 climate variables with latitude as a seventh variable. We removed the variable with the highest VIF until all variables had a VIF below 5. The remaining 5 variables which were used in models were: mean temperature, mean maximum temperature, the variance in maximum temperature, annual precipitation and average relative humidity (Table 1). Additionally, we compiled the maximum temperature recorded in 2021 to compare that to our empirically derived CTmax values (Table 1).
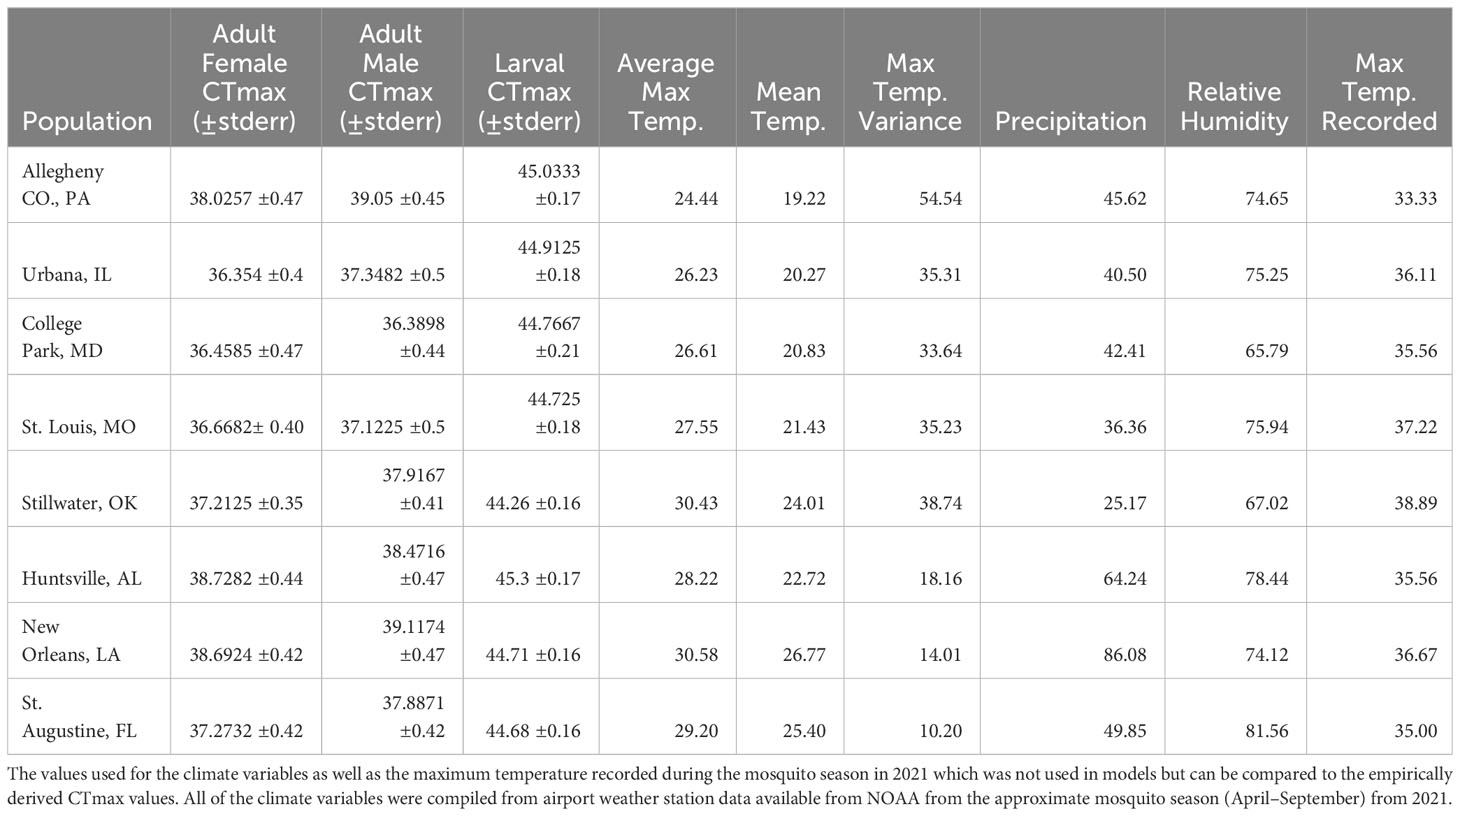
Table 1 LS means and standard errors for CTmax for adults and larvae.
For each site, airport weather stations were used: Allegheny County International Airport, Champaign Urbana Willard Airport, College Park International Airport, Stillwater Regional Airport, Cahokia St. Louis Downtown Airport, Huntsville International Airport, New Orleans Airport (Louis Armstrong), St Augustine Airport. Notably, however, College Park International Airport does not have precipitation data so data from the National Weather Service Beltsville Station was used, which is just over 6 km from College Park.
Statistical analysis
We tested for differences in CTmax by population using linear mixed models (LMM) with a normal distribution, with fixed effects of population, sex, and their interaction (adults) or population (larvae) with replicate as a random effect. We used the Bonferroni correction for multiple comparisons to compare among and within populations. We also used an LMM to test for differences between life stages, with the sexes pooled for adults, and population as a random effect.
Next, we built a set of models to test for the potential drivers of CTmax using the climate variables we compiled from NOAA. Models were ranked based on their AICc (Bedrick and Tsai, 1994). For these models, we tested up to 5 climate variables per model, and sex for adults, with models having progressively fewer variables, and a null model, until we arrived at the model with the lowest AICc. Due to our small sample size of individuals from each population (7–10 individuals per sex, life stage, and population) the models would not converge with population as a fixed effect so we added population as a random effect. We ran the models for adults and larvae separately. We did not include any interactions in these models due to the difficulty of biologically interpreting interactions between climatic covariates. We calculated the delta AICc and weight of evidence, which is interpreted as the probability that a model is actually the best model (Anderson, 2008; Burnham et al., 2011) to rank the models from most to least parsimonious and compared that to the null model to assess the model fit (Tables 2, 3). We considered any model with a delta AICc less than 2 as being a good fit for the data and present these models, and the null model at the top of Tables 2 and 3. We plotted the predicted versus observed CTmax values for all of the top models to obtain the Pearson Correlation Coefficient to further validate the fit of the models. These analyses were performed in SAS 9.4 using the GLIMMIX procedure except for the correlation coefficient that was obtained using the CORR procedure.
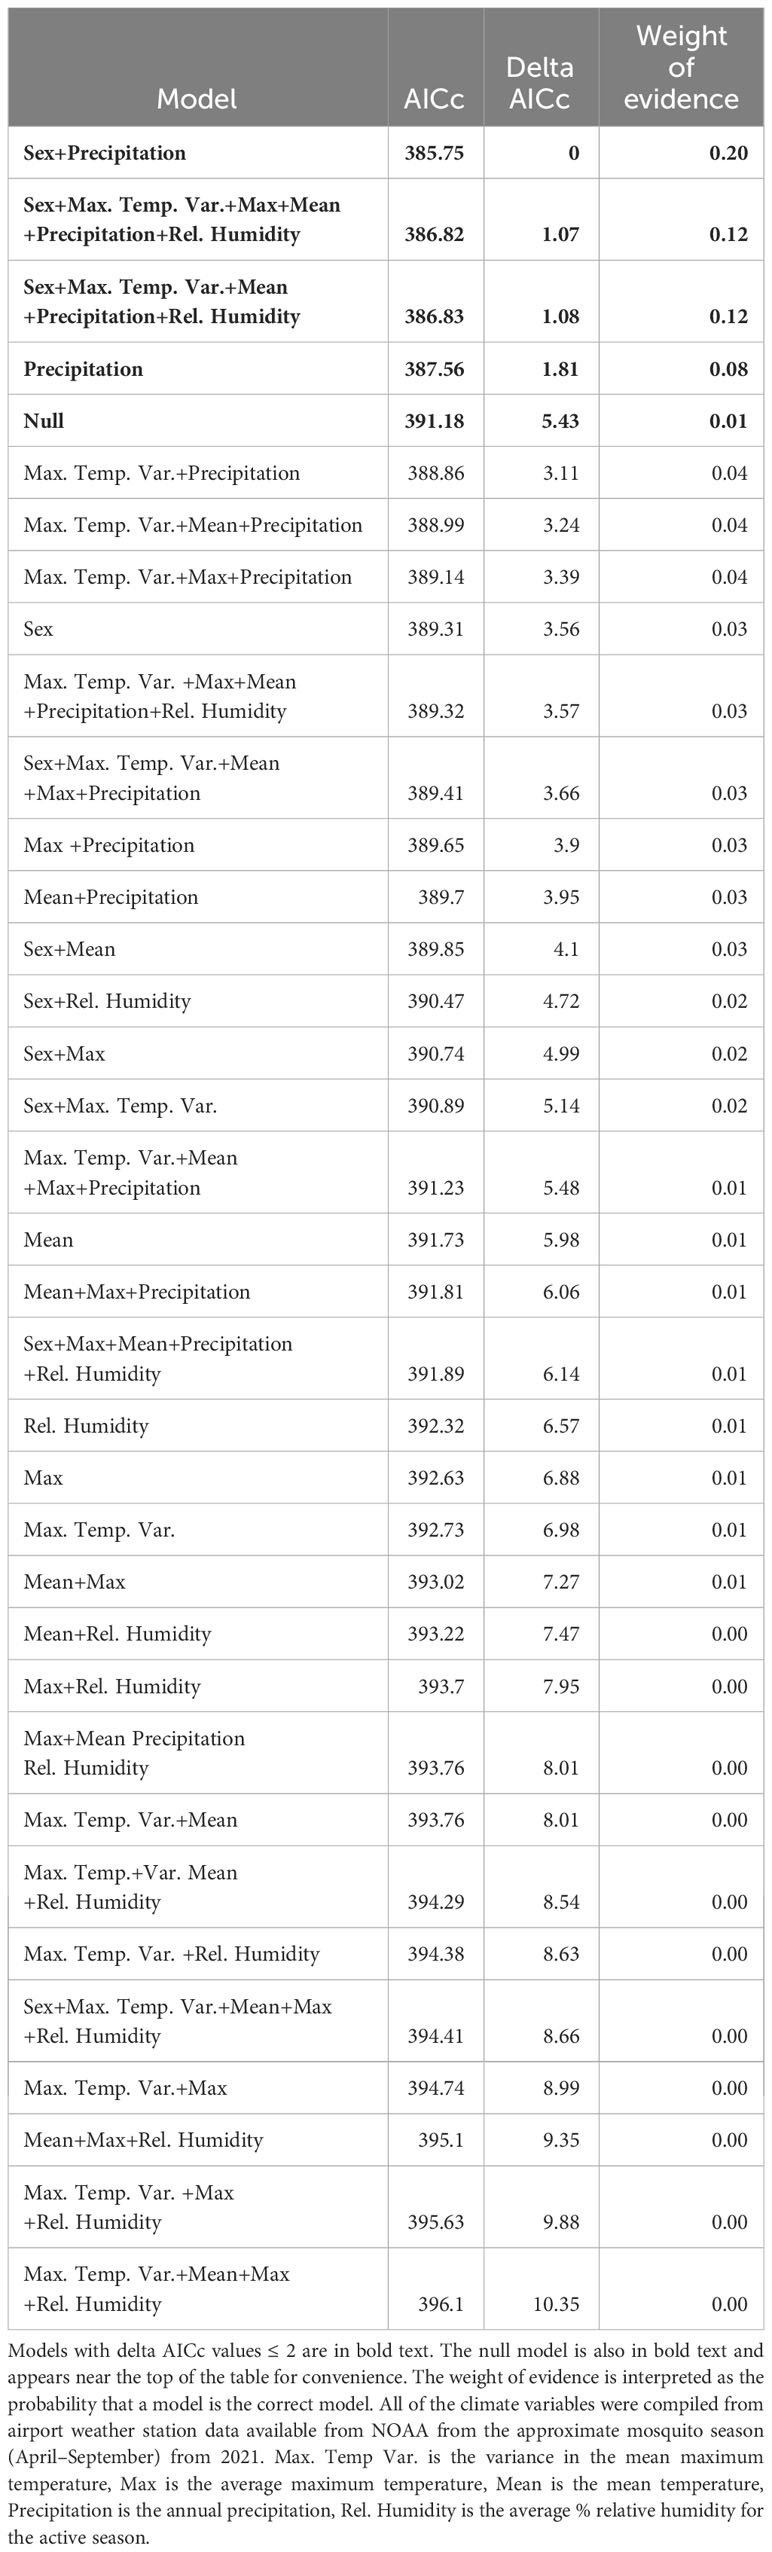
Table 2 Models of CTmax for adult mosquitoes, ranked by ascending AICc values.
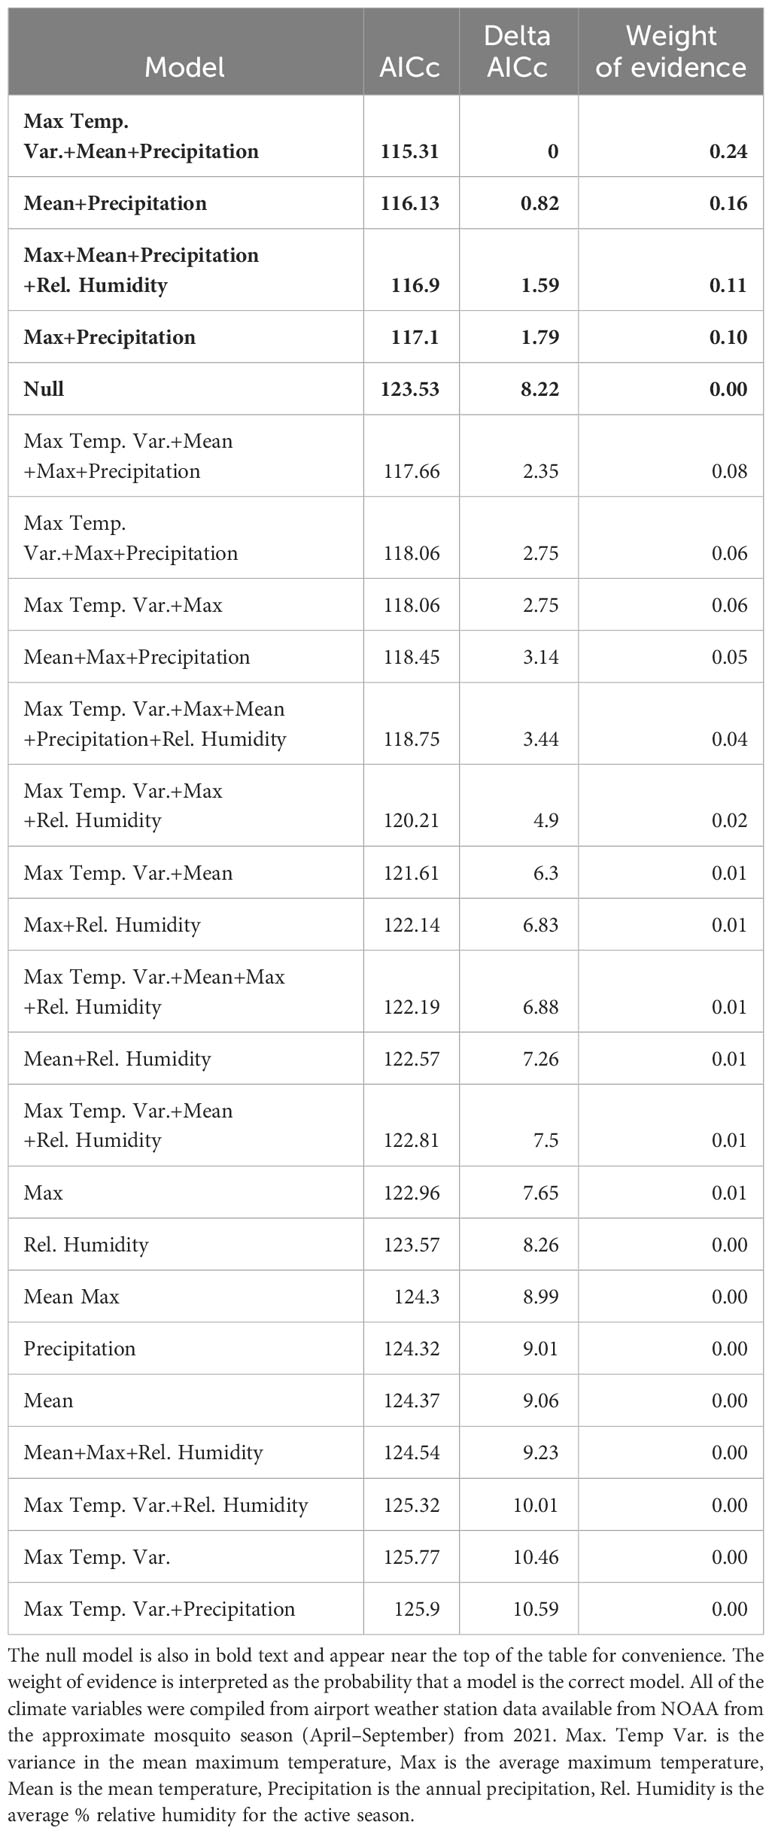
Table 3 Models of CTmax for larvae, ranked by ascending AIC values. The models with delta AIC values ≤ 2 are in bold text.
To complement the linear models, we used hierarchical variance partitioning (Lai et al., 2022) in the R package rdacca.hp to determine the relative importance of each predictor to CTmax for larvae and adults. We limited the analysis to predictors with a VIF < 5 from the linear mixed model analyses. We set the number of iterations at 10,000, where each iteration generated all possible combinations of predictors in a hierarchical model suite.
Results
We observed significant population differences in CTmax for adult Ae. albopictus (F7,83 = 11.14, P < 0.0001, Figure 2A). After adjusting for multiple comparisons, Allegheny males had a significantly higher CTmax than College Park males. Huntsville and New Orleans females also had a significantly higher CTmax than College Park, St. Louis, and Urbana females, but were not significantly different from each other (Table 1 and Figure 2A). Sex also had a significant effect on CTmax for adults (F1,83 = 6.74, P = 0.0111), with males having a 0.5°C higher mean CTmax than females (ls means and standard errors, 37.42 ± 0.27 vs. 37.92 ± 0.27). The interaction between population and sex was not significant (F7,83 = 0.72, P = 0.6582). We also observed significant differences by population for larvae (F7,52 = 3.57, P = 0.0033, Table 1, Figure 2B), but there were fewer significant pairwise differences for larvae compared to adults. Allegheny larvae had a significantly higher CTmax than larvae from Stillwater, and Huntsville larvae had a significantly higher CTmax than those from Stillwater (Table 1 and Figure 2B). Additionally, adults had a significantly lower mean CTmax compared to larvae (F1,174 = 1883.36, P < 0.0001; ls means and standard errors, 37.6 ± 0.23 vs. 44.78 ± 0.24). Adult Ae. albopictus populations varied by as much as 2.66 C for males and 2.37 C for females, whereas larvae varied by only 1.04 C (Table 1).
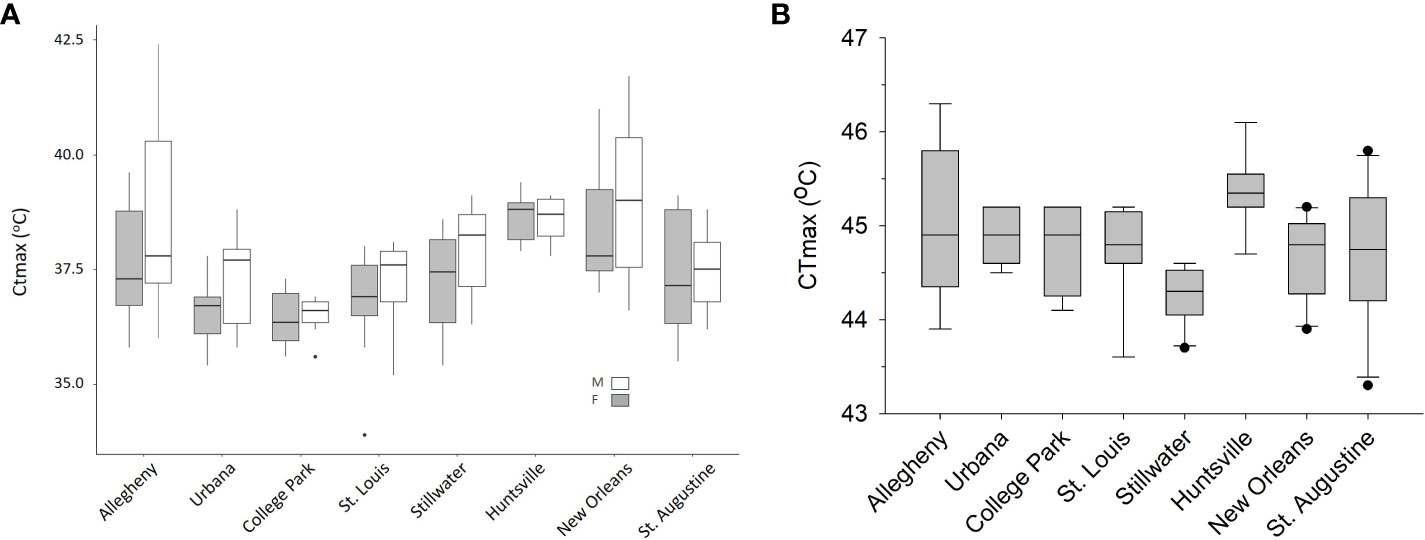
Figure 2 Box and whisker plots of CTmax values (A) by population and sex for adult mosquitoes and (B) by population for larvae. There were 7–10 individual mosquitoes tested for each population, sex, and life stage. Both graphs have populations ordered from North on the left to South on the right in a latitudinal cline.
For adults, there were 4 models with delta AICc scores less than 2 (Table 2) which indicates that they cannot be discounted as the best model as a rule of thumb. The top models performed better than the null model and always included annual precipitation and the model with the highest weight of evidence and lowest AICc contained only the effects of precipitation (F1,104 = 8.44, P = 0.0045), and sex (F1,104 = 4.08, P = 0.046) which were both significant. Two of the top models contained 5 or all 6 of the possible variables tested, however (Table 2). When we plotted the predicted CTmax values versus the actual values, all 4 top models had Pearson Correlation Coefficients greater than 0.5 indicating a strong correlation and good model fit. The model with the lowest AICc (sex and precipitation) also had the highest coefficient (0.5568, P < 0.0001). Precipitation accounted for >54% of the variation in adult CTmax in our hierarchical variance partitioning analysis (Figure 3A) which was 40% greater than next most important variable. The relationship between CTmax and precipitation was positive and linear for both sexes (Figure 4A). Due to the importance of precipitation in explaining adult CTmax, we wanted to confirm that the 2021 precipitation data we used in our analysis was not an anomalous year so we compiled the annual precipitation data for each population for ten years (2021–2011) to compare. The 2021 data and 10 year average data were highly correlated (R2 = 0.926).
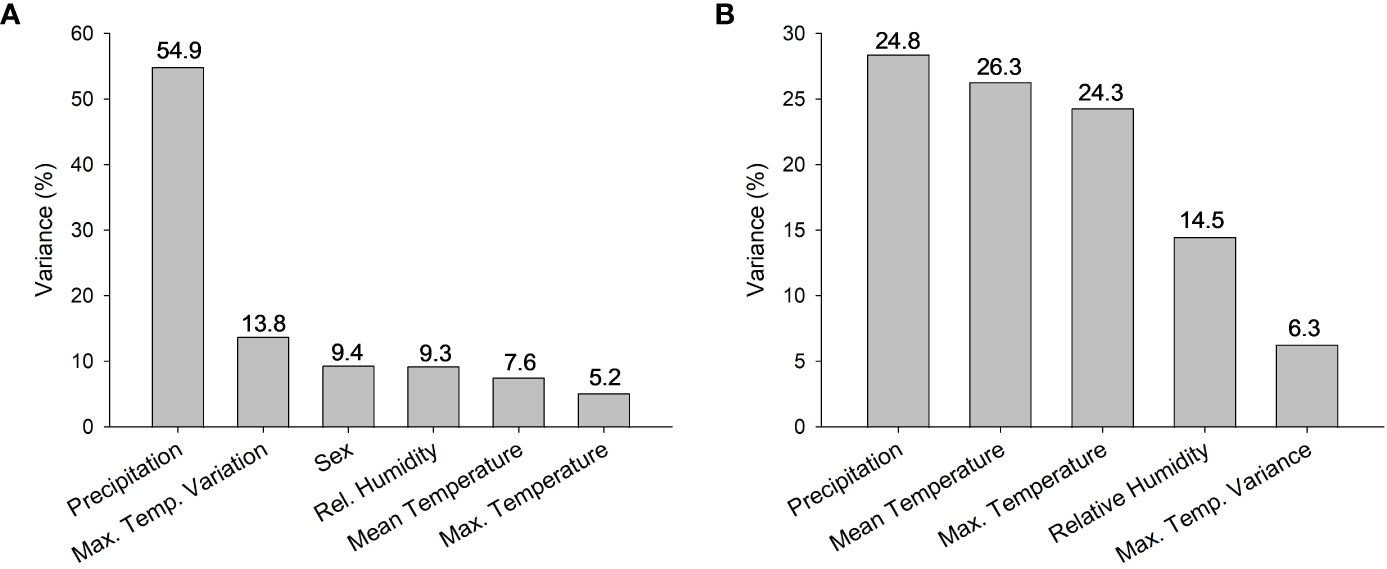
Figure 3 Percentage of variance in CTmax attributed to each factor included in hierarchical variance partitioning analysis for (A) adults and (B) larvae. Note change in scale on y-axis. All climate data were obtained from NOAA from 2021, the year that the Aedes albopictus were field collected.
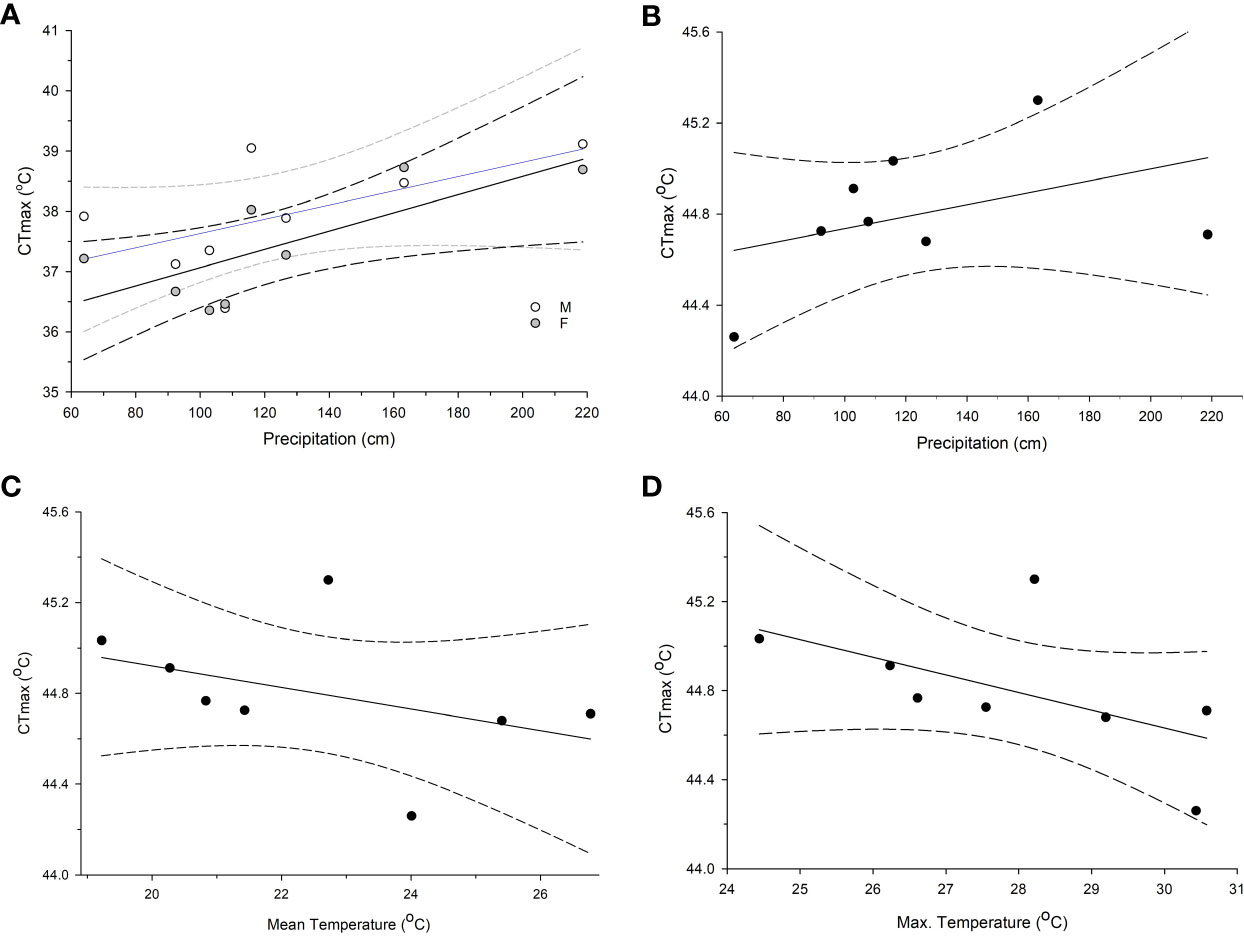
Figure 4 Regressions of CTmax and climate variables that emerged from top models based AICc scores and accounted for a large portion of variation from the hierarchical variance partition analysis. (A) The relationship for male and female adult mosquito CTmax and total annual precipitation in centimeters, (B) larval CTmax and annual precipitation, (C) larval CTmax and mean temperature, and (D) larval CTmax and mean maximum temperature. Dashed lines are the 95% confidence intervals. All climate data were obtained from NOAA from 2021, the year that the Aedes albopictus were field collected.
There were also 4 models with a delta AICc less than 2 for larvae which all performed better than the null model. All of the best models for larvae also contained precipitation, but other models contained the effects of max temperature variance, max temperature, mean temperature, and relative humidity (Table 3). The model with the lowest AICc and largest weight of evidence included max temperature variance (F3,61 = 3.22, P = 0.078), mean temperature (F1,61 = 14.42, P = 0.0003), and precipitation (F1,61 = 6.7, P = 0.012) (Table 3). The predicted values from each of the 4 top models were moderately correlated with the actual values based on the Pearson Correlation Coefficient (values ranged 0.423–0.486). The model that contained the effects of mean and max temperature, precipitation, and relative humidity had the highest coefficient. These 4 variables combined explained 90% of the variation in the hierarchical variance analysis (Figure 3B). There was a positive linear relationship between CTmax and precipitation (Figure 4B) and a negative linear relationship between CTmax and mean (Figure 4C) and max temperature (Figure 4D).
We looked at how close the CTmax values were to the maximum temperatures recorded at their home sites in 2021. For adult females, 6 of the populations, and 4 of the populations for adult males, had mean CTmax values that reached, or were within 2 °C of the maximum temperature recorded from their home site (Table 1). We also counted the number of days in 2021 that were at or close to CTmax. For at least one sex for the Stillwater population, CTmax was exceeded for 11 days and for 1 day in St. Louis. Absolute maximum temperature did not exceed, but was within 2°C, of the CTmax for at least one sex in Urbana for 3 days, College Park for 8 days, Stillwater for 39 days, and St. Louis for 7 days. Furthermore, no larval populations experienced absolute maximum temperatures during the 2021 season that exceeded CTmax (Table 1).
Discussion
Our results demonstrate genetic-based population differentiation in CTmax for two different life stages of a globally important disease vector. CTmax for both adults and larvae differed significantly among populations, although these differences are particularly strong for adults. These differences are related to key climatic variables and do not appear to follow a simple latitudinal or temperature-dependent cline. Several of the climatic variables we tested appeared to be important in determining CTmax, but annual precipitation appears to be particularly important and CTmax was higher for populations with higher precipitation.
The differences we detected in CTmax among adult populations in Ae. albopictus were larger than found in other species. For example, adult Ae. albopictus populations varied by as much as 2.66 C for males and 2.37 C for females, whereas larvae varied by only 1.04 C. By comparison, CTmax in adult Cx. tarsalis mosquitoes differed by 1.51 C among populations (Vorhees et al., 2013), though the geographic scale of the study was broader than the current study. Leafcutter ants (Atta cephalotes) have larger population differences than Ae. albopictus, however, on a finer scale. This indicates that the effect of geographic distance on population differentiation in this trait is species specific (Baudier and O’Donnell, 2020) or may be related more to the degree of local climate differences than distance.
We quantified CTmax in both larvae and adults because mosquitoes have a complex life cycle with aquatic immature life stages and terrestrial adults. We suspected that their thermal tolerance would differ owing to the different selection pressures experienced in the two habitat types (Barnes et al., 2019; Buxton et al., 2020) and because adults are mobile and larvae are constrained to their aquatic containers (Kingsolver et al., 2011). Larvae have significantly higher CTmax than adults across populations and 2021 absolute maximum temperatures did not exceed or get within 2°C of CTmax for a given population. This suggests larval Ae. albopictus in the US are currently living well below their thermal maxima and may account for the lack of pairwise differences between populations. Importantly, Ae. albopictus larvae are not found in containers in the full sun, and likely experience cooler temperatures in their often shaded habitats than those recorded from airport weather stations, which are a common source of temperature data for epidemiological models. Based on our data, it seems likely that larvae are not found in sunny containers due to female oviposition choice or egg desiccation and not larval mortality.
Different selection pressures may also drive the higher CTmax we observed in males relative to females. Sex-dependent differences in thermal biology are not unique to mosquitoes. The ditch shrimp Palaemon varians, for example, has a similar trend as Ae. albopictus with males having a higher CTmax on average (Missionário et al., 2022). Missionário et al. (2022) suggests possible mechanisms for this difference such as the relatively smaller body size of male ditch shrimp, metabolic and hormone differences, gametic differences, and differences in offspring investment. Importantly, heatwaves can have sterilizing effects on males before causing mortality which may select for higher overall heat tolerance (Sales et al., 2018). The evolution of thermal biology can be impacted by sexual selection and mating preferences (Leith et al., 2022). The demands of mate competition can also impact thermal biology. In dragonflies, melanized ornamentation may contribute to overheating (Leith et al., 2022). Furthermore, the location where mating occurs can drive the evolution of thermal biology, because organisms may experience extreme temperatures to secure a mate (Leith et al., 2022). The elimination of sex-based CTmax differences in Daphnia magna after parasite infection suggests parasitism, or other environmental factors that affect physiology, can mediate sex based differences in CTmax, however (Laidlaw et al., 2020). Future research should investigate the effects of parasites, which are ubiquitous in mosquito metapopulations, and endosymbionts, like Wolbachia, on mosquito heat tolerance in general.
In many parts of its global range, Ae. albopictus inhabits urban heat islands (Li et al., 2014; Westby et al., 2021), which may increase the severity of extreme heat events. Under extreme conditions, microclimates could be a source of refuge, and there is some evidence that they play a role in how mosquitoes segregate in urban environments. For instance, Ae. albopictus populations in New Orleans cemeteries were more likely to inhabit low-heat cemeteries rather than those with higher temperatures (de Jesús Crespo and Rogers, 2021) and in one study, Ae. albopictus preferentially inhabited small green spaces like playgrounds and home gardens in urban environments (Manica et al., 2016). During the day, mosquitoes including Ae. albopictus rest in dense plants rather than sparse vegetation (Service, 1971; Samson et al., 2013). Aedes albopictus also rests in plants commonly found in residential areas, which increases their proximity to humans (Samson et al., 2013). Importantly, there is still a lack of empirical data on the upper thermal limit at which Ae. albopictus is active in the field, where they spend the hottest parts of the day, and how the microclimates in vegetation compare to weather station data and even data from loggers placed in yards where mosquitoes are active (Westby et al., 2021).
We also lack a clear understanding of the degree to which mosquitoes behaviorally thermoregulate; this is an underexplored area critical for understanding the impact of future warming on mosquito populations. The ability, or not, to behaviorally thermoregulate has been shown to impact local adaptation (Huey et al., 2003). In a study on two frog species, one species that does not behaviorally thermoregulate had a latitudinal cline in CTmax, but this pattern was not detected in a second species that does behaviorally thermoregulate allowing it to buffer changes in temperature without adapting to local climates (Kim et al., 2022). Some known mechanisms for Aedes mosquitoes to behaviorally thermoregulate are altering wing beat frequency and only increasing activity during cooler parts of the day (Reinhold et al., 2018). There is even less known about larval behavioral thermoregulation, which may be more limited due to their container habitats. One study published in 1957 did find that Ae. aegypti larvae preferred water in the temperature range of 23–32°C (Omardeen, 1957).
Our models revealed that mean temperature, average maximum temperature and maximum temperature variance, relative humidity and annual precipitation may all be important climatic factors in determining CTmax. Importantly, precipitation accounted for the largest amount of variation in our models. The overall trend is for increased heat tolerance with increasing precipitation. Precipitation and temperature variability are cited as strong drivers of thermal traits including CTmax in the lizard Lampropholis coggeri (Clusella-Trullas et al., 2011; Macdonald et al., 2018). Hydration and relative humidity influence behavioral thermoregulation in the ant Atta exdens rubropilosa to be more tolerant of higher temperatures (Lima et al., 2022). Furthermore, precipitation is shown to limit opportunities for thermoregulation compared to drier areas in squamate reptiles (Clusella-Trullas et al., 2011). While CTmax cannot be predicted based on annual precipitation alone, this variable was always included in the best models for CTmax for both larvae and adults. It is not immediately clear why precipitation would be so important and the literature is lacking in studies that examine this relationship. It could be that wetter climates allow mosquitoes to endure hotter temperatures due to decreases in desiccation as humidity and temperature are known to interact and influence mosquito survival (Juliano et al., 2002). Future research beyond the scope of this study should work to elucidate the mechanisms by which precipitation and humidity influence CTmax and if the trend identified here, and the studies cited above, holds for other species.
Using a common garden allows for the minimization of environmental variance, so all variance in CTmax can be attributed to genetic differences (Dam, 2013). The existence of these genetic differences supports the idea that CTmax, which is traditionally viewed as physiologically constrained (Kellermann et al., 2012), has evolutionary potential. There is some evidence that many studies examining this evolutionary potential have continually underestimated CTmax due to the use of slow temperature ramping assays. Much of the issue surrounding slow temperature ramping assays is the increased length of time that the organism is under stress. Longer assays increase exhaustion and dehydration, which ultimately lead to a lower CTmax, and while this may represent an important biological phenomenon in nature, this limits the ability to examine causal variance estimates and the effects of thermal acclimation on CTmax (Rezende et al., 2011). Dehydration is particularly important because water content has a significant impact on heat tolerance in D. melanogaster (Santos et al., 2012). Minimizing these side effects like dehydration and exhaustion is critical as they can mask the genetic component of CTmax (Castañeda et al., 2019). Furthermore, the slower the ramp rate the greater the underestimation of realized heritability for CTmax in D. melanogaster (Santos et al., 2012). For these reasons, fast a ramp rate should be considered when focusing on the evolutionary potential of heat tolerance (Rezende et al., 2011). Our selected rate of 1°C/min is supported as an ideal ramp rate for reliably determining CTmax in different species of ants (Leong et al., 2022). In fact, Leong et al. (2022) found that a ramping rate of 1°C/min was the ideal rate and were able to validate their CTmax values with field studies. While our chosen ramping rate is higher than the rates used in two other studies of adult (0.50°C/min; Vorhees et al., 2013) and larval mosquitoes (0.25°C/min; Buxton et al., 2020) we feel that our ramp rate is appropriate as our goal was to detect genetically based differences in CTmax. Importantly, our CTmax estimates are similar to those derived in other mosquito species is the referenced studies. Future work will aim to validate our lab derived CTmax values with field observations of mosquito behavior at temperatures nearing, or at, their thermal limits.
The intraspecific differences we detected in CTmax for Ae. albopictus should inform future work in vectorial capacity models across genera. Pathogen transmission and vector competence are closely linked to the ecology of vectors, and temperature is just one dimension of the ecological forces that determine VBD transmission (Mordecai et al., 2019). Our data emphasize this point and focus on the importance of multiple factors in determining heat tolerance and thus future models of VBD transmission should take into account these intraspecific differences to more accurately predict how mosquitoes, and the pathogens they transmit, will respond to a changing climate. Additionally, our results demonstrate that there is standing genetic variation in upper thermal tolerance suggesting adaptation to future warmer conditions is possible. More broadly, our results can inform our understanding of population vulnerability to warming. Work on porcelain crabs (genus Petrolisthes) and several insect taxa demonstrate that higher CTmax correlates with decreased plasticity and thus increased susceptibility to environmental warming (Stillman, 2003; Deutsch et al., 2008). Furthermore, the covariation of CTmax with annual precipitation has potential implications in future modeling as some areas become drier and others wetter with the overall predicted increase in global precipitation (Rocklöv and Dubrow, 2020).
Data availability statement
The raw data supporting the conclusions of this article will be made available by the authors, without undue reservation.
Ethics statement
The manuscript presents research on animals that do not require ethical approval for their study.
Author contributions
BO and KW conceived the experiment, all authors contributed to the experimental design. BO and AS collected the data. BO, KM, and KW analyzed the data. KM made the figures. BO and KW wrote the original manuscript draft, all authors contributed substantially to manuscript edits. All authors contributed to the article and approved the submitted version.
Funding
The author(s) declare that no financial support was received for the research, authorship, and/or publication of this article.
Acknowledgments
We would like to thank Matt Helwig and Bryan Diehl at the PA Department of Environmental Protection, Andrew MacKay, Holly Tuten, and Chris Stone at the Illinois Natural History Survey, Paul Leisnam at University of Maryland, College Park, Bruce Noden at Oklahoma State University, Michael Reiskind at University of North Carolina, Cheryl Edge at Madison County Health Department, Jennifer Breaux at New Orleans Mosquito, Termite, and Rodent Control Board, and Rue-De Xui at Anastasia Mosquito Control Board for generously providing field-collected Aedes albopictus. We would like to thank Alexis Beckermann, Bryce Moulton, Laura Tayon, Danielle Perkins, and Emma Uder for laboratory assistance. We would also like to thank Susan Flowers for student program support. This work was funded by Tyson Research Center.
Conflict of interest
The authors declare that the research was conducted in the absence of any commercial or financial relationships that could be construed as a potential conflict of interest.
Publisher’s note
All claims expressed in this article are solely those of the authors and do not necessarily represent those of their affiliated organizations, or those of the publisher, the editors and the reviewers. Any product that may be evaluated in this article, or claim that may be made by its manufacturer, is not guaranteed or endorsed by the publisher.
References
Addo-Bediako A., Chown S. L., Gaston K. J. (2000). Thermal tolerance, climatic variability and latitude. Proc. R. Soc. London. Ser. B.: Biol. Sci. 267 (1445), 739–745. doi: 10.1098/rspb.2000.1065
Anderson D. R. (2008). Model based inference in the life sciences. A primer of evidence (New York, New York: Springer Science and Business Media).
Araújo M. B., Ferri-Yáñez F., Bozinovic F., Marquet P. A., Valladares F., Chown S. L. (2013). Heat freezes niche evolution. Ecol. Lett. 16 (9), 1206–1219. doi: 10.1111/ele.12155
Armstrong P. M., Andreadis T. G., Shepard J. J., Thomas M. C. (2017). Northern range expansion of the Asian tiger mosquito (Aedes albopictus): Analysis of mosquito data from Connecticut, USA. PloS Negl. Trop. Dis. 11 (5), e0005623. doi: 10.1371/journal.pntd.0005623
Barnes C. L., Blay N. W., Wilder S. M. (2019). Upper thermal tolerances of different life stages, sexes, and species of widow spiders (Araneae, Theridiidae). J. Insect Physiol. 114, 10–14. doi: 10.1016/j.jinsphys.2019.02.004
Baudier K. M., O’Donnell S. (2020). Rain shadow effects predict population differences in thermal tolerance of leaf-cutting ant workers (Atta cephalotes). Biotropica 52 (1), 113–119. doi: 10.1111/btp.12733
Bedrick E. J., Tsai C.-L. (1994). Model selection for multivariate regression in small samples. Biometrics 50 (1), 226–231. doi: 10.2307/2533213
Burnham K. P., Anderson D. R., Huyvaert K. P. (2011). AIC model selection and multimodel inference in behavioral ecology: Some background, observations, and comparisons. Behav. Ecol. Sociobiol. 65, 23–35. doi: 10.1007/s00265-010-1029-6
Buxton M., Nyamukondiwa C., Dalu T., Cuthbert R. N., Wasserman R. J. (2020). Implications of increasing temperature stress for predatory biocontrol of vector mosquitoes. Parasites Vectors 13 (1), 604. doi: 10.1186/s13071-020-04479-3
Castañeda L. E., Romero-Soriano V., Mesas A., Roff D. A., Santos M. (2019). Evolutionary potential of thermal preference and heat tolerance in Drosophila subobscura. J. Evolut. Biol. 32 (8), 818–824. doi: 10.1111/jeb.13483
Centers for Disease Control and Prevention (2018) Vital signs: Illnesses on the rise from mosquito, tick, and flea bites. Available at: http://www.cdc.gov/vitalsigns/vector-borne.
Clusella-Trullas S., Blackburn T. M., Chown S. L. (2011). Climatic predictors of temperature performance curve parameters in ectotherms imply complex responses to climate change. Am. Nat. 177 (6), 738–751. doi: 10.1086/660021
Couper L., Farner J., Caldwell J., Childs M., Harris M., Kirk D., et al. (2021). How will mosquitoes adapt to climate warming? eLife 10, e69630. doi: 10.7554/eLife.69630
Dam H. G. (2013). Evolutionary adaptation of marine zooplankton to global change. Annu. Rev. Mar. Sci. 5 (1), 349–370. doi: 10.1146/annurev-marine-121211-172229
de Jesús Crespo R., Rogers R. E. (2021). Habitat segregation patterns of container breeding mosquitos: The role of urban heat islands, vegetation cover, and income disparity in cemeteries of New Orleans. Int. J. Environ. Res. Public Health 19 (1), 245. doi: 10.3390/ijerph19010245
Deutsch C. A., Tewksbury J. J., Huey R. B., Sheldon K. S., Ghalambor C. K., Haak D. C., et al. (2008). Impacts of climate warming on terrestrial ectotherms across latitude. Proc. Natl. Acad. Sci. 105 (18), 6668–6672. doi: 10.1073/pnas.0709472105
García-Robledo C., Kuprewicz E. K., Staines C. L., Erwin T. L., Kress W. J. (2016). Limited tolerance by insects to high temperatures across tropical elevational gradients and the implications of global warming for extinction. Proc. Natl. Acad. Sci. 113 (3), 680–685. doi: 10.1073/pnas.1507681113
Geerts A. N., Meester L. D., Stoks R. (2015). Heat tolerance and its evolutionary potential along a latitudinal gradient in Daphnia magna. Evolut. Ecol. Res. 16 (6), 517–528.
Gloria-Soria A., Shragai T., Ciota A. T., Duval T. B., Alto B. W., Martins A. J., et al. (2022). Population genetics of an invasive mosquito vector, Aedes albopictus in the Northeastern USA. NeoBiota 78, 99–127. doi: 10.3897/neobiota.78.84986
Gray E. M. (2013). Thermal acclimation in a complex life cycle: The effects of larval and adult thermal conditions on metabolic rate and heat resistance in Culex pipiens (Diptera: Culicidae). J. Insect Physiol. 59 (10), 1001–1007. doi: 10.1016/j.jinsphys.2013.08.001
Herrando-Pérez S., Ferri-Yáñez F., Monasterio C., Beukema W., Gomes V., Belliure J., et al. (2019). Intraspecific variation in lizard heat tolerance alters estimates of climate impact. J. Anim. Ecol. 88 (2), 247–257. doi: 10.1111/1365-2656.12914
Hoffmann A. A., Anderson A., Hallas R. (2002). Opposing clines for high and low temperature resistance in Drosophila melanogaster. Ecol. Lett. 5 (5), 614–618. doi: 10.1046/j.1461-0248.2002.00367.x
Huey R. B., Hertz P. E., Sinervo B. (2003). Behavioral drive versus behavioral inertia in evolution: a null model approach. Am. Nat. 161 (3), 357–366. doi: 10.1086/346135
IPCC (2022). Climate change 2022: impacts, adaptation, and vulnerability. contribution of Working Group II to the Sixth Assessment Report of the Intergovernmental Panel on Climate Change. Eds. Pörtner H.-O., Roberts D. C., Tignor M., Poloczanska E. S., Mintenbeck K., Alegría A., et al. (Cambridge, UK and New York, NY, USA: Cambridge University Press), 3056. doi: 10.1017/9781009325844
Juliano S. A., O’Meara G. F., Morrill J. R., Cutwa M. M. (2002). Desiccation and thermal tolerance of eggs and the coexistence of competing mosquitoes. Oecologia 130, 458–469. doi: 10.1007/s004420100811
Kellermann V., Overgaard J., Hoffmann A. A., Fløjgaard C., Svenning J.-C., Loeschcke V. (2012). Upper thermal limits of Drosophila are linked to species distributions and strongly constrained phylogenetically. Proc. Natl. Acad. Sci. 109 (40), 16228–16233. doi: 10.1073/pnas.1207553109
Kim Y. I., Chuang M.-F., Borzee A., Kwon S., Jang Y. (2022). Latitude-induced and behaviorally thermoregulated variations in upper thermal tolerance of two anuran species. Biology 11, 1506. doi: 10.3390/biology11101506
Kingsolver J. G., Arthur Woods H., Buckley L. B., Potter K. A., MacLean H. J., Higgins J. K. (2011). Complex life cycles and the responses of insects to climate change. Integr. Comp. Biol. 51 (5), 719–732. doi: 10.1093/icb/icr015
Lahondère C., Bonizzoni M. (2022). Thermal biology of invasive Aedes mosquitoes in the context of climate change. Curr. Opin. Insect Sci. 51, 100920. doi: 10.1016/j.cois.2022.100920
Lai J., Zou Y., Zhang J., Peres-Neto P. R. (2022). Generalizing hierarchical and variation partitioning in multiple regression and canonical analyses using the rdacca.hp R package. Methods Ecol. Evol. 13, 782–788. doi: 10.1111/2041-210X.13800
Laidlaw T., Hector T. E., Sgrò C. M., Hall M. D. (2020). Pathogen exposure reduces sexual dimorphism in a host’s upper thermal limits. Ecol. Evol. 10 (23), 12851–12859. doi: 10.1002/ece3.6828
Leith N. T., Fowler-Finn K. D., Moore M. P. (2022). Evolutionary interactions between thermal ecology and sexual selection. Ecol. Lett. 25 (9), 1919–1936. doi: 10.1111/ele.14072
Leong C.-M., Tsang T. P. N., Guénard B. (2022). Testing the reliability and ecological implications of ramping rates in the measurement of Critical Thermal maximum. PloS One 17 (3), e0265361. doi: 10.1371/journal.pone.0265361
Li Y., Kamara F., Zhou G., Puthiyakunnon S., Li C., Liu Y., et al. (2014). Urbanization increases Aedes albopictus larval habitats and accelerates mosquito development and survivorship. PloS Negl. Trop. Dis. 8 (11), e3301. doi: 10.1371/journal.pntd.0003301
Lima C., Helene A. F., Camacho A. (2022). Leaf-cutting ants’ critical and voluntary thermal limits show complex responses to size, heating rates, hydration level, and humidity. J. Comp. Physiol. B. 192 (2), 235–245. doi: 10.1007/s00360-021-01413-6
Macdonald S. L., Llewelyn J., Phillips B. L. (2018). Using connectivity to identify climatic drivers of local adaptation. Ecol. Lett. 21 (2), 207–216. doi: 10.1111/ele.12883
Manica M., Filipponi F., D’Alessandro A., Screti A., Neteler M., Rosà R., et al. (2016). Spatial and Temporal Hot Spots of Aedes albopictus Abundance inside and outside a South European Metropolitan Area. PloS Negl. Trop. Dis. 10 (6), e0004758. doi: 10.1371/journal.pntd.0004758
Medley K. A. (2010). Niche shifts during the global invasion of the Asian tiger mosquito, Aedes albopictus Skuse (Culicidae), revealed by reciprocal distribution models: niche shifts and global invasion. Global Ecol. Biogeogr. 19 (1), 122–133. doi: 10.1111/j.1466-8238.2009.00497.x
Medley K. A., Westby K. M., Jenkins D. G. (2019). Rapid local adaptation to northern winters in the invasive Asian tiger mosquito Aedes albopictus: a moving target. J. Appl. Ecol. 56 (11), 2518–2527. doi: 10.1111/1365-2664.13480
Mesas A., Jaramillo A., Castañeda L. E. (2021). Experimental evolution on heat tolerance and thermal performance curves under contrasting thermal selection in Drosophila subobscura. J. Evolut. Biol. 34 (5), 767–778. doi: 10.1111/jeb.13777
Missionário M., Fernandes J. F., Travesso M., Freitas E., Calado R., Madeira D. (2022). Sex-specific thermal tolerance limits in the ditch shrimp Palaemon varians: eco-evolutionary implications under a warming ocean. J. Thermal. Biol. 103, 103151. doi: 10.1016/j.jtherbio.2021.103151
Mordecai E. A., Caldwell J. M., Grossman M. K., Lippi C. A., Johnson L. R., Neira M., et al. (2019). Thermal biology of mosquito-borne disease. Ecol. Lett. 22 (10), 1690–1708. doi: 10.1111/ele.13335
Oliveira B. F., Yogo W. I. G., Hahn D. A., Yongxing J., Scheffers B. R. (2021). Community-wide seasonal shifts in thermal tolerances of mosquitoes. Ecology 102 (7). doi: 10.1002/ecy.3368
Omardeen T. A. (1957). The behaviour of larvae and pupae of Aedes aegypti (L.) in light and temperature gradients. Bull. Entomol. Res. 48, 349–357.
Parmesan C., Root T. L., Willig M. R. (2000). Impacts of extreme weather and climate on terrestrial biota *. Bull. Am. Meteorol. Soc. 81 (3), 443–450. doi: 10.1175/1520-0477(2000)081<0443:IOEWAC>2.3.CO;2
Piatt J. F., Parrish J. K., Renner H. M., Schoen S. K., Jones T. T., Arimitsu M. L., et al. (2020). Extreme mortality and reproductive failure of common murres resulting from the northeast Pacific marine heatwave of 2014-2016. PloS One 15 (1), e0226087. doi: 10.1371/journal.pone.0226087
Piyaphongkul J., Pritchard J., Bale J. (2012). Can tropical insects stand the heat? A case study with the brown planthopper Nilaparvata lugens (Stål). PloS One 7 (1), e29409. doi: 10.1371/journal.pone.0029409
Reinhold J., Lazzari C., Lahondère C. (2018). Effects of the environmental temperature on Aedes aEgypti and Aedes albopictus mosquitoes: a review. Insects 9 (4), 158. doi: 10.3390/insects9040158
Rezende E. L., Tejedo M., Santos M. (2011). Estimating the adaptive potential of critical thermal limits: methodological problems and evolutionary implications. Funct. Ecol. 25 (1), 111–121. doi: 10.1111/j.1365-2435.2010.01778.x
Rocca K. A., Gray E. M., Costantini C., Besansky N. J. (2009). 2La chromosomal inversion enhances thermal tolerance of Anopheles Gambiae larvae. Malaria J. 8 (1), 147. doi: 10.1186/1475-2875-8-147
Rocklöv J., Dubrow R. (2020). Climate change: an enduring challenge for vector-borne disease prevention and control. Nat. Immunol. 21 (5), 479–483. doi: 10.1038/s41590-020-0648-y
Sales K., Vasudeva R., Dickinson M. E., Godwin J. L., Lumley A. J., Michalczyk Ł., et al. (2018). Experimental heatwaves compromise sperm function and cause transgenerational damage in a model insect. Nat. Commun. 9 (1), 4771. doi: 10.1038/s41467-018-07273-z
Samson D. M., Qualls W. A., Roque D., Naranjo D. P., Alimi T., Arheart K. L., et al. (2013). Resting and energy reserves of Aedes albopictus collected in common landscaping vegetation in St. Augustine, Florida. J. Am. Mosq. Control. Assoc. 29 (3), 231–236. doi: 10.2987/13-6347R.1
Santos M., Castañeda L. E., Rezende E. L. (2012). Keeping pace with climate change: what is wrong with the evolutionary potential of upper thermal limits? Ecol. Evol. 2 (11), 2866–2880. doi: 10.1002/ece3.385
Sasaki M. C., Dam H. G. (2019). Integrating patterns of thermal tolerance and phenotypic plasticity with population genetics to improve understanding of vulnerability to warming in a widespread copepod. Global Change Biol. 25 (12), 4147–4164. doi: 10.1111/gcb.14811
Service M. W. (1971). The daytime distribution of mosquitoes resting in vegetation. J. Med. Entomol. 8 (3), 271–278. doi: 10.1093/jmedent/8.3.271
Sternberg E. D., Thomas M. B. (2014). Local adaptation to temperature and the implications for vector-borne diseases. Trends Parasitol. 30 (3), 115–122. doi: 10.1016/j.pt.2013.12.010
Stillman J. H. (2003). Acclimation capacity underlies susceptibility to climate change. Science 301 (5629), 65–65. doi: 10.1126/science.1083073
Sunday J., Bennett J. M., Calosi P., Clusella-Trullas S., Gravel S., Hargreaves A. L., et al. (2019). Thermal tolerance patterns across latitude and elevation. Philos. Trans. R. Soc. B.: Biol. Sci. 374 (1778), 20190036. doi: 10.1098/rstb.2019.0036
Urbanski J., Mogi M., O’Donnell D., DeCotiis M., Toma T., Armbruster P. (2012). Rapid adaptive evolution of photoperiodic response during invasion and range expansion across a climatic gradient. Am. Nat. 179 (4), 490–500. doi: 10.1086/664709
Vorhees A. S., Gray E. M., Bradley T. J. (2013). Thermal resistance and performance correlate with climate in populations of a widespread mosquito. Physiol. Biochem. Zool. 86 (1), 73–81. doi: 10.1086/668851
Weldon C. W., Nyamukondiwa C., Karsten M., Chown S. L., Terblanche J. S. (2018). Geographic variation and plasticity in climate stress resistance among southern African populations of Ceratitis capitata (Wiedemann) (Diptera: Tephritidae). Sci. Rep. 8 (1), 9849. doi: 10.1038/s41598-018-28259-3
Westby K. M., Adalsteinsson S. A., Biro E. G., Beckermann A. J., Medley K. A. (2021). Aedes albopictus populations and larval habitat characteristics across the landscape: significant differences exist between urban and rural land use types. Insects 12 (3), 196. doi: 10.3390/insects12030196
World Health Organization (2020) Vector-borne disease fact sheet. Available at: http://who.int/news-room/fact-sheets/detail/vector-borne-diseases.
Keywords: common garden, CTmax, climate change, mosquito, Aedes albopictus, ramping assay
Citation: Orlinick BL, Smith A, Medley KA and Westby KM (2024) Genetically based variation in heat tolerance covaries with climate in a globally important disease vector. Front. Ecol. Evol. 11:1248673. doi: 10.3389/fevo.2023.1248673
Received: 27 June 2023; Accepted: 12 December 2023;
Published: 08 January 2024.
Edited by:
Arnaud Sentis, Institut National de recherche pour l’agriculture, l’alimentation et l’environnement (INRAE), FranceReviewed by:
Philippe Vernon, CNRS UMR 6553 EcoBio/University of Rennes 1, FranceBarbbara Da Silva Rocha, Institut National de recherche pour l’agriculture, l’alimentation et l’environnement (INRAE), France
Copyright © 2024 Orlinick, Smith, Medley and Westby. This is an open-access article distributed under the terms of the Creative Commons Attribution License (CC BY). The use, distribution or reproduction in other forums is permitted, provided the original author(s) and the copyright owner(s) are credited and that the original publication in this journal is cited, in accordance with accepted academic practice. No use, distribution or reproduction is permitted which does not comply with these terms.
*Correspondence: Katie M. Westby, kwestby@wustl.edu