- Information Engineering College, Hangzhou Dianzi University, Hangzhou, Zhejiang, China
In computer vision, the detection and tracking of moving objects has become a hot topic today. The target tracking technology in this paper refers to the visual tracking of the ground moving target by the aircraft during the flight. Since both the aircraft and the target are moving, there are background and two motion vectors composed of the target and the background in the acquired image. Therefore, this paper proposed a research on the location and tracking of environmental pollution sources under multi-UAV vision based on the target motion model. This paper first introduced the UAV target tracking technology, and analyzed the development history and types of UAVs in detail. Then, based on the increasingly serious environmental pollution, this paper proposed to use UAV sensing technology to locate the pollution source. Finally, in the experimental part, this paper tested the UAV flight platform, and carried out the actual operation and positioning of the pollution source. The final experimental results showed that within 0 ~ 360 s, the attitude angle obtained by the gradient descent method had no divergence phenomenon, which could effectively reduce the error caused by the integration; the inclination angle deviation of the two groups of experimental equipment was within ±2.5°, the roll angle deviation was within ±3°, and the deviation angle was relatively large at some moments, but the average deviation was only 0.8°.
1. Introduction
As one of the key technologies of UAV monitoring system, the recognition and tracking technology of moving targets is to obtain images of moving targets by visual means, and design algorithms to identify and track moving targets in real time, and estimate the position and trajectory of moving targets. It can be used as an important basis for UAVs to perform flight decisions. In recent years, China’s aviation industry has developed rapidly, and a large number of scientific researchers have invested in the aerospace field, which has rapidly improved the level of high-tech technologies such as flight control technology, sensor devices, and computer vision, and has developed rapidly in the civilian field. Especially in the fields of disaster relief aerial photography, map surveying and mapping, forest fire prevention, wire laying, modern agriculture, aerial monitoring and other fields, the development is rapid and the prospect is optimistic, and it has huge market economic significance. With the continuous development of visualization technology, the secondary development of rotary-wing UAV has reached a new level. Among them, the visual tracking of targets is an important direction for the development of UAVs. For example, when carrying out a ship landing task, the drone must be able to recognize the symbols on the ship and complete the corresponding operation under certain conditions. It aims to optimize the attitude estimation algorithm and image processing algorithm, reduce the system operation time, and improve the real-time performance of target tracking in order to solve the problem of pollution sources.
The paper firstly introduced the target tracking technology of UAV, and analyzed the development and types of UAV in detail. Then, due to the increasingly serious environmental pollution, this paper proposed a method of using UAV detection technology to locate pollution sources, and in the experimental stage, the test was carried out, and the pollution source was practically operated. The innovation of this article is that the article not only studies UAV technology, but also analyzes its principle and sensing technology, so its experimental technical guidance is very rigorous. The data of the gyroscope, accelerometer and magnetometer are processed by the algorithm fusion, and the accurate estimation of the attitude angle is realized, and the reliability of the algorithm is verified by experiments.
2. Related work
The theoretical research of visual tracking algorithm has been going on for a long time, and the related applications have also been verified in practice. From traditional wireless communication systems and rescue operations to GNSS systems and drone tracking, the application of direction-of-arrival (DoA) technology has increased significantly in various fields. Oliveira M proposed a low-cost antenna array UAV tracking device for outdoor environments. The proposed solution was divided into hardware and software parts (Oliveira et al., 2019). The focus of Ramamonjy et al. (2017) was to develop a distributed network of compact microphone arrays for unmanned aerial vehicle (UAV) detection and tracking. UAVs can perform various flight tasks with different loads, while always guaranteeing the best flight performance. Li S developed an integral reinforcement learning algorithm for UAVs, so that it could learn the optimal control strategy online (Li et al., 2019). Target tracking is done by placing it in the center of the image, with the drone constantly adjusting to keep the target properly framed. To start tracking, Bnic M V proposed that the human operator must put the target he wishes to track in a frame. The functionality of this system was well suited for remote monitoring of targets (Bnic et al., 2019). However, there is no research on the pollution source localization algorithm of UAV, so its practical value cannot be realized.
The risk of pollution from industrial waste discharge or accidental leakage during transportation poses a considerable threat to the safety of rivers. The ability to quickly identify pollution sources is extremely important to achieve emergency disposal of pollutants. Yutao W U used the Reynolds equation and turbulence model to simulate the wake concentration field of a cylindrical hydraulic structure with different pollution source locations (upstream and downstream of the structure; Yutao et al., 2017). Wang J presented a new method for point source identification of sudden water pollution in rivers, aiming to determine where (source location), when (release time) and how much pollutants (release quality) were introduced into the river (Wang et al., 2018). Amiri S proposed conditions and rules for the arrangement (number and location) of pollutant concentration measurement points under various conditions. The reasonable arrangement of measurement points was of great significance because it solved the non-uniqueness of the inverse model. The most important factor affecting the arrangement of measurement points was the flow pattern (Amiri et al., 2019). They both introduced pollution source location technology and drone tracking technology, but did not combine the two.
3. UAV pollution source localization algorithm
3.1. UAV tracking technology
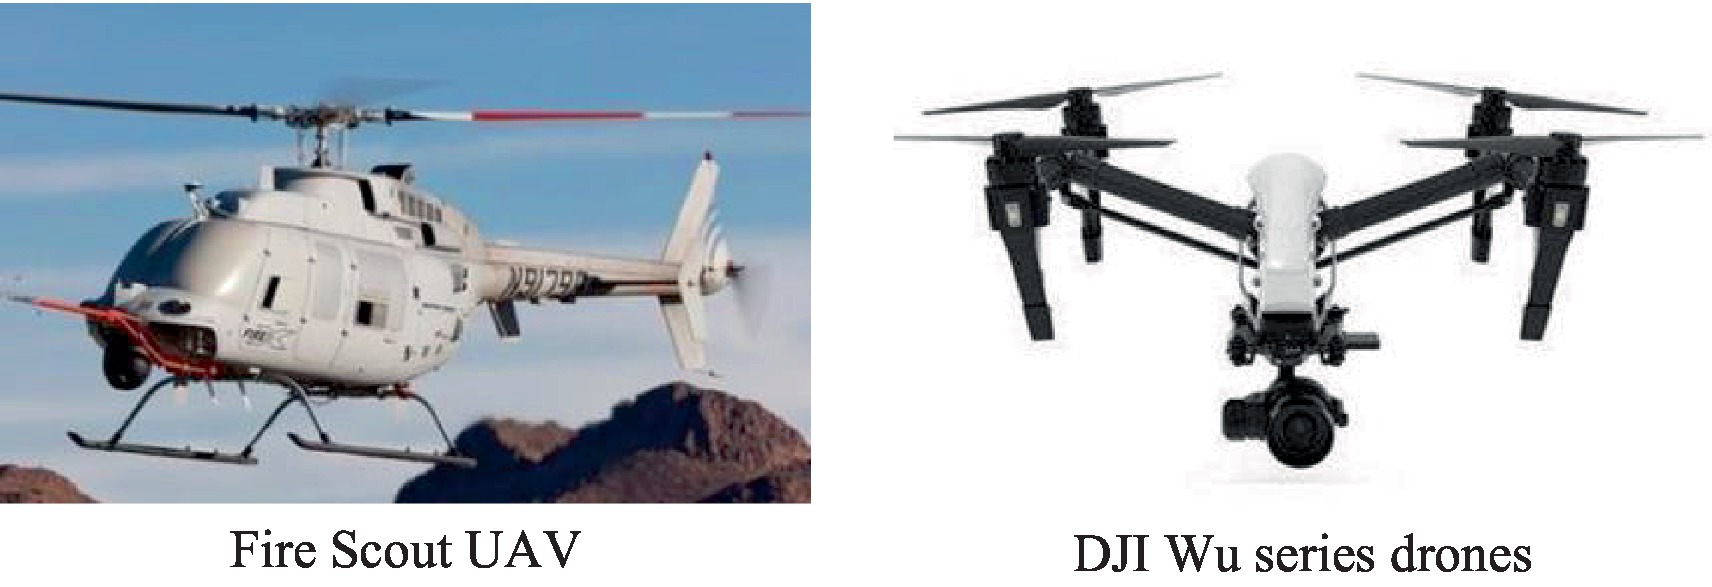
An unmanned aerial vehicle (UAV) is a reusable unmanned aerial vehicle that is automatically controlled by an onboard processor and remotely controlled on the ground (Chaoraingern et al., 2020; Sugiarto, 2020). After more than 100 years of development in UAV technology, its achievements are obvious to all: from the initial military use to the current civilian and civilian use; from remote control before to autonomous driving now. According to its flight mechanism, UAVs can be divided into two types: fixed-wing and rotary-wing (Lee et al., 2018).
Figures 1, 2 show some representative fixed wings and rotors. Fixed-wing unmanned aircraft is a combination of wings and fuselage, with flight performance, suitable for long-range cruise or long-range flight; rotor UAVs are powered by high-speed rotating blades, and have the characteristics of good maneuverability, small size, easy portability, and vertical landing, and are suitable for medium and short-term missions (Cervone et al., 2017).
At present, UAV navigation systems mainly include: Inertial Navigation System (INS), Global Positioning System (GPS), INS/GPS integrated navigation. Visual navigation is to obtain navigation information through images to achieve interaction with the surrounding environment. This method mainly detects, extracts, identifies, and tracks the target, and transmits the relative coordinates, position, speed and other motion information of the target to the flight controller to realize the corresponding control (Bazan et al., 2017; García-Segura et al., 2017). Since images are the most important external information obtained by humans, the use of vision for secondary development has become a hot spot in current UAV research. Due to the small size and low power consumption of the miniature camera, it is suitable for quadrotor drones. UAVs can be used to obtain important information on the ground, such as images, including still pictures and videos, from which timely and accurate battlefield information and precise positioning information can be obtained to capture strategic strike targets and complete tasks such as strike effect assessment (Hua, 2020; Zeng et al., 2022). Therefore, target tracking technology is a new hot spot in the development of UAVs.
This project originated from the Seventh Aerial Robotics Competition (Giovanis et al., 2017). The task is to track moving objects on the ground through flying robots and expel them from specific areas. The main work of this paper is: using visualization technology to track the quadrotor in real time; at the same time, it also supports online replacement of tracked objects, and the visualization algorithm has been deeply studied to improve its accuracy and speed.
3.2. Pollution source localization algorithm
Firstly, the diffusion pattern of pollutants in the river was analyzed, and the two-dimensional concentration distribution pattern of pollutants in the river was established. On this basis, this paper proposed a new pollution source localization algorithm based on the least squares method, which solved the application of the traditional least squares method in finite element analysis (Turabieh et al., 2019; Talaat et al., 2020). Finally, the effects of concentration measurement noise, node drift, and reflection coefficients were analyzed.
The discharge of sewage is usually concentrated on the banks of rivers and lakes. Contaminants along the coast are easily affected by reflections from the coast. According to its boundary type, it can be divided into: permeable boundary and impermeable boundary, the permeability of which depends on its soil composition. The focus of this paper is to investigate the bottom and surface boundaries of water bodies under different coastal infiltration effects. This paper locates the pollution sources in the still water environment of lakes and reservoirs, assuming that the pollution sources are located in an ideal still water body. In static water environment, the diffusion of pollutants is different from that of pollutants in still water, and the positioning error of the pollution source comes from the model itself and the error caused by the sensor node drifting and moving in the water. In a nearshore environment, the diffusion of pollutants is affected by the coastal environment, sensor measurement noise, floating motion, degradation of pollutants and other factors. When the river channel is narrow, it is also affected by the boundary boundary (Gao et al., 2019; Xiao et al., 2022).
Water depth g, transverse flow velocity , longitudinal flow velocity , mass flow rate N of continuous point source, reflection coefficient , dispersion coefficient , degradation coefficient , m sensor positions , and its concentration detection values , , are known. Pollution source position is estimated.
3.2.1. Model of two-dimensional pollutant concentration distribution in rivers
Its effect depends on the nature of the boundary and can be divided into three categories: total reflection (impenetrable boundary); incomplete reflection (ie, there is partial absorption and partial reflection, that is, incompletely permeable boundary); adequate absorption (full penetration range). Among them, when the adsorption capacity reaches saturation, it is hardly affected by the nearshore boundary (Singh and Dwivedi, 2019).
It is assumed that sewage is continuously discharged into the river channel at the near-shore position of the same river section, and the sewage is immediately mixed evenly in the direction of water depth g after it enters the water. Its sewer velocity is , the concentration is , and the mass flow is (the amount of pollutant discharge per unit time). Taking the water flow direction as the a axis and the vertical direction as the b axis, after the sewage enters the river, it immediately mixes with the water body evenly in the direction of the water depth. The transverse flow rate and the longitudinal flow rate are recorded. During a certain period of time, when the monitoring value of the sensor node does not change (or is below a given certain threshold), the pollution diffusion in this area has entered a stable state, and the concentration in the vertical direction is also 0. The diffusion equation of the two-dimensional steady-state pollutant is as follows:
Assuming =0, and are much smaller than the convection term, so:
According to the boundary of the water body, it can be divided into: not affected by boundary conditions and affected by boundary conditions.
3.2.1.1. Not affected by boundaries
It is also osmotic boundaries and unrestricted waters. Finding its analytical solution, it can be obtained:
3.2.1.2. Affected by the boundary
The steady-state diffusion model equation under the influence of a single boundary is known:
Under the action of the completely absorbing boundary, the pollution concentration and the completely reflecting boundary, the stable concentration distribution is:
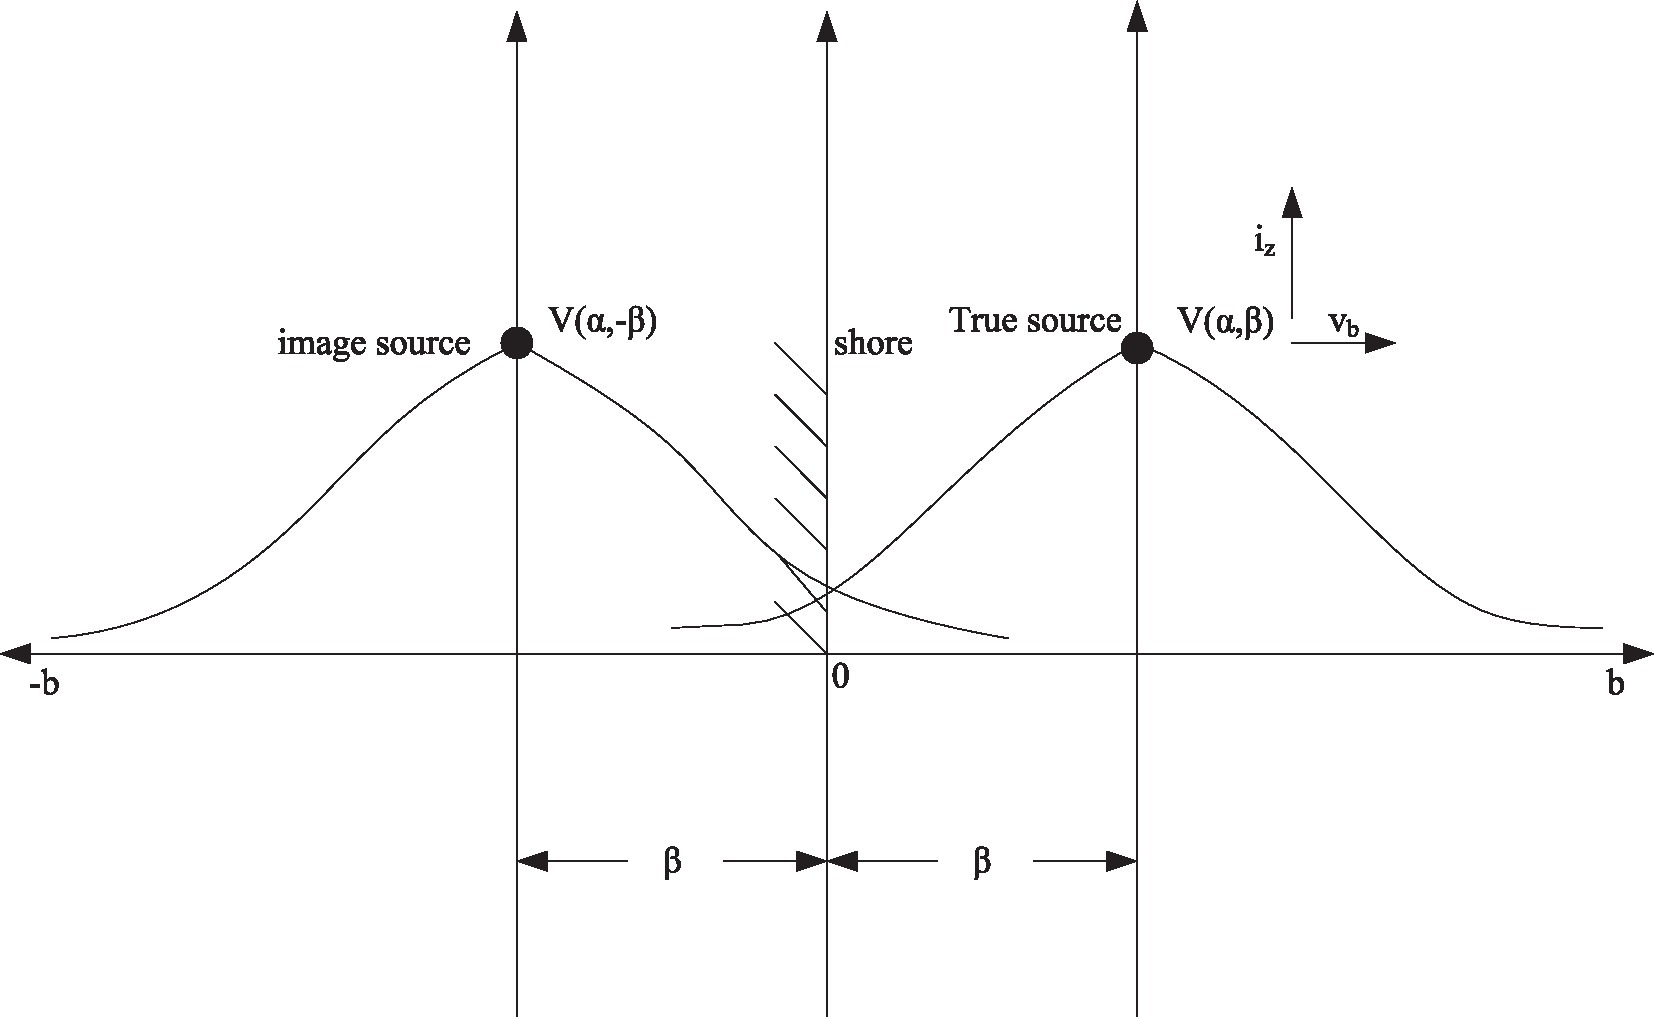
Figure 3 represents the distance from the boundary to the pollution point (Orlandi, 2018; Falco et al., 2019). The corresponding virtual image source coordinates are as follows. Under the action of the impermeable boundary, the diffusion of pollutants has an additive effect. Among them, represents the diffusion term at true source. represents the diffusion term of the equivalent image source .
Under the boundary conditions, under the condition that the absorption capacity of the boundary is limited, its distribution boundary is between the two. To this end, this paper gives an approximate distribution pattern:
Among them, is the water permeability (reflectance) of the boundary. When the reflection coefficient , it is the Equation (3), and when the reflection coefficient , it is the Equation (7). Its value is related to the geological conditions and pollution types of the shore and can be estimated in advance.
3.2.2. Location of pollution sources
Because pollutants are usually near the coast, if the maximum distance between the discharge source and the river bank is set to be , then considering the direction of the water flow, there are two conditions:
The objective function under this constraint:
Among them, is the concentration measurement value of the jth sensor node, and is the concentration estimation value of the jth sensor node based on the model equation, namely:
Given the concentration measurement value at the jth sensor node and the position of the node, the localization problem is to find the position of the pollution source , which is the smallest under the constraint equation, namely:
It can be seen from the equation that the objective function of the nonlinear least squares problem contains , , , and , and there is a complex nonlinear relationship with the unknown . This will greatly affect the numerical stability and anti-interference ability of the algorithm.
By taking the logarithm of Equation (11), a new objective function is obtained to improve its numerical stability and anti-interference ability.
It is written as:
Let the new optimization objective function be:
The positioning problem boils down to finding the location of the pollution source so that is the smallest under the constraint.
That is, the sum of the squares of the logarithm of the logarithm of the measured concentration and the logarithm of the model estimated concentration is minimized.
Under the unified dimension, the degradation coefficient of many pollutants, especially organic pollutants, is very small relative to the flow rate. At this time, in the positioning application, can be corrected to :
There are many solution boundary constrained nonlinear least squares problems, such as interior point trust regions, modified Levenberg–Marquardt method, reflected Newton method, etc. Among these methods, the overall convergence of the trust region method is better.
4. Experiment on location and tracking of environmental pollution sources under multi-UAV vision
4.1. UAV flight platform test
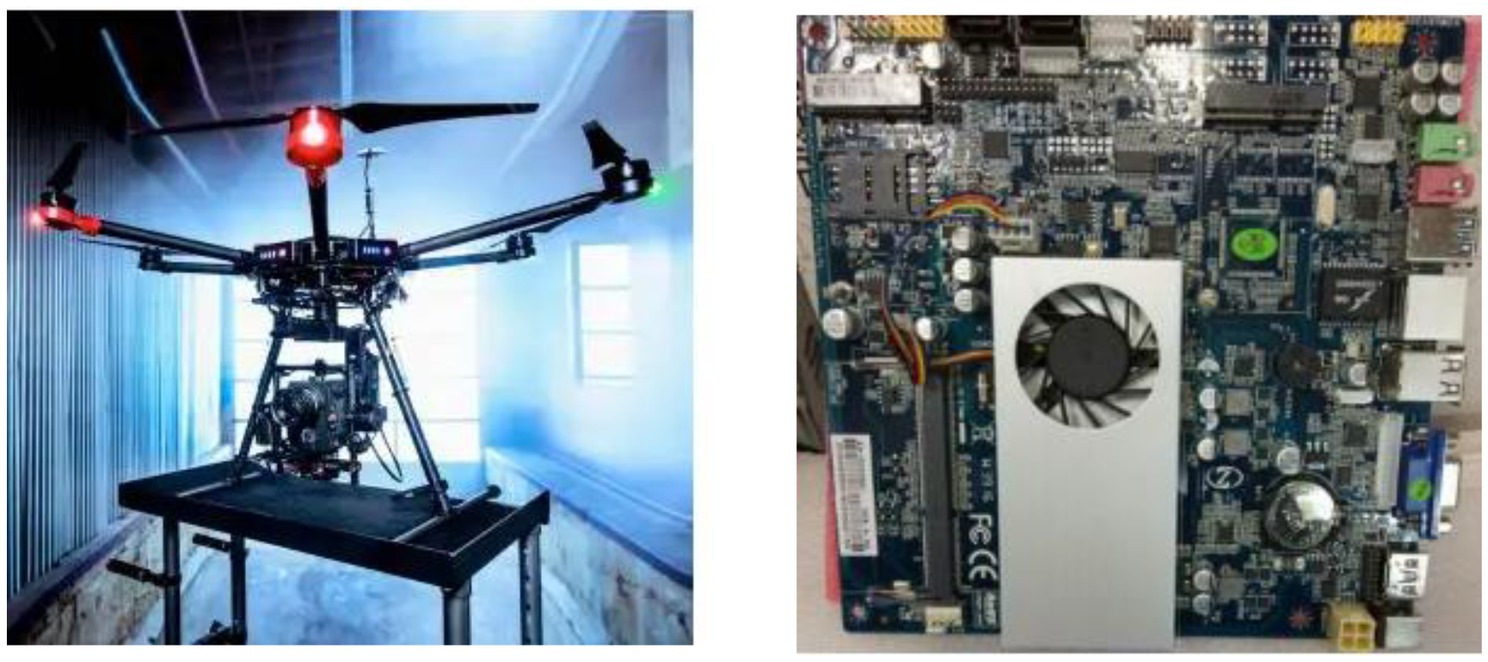
As shown in Figure 4, in order to verify the method proposed in this paper, this paper designs a multi-rotor UAV flight platform, and performs static and dynamic tests on it to verify the effectiveness of the method.
In the actual test of this paper, the sampling frequency of MPU6000 is 1,000 Hz; the angular rotation speed of the gyroscope can reach ±1,000 degrees/s; the acceleration sensor can measure within ±4 G; the measurement range of the magnetic compass is ±4 Gauss; the data transmission frequency of 433 MHz; the gradient descent method was used, and the calculation time was 1 millisecond; it took 980 us to collect a gradient of degradation from the sensor data.
The MPU-6000 is the first six-axis motion processing unit with integrated gyro and accelerometer sensors, it includes three 16-bit analog-to-digital converters, and can be extended to nine axes by a digital processor. Since MPU-6000 does not use the expansion mode in the sensor module, it uses SPI to communicate with the main control module, which can reach a rate of 1 MHz and meet the data transmission requirements. SPI is a high-speed, full-duplex, synchronous serial peripheral. The SPI protocol has lower signal lines and smaller features:
Serial data transmission line SDI is adopted: mainly for receiving and transmitting data; serial data output line SDO: The host transmits and receives data from the device; when the chip is selected, it is at a high resistance value; a chip select signal CS of the slave device enable signal controlled by the master device; it is low when sent, and high otherwise; clock signal line SCLK: The transition of data is obtained by using its rising and falling edges. SPI read and write operations transfer at least two bytes at a time, usually an address byte, followed by one or more data bytes, and continuous data operations can be performed starting from a certain address bit. Its transmission protocol is shown in Table 1.
As shown in Table 2, the MPU-6000 has various measurement ranges, and the appropriate range can be selected according to needs. In this paper, the gyroscope and acceleration are set to: 1 KHz, the full scale of the gyroscope is ±1,000 degrees, without self-testing, the full scale of the accelerometer is ±4 G, and it is also set to not self-test.
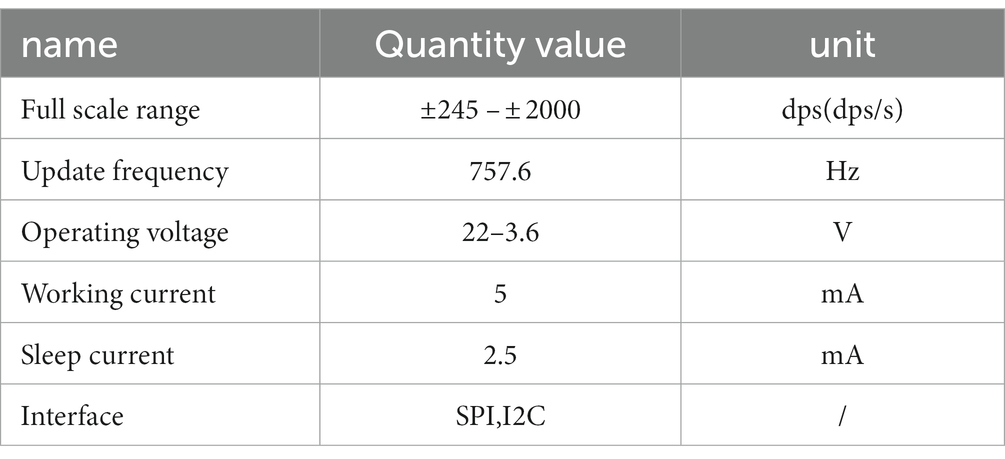
The design idea of the auxiliary gyroscope chip of L3GD20H is to use two different gyroscopes, and average the two normal gyroscopes, thereby reducing noise and achieving better results. The L3GD20H chip has the characteristics of small size, low power, sleep, wake-up and so on. Its main performance indicators are shown in Table 3.
4.1.1. Static analysis
It refers to the analysis of ground conditions through the attitude estimation system. As shown in Figure 5, in the pitch angle (Pitch), the frequency of the data sampling is 10 Hz. Figure 5A is the output of the tilt angle when the system is in a horizontal position, Figure 5B is the tilt angle measured by the accelerometer and the tilt angle measured by the algorithm in this paper. As shown in Figure 5A, in the horizontal test, the pitch angle swings between 0.02–0.16° without divergence, which can effectively overcome errors such as the integration of the gyro; there are a lot of glitches on the curve of the values measured on the accelerometer in Figure 5B. This method can not only track the acceleration value quickly, but also the curve is smoother. Thus, the white noise generated by the accelerometer is greatly reduced, and its estimation error is 0.26° on average.
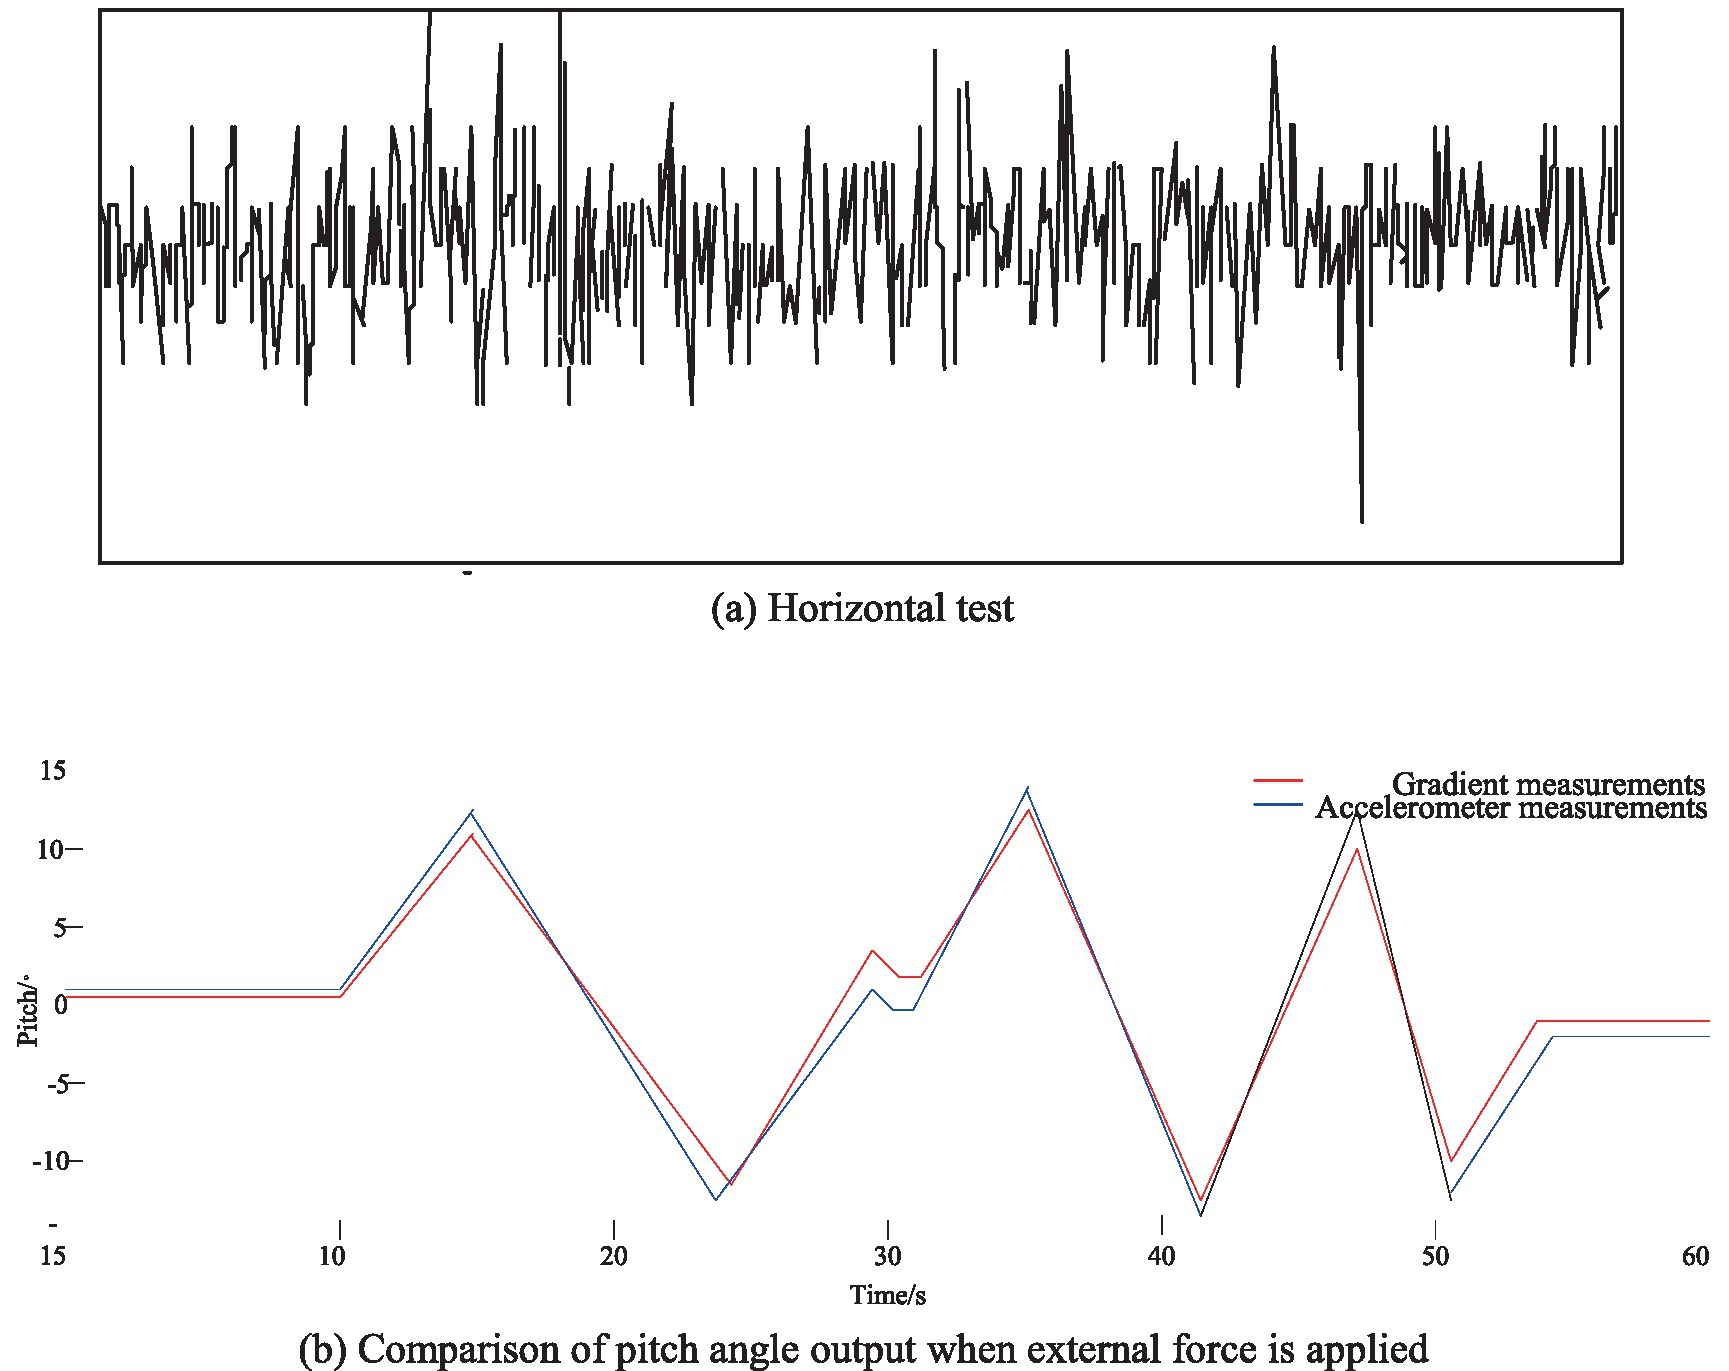
Figure 5. Static test. (A) Horizontal test. (B) Comparison of pitch angle output when external force is applied.
4.1.2. Dynamic analysis
Dynamics testing and the physics system of the Pixhawk flight control will be installed on the flight platform. In the real-time analysis of attitude estimation, the digital transmission frequency of Pixhawk is 915 MHz, and the attitude sampling frequency is 10 Hz. The data stored by the Pixhawk flight record and serial debugging assistant is entered into the Excell form. When the multi-rotor UAV is hovering, the pitch angle is used as a calculation example, and the output results are shown in Figure 6. Due to the vibration of the aircraft, the pitch angle of the aircraft changed around (−0.6, 0.8), which could ensure the calculation accuracy of the attitude solution of the aircraft in flight; at 162 s, due to the change in wind speed, the inclination of the fuselage also changed, and after 12 s, the pitch angle of the fuselage returned to its original level.
When the multi-rotor UAV performs the pitch, roll and yaw motions, the slope descent method and the Pixhawk flight control method are used to obtain Figures 7A,B, as well as Figure 7C. It can be seen from Figure 7 that in the time period of 0 ~ 360 s, the attitude angle calculated by the gradient descent method has no divergence, thus effectively reducing the error caused by the integration of the gyroscope; the inclination error of the two sets of test devices is within ±2.5°, the roll angle error is within ±3°, and some time errors of the yaw angle are very large, but the average error is only 0.8°. The system can well meet the actual flight requirements of the quadrotor UAV.
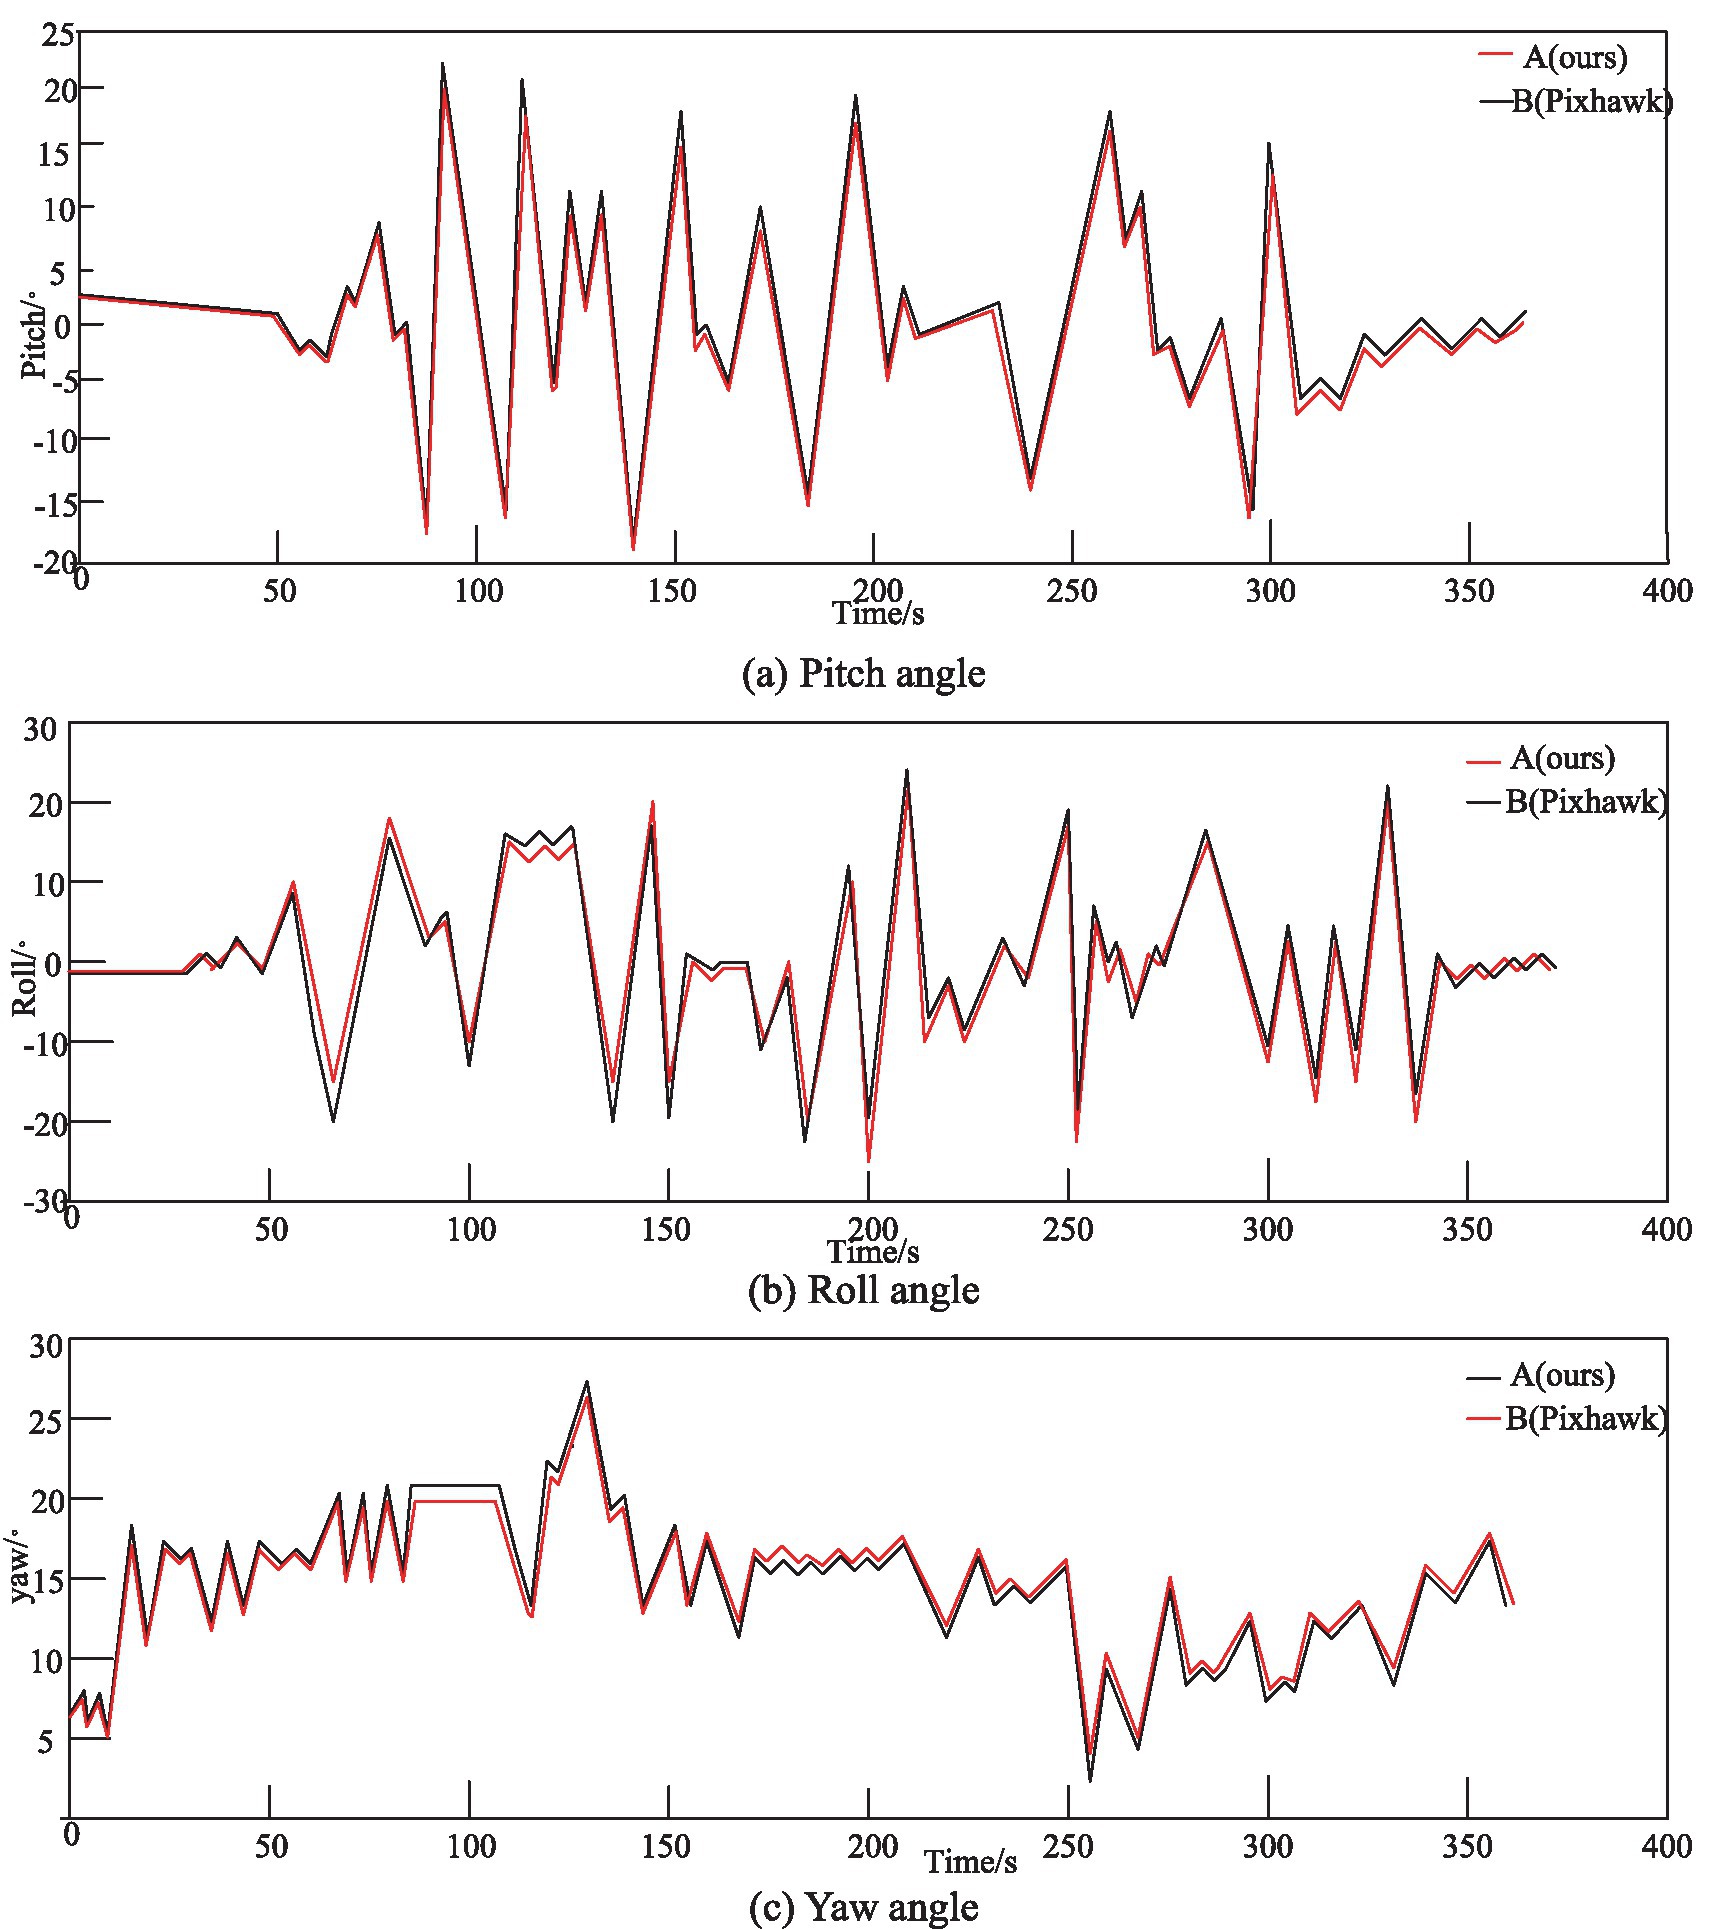
Figure 7. Angle comparison during pitch, roll, and yaw motion. (A) Pitch angle. (B) Roll angle. (C) Yaw angle.
4.2. Simulation experiment
The impact on the positioning accuracy of pollution sources mainly includes the following three aspects:
The influence of the node measurement results of the sensor: Due to the complex factors such as river flow velocity, temperature difference, molecular diffusion, disturbance, convection, etc., the concentration monitoring will be affected. Due to the deviation of the distance of the sensor itself, the deviation of the measurement result of the concentration and the measured data is caused.
Influence on the positioning coordinates of the sensor node: When the sensor node is arranged, its node will float on the water, but in reality, it has a certain floating area.
Reflectance error: In practical applications, there is a certain error in the estimation of the reflection coefficient. In the simulation test, this paper focuses on the influence of the three conditions on the location of the pollution source and it is divided into three cases: complete absorption, incomplete reflection and complete reflection. This paper uses the Matlab simulation platform to verify the previous method.
Setting: The sensor nodes are evenly distributed in the range of 50 m × 20 m, the parameters are N = 5,000 g/s, g = 5, =2.0 m/s, =0.65 m2/s, =0.2*(3600*24 s)– 1, the position of the known sensor node, j = 1,2,...n, n ≥ 3; assuming that the pollution sources appear uniformly in the area of and , the theoretical value of the simulation is obtained according to the diffusion mode.
4.2.1. Influence of concentration noise on positioning accuracy
The influence of the concentration noise on the positioning accuracy is simulated, and the measured values are obtained by taking 5, 10 and 15% of the theoretical concentration value as the zero mean white noise of the reference difference. Firstly, a pollution source is randomly generated near the monitoring point, the concentration of 3 sensor nodes is used for location estimation, and a node is added to each location for location estimation, and then the location estimation of the pollution source is increased to 25.
In Figure 8, the x-axis represents the number of sensor nodes, and the y-axis represents the average error of 100 simulations. In the case of different number of sensor nodes, the root mean square error when using the location algorithm (12) for positioning is 5, 10, and 15%. In three different cases, the average error of the localization algorithm (17) is used. In the case of different concentrations of noise, the influence of density noise on the positioning accuracy is discussed; Figure 8A shows the results of localization under different noise densities at a value of 0; Figure 8B shows the location at different noise densities at a value of 0.5; Figure 8C shows the position at different noise densities at a value of 1.
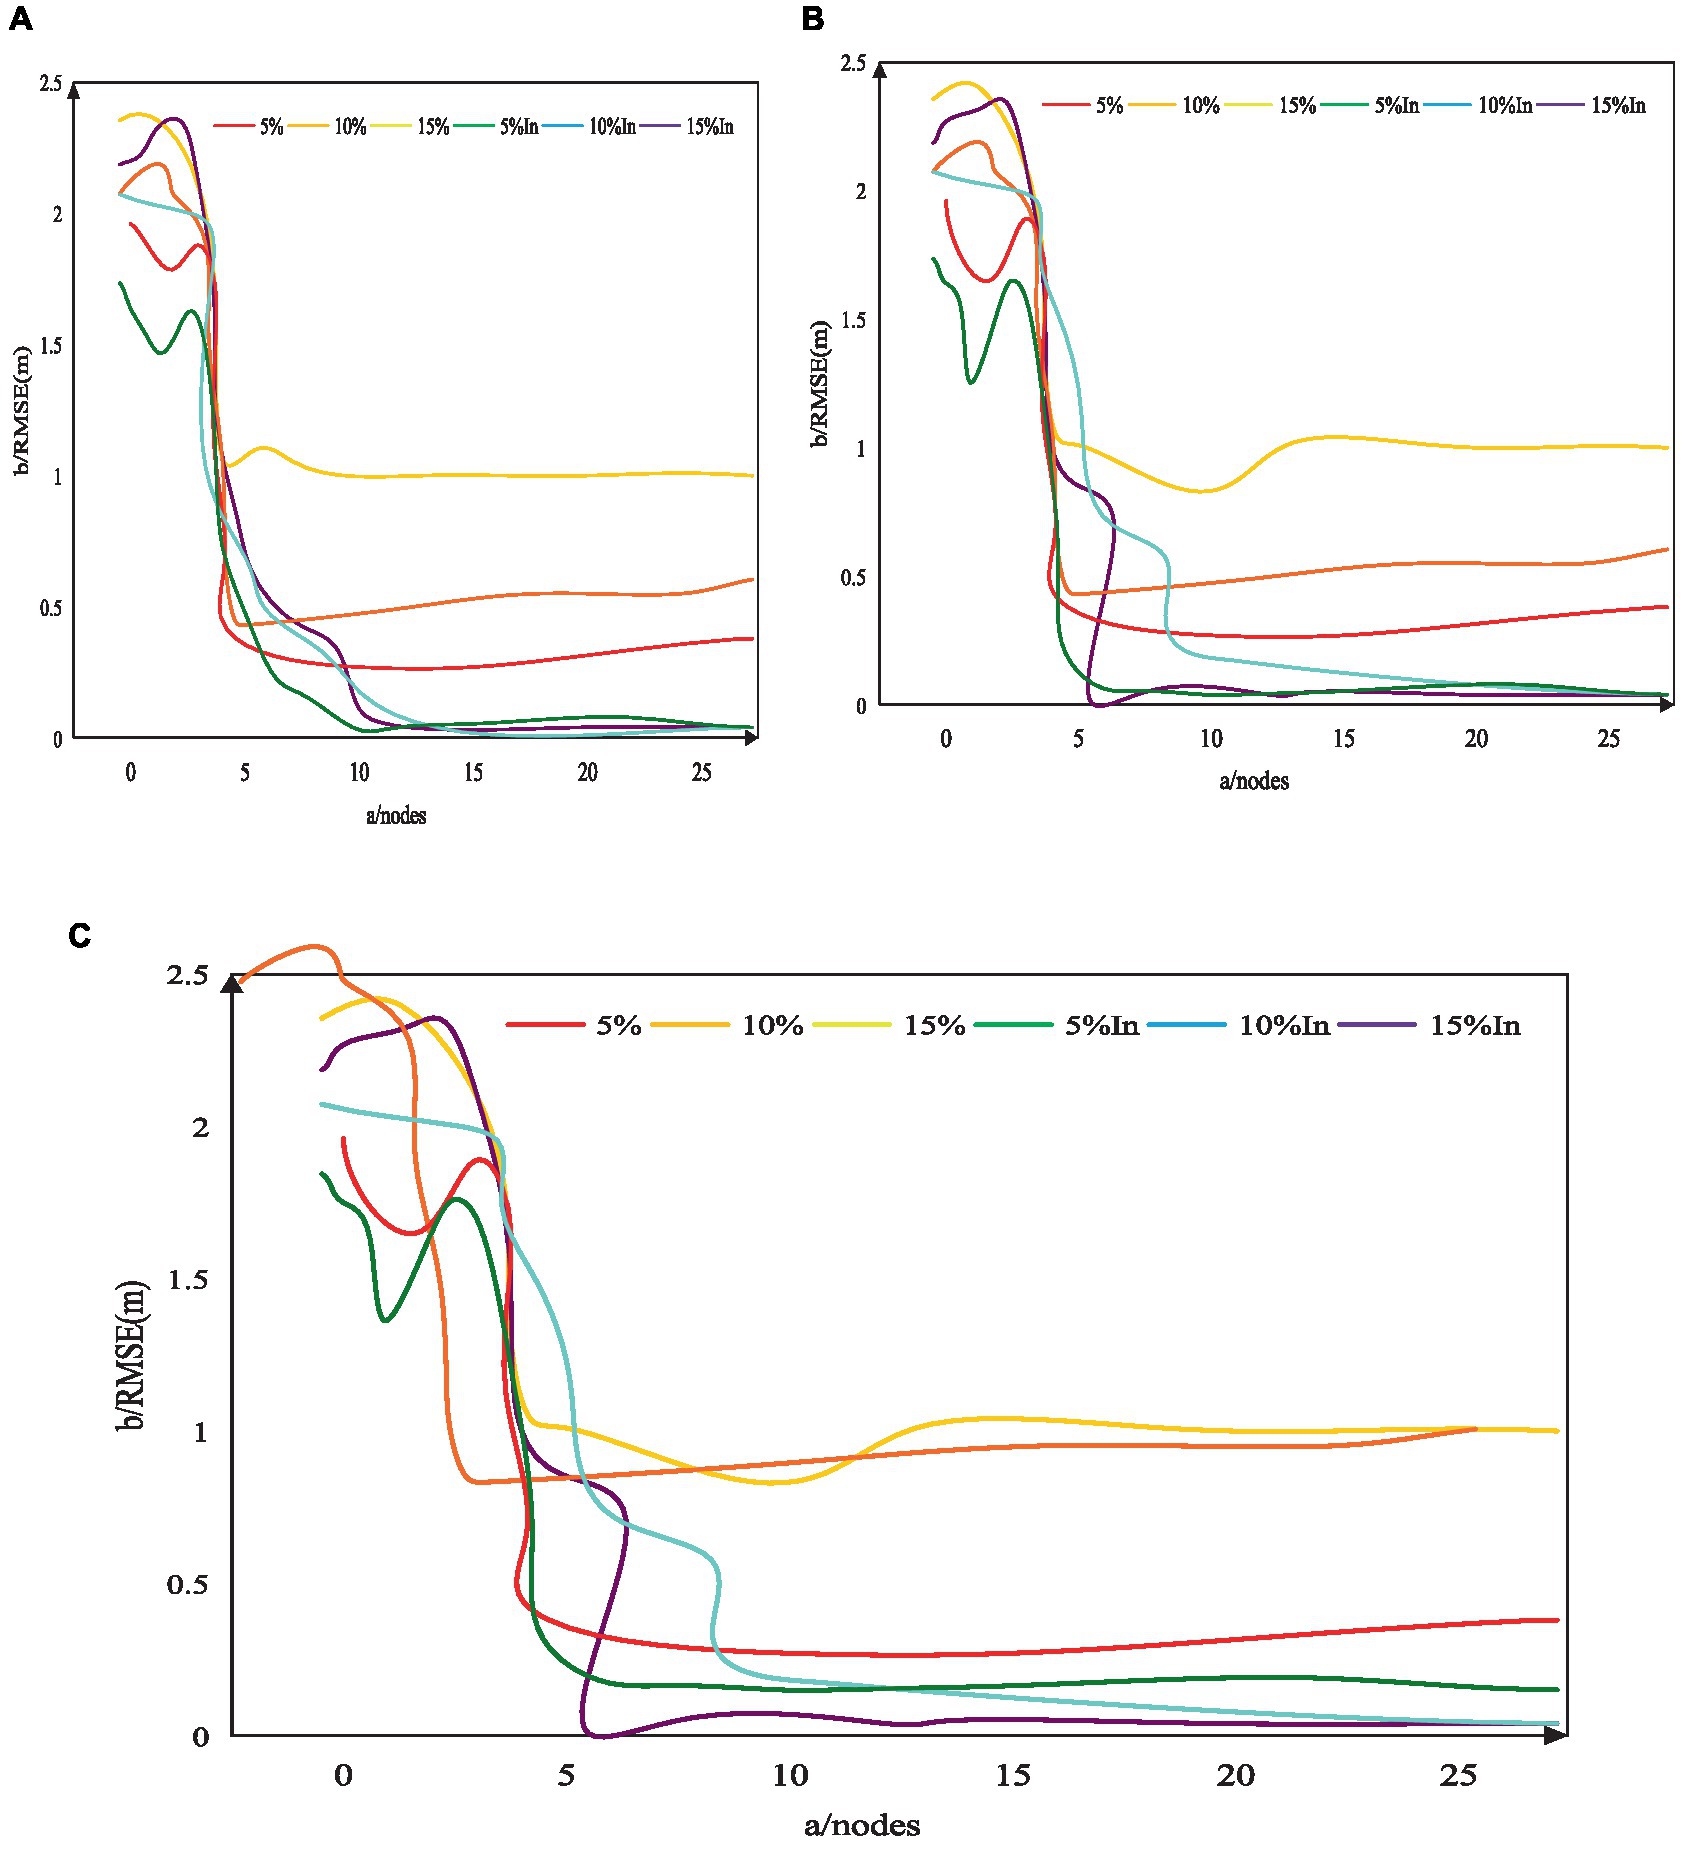
Figure 8. Analysis of noise localization results with different values. (A) The localization results of different concentrations of noise when the value is 0. (B) The localization results of different concentrations of noise when the value is 0.5. (C) The localization results of different concentrations of noise when the value is 1.
It can be seen from Figure 8 that when 3–5 nodes participate in the position, the positioning accuracy of the two algorithms is not high; in 6 ~ 7 nodes, the positioning accuracy of the location algorithm (12) is significantly improved. When the number of nodes participating in the position exceeds 8, the positioning accuracy of the algorithm will not improve with the increase of the number of sensor nodes. As the concentration noise increases, its localization accuracy also increases. In 6 ~ 11 nodes, the localization accuracy of the location algorithm (17) is significantly improved. When the number of sensor nodes participating in the location exceeds 10, the positioning accuracy of the location algorithm (17) will not improve with the increase of the number of sensor nodes. Under 3 different noise densities and 3 different reflection factors, the position accuracy is basically kept no more than 0.2 meters. The positioning accuracy of the positioning algorithm (12) is all greater than 0.2 meters. Compared with (12), the localization algorithm (17) is better. This is due to the strong nonlinearity in (12), while the nonlinearity in (17) decreases in the pair array, resulting in better convergence. The result is better numerical stability and anti-jamming capability (12) compared to localization algorithms (17).
The results show that the positioning accuracy of (17) decreases with the increase of density noise. However, as the number of nodes increases, its positioning accuracy improves and tends to be stable; the location algorithm of (17) is better than the localization algorithm of (12), and the numerical stability and anti-jamming performance are better. In practical applications, since the nonlinearity of the positioning algorithm (17) is reduced, the complexity of the operation is reduced, so that the running time of the system can be increased.
4.2.2. Influence of drift error on positioning accuracy
In the simulation of drift error, zero-mean Gaussian noise is the coordinate value generated after standard deviations of 0.1 m, 0.2 m, and 0.3 m. The influence of different concentration deviations on the measurement accuracy was found in the experiment.
In Figure 9, the x-axis represents the number of sensor nodes, and the y-axis represents the average root mean square error of 100 simulations. At 3 different drift errors, 0.1, 0.2 and 0.3 were used. At 3 different drift errors, algorithm (17) was used for the calculation. The influence of drift error on ranging accuracy under various offset deviation conditions was studied; Figure 9A shows the position results under different drift errors when the value is 0; Figure 9B shows the position results for different drift errors at a value of 0.5. Figure 9C shows the position results for different drift errors when the value is 1.
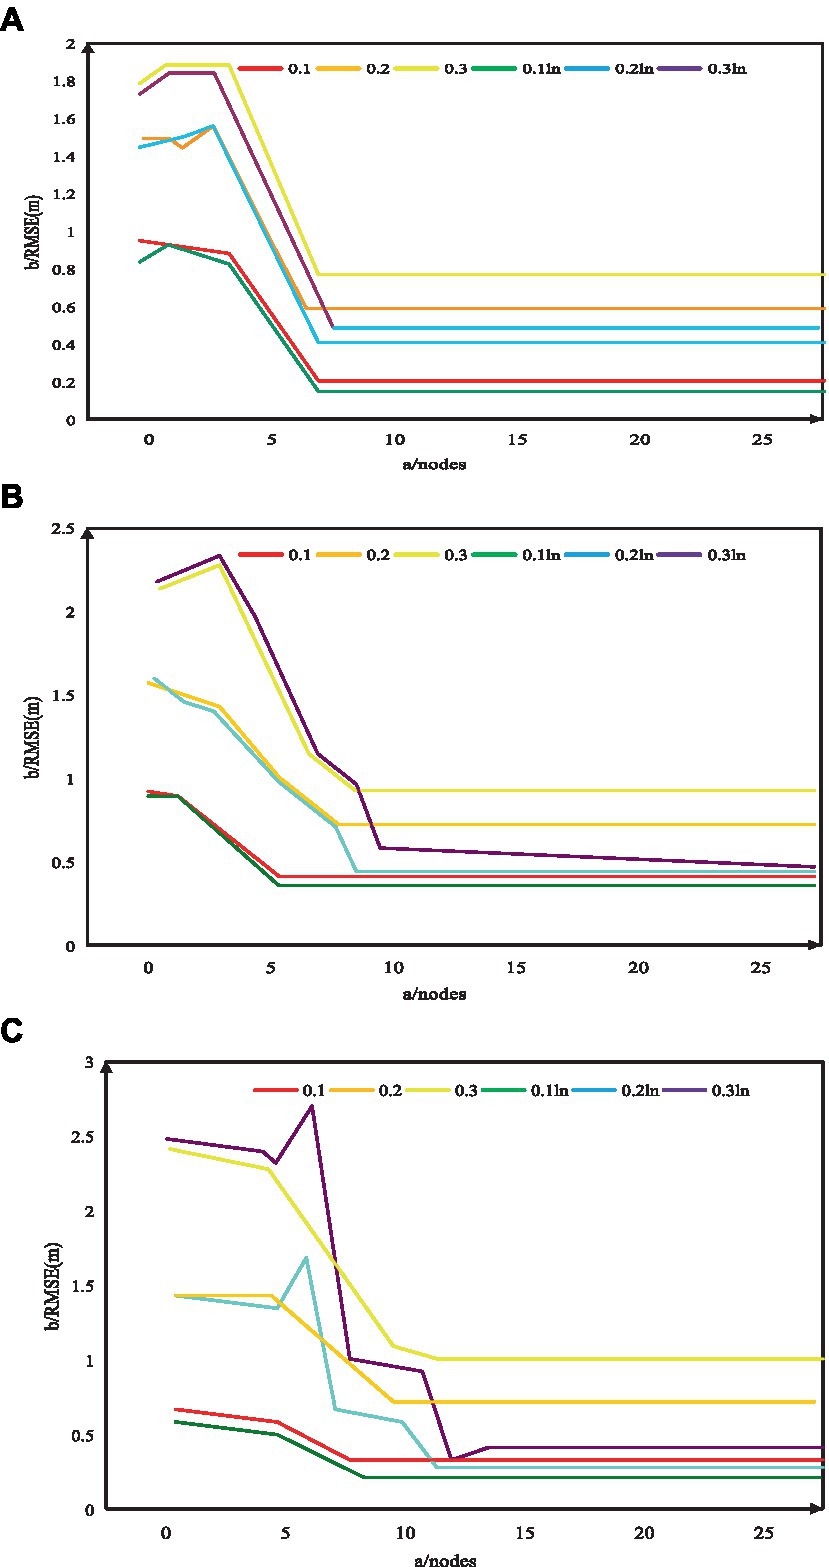
Figure 9. Different values and different drift error positioning results. (A) The positioning results of different drift errors when the value is 0. (B) The positioning results of different drift errors when the value is 0.5. (C) The positioning results of different drift errors when the value is 1.
As shown in Figure 9, as the drift error increases, the error in its position also increases. Under the conditions of three different reflection factors, if the number of nodes participating in the position is less than 6, the localization accuracy of the two methods is not high. The main reason is that the number of nodes participating in the position is small and there is a large drift error. When 6 ~ 10 sensor nodes participate in the position, the positioning accuracy is significantly improved, and the position error of (17) is larger than that of (12); in Figures (b) and (c), the position error of the position algorithm (17) is slightly smaller than that of (12). When the number of nodes participating in the positioning exceeds 10, the positioning error of the positioning algorithm (17) is much smaller than that of the positioning algorithm (12) under the corresponding drift error, and the accuracy of the two positioning algorithms tends to be stable; the positioning algorithm (17) has an error of 0.1 m to 0.4 m, while the positioning algorithm (12) has an error of 0.18 nm to 1 m. The position accuracy shown in Figure (a) is higher than Figures (b) and (c), because when the value is 0, the reflection term is not considered and the positioning error is reduced.
The results show that: in the case of large water drift error, more sensor nodes are required to participate in the position; the location algorithm of algorithm (17) has good convergence performance and is better than the location algorithm of (12) in terms of numerical stability and anti-interference ability. Therefore, in the actual layout, the drift error should be minimized to reduce the impact on the ranging accuracy.
4.2.3. Influence of reflection coefficient on positioning accuracy
In the simulation, the reflection coefficient is , and the influence of the reflection coefficient on the positioning accuracy in three cases was discussed. The influence of different concentration deviations on the measurement accuracy was found in the experiment. In Figure 10, the x-axis represents the number of sensor nodes, and the y-axis represents the average root mean square error after 100 simulations, which are 0.30, 0.70, and 0.90, respectively, during the simulation. Among them, the three reflection factors are 0.30, 0.70, 0.90, and the position errors of the three reflection factors are 0.30 ln, 0.70 ln and 0.90 ln, respectively. The influence of reflection coefficient error on measurement accuracy under different reflection coefficient errors was discussed; Figure (a) is the positioning result of different reflection coefficient errors when the value is 0, Figure (b) is the positioning result of different reflection coefficient errors when the value is 0.5, and Figure (c) is the positioning result of different reflection coefficient errors when the value is 1. As shown in Figure 10: In Figure 10A, under the actual reflection coefficient, at 3–5, the positioning effect of the two positioning methods is poor; when the number of participating position sensors exceeds 5, it can be clearly seen that the positioning accuracy of the positioning algorithm (12) is only improved in time, and the positioning effect in the other two cases is very poor; the localization algorithm of (17) has good convergence performance. In Figure 10B, under the actual reflection coefficient, in 3 ~ 5 positions, the positioning efficiency of the two positioning methods is low; in 6 ~ 11 locations, with only reflection coefficients, the localization accuracy of these two methods is high, while the localization results of the other two methods are not ideal. In Figure 10C, under the actual reflection coefficient, at 3–5, the positioning efficiency of the two positioning methods is low; when the number of nodes participating in the position exceeds 5, in the case of only the reflection factor, the positioning accuracy of the positioning algorithm (12) is low. Other localization effects vary with different reflection parameters, where the location algorithm (17) is more accurate than (12).
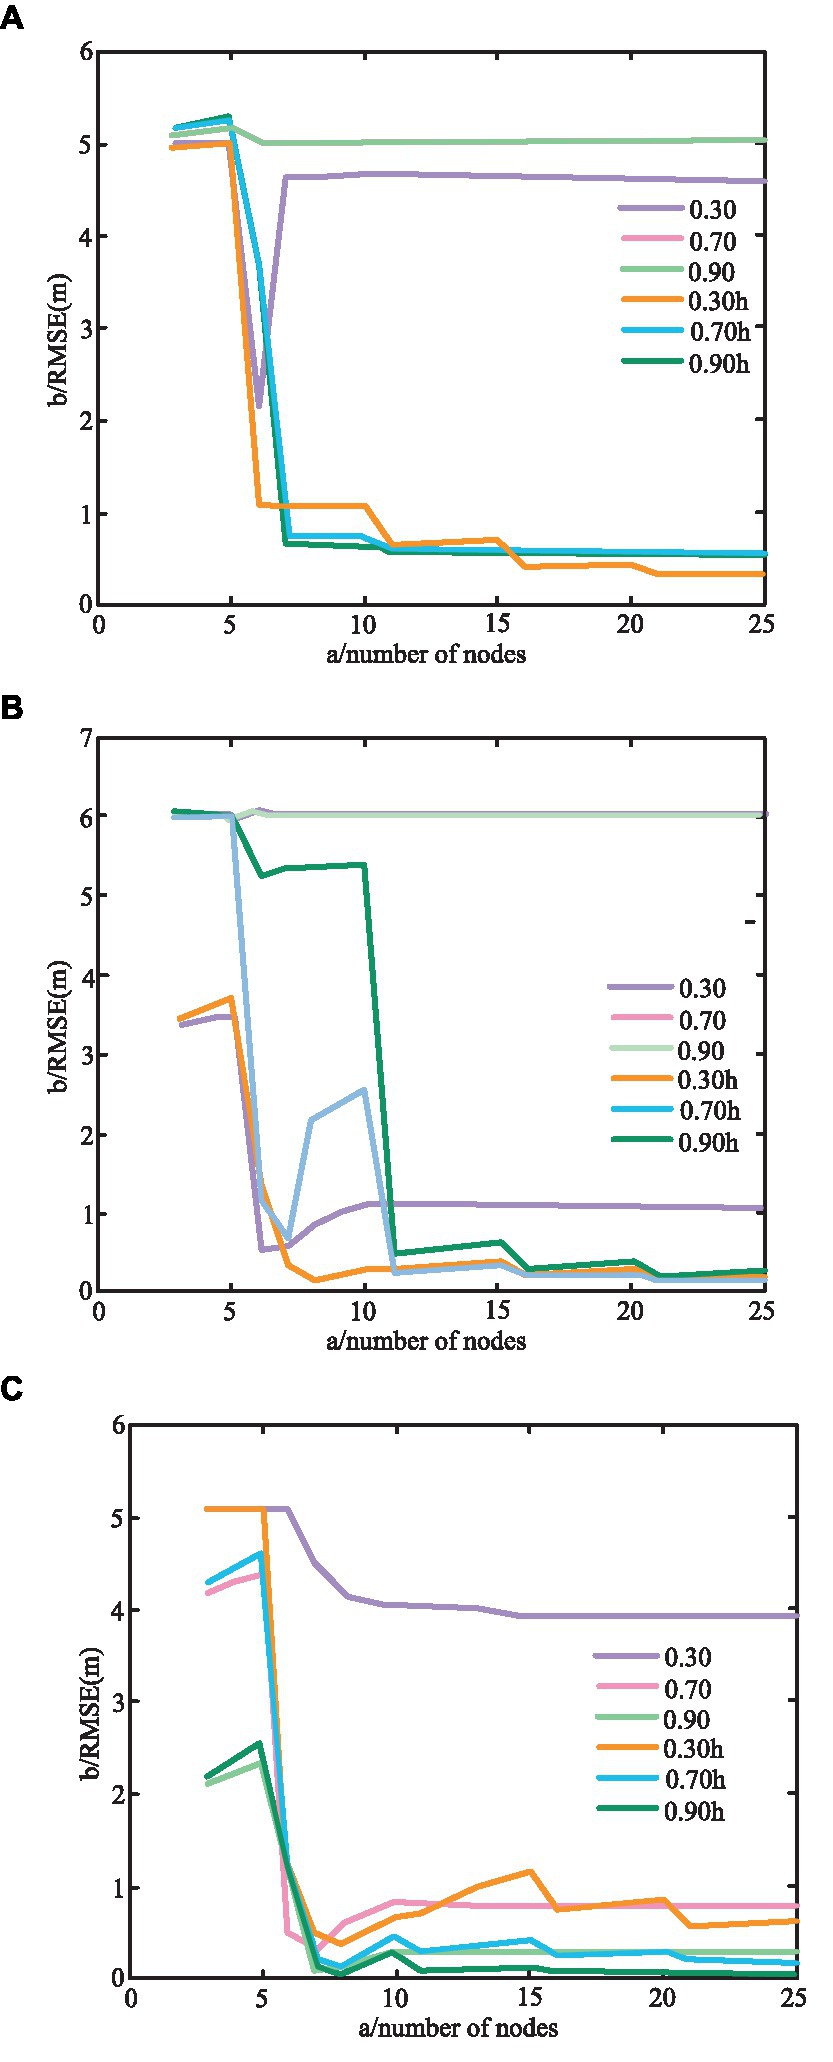
Figure 10. Error location results for different reflection coefficients with different values. (A) The positioning results of different reflection coefficient errors when the value is 0. (B) The positioning results of different reflection coefficient errors when the value is 0.5. (C) The positioning results of different reflection coefficient errors when the value is 1.
The research results show that when the boundary conditions are considered, if the difference between the reflection coefficient and the measured value is large, the accuracy of the measurement result will be greatly affected. If the parameter setting is too large, the positioning result of the positioning algorithm (12) will have errors, while the positioning algorithm of (17) will obtain a satisfactory positioning accuracy; the algorithm (17) has good convergence performance and better anti-interference ability than the positioning algorithm (12).
Therefore, it is very necessary to accurately measure the reflection coefficient of riparian geology to certain pollutants in practical applications. If the boundary is not completely reflected, only when the complete reflection or complete absorption treatment is not advisable for the localization of the pollution source.
5. Conclusion
In this paper, an in-depth study of the visual tracking problem of quadrotor UAV was carried out. Firstly, the overall scheme of flight control and visual tracking of the aircraft was given, and the selection of hardware was explained; secondly, based on the overall design of the hardware, the software of the quadrotor target tracking UAV was described in detail. The adopted algorithm and optimal solution were emphatically expounded, and its basic principle and flight control law were discussed, and the pollution diffusion under the condition of no boundary and near-shore boundary in the river channel was analyzed. A comprehensive model that considered the completely absorbing boundary effect, the incompletely reflecting boundary effect and the completely reflecting boundary effect was proposed. In order to solve the problem of the location of pollution sources in the river, this paper improved the least squares method based on the sum of squares of measured data and theoretical values under boundary conditions, and verified the proposed method. The positioning principle needs to be improved. The camera used in this paper is vertically downward, and the tracking characteristics of the ground characters are not obvious, and it is not convenient to observe the face of the characters. The follow-up camera can form a certain angle with the ground, which is convenient to observe the target features, especially when tracking the character features, the positioning principle should be improved.
Data availability statement
The original contributions presented in the study are included in the article/supplementary material, further inquiries can be directed to the corresponding author.
Author contributions
All authors listed have made a substantial, direct, and intellectual contribution to the work and approved it for publication.
Funding
This work was supported by research and development of data management integration for intelligent control equipment of industrial wastewater treatment based on deep learning algorithm (KYP022204) and Research on the Blockchain-backup System of Digital Collections (KYH2022011).
Conflict of interest
The authors declare that the research was conducted in the absence of any commercial or financial relationships that could be construed as a potential conflict of interest.
Publisher’s note
All claims expressed in this article are solely those of the authors and do not necessarily represent those of their affiliated organizations, or those of the publisher, the editors and the reviewers. Any product that may be evaluated in this article, or claim that may be made by its manufacturer, is not guaranteed or endorsed by the publisher.
References
Amiri, S., Mazaheri, M., and Samani, J. (2019). Introducing a general framework for pollution source identification in surface water resources (theory and application). J. Environ. Manag. 248:109281. doi: 10.1016/j.jenvman.2019.109281
Bazan, G. H., Scalassara, P. R., Endo, W., Endo, W., Goedtel, A., Godoy, W. F., et al. (2017). Stator fault analysis of three-phase induction motors using information measures and artificial neural networks. Electr. Power Syst. Res. 143, 347–356. doi: 10.1016/j.epsr.2016.09.031
Bnic, M. V., Rdoi, A., and Prvu, P. V. (2019). Onboard visual tracking for UAV'S. Sci. J Silesian Univ. Technol. Ser Trans. 105, 35–48. doi: 10.20858/sjsutst.2019.105.4
Cervone, G., Clemente-Harding, L., Alessandrini, S., and Delle Monache, L. (2017). Short-term photovoltaic power forecasting using artificial neural networks and an analog ensemble. Renew. Energy 108, 274–286. doi: 10.1016/j.renene.2017.02.052
Chaoraingern, J., Tipsuwanporn, V., and Numsomran, A. (2020). Modified adaptive sliding mode control for trajectory tracking of mini-drone quadcopter unmanned aerial vehicle. Int. J. Intellig. Eng. Syst. 13, 145–158. doi: 10.22266/ijies2020.1031.14
Falco, I. D., Pietro, G. D., and Cioppa, A. D. (2019). Evolution-based configuration optimization of a deep neural network for the classification of obstructive sleep apnea episodes. Futur. Gener. Comput. Syst. 98, 377–391. doi: 10.1016/j.future.2019.01.049
Gao, S., Zhou, M., and Wang, Y. (2019). Dendritic neuron model with effective learning algorithms for classification, approximation, and prediction. IEEE Trans. Neural Netw. Learn. Syst. 30, 601–614. doi: 10.1109/TNNLS.2018.2846646
García-Segura, T., Yepes, V., and Frangopol, D. M. (2017). Multi-objective design of post-tensioned concrete road bridges using artificial neural networks. Struct. Multidiscip. Optim. 56, 139–150. doi: 10.1007/s00158-017-1653-0
Giovanis, D. G., Papaioannou, I., Straub, D., and Papadopoulos, V. (2017). Bayesian updating with subset simulation using artificial neural networks. Comput. Methods Appl. Mech. Eng. 319, 124–145. doi: 10.1016/j.cma.2017.02.025
Lee, M. H., Yeom, S., and Hwang, S. O. (2018). Multiple target detection and tracking on urban roads with a drone. J. Intellig. Fuzzy Syst. 35, 6071–6078. doi: 10.3233/JIFS-169847
Li, S., Durdevic, P., and Yang, Z. (2019). Optimal tracking control based on integral reinforcement learning for an underactuated drone-science direct. IFAC Papers OnLine 52, 55–60. doi: 10.1016/j.ifacol.2019.08.048
Oliveira, M., Miranda, R. K., Costa, J., Almeida, A. L. F. D., and Sousa, R. T. D. (2019). Low cost antenna Array based drone tracking device for outdoor environments. Wirel. Commun. Mob. Comput. 2019, 1–14. doi: 10.1155/2019/5437908
Orlandi, A. (2018). Multiple objectives optimization for an EBG common mode filter by using an artificial neural network. IEEE Transact. Electromag. Compat. 60, 507–512. doi: 10.1109/TEMC.2017.2749624
Ramamonjy, A., Bavu, E., Garcia, A., and Hengy, S. (2017). A distributed network of compact microphone arrays for drone detection and tracking. J. Acoust. Soc. Am. 141:3651. doi: 10.1121/1.4987898
Singh, P., and Dwivedi, P. (2019). A novel hybrid model based on neural network and multi-objective optimization for effective load forecast. Energy 182, 606–622. doi: 10.1016/j.energy.2019.06.075
Sugiarto, A. (2020). Rancang Bangun Tracking Senjata SS2 Pada Drone Quadcopter S2GA. Jurnal Teknik Elektro dan Komputer TRIAC 7, 1–5. doi: 10.21107/triac.v7i1.7276
Talaat, M., Farahat, M. A., and Mansour, N. (2020). Load forecasting based on grasshopper optimization and a multilayer feed-forward neural network using regressive approach. Energy 196:117087. doi: 10.1016/j.energy.2020.117087
Turabieh, H., Mafarja, M., and Li, X. (2019). Iterated feature selection algorithms with layered recurrent neural network for software fault prediction. Expert Syst. Appl. 122, 27–42. doi: 10.1016/j.eswa.2018.12.033
Wang, J., Zhao, J., Lei, X., and Wang, H. (2018). New approach for point pollution source identification in rivers based on the backward probability method. Environ. Pollut. 241, 759–774. doi: 10.1016/j.envpol.2018.05.093
Xiao, G., Wang, T., Chen, X., and Zhou, L. (2022). Evaluation of ship pollutant emissions in the ports of Los Angeles and Long Beach. J. Mar. Sci. Eng. 10:1206. doi: 10.3390/jmse10091206
Yutao, W. U., Ren, H., and Xia, J. (2017). Effects of pollution source location on distribution of pollutant concentration downstream of cylindrical hydraulic structure. Adv. Sci. Technol. Water Res. 37, 49–54. doi: 10.3880/j.issn.1006-7647.2017.03.008
Keywords: drone vision, pollution source location, target motion model, tracking, location and tracking
Citation: Shen B, Jiang J, Li D and Qian F (2023) Location and tracking of environmental pollution sources under multi-UAV vision based on target motion model. Front. Ecol. Evol. 11:1178990. doi: 10.3389/fevo.2023.1178990
Edited by:
Xin Ning, Institute of Semiconductors (CAS), ChinaReviewed by:
Hu Qinhui, Guilin University of Aerospace Technology, ChinaCheng Tong, Saigon University, Vietnam
Dazhuang Li, Macau University of Science and Technology, Macao SAR, China
Copyright © 2023 Shen, Jiang, Li and Qian. This is an open-access article distributed under the terms of the Creative Commons Attribution License (CC BY). The use, distribution or reproduction in other forums is permitted, provided the original author(s) and the copyright owner(s) are credited and that the original publication in this journal is cited, in accordance with accepted academic practice. No use, distribution or reproduction is permitted which does not comply with these terms.
*Correspondence: Juan Jiang, NDA5MTVAaGR1LmVkdS5jbg==
 Baohua Shen
 Juan Jiang
