 Tianlin Zhai
 Longyang Huang
- 1College of Resources and Environmental Sciences, Henan Agricultural University, Zhengzhou, China
- 2School of Resource and Environmental Sciences, Wuhan University, Wuhan, China
Rapid urbanization has led to the continuous degradation of natural ecological space within large urban agglomerations, triggering landscape fragmentation and habitat loss, which poses a great threat to regional ecological sustainability. Ecological networks (ENs) are a comprehensive control scheme to protect regional ecological sustainability. However, in the current research about ENs, most studies can only determine the orientation of ecological corridors but not their specific spatial range. This leads to the fact that ENs can only be abstract concepts composed of points and lines, and cannot be implemented into concrete spatial planning. In this study, taking the Shandong Peninsula urban agglomeration as an example, ecological sources were identified by morphological spatial pattern analysis (MSPA) and habitat quality assessment, ecological resistance surfaces were constructed based on habitat risk assessment (HRA). And circuit theory was used to simulate the ecosystem processes in heterogeneous landscapes via by calculating the cumulative current value and cumulative current recovery value, to identify the spatial range and key areas of ecological corridors. The results showed that the ENs includes 6,263.73 km2 of ecological sources, 12,136.61 km2 of ecological corridors, 283.61 km2 of pinch points and 347.51 km2 of barriers. Specifically, ecological sources were distributed in a spatial pattern of five groups, and ecological corridors were short and dense within groups, long in distance and narrow in width between groups. The pinch points and barriers mainly exist in the ecological corridors connecting the inner and outer parts of the central city and in the inter-group corridors. In order to ensure the connectivity and effectiveness of ENs, it is necessary to focus on the pinch points and barriers and include them in the priority areas for protection and restoration. Based on MSPA and circuit theory, this study provides a new method for determining the spatial range of ENs and the specific locations of priority areas, and provides a feasible solution for the concrete implementation of ENs to achieve effective ecological protection and restoration.
Introduction
In recent decades, with the acceleration of global environmental change and urbanization, land cover and related surface processes have undergone significant changes (Deng et al., 2009; Kong et al., 2017). Especially in large urban agglomeration, with the continuous expansion of construction land, the land use pattern had undergone great changes in quantity, quality and spatial layout (Peng et al., 2017; Salvati et al., 2018). It was mainly embodied in the transformation from the original natural ecosystem with ecological land as the carrier to the socio-economic system with construction land as the carrier (Rebelo et al., 2011). In the process of system transformation, on the one hand, with the decrease of natural ecological space, a series of ecological functions such as regional biodiversity, carbon storage, climate regulation and water conservation were destroyed (Pei et al., 2015; Mcdonald et al., 2018; Wang et al., 2019; Jin et al., 2020). On the other hand, with the continuous expansion of urban space, the population have been concentrated in urban areas, which lead to the continuous increase of pollutant emissions and accelerated consumption of natural resources (Elansky et al., 2018; Wang et al., 2019), destroying the ecological environment and threatening the safety of the entire ecosystem (Hammad and Tumeizi, 2012; Masum et al., 2017).
Researchers have proposed the concept of ecological networks (ENs) aimed at avoiding threats to the basic structure and function of ecosystems from the uncontrolled expansion of urban construction. ENs is essentially a spatial regulation scheme that coordinates natural ecosystems with socio-economic systems (Liang et al., 2018; D’Aloia et al., 2019; De Montis et al., 2019). It identifies the most important areas by comparing the importance of different landscape patches to ecological processes and ecological functions, and constructs a network system that can maintain the integrity of regional ecosystems and the continuity of ecological processes (Isaac et al., 2018; Cunha and Magalhães, 2019; Huang X. et al., 2021; Tang et al., 2021). Thus, it avoids the occupation and disturbance of these areas by urban expansion and ultimately ensures the ecological sustainability of regional development (Huang X. et al., 2021). Similar concepts include ecological infrastructure (EI) (Marchant, 2014; Sigwela et al., 2017), green infrastructure (GI) (Weber et al., 2006; Liquete et al., 2015; Coppola et al., 2019; Afionis et al., 2020), ecological security pattern (ESP) (Peng et al., 2018a,2019; Huang et al., 2019; Wang and Pan, 2019).
After decades of development, ENs construction has formed a basic research paradigm of “identifying ecological sources, constructing ecological resistance surfaces, and extracting ecological corridors” (Weber et al., 2006; Peng et al., 2018b; Huang L. et al., 2021; Huang X. et al., 2021). Various techniques within the framework are also evolving. Among them, ecological sources are habitat patches that are important to regional ecosystems or have radiating functions. They are the basis for building ENs, which are generally identified by quantitative evaluation of ecological importance. Ecological functional importance is generally determined by calculating the ecosystem services that ecological patches can provide, such as biodiversity, climate regulation and pollution prevention (Huang et al., 2019; Peng et al., 2019; Dai et al., 2021). Landscape connectivity, ecological sensitivity and environmental suitability are also important indicators in the ecological importance evaluation system (Pierik et al., 2016; Su et al., 2016; Zhang et al., 2016). In addition, morphological spatial pattern analysis (MSPA) is gradually becoming a key technical method for ecological sources identification because of its emphasis on structural connectivity to increase the scientific nature of ecological source selection (Xiao et al., 2020; Huang X. et al., 2021). Ecological resistance surface is another core element in the ENs construction. It is generally obtained by assigning values to land use types. Since direct assignment is too subjective and ignores the internal differences under the same land use type, it hides the influence of human activities on the ecological resistance coefficient (Huang et al., 2019; Li et al., 2020). Therefore, indicators such as nighttime light intensity, impervious area, and surface moisture index, which can reflect the landscape heterogeneity of the study area, are gradually used for the correction of the resistance surface (Peng et al., 2018b,2019; Huang L. et al., 2021). In the ecological corridor extraction, the minimum cumulative resistance model (MCR) is the traditional method which can determine the direction and optimal route of biological flow, but cannot clarify the spatial extent and key nodes of ecological corridors (Huang et al., 2019; Dai et al., 2021). The application of circuit theory effectively bridges this gap by simulating the direction of bio-flow through the random walk of electric current and determining the key locations in the corridor according to the magnitude of current intensity (Peng et al., 2018b; Yang et al., 2021; Yu et al., 2021) (Figure 1).
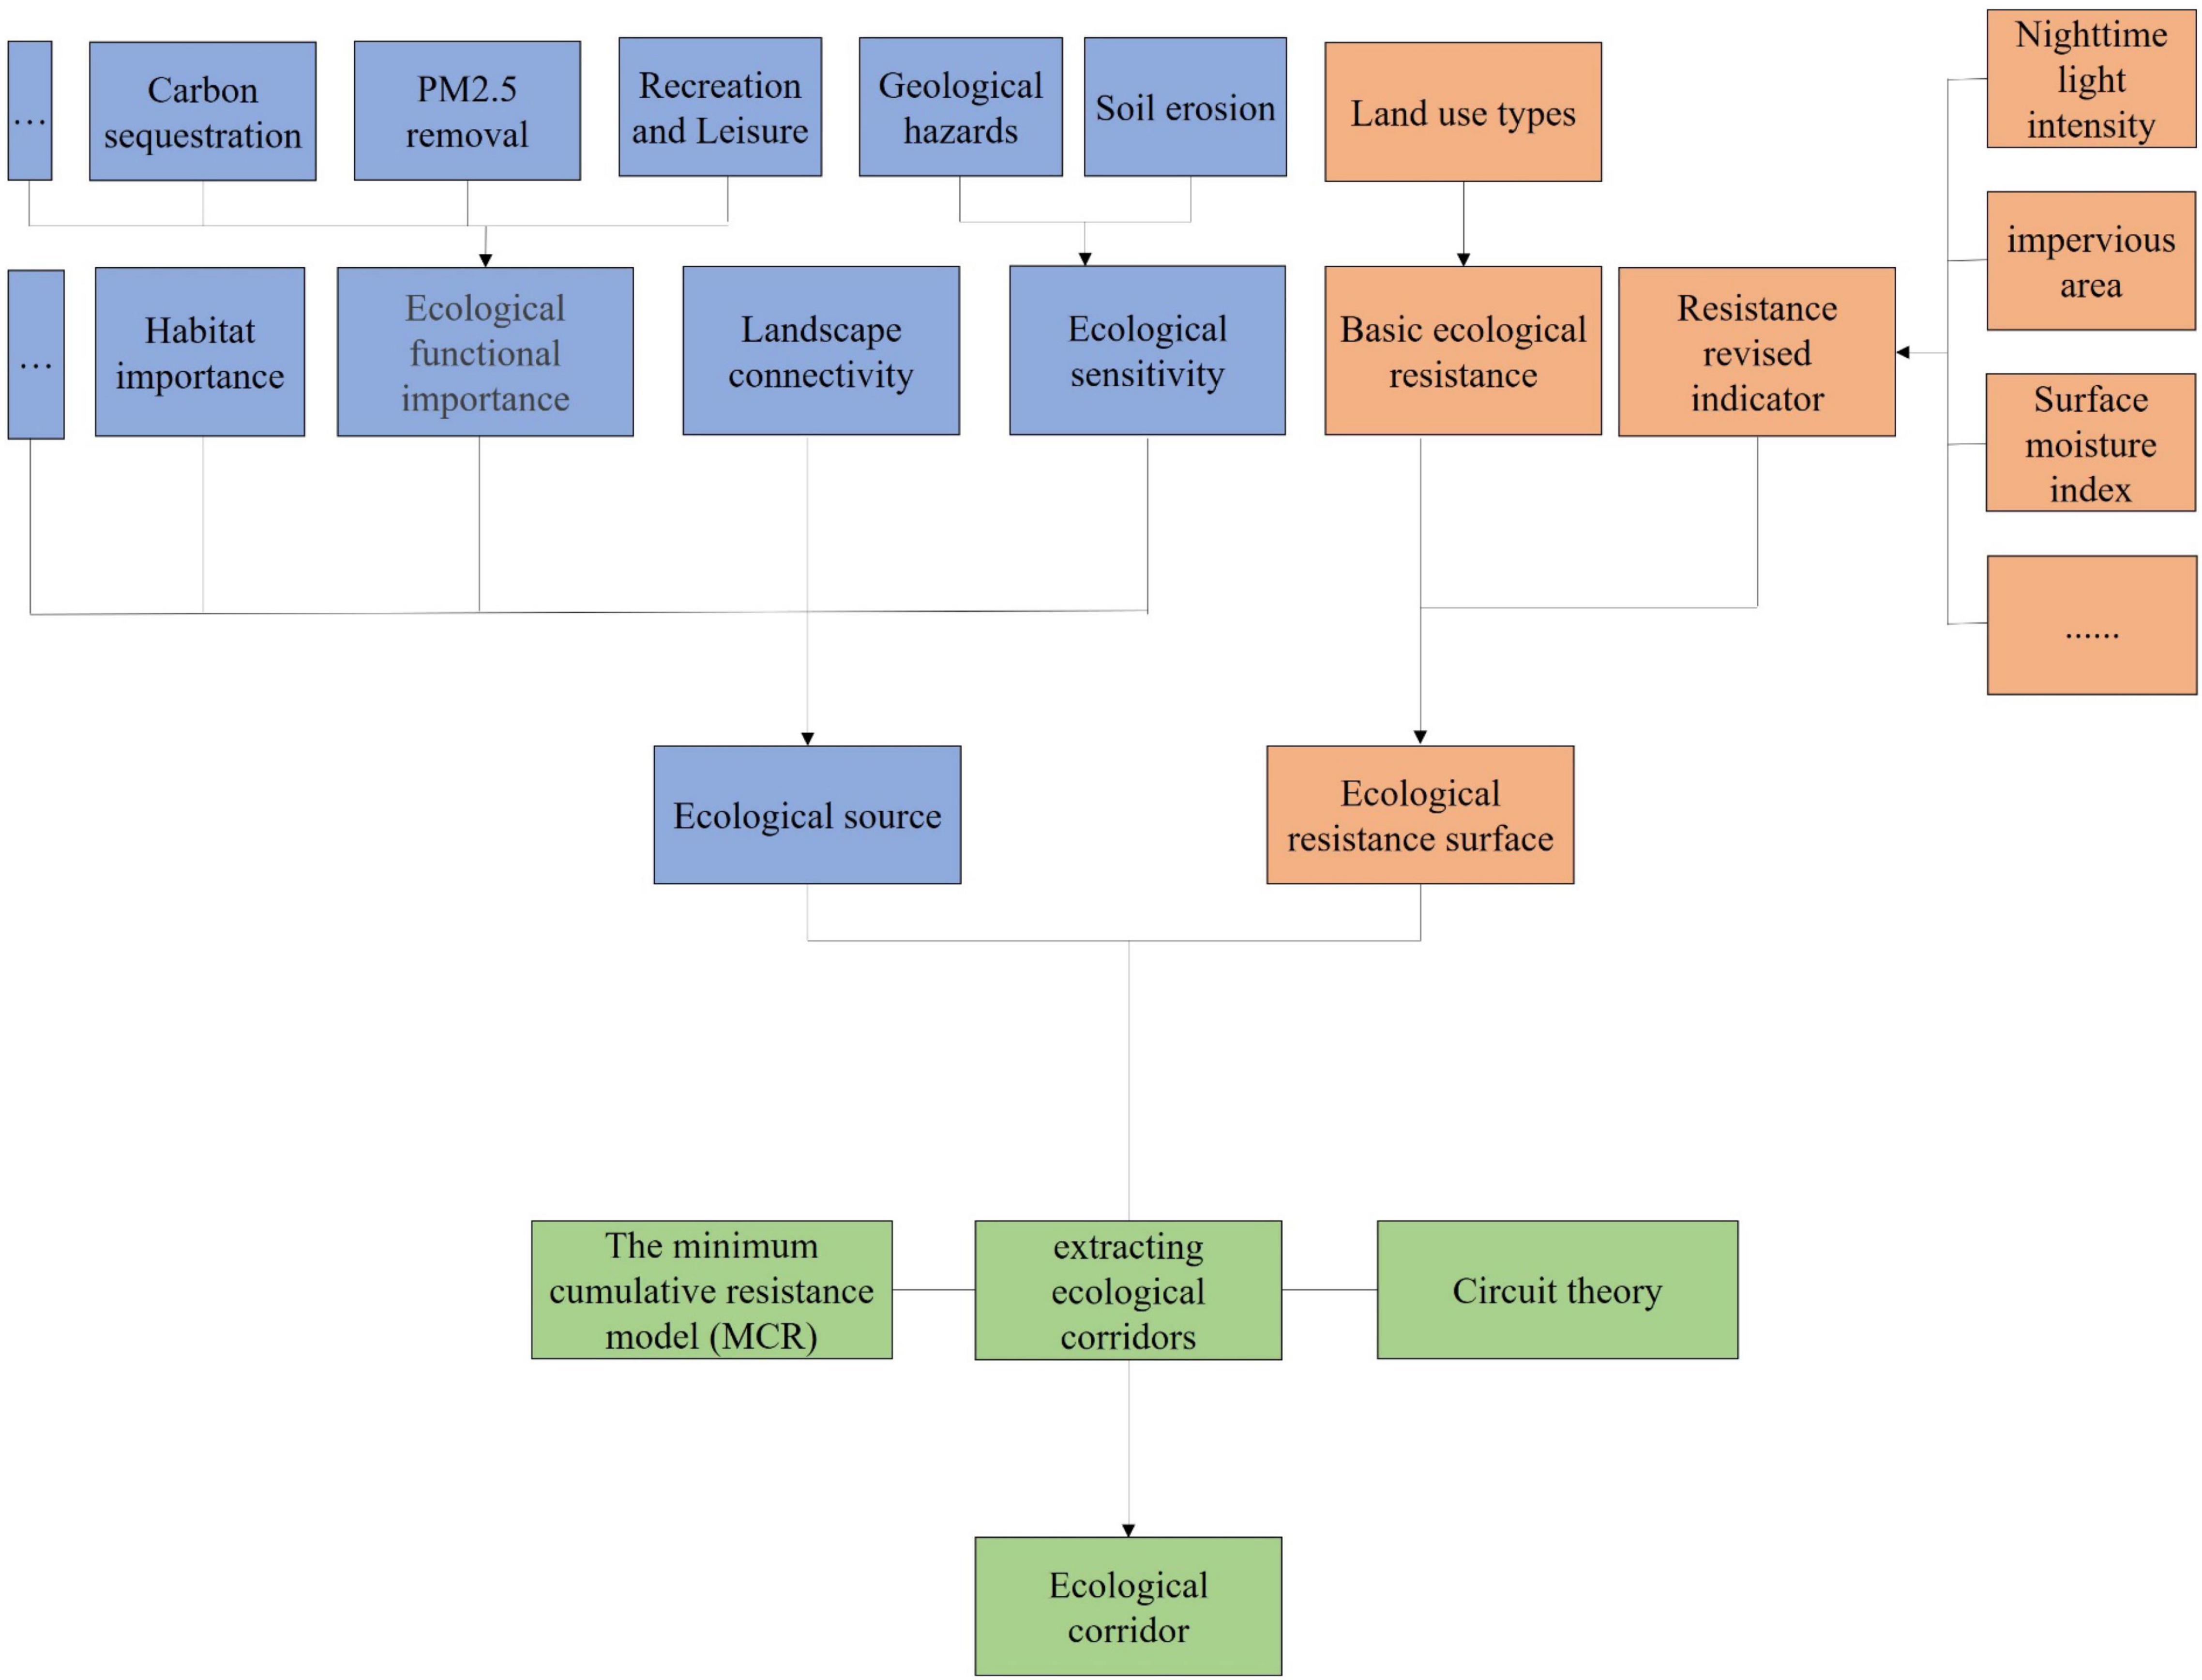
Figure 1. The basic research paradigm of ecological network construction (blue boxes, identifying ecological sources; orange boxes, constructing ecological resistance surfaces; green boxes, extracting ecological corridors).
In recent years, research on ENs has gradually begun to focus on the identification of the spatial range of ENs, where the core research problem is the determination of the width of ecological corridors. Once the width of the ecological corridor is determined, it will make ENs no longer abstract networks composed of points and lines, but landscape entities with relatively defined spatial range. This will provide the theoretical and methodological foundation for promoting ecological conservation and restoration implementation planning and further research within the spatial range of ENs (Huang L. et al., 2021). Peng et al. (2018a) identified the width of ecological corridors in Yunnan Province based on the threshold of cummulated resistance. Dong et al. (2020) integrated spatial continuous wavelet transform and kernel density analysis to determine the spatial range of ecological corridors in Beijing. Huang L. et al. (2021) determined the width of ecological corridors in Shanghai according to different cumulative resistance thresholds and the change trends of risk indexes. These studies, based on the edge effect of ecological corridors, determined the width of ecological corridors according to the change trend of indicators reflecting the landscape heterogeneity on both sides inside and outside the corridor, which were the useful attempt in the study of determining the width of ecological corridors and promotes the study of the identification of the spatial range of ENs. However, these methods suffer from strong subjectivity in the selection of indicators and large spatial gradients, making the accuracy and spatial precision of ecological corridor widths doubtful. In general, the current research on identifying the spatial range of ENs is still in the initial stage, and further improvements are still needed in the theoretical basis, identification methods and validity tests. This study proposed an approach to determine the width of ecological corridors based on the effective cumulative current values of ecological corridor simulated by circuit theory, in an attempt to improve the objectivity and spatial precision in determining the width of ecological corridor. The purpose of this study is to identify the key areas within the ENs based on the improved identification method of ENs spatial range. Then, according to the nature of the key areas, priority areas for conservation and restoration in the ENs of large urban agglomeration were identified.
The Shandong Peninsula urban agglomeration, located in the eastern coastal region of China, is one of the fastest growing urban agglomerations in China (Peng et al., 2020). During the past decades of development, it has experienced a rapid urbanization process, and the structure and function of the regional ecosystem have suffered a violent impact. This is also a common problem faced by other rapidly developing urban agglomeration. Taking the Shandong Peninsula urban agglomeration as an example, this study is based on a new approach to determine the ENs spatial range of the urban agglomeration, and to identify priority areas for conservation and restoration in the ENs. Specifically, this study has three research objectives: (1) to integrate MSPA and circuit theory to identify the spatial range and key areas of ENs in large urban agglomeration areas; (2) to identify priority conservation and restoration areas in ENs based on the nature of key areas; (3) to integrate important areas of ecosystem functions and key areas of ENs into ecological conservation and restoration implementation plans for large urban agglomeration. By focusing on priority areas, to develop implementation planning to promote the implementation efficiency of restoration and conservation measures in large urban agglomeration.
Study Area and Data Source
Study Area
The Shandong Peninsula urban agglomeration is one of the important urban agglomeration in northern China, located on the eastern coast of China and the southern flank of the Bohai Sea Rim. The specific scope of the Shandong Peninsula urban agglomeration varies depending on the claims made by the government and scholars at different times. In this study, we adopt the widely accepted 8-city scenario proposed by Prof. Zhou Yixing in “Study on the Development Strategy of Shandong Peninsula Urban Agglomeration,” including the coastal cities of Yantai, Weihai, Qingdao, Rizhao, Weifang, Dongying and the two non-coastal cities of Zibo and Jinan (Figure 2). The total land area of Shandong Peninsula urban agglomeration is about 73,000 km2, accounting for 46.5% of the Shangdong province. By the end of 2018, the resident population of Shandong Peninsula urban agglomeration was 45,984,200, accounting for 45.77% of Shangdong province; the regional GDP was 4,891,191 billion yuan, accounting for 63.96% of Shandong province, and the per capita GDP was 106,400 yuan, 1.39 times of the province’s average. Since 2,000, with the accelerated urbanization process, the ecological space within the urban agglomeration has been squeezed and degraded, and the biodiversity has been drastically reduced. Strict ecological protection and restoration measures must be taken to improve the ecological situation, maintain the ecological security of urban agglomerations and achieve sustainable regional development.
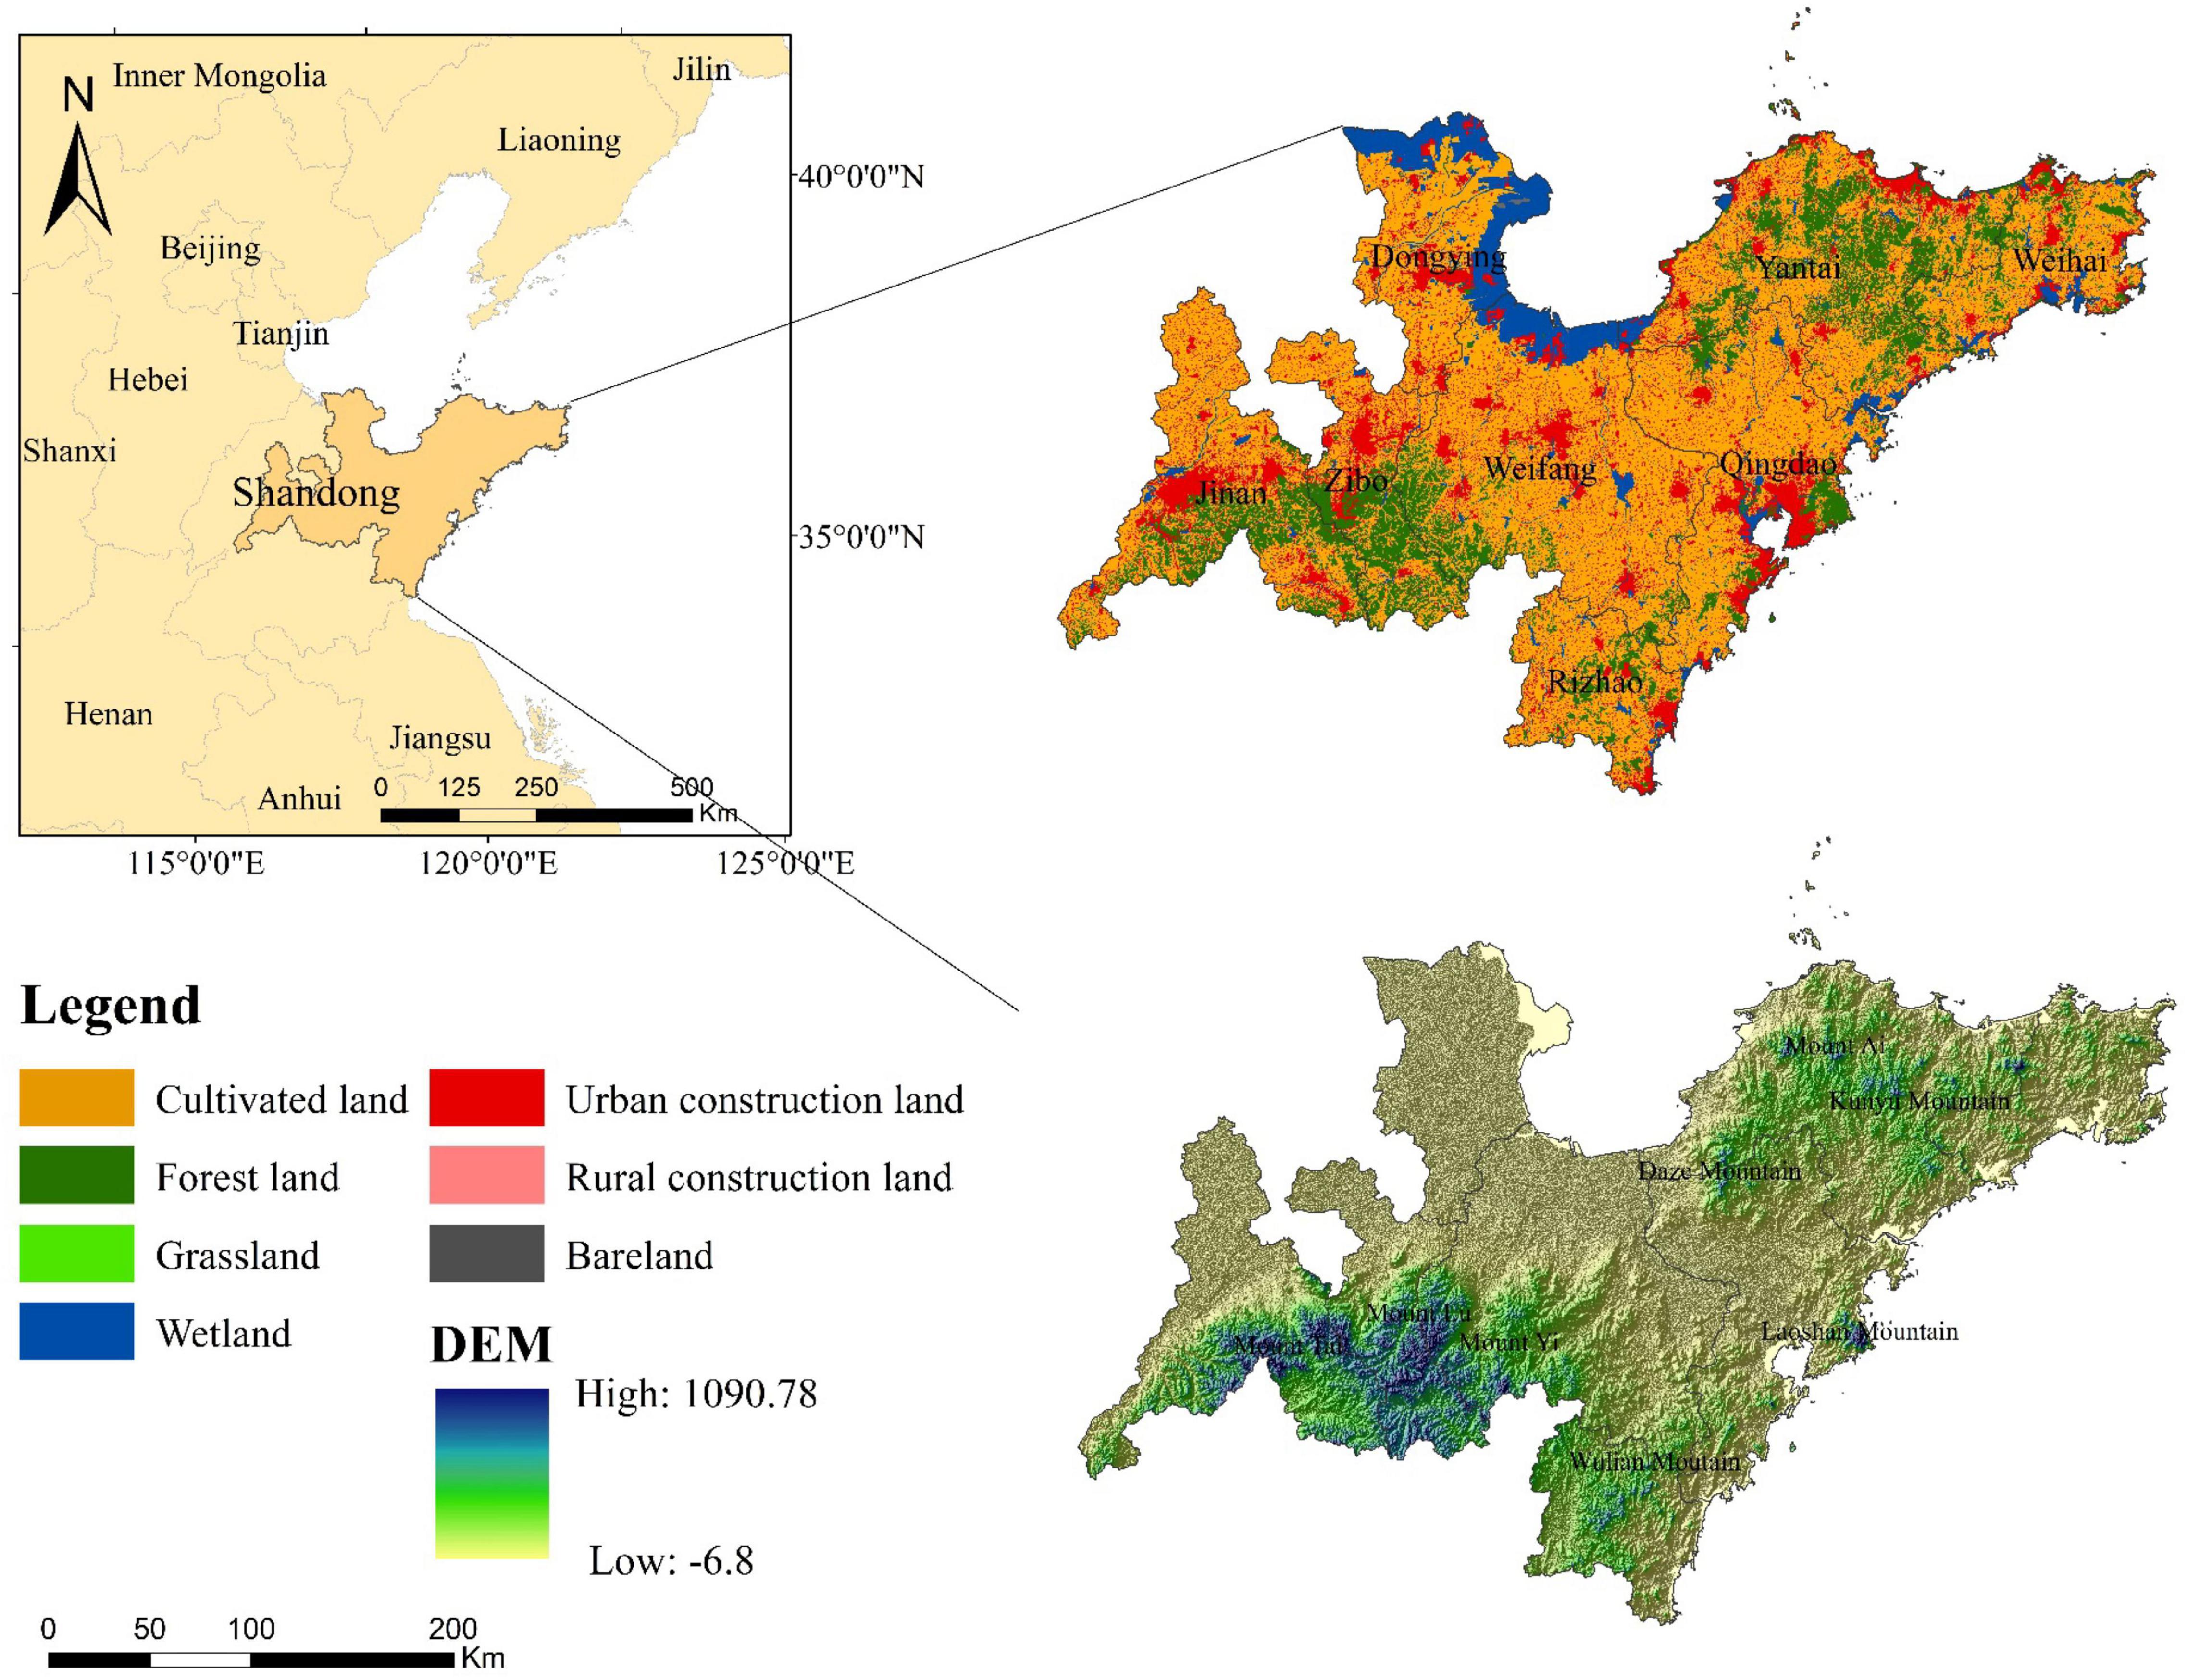
Figure 2. Land use types and geographical location of Shandong Peninsula urban agglomeration.
Data Source
Land use data, nighttime light index, normalized difference vegetation index (NDVI), leaf-area index (LAI), raster of averaged PM2.5 Concentrations, meteorological data (precipitation, temperature, wind speed), and road traffic data were applied to the study, and general information on each data is shown in Table 1. Among them, NDVI was obtained from the MOD13Q1 dataset based on the data time series from January to December 2018 to calculate the monthly average value of raster data that is produced every 16 days. LAI was obtained from the MOD15A2H dataset based on the data time series from January to March and September to December 2018 (i.e., in winter half-year) to calculate the average value of raster data that is produced every 8 days. The rest of the data were obtained by clipping from the downloaded raw data. Specifically, land use data were used for the calculation of habitat quality, habitat risk and MSPA; nighttime light index was used for constructing ecological resistance surfaces; NDVI and meteorological data were used for the calculation of the net primary productivity of vegetation; LAI and raster of averaged PM2.5 Concentrations were used for the calculation of PM2.5 removal function (according to the statistics, most of the PM2.5 occurs in the winter half year, so this study calculated the ability of vegetation to remove PM2.5 in the winter half year); road traffic data were used for the calculation of habitat quality, habitat risk. All data were converted into a consistent resolution (100 m * 100 m).
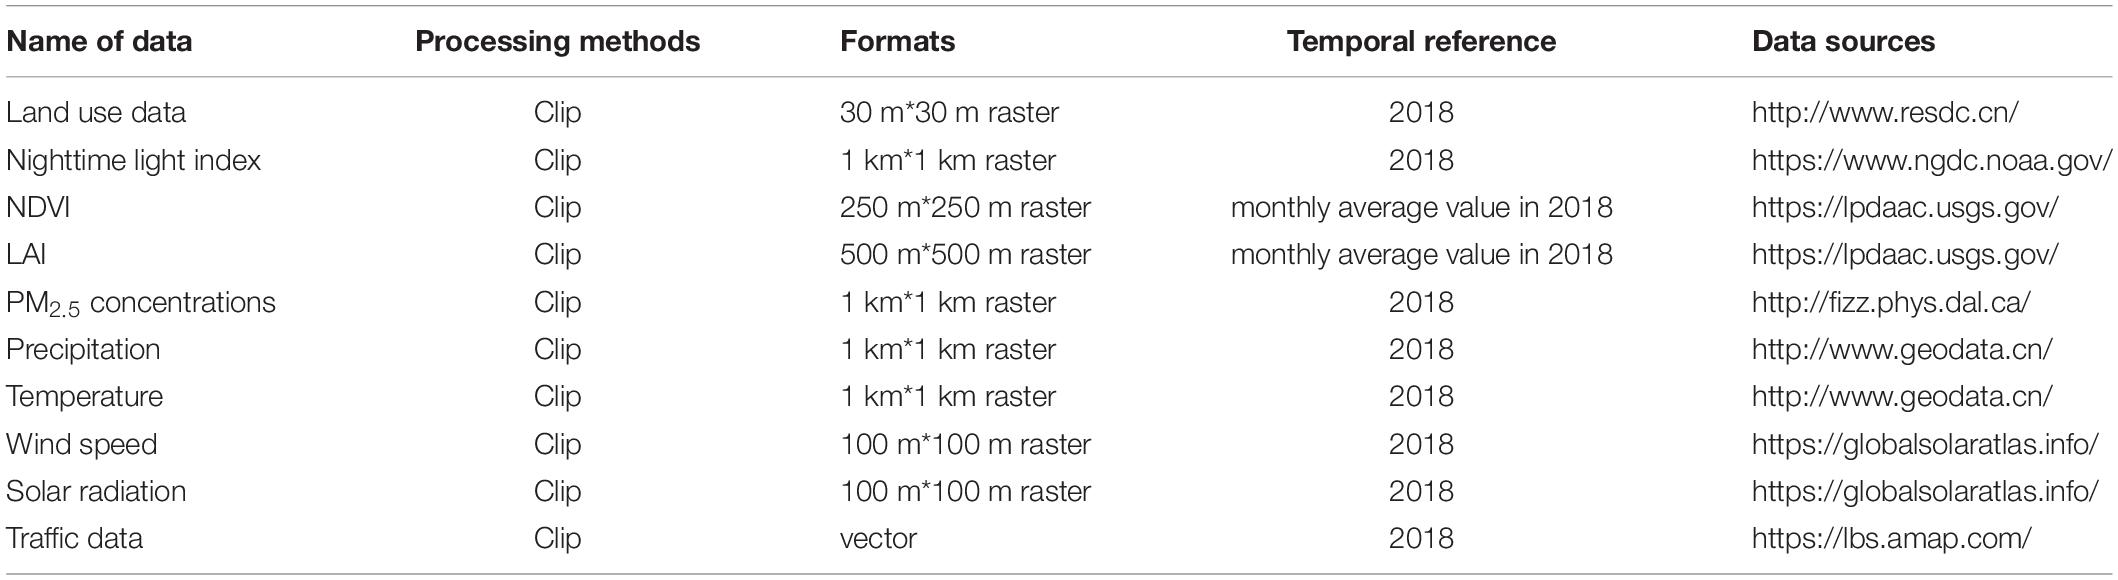
Table 1. General status of data for study.
Research Methodology
Identifying Ecological Sources Based on Morphological Spatial Pattern Analysis and Habitat Quality
MSPA is an image processing method based on mathematical morphological principles such as erosion, expansion, open operation and closed operation to measure, identify and segment the spatial pattern of raster images (Soille and Vogt, 2009; Xiao et al., 2020; Huang X. et al., 2021). It can distinguish the type and structure of landscape more precisely. Combining with the current situation of landscape types in Shandong Peninsula urban agglomeration, natural landscapes with high ecosystem service value and less human interference, such as forest, grassland, water and wetland, were used as the foreground data for MSPA analysis. Cultivated land, construction land and bare land were used as the background data due to the lack of living environment for species to feed. According to the parameter settings of MSPA, the 30 × 30 m land use type raster map of Shandong Peninsula urban agglomeration was firstly converted into binary images of foreground and background, and then processed into seven types of landscape elements by Guidos Toolbox software to obtain core, islet, perforation, edge, bridge, loop, and branch.
Since MSPA only reflects the morphological and structural importance of landscape patches in the regional landscape pattern, it cannot evaluate the habitat suitability within the landscape patches. Therefore, based on the MSPA analysis, this study introduced the habitat quality model to further assess the habitat suitability of the core area, and identified the high habitat quality patches in the core area as ecological sources. The habitat quality module of the InVEST model (Sharp et al., 2016) was used to assess the habitat quality of the core area. It assesses the distribution and degradation of habitats in different landscapes based on the habitat quality calculated from the distance, intensity and response of different habitats to threat sources, and can reflect the state of biodiversity within a landscape patch and its potential level to provide survival conditions for species (Li et al., 2018; Sun et al., 2019). In this study, habitat quality was measured by the habitat quality module in InVEST3.1.2 model. The main parameters were set with reference to the example data of InVEST model, previous studies (Sharp et al., 2016; Li et al., 2018; Sun et al., 2019; Xu et al., 2019; Zhai et al., 2020) and actual situation within the study area, as shown in Tables 2, 3.
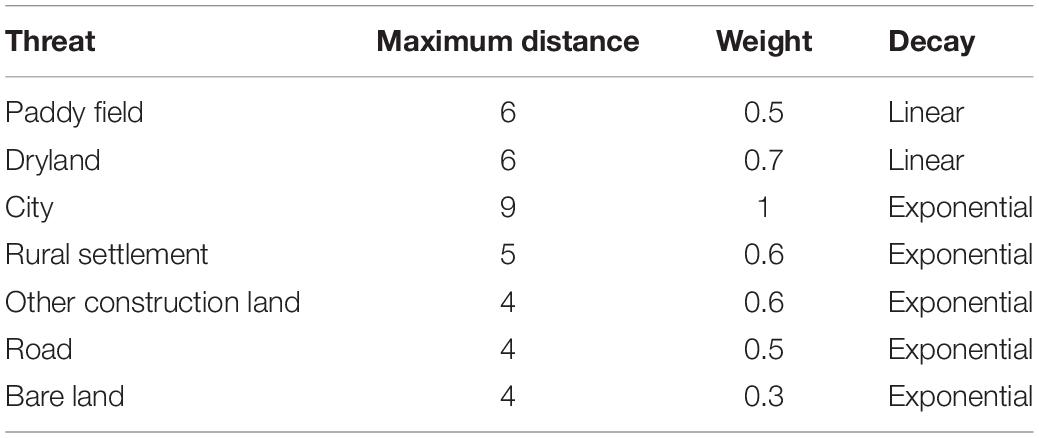
Table 2. Parameter settings for threat sources.
Table 3. Sensitivity coefficient of habitats to threat sources.
Constructing Ecological Resistance Surfaces Based on Habitat Risk
The scientific construction of ecological resistance surface is important for the accuracy of ENs identification. Past studies usually determined different ecological resistance values based on different land use types (Peng et al., 2018a,b; Huang et al., 2019). However, within urban agglomeration, landscape characteristics such as the degree of economic development and intensity of human activities vary greatly from region to region, leading to great landscape variability of the same land use type in different regions. Setting resistance values based only on land use types cannot objectively and accurately reflect the degree of landscape disturbance to biological flows. Therefore, this study introduced the habitat risk model to construct ecological resistance surface. The Habitat Risk Assessment (HRA) model is commonly used to evaluate the impact of human activities on ecosystem health, and can reflect the degree of human activities’ disturbance to ecosystems. This fits perfectly with the connotation of ecological resistance surfaces. HRA is based on ecological risk theory and spatial overlay analysis, which combines the frequency and degree of threat of habitat threat factors, the degree of impact on habitat factors and self-restoration ability to simulate and assess the degree of disturbance to ecological land (Arkema et al., 2014; Duggan et al., 2015; Wyatt et al., 2017). In this study, the habitat risk was calculated by the habitat risk module in InVEST3.1.2 (Sharp et al., 2016). And the selection of habitat factors and threat sources were kept consistent with the habitat quality module, and the base parameters were set according to the HRA model guidelines, and the exposure, impact and risk were calculated as follows:
In the formula, E denotes exposure, C denotes influence, Rij denotes the risk of habitat i caused by ecological threat factor j, Ri is the habitat risk value of habitat I, ei is the average ecological threat impact score of all patches of the threatened species, ci is the score of all plaques affected by the habitat factor, wi is the threat score for each grid, di is the data quality score, and N is the number of each habitat evaluation criterion.
However, it is clear from the calculation process of habitat risk that habitat risk can only reflect the ecological resistance value of ecological land. For non-habitats, this study introduced the strength of nighttime light index to reflect the spatial extent and activity intensity of human activities on biological flow. Nighttime light index effectively reflects the spatial extent and activity intensity of human activities in urban area (Yang et al., 2020), and wildlife would avoid areas usually with higher light intensity during their activities to avoid human threats (Gaston et al., 2013).
Identifying the Spatial Range of Ecological Corridors and Their Key Areas Based on Circuit Theory
Identifying the Spatial Range of Ecological Corridors
Circuit theory combines circuits in physics with ecology through random walk theory (McRae and Beier, 2007; McRae et al., 2008). In the process of species migration or dispersal, the landscape is considered as a conductive surface with low resistance in high permeability landscapes and high resistance in low permeability landscapes. The circuit theory model assumes that species migration or dispersal through different resistance values produces differential current densities by connecting source patches and creating cumulative current values as a depletion path (Peng et al., 2018a; Huang L. et al., 2021). Higher cumulative current values indicate better connectivity between the two ecological sources in the area, with more species or more frequent passage of a species through the area, i.e., more frequent use of the ecological corridor. Therefore, this method cannot only simulate the migration routes of organisms between ecological sources by current direction, but also determine the spatial range of ecological corridors by extracting the effective value of cumulative current values (current value > 0). In this study, the Linkage Mapper module (Version 2.0.0) in Circuitscape (McRae and Beier, 2007; McRae et al., 2008)1 was used to identify the direction of ecological corridors, and corridor ranges were determined using the cumulative current value.
Identifying the Key Areas in Ecological Corridors
In circuit theory, the cumulative current value reflects the net migration of random wanderers. The higher the cumulative current value of a grid, the more important the grid is to the landscape. The areas of the corridor with the highest cumulative current density are called pinch points (McRae et al., 2008; Xiao et al., 2020; Yu et al., 2021), which indicate that species are more likely to pass through the area between habitats or that there are no other available pathways. If pinch points are removed or altered, this will have a very significant impact on regional landscape connectivity. Therefore, pinch points are critical areas on ecological corridors and are priority areas for ecological conservation.
The area of the corridor with the highest cumulative current recovery value is called the barrier (Peng et al., 2018a). The ecological corridor at the barrier is actually in a fractured state, and the connectivity between ecological sources must be enhanced by ecological restoration measures. Therefore, barriers are fractured areas in ENs and are priority areas for ecological restoration. The pinchpoint mapper and barrier mapper modules in Circuitscape see text footnote 1were used to identify pinchpoint and barrier.
Research Results
Spatial Distribution Characteristics of Ecological Sources in Shandong Peninsula Urban Agglomeration
Figure 3 shows the results of MSPA analysis. After spatial statistics, it can be found that the core areas account for about 11.04% of the total area of the study area and about 45.96% of the natural ecological space. They were distributed in clusters within the study area. The areas of high habitat quality in the study area (Figure 4) were more consistent with the core areas in terms of spatial distribution. And the ecological sources of the Shandong Peninsula urban agglomeration were obtained by extracting the habitat quality high value areas in the core areas. The ecological sources mainly consisted of forests and wetlands, with a total of 146 locations and a total area of 6,263.73 km2, accounting for about 8.35% of the study area. In terms of spatial distribution (Figure 5), the ecological sources were concentrated in the hilly mountainous and coastal areas of the study area, and were distributed in five groups. The first is the Jinan-Zibo group, including the northern part of Mount Tai, Mount Lu and Mount Yi; the second is the Dongying-Weifang group, including the coastal wetlands of the two regions; the third is the Rizhao group, mainly the Wulian Mountain in Rizhao; the fourth is the Yantai-Weihai group, including the continuous hills of Kunyu Mountain, Mount Ai; The fifth group is the Yantai-Qingdao group, which includes Daji Mountain, Daze Mountain and Mount Cha in the border area between Yantai and Qingdao. In addition to the five groups, a few isolated patches such as Laoshan Mountain were also included. In general, ecological sources were scarce in the central part of the urban agglomeration, resulting in the fragmentation of ecological sources in the Shandong Peninsula urban agglomeration and long distances between source groups.
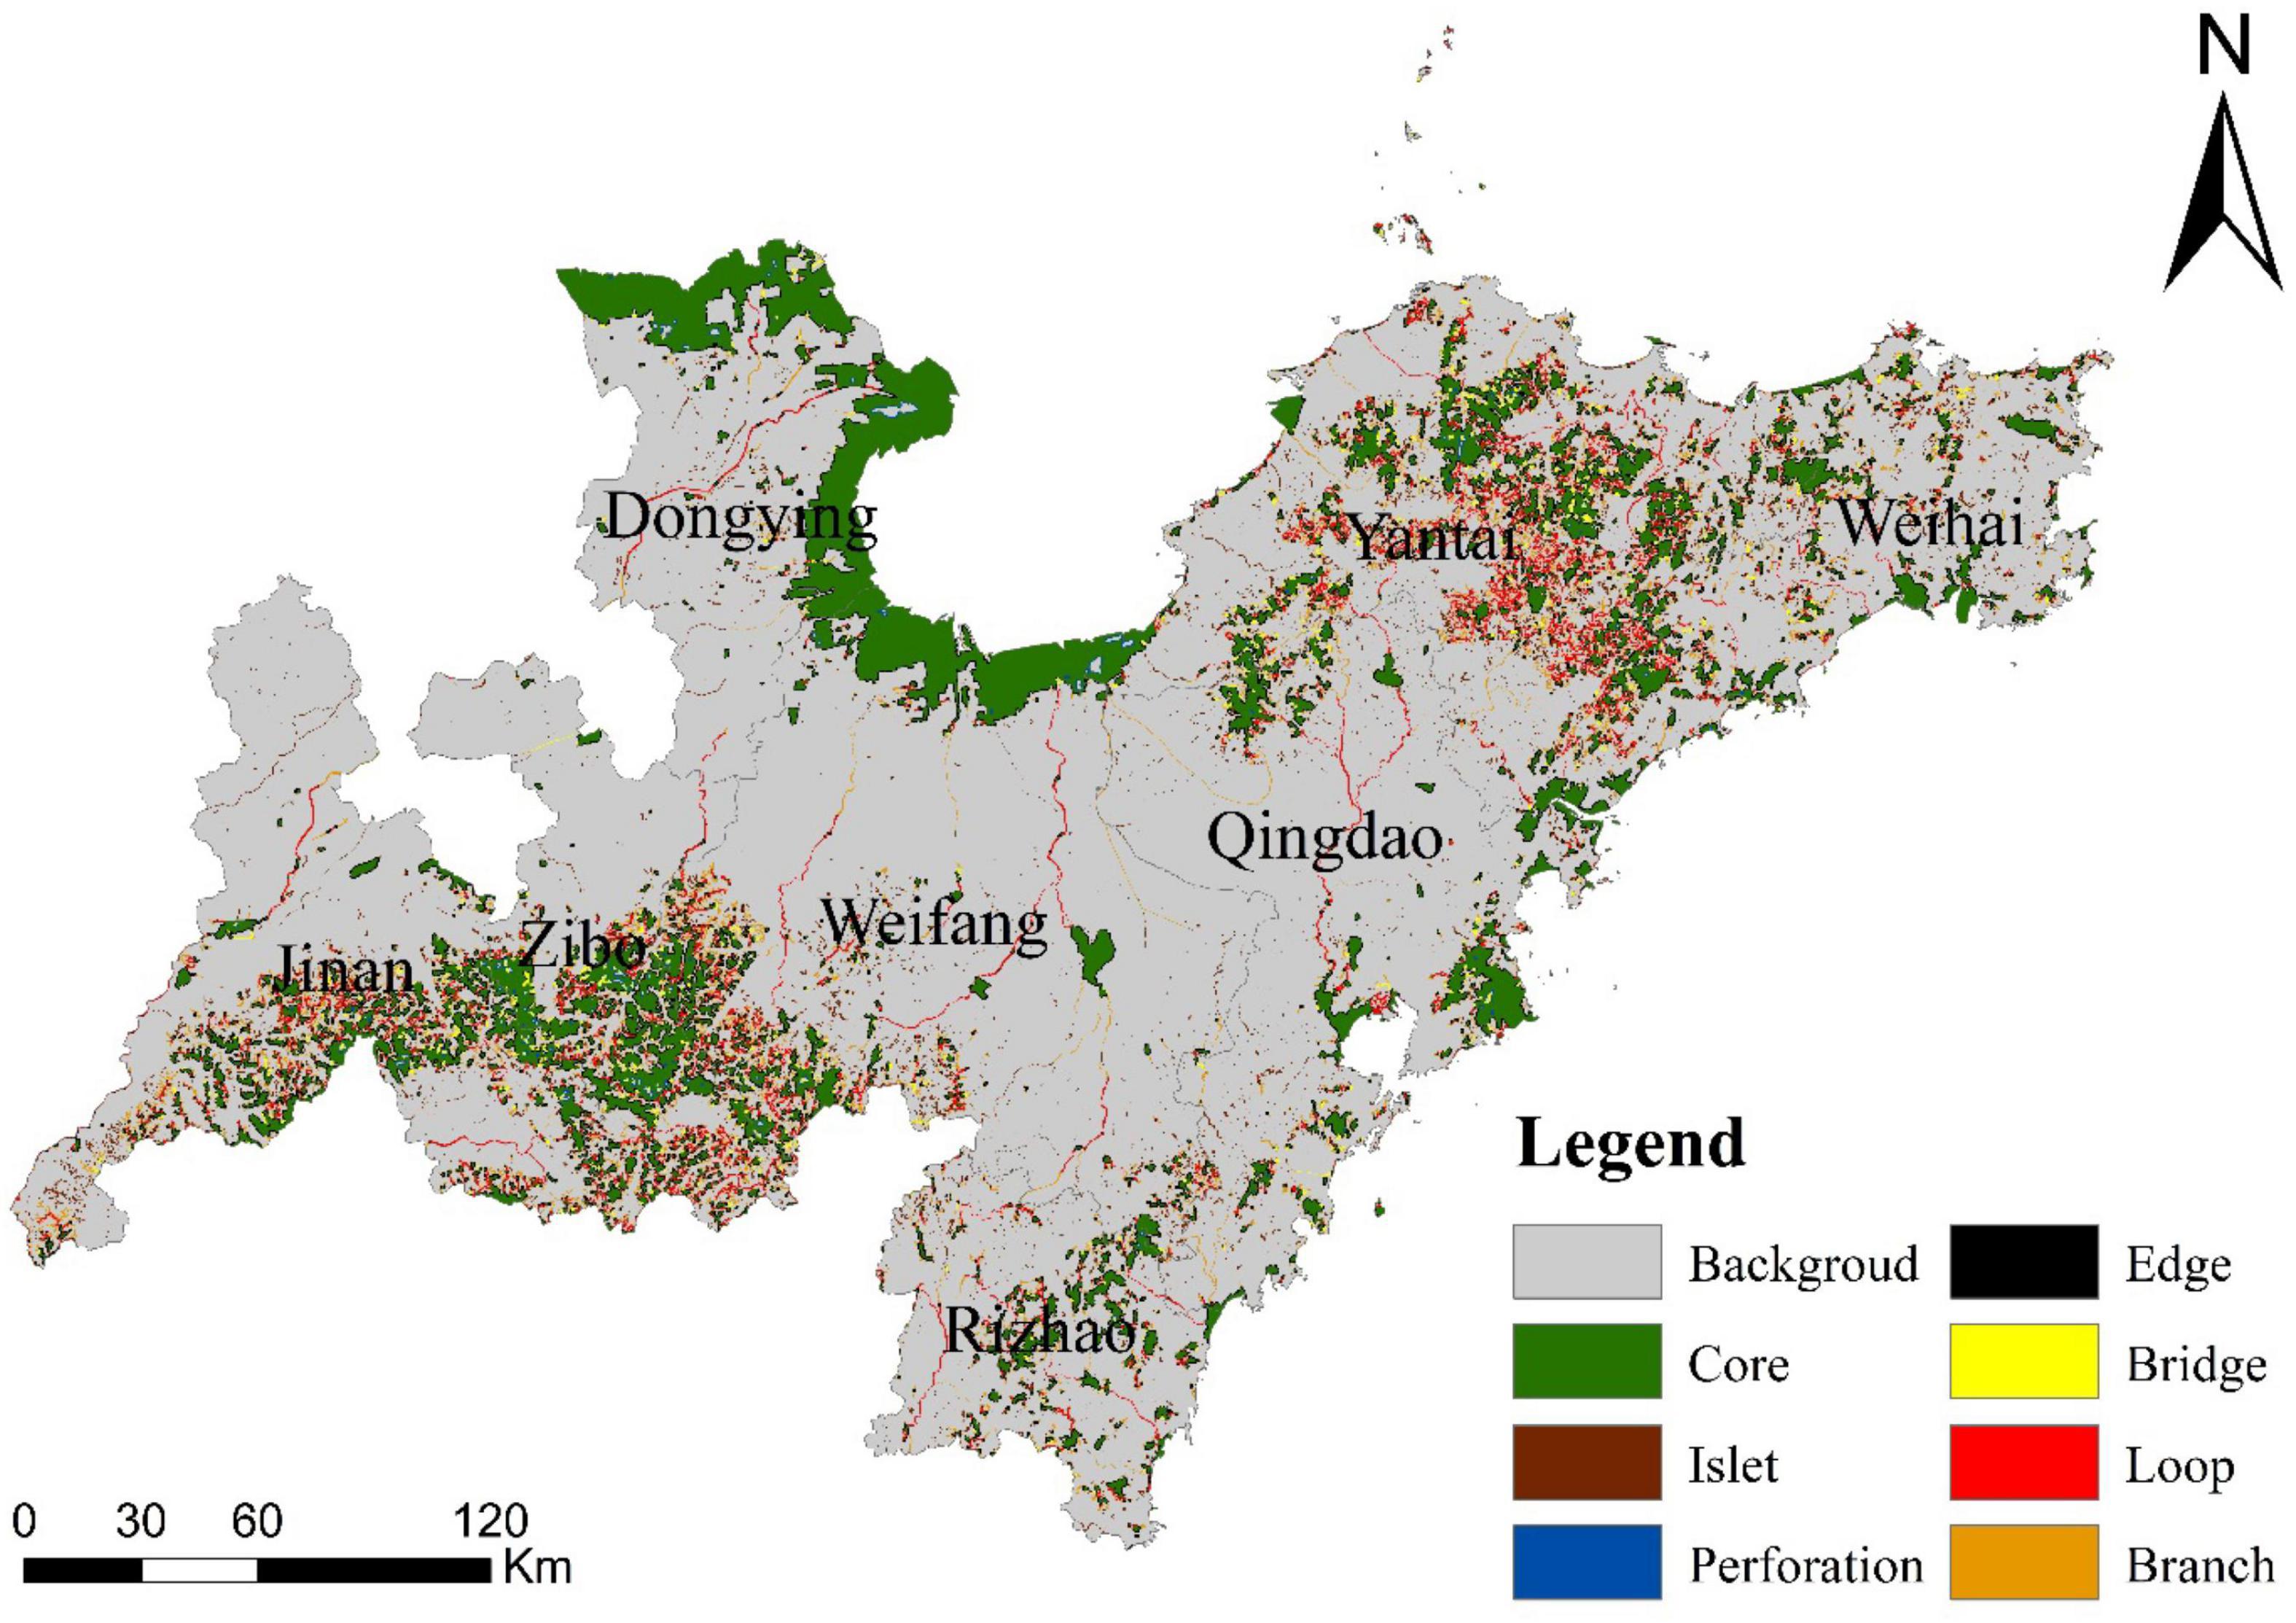
Figure 3. MSPA landscape classification.
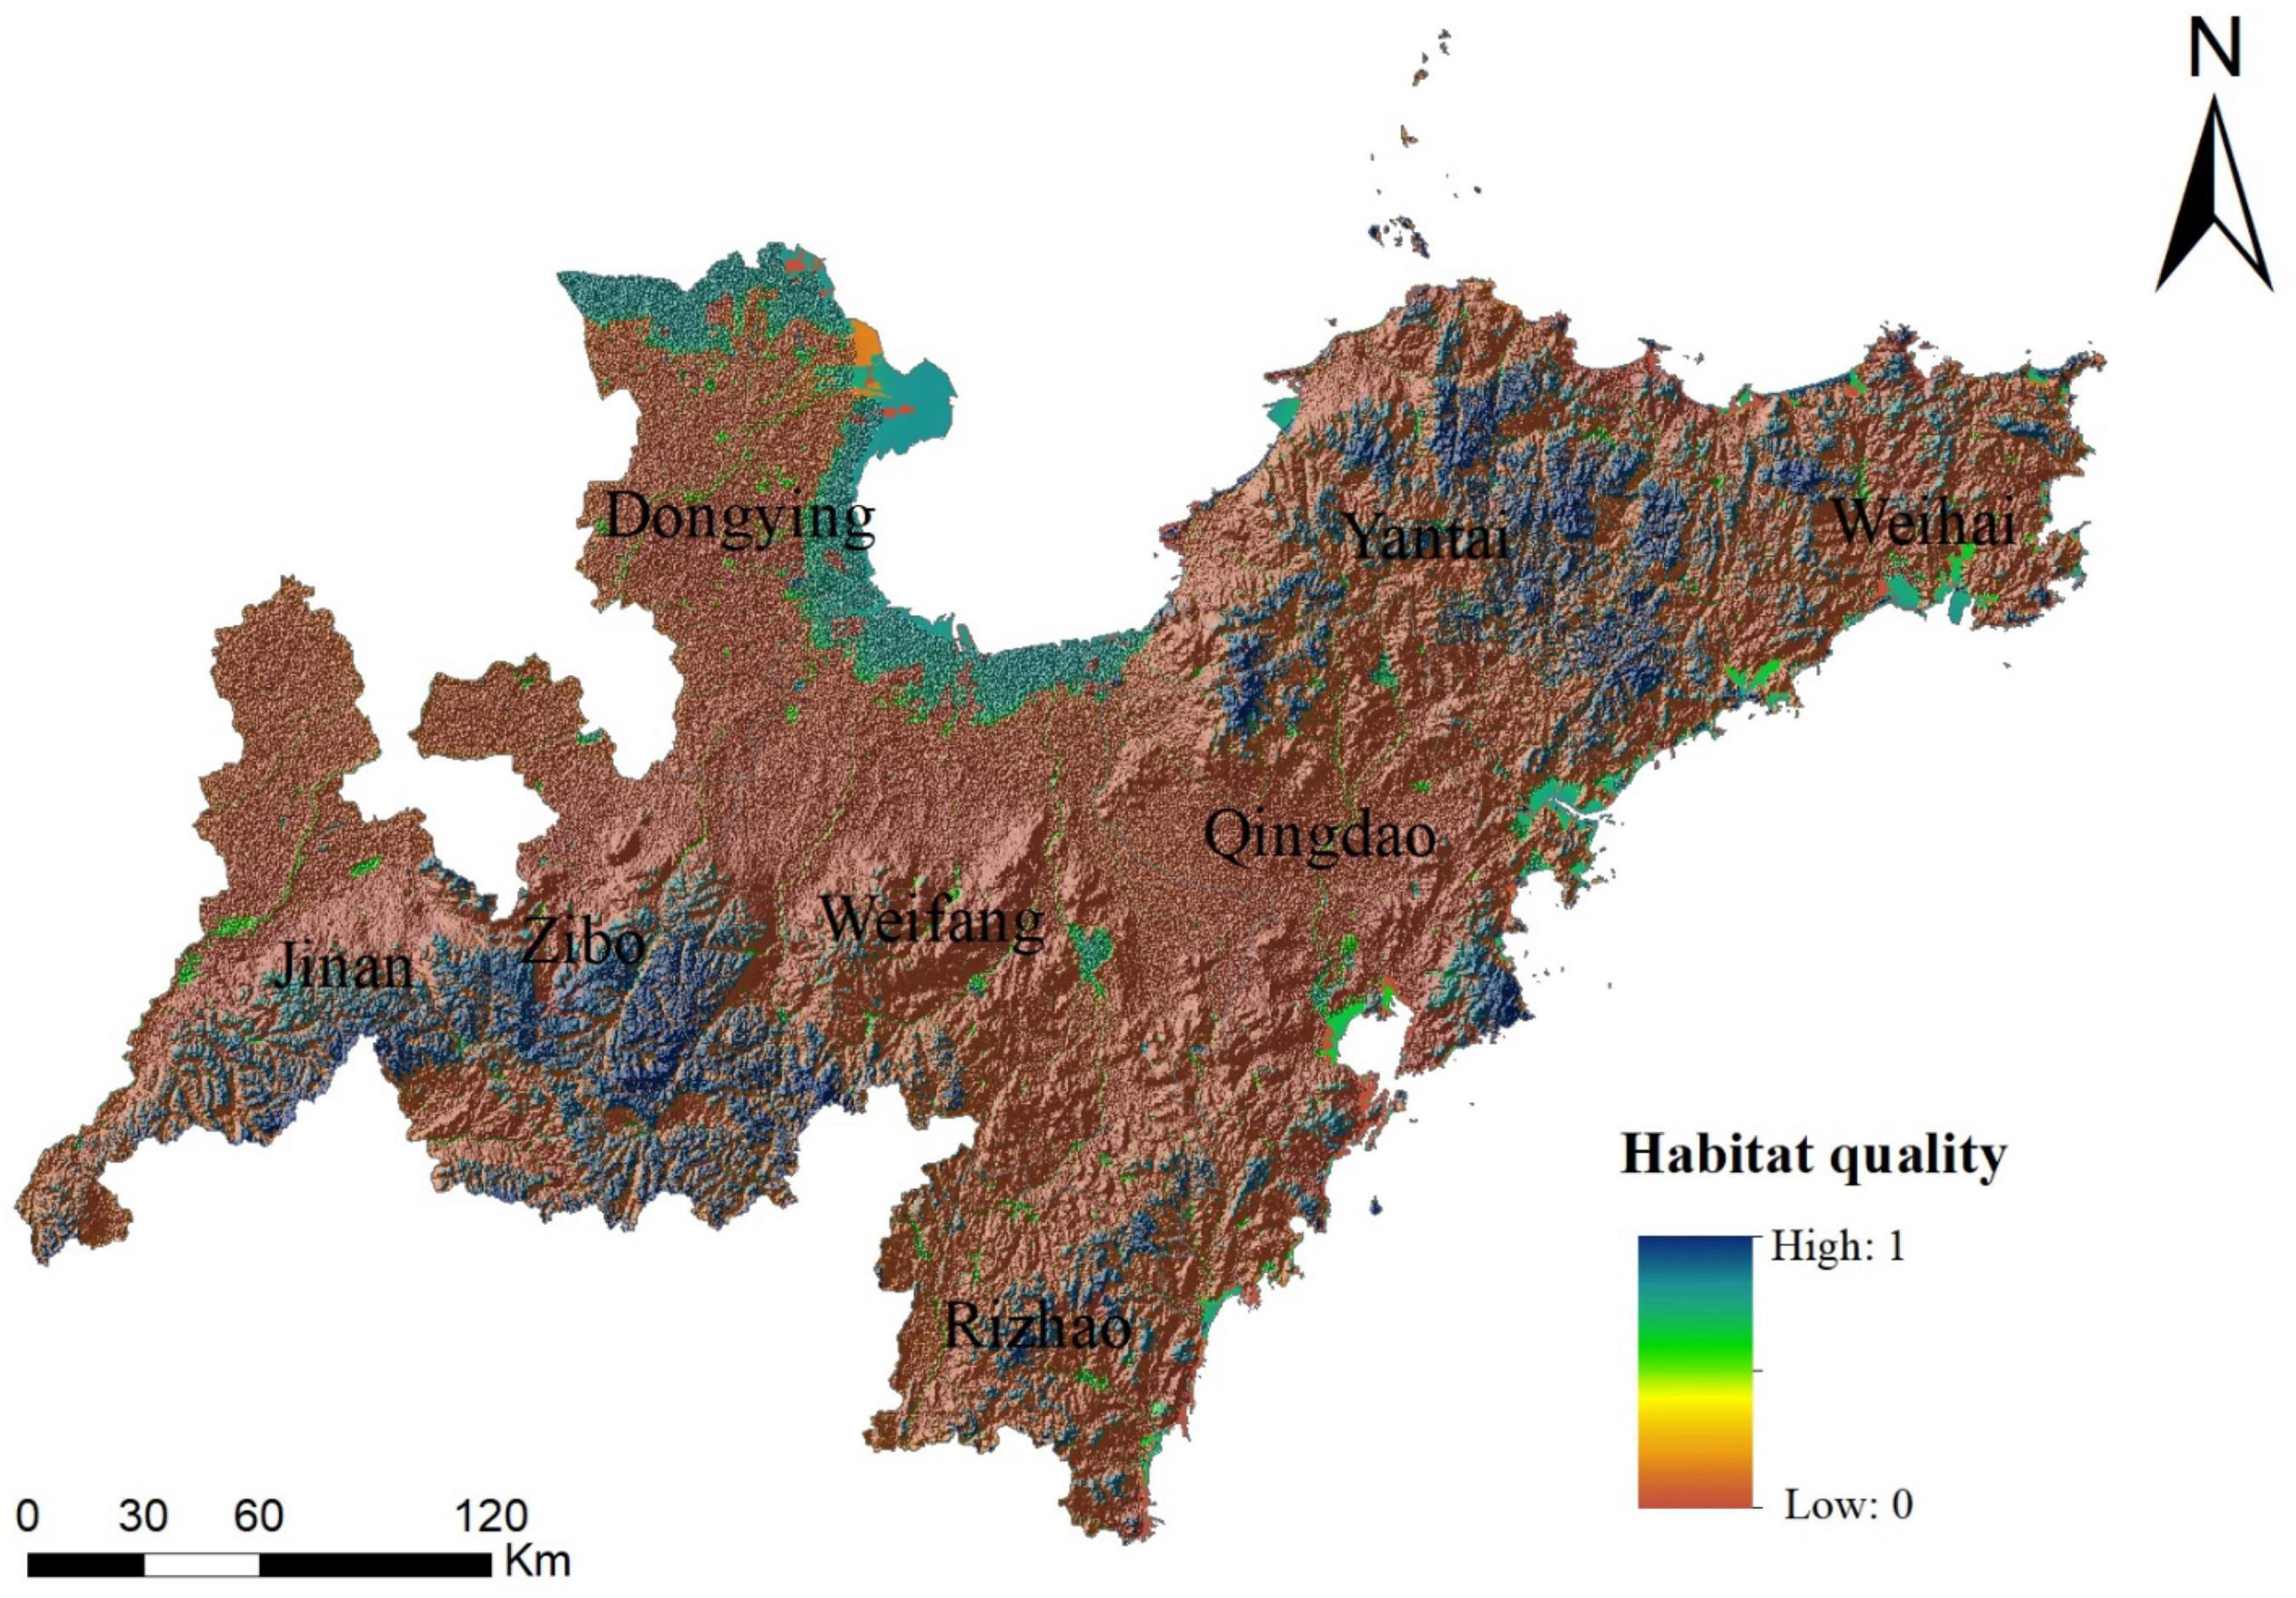
Figure 4. Spatial differentiation of habitat quality in Shandong Peninsula urban agglomeration.
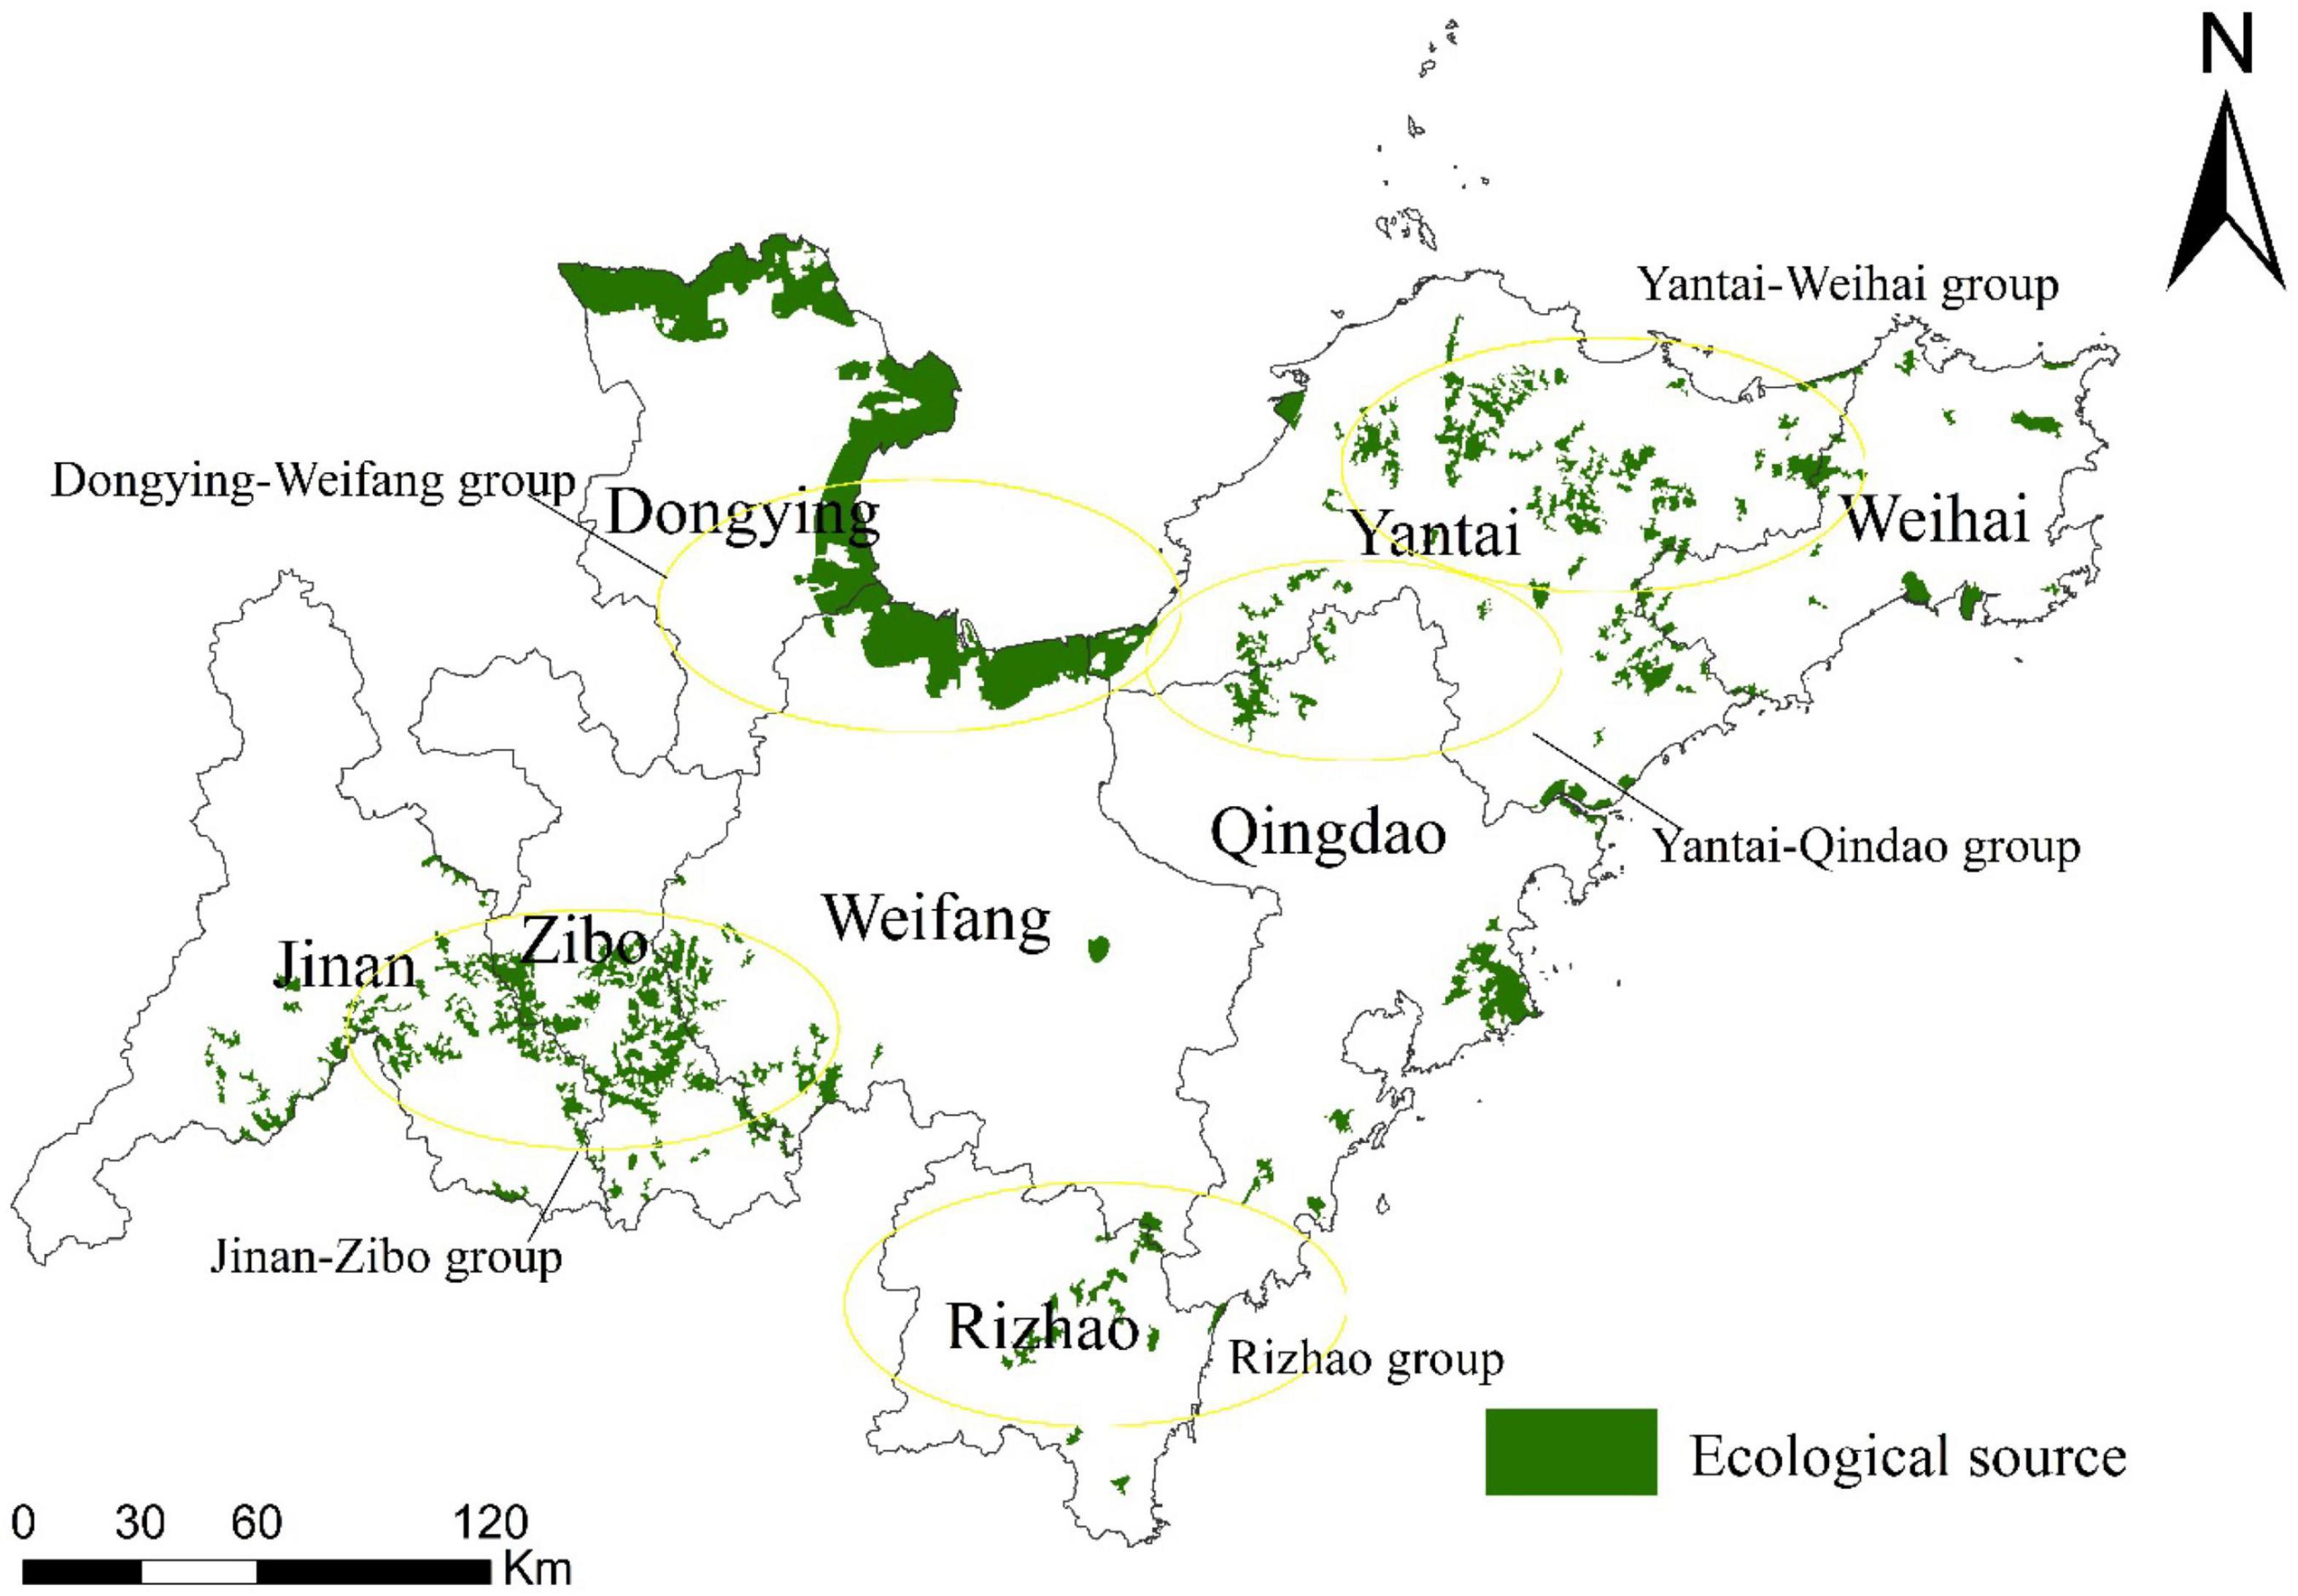
Figure 5. Spatial distribution of ecological sources in Shandong Peninsula urban agglomeration.
Spatial Differences in Ecological Resistance Surfaces in the Shandong Peninsula Urban Agglomeration
As shown in Figure 6, the spatial heterogeneity of ecological resistance surfaces in the Shandong Peninsula urban agglomeration integrating habitat risk and nighttime light index was significant, which fully reflected the scope and intensity of human activities within the urban agglomeration. Coastal cities such as Yantai, Weihai and Qingdao formed a continuous space of high resistance values along the coastline. Inland cities such as Jinan, Zibo and Weifang formed large-scale contiguous areas of high resistance value near their central urban areas. Small and medium-sized towns between major cities formed areas with the next highest resistance values. In addition, the transportation networks connecting cities and towns also have relatively high resistance values. The average resistance value within the urban agglomeration was 21.61. Among them, Qingdao had the highest average resistance value of 25.044, while Zibo, Jinan and Weihai had higher average resistance values than the regional average of 23.79/23.38/22.12. Yantai and Rizhao had the lowest average resistance values of 19.28 and 17.96, respectively. In general, the natural ecological space in the Shandong Peninsula urban agglomeration was squeezed into relatively closed ecological clusters by the contiguous urban space and the dense road traffic network. The inter-group connections were cut and hindered, resulting in a serious impact on the integrity and connectivity of the ecosystem within the urban agglomeration.
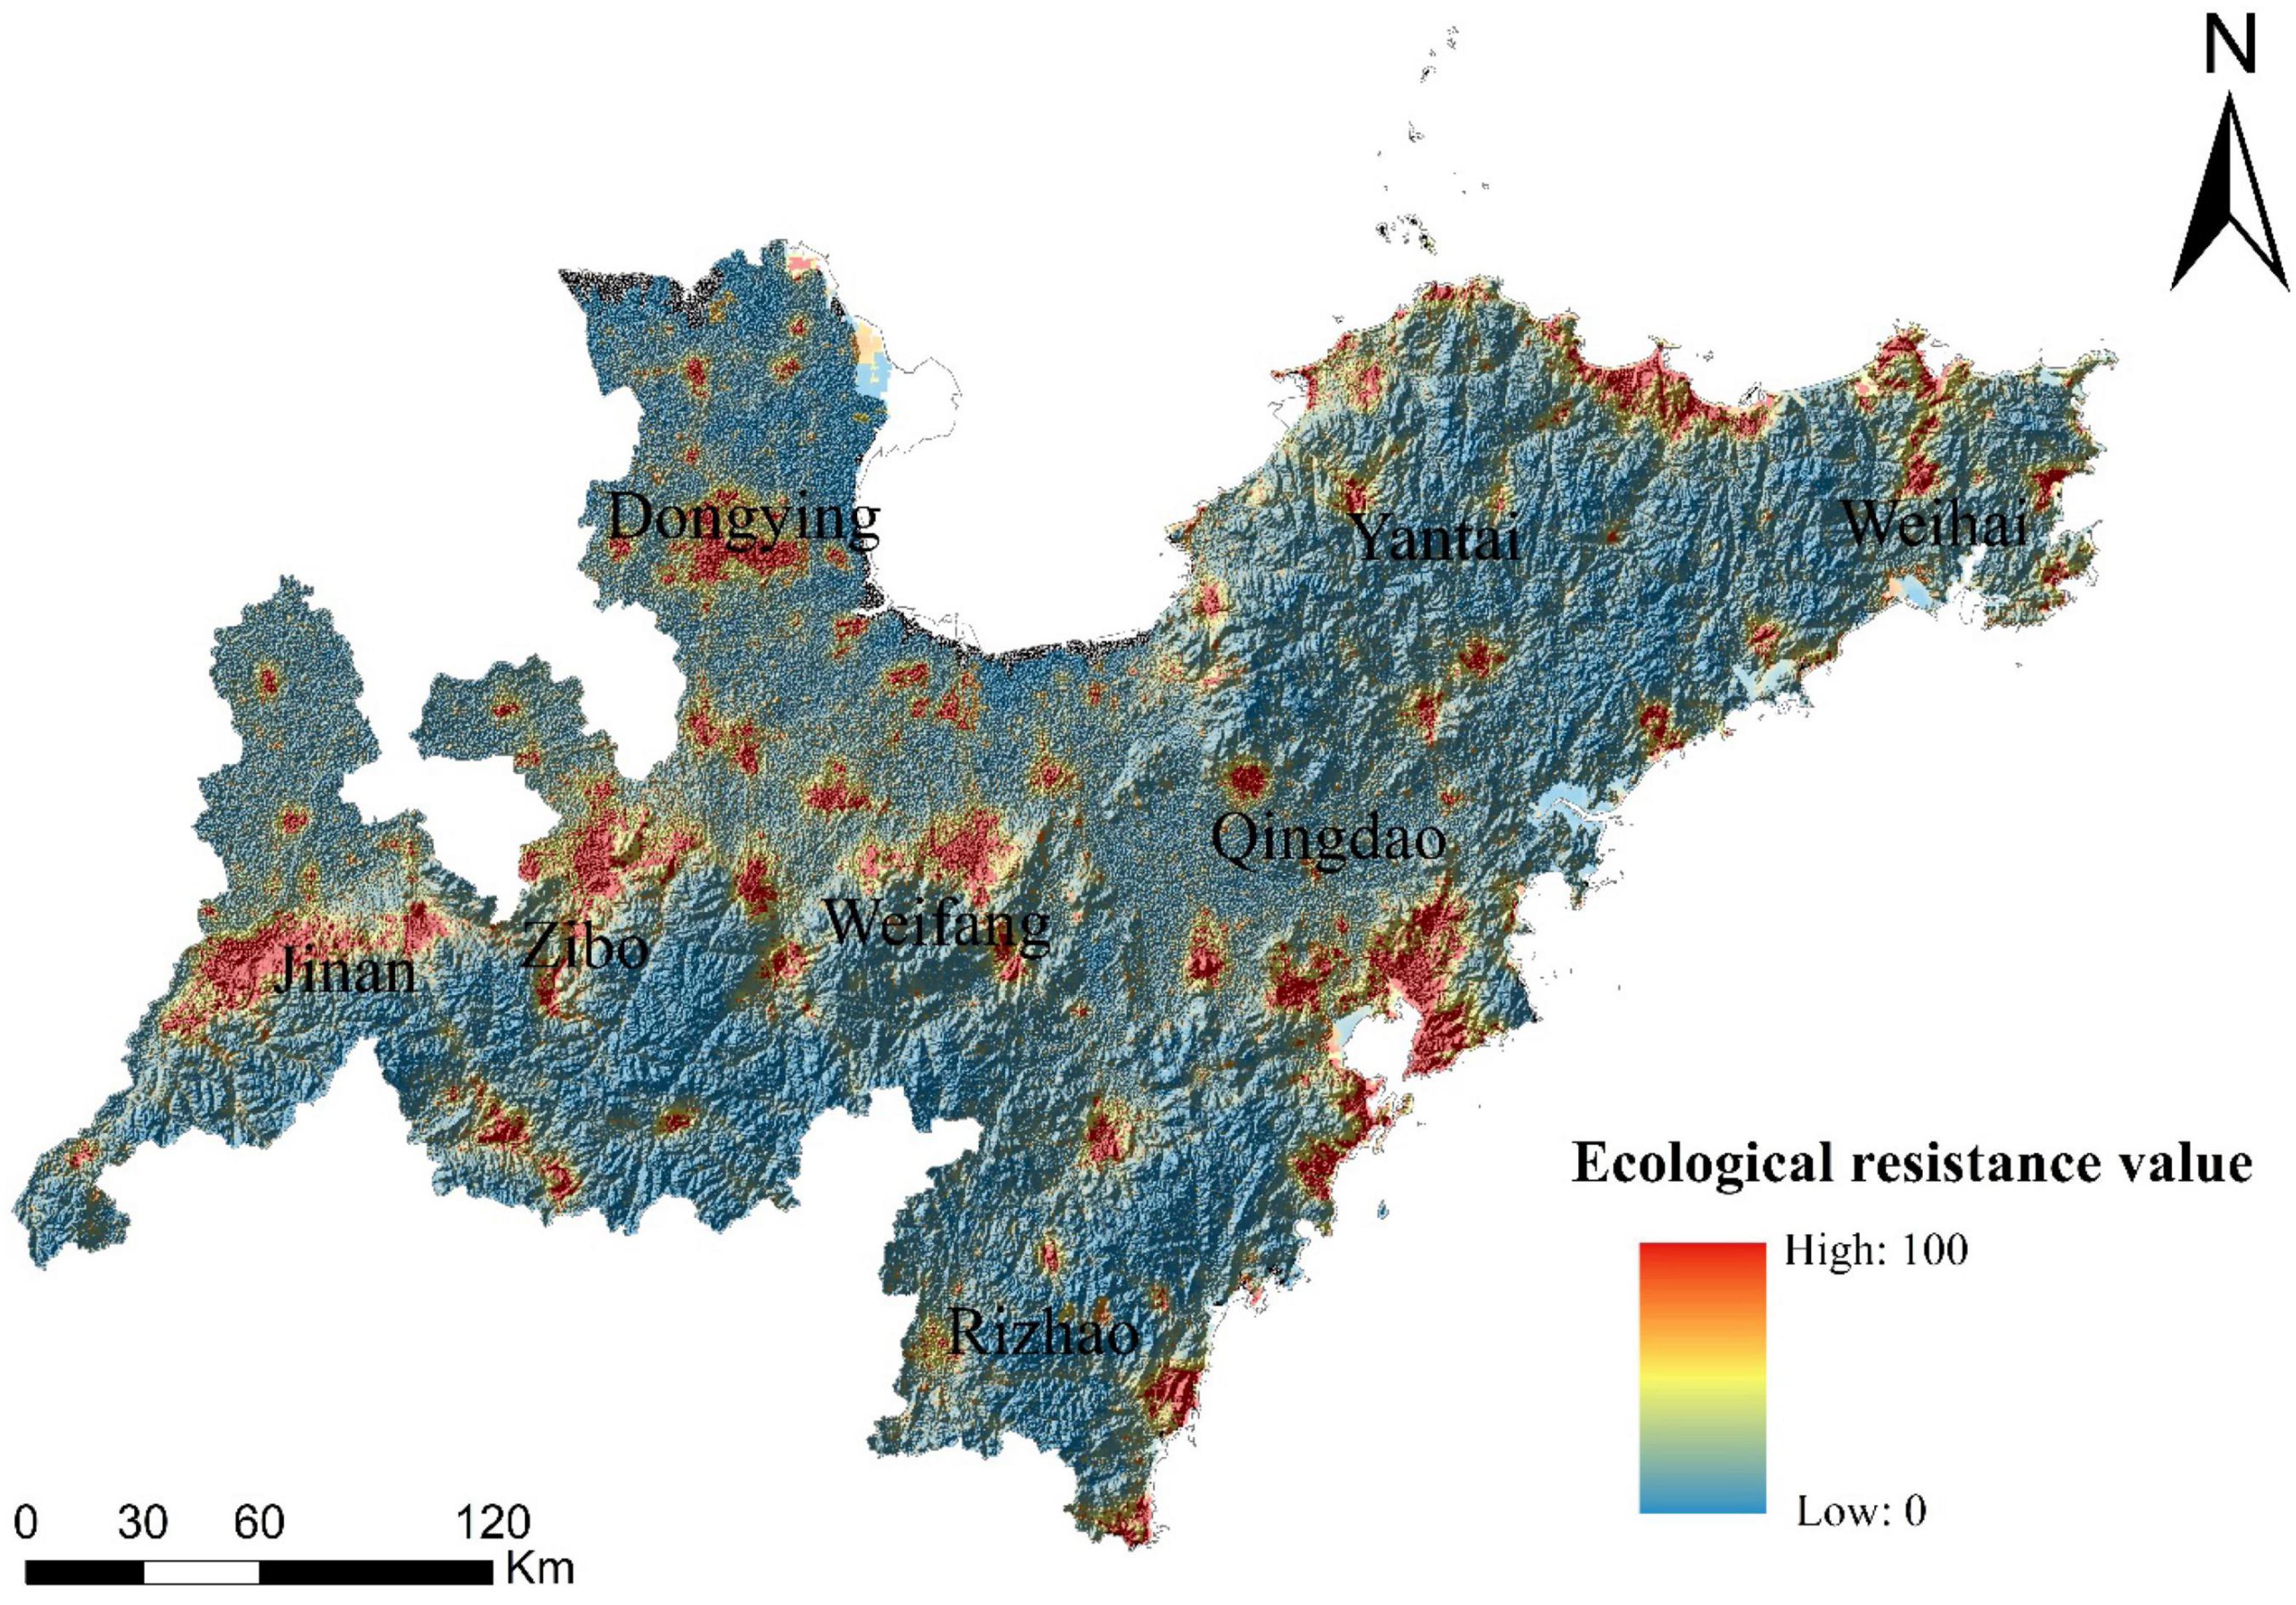
Figure 6. Spatial differentiation of ecological resistance surface in Shandong Peninsula urban agglomeration.
Spatial Distribution of Ecological Networks in Shandong Peninsula Urban Agglomeration
Based on the identification and calculation results of ecological sources and ecological resistance surfaces, combined with circuit theory calculations, the ecological corridors of Shandong Peninsula urban agglomeration were identified. As shown in Figure 7, the total length of ecological corridors in the Shandong Peninsula urban agglomeration was 2994.74 km, and the average length of ecological corridors in each ecological source group was 9.14 km, of which the average distance of ecological corridors in the Jinan-Zibo group was 7.22 km and the average distance in the Rizhao group was 18.27 km. The average length of the inter-group corridors was 76.86 km, among which the No. 1 inter-group corridor and No. 6 inter-group corridor were more than 80 km apart, indicating that the connection between the ecological source groups was weak, and the risk of disturbance and breakage was relatively high.
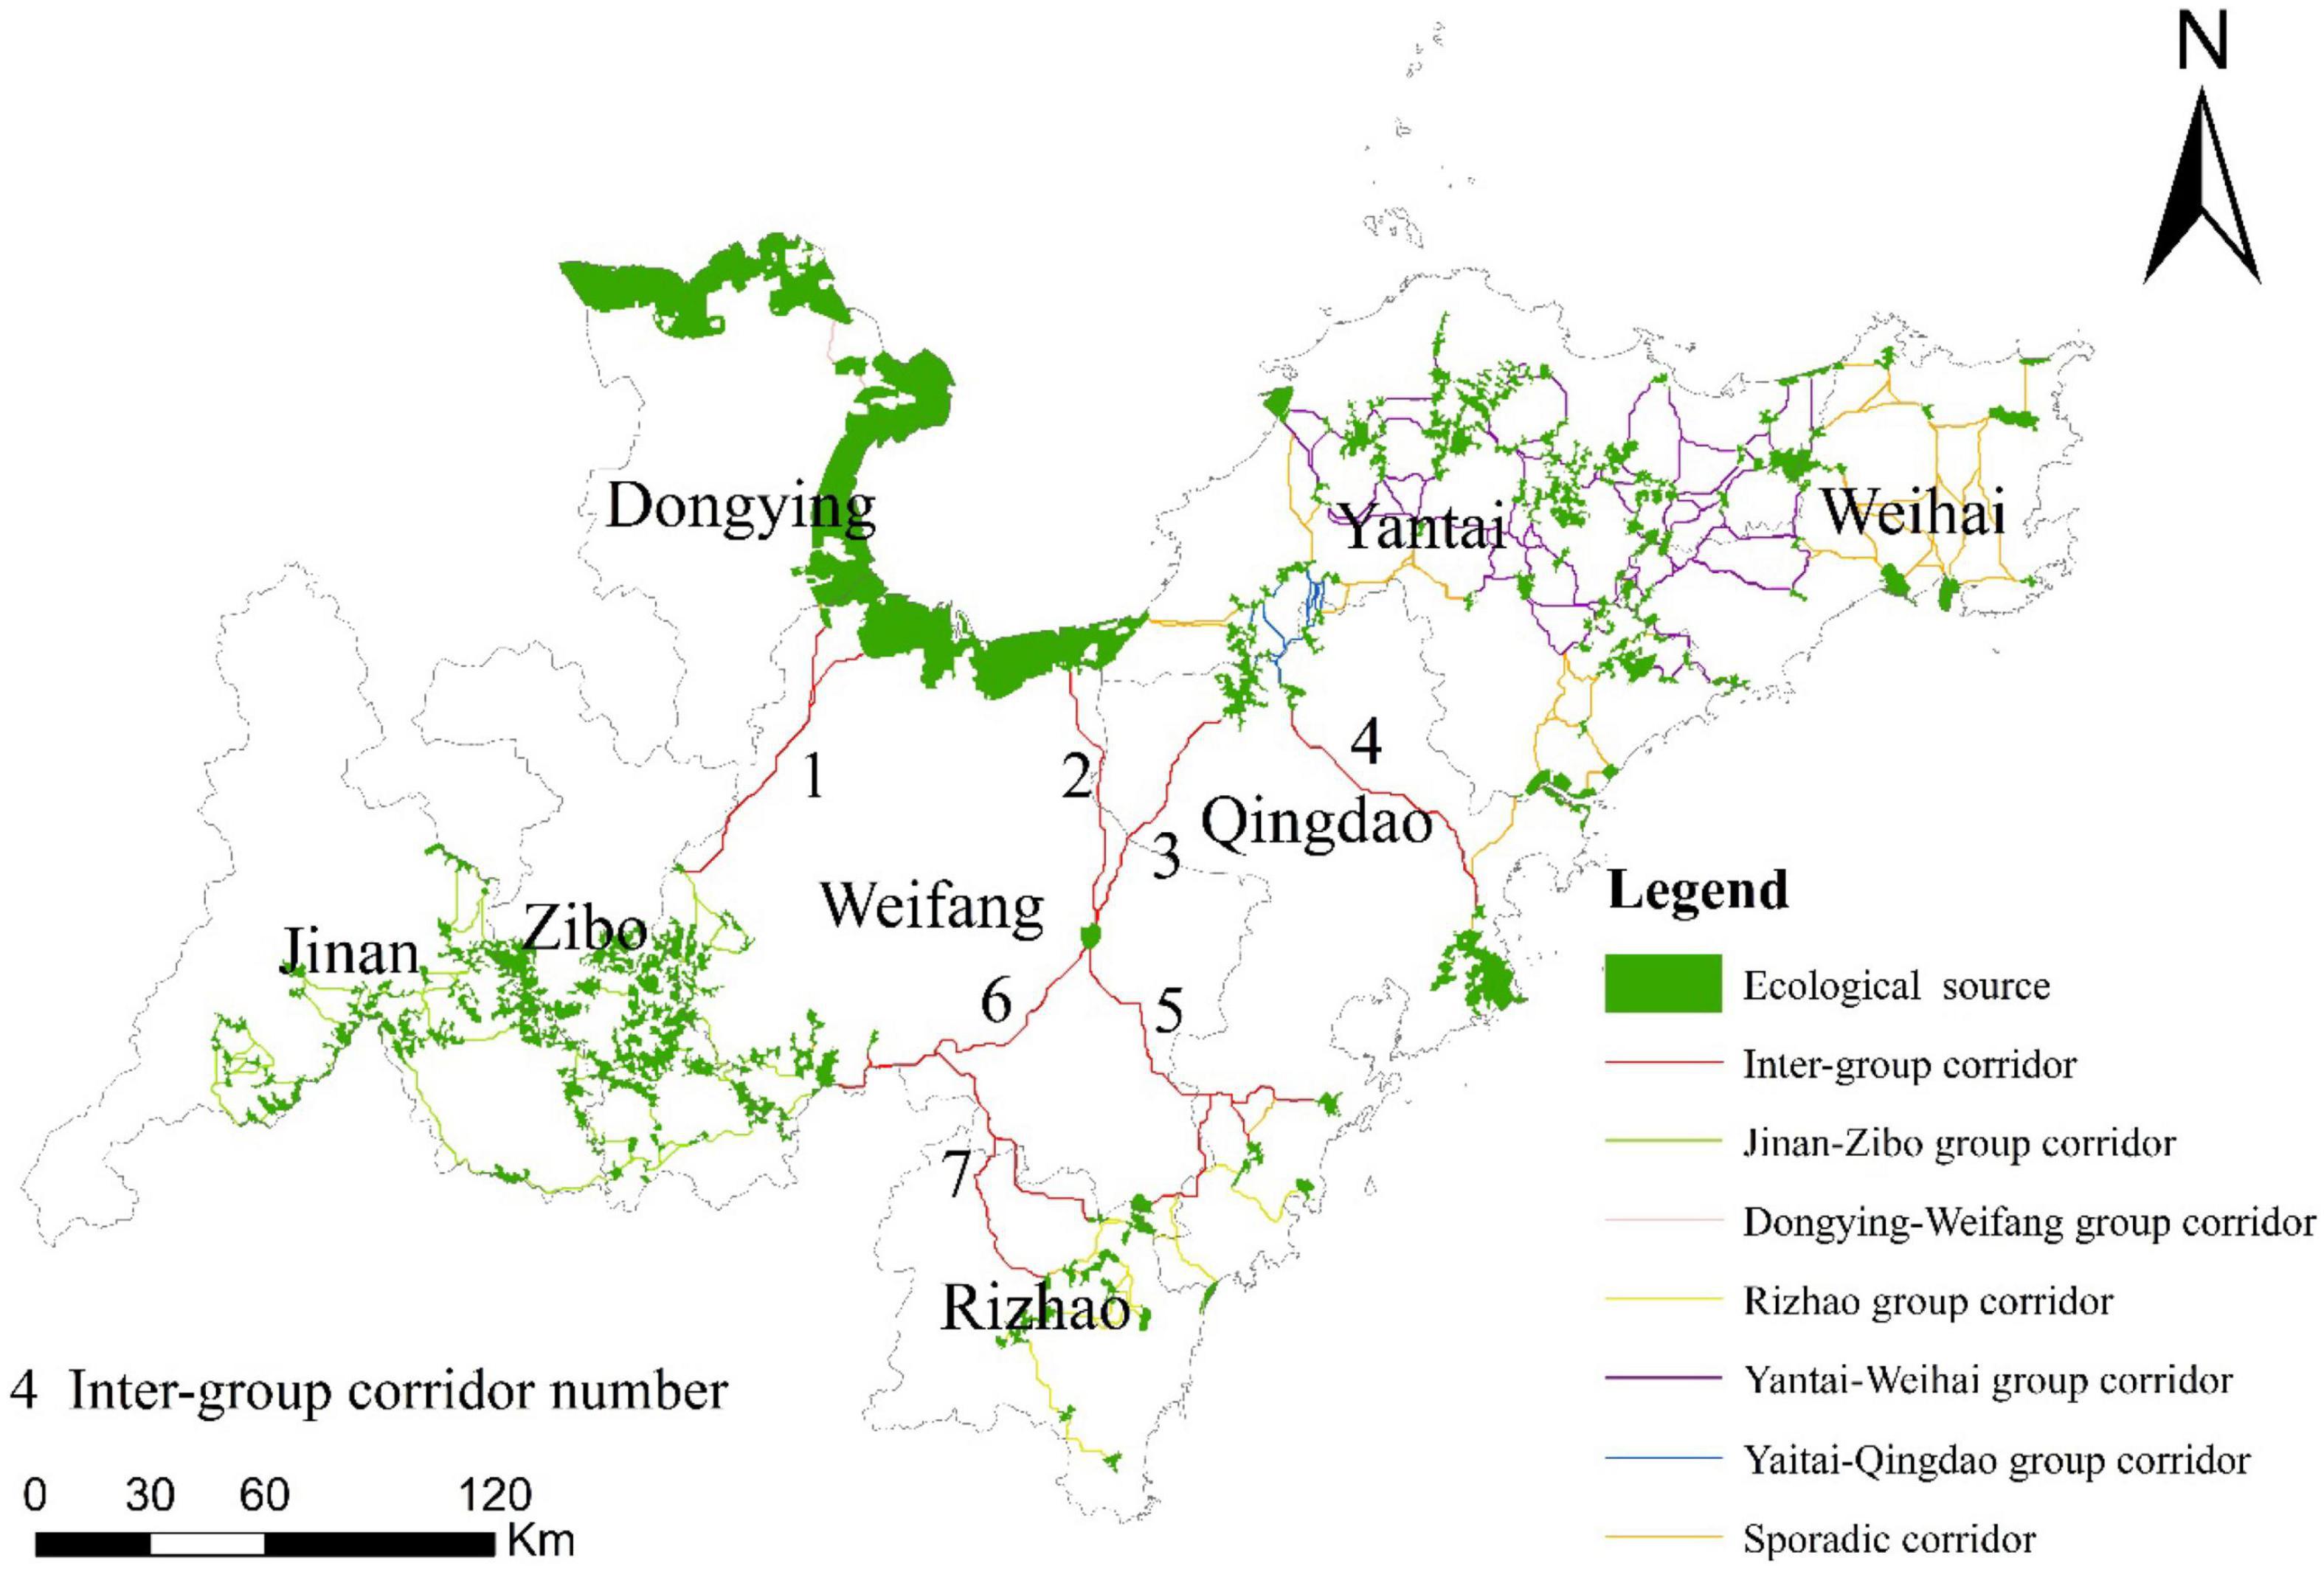
Figure 7. Spatial orientation of ecological corridors in Shandong Peninsula urban agglomeration.
On the basis of the calculated ecological corridor orientation, the spatial range of the ecological corridor was obtained by calculating the cumulative current values between the sources and extracting the effective current values. As shown in Figure 8, the average value of cumulative current value of ecological corridors in urban agglomeration was 0.049, the highest value was 1, and the lowest value tends to be 0. The total area of ecological corridors was 5872.86 km2. In general, the average width of ecological corridors within urban agglomeration was 1.96 km. However, the width of ecological corridors in different regions varies greatly. The average width of the inter-group corridors was 1.45 km, and the average width of the No. 1 inter-group corridor was the narrowest at 1.12 km, while the average width of the corridors in the Jinan-Zibo eco-source cluster was 3.18 km. This was mainly due to the fact that the inter-group corridors have to traverse human settlements with strong landscape heterogeneity, and the corridor space was severely squeezed, so they were mostly in a narrow linear configuration. On the other hand, most of the ecological corridors in the ecological source groups were natural ecological spaces, and the corridors were less disturbed and squeezed, so they were mostly faceted. This also indicates that biological activities in this area were unrestricted or little restricted, and can flow almost freely.
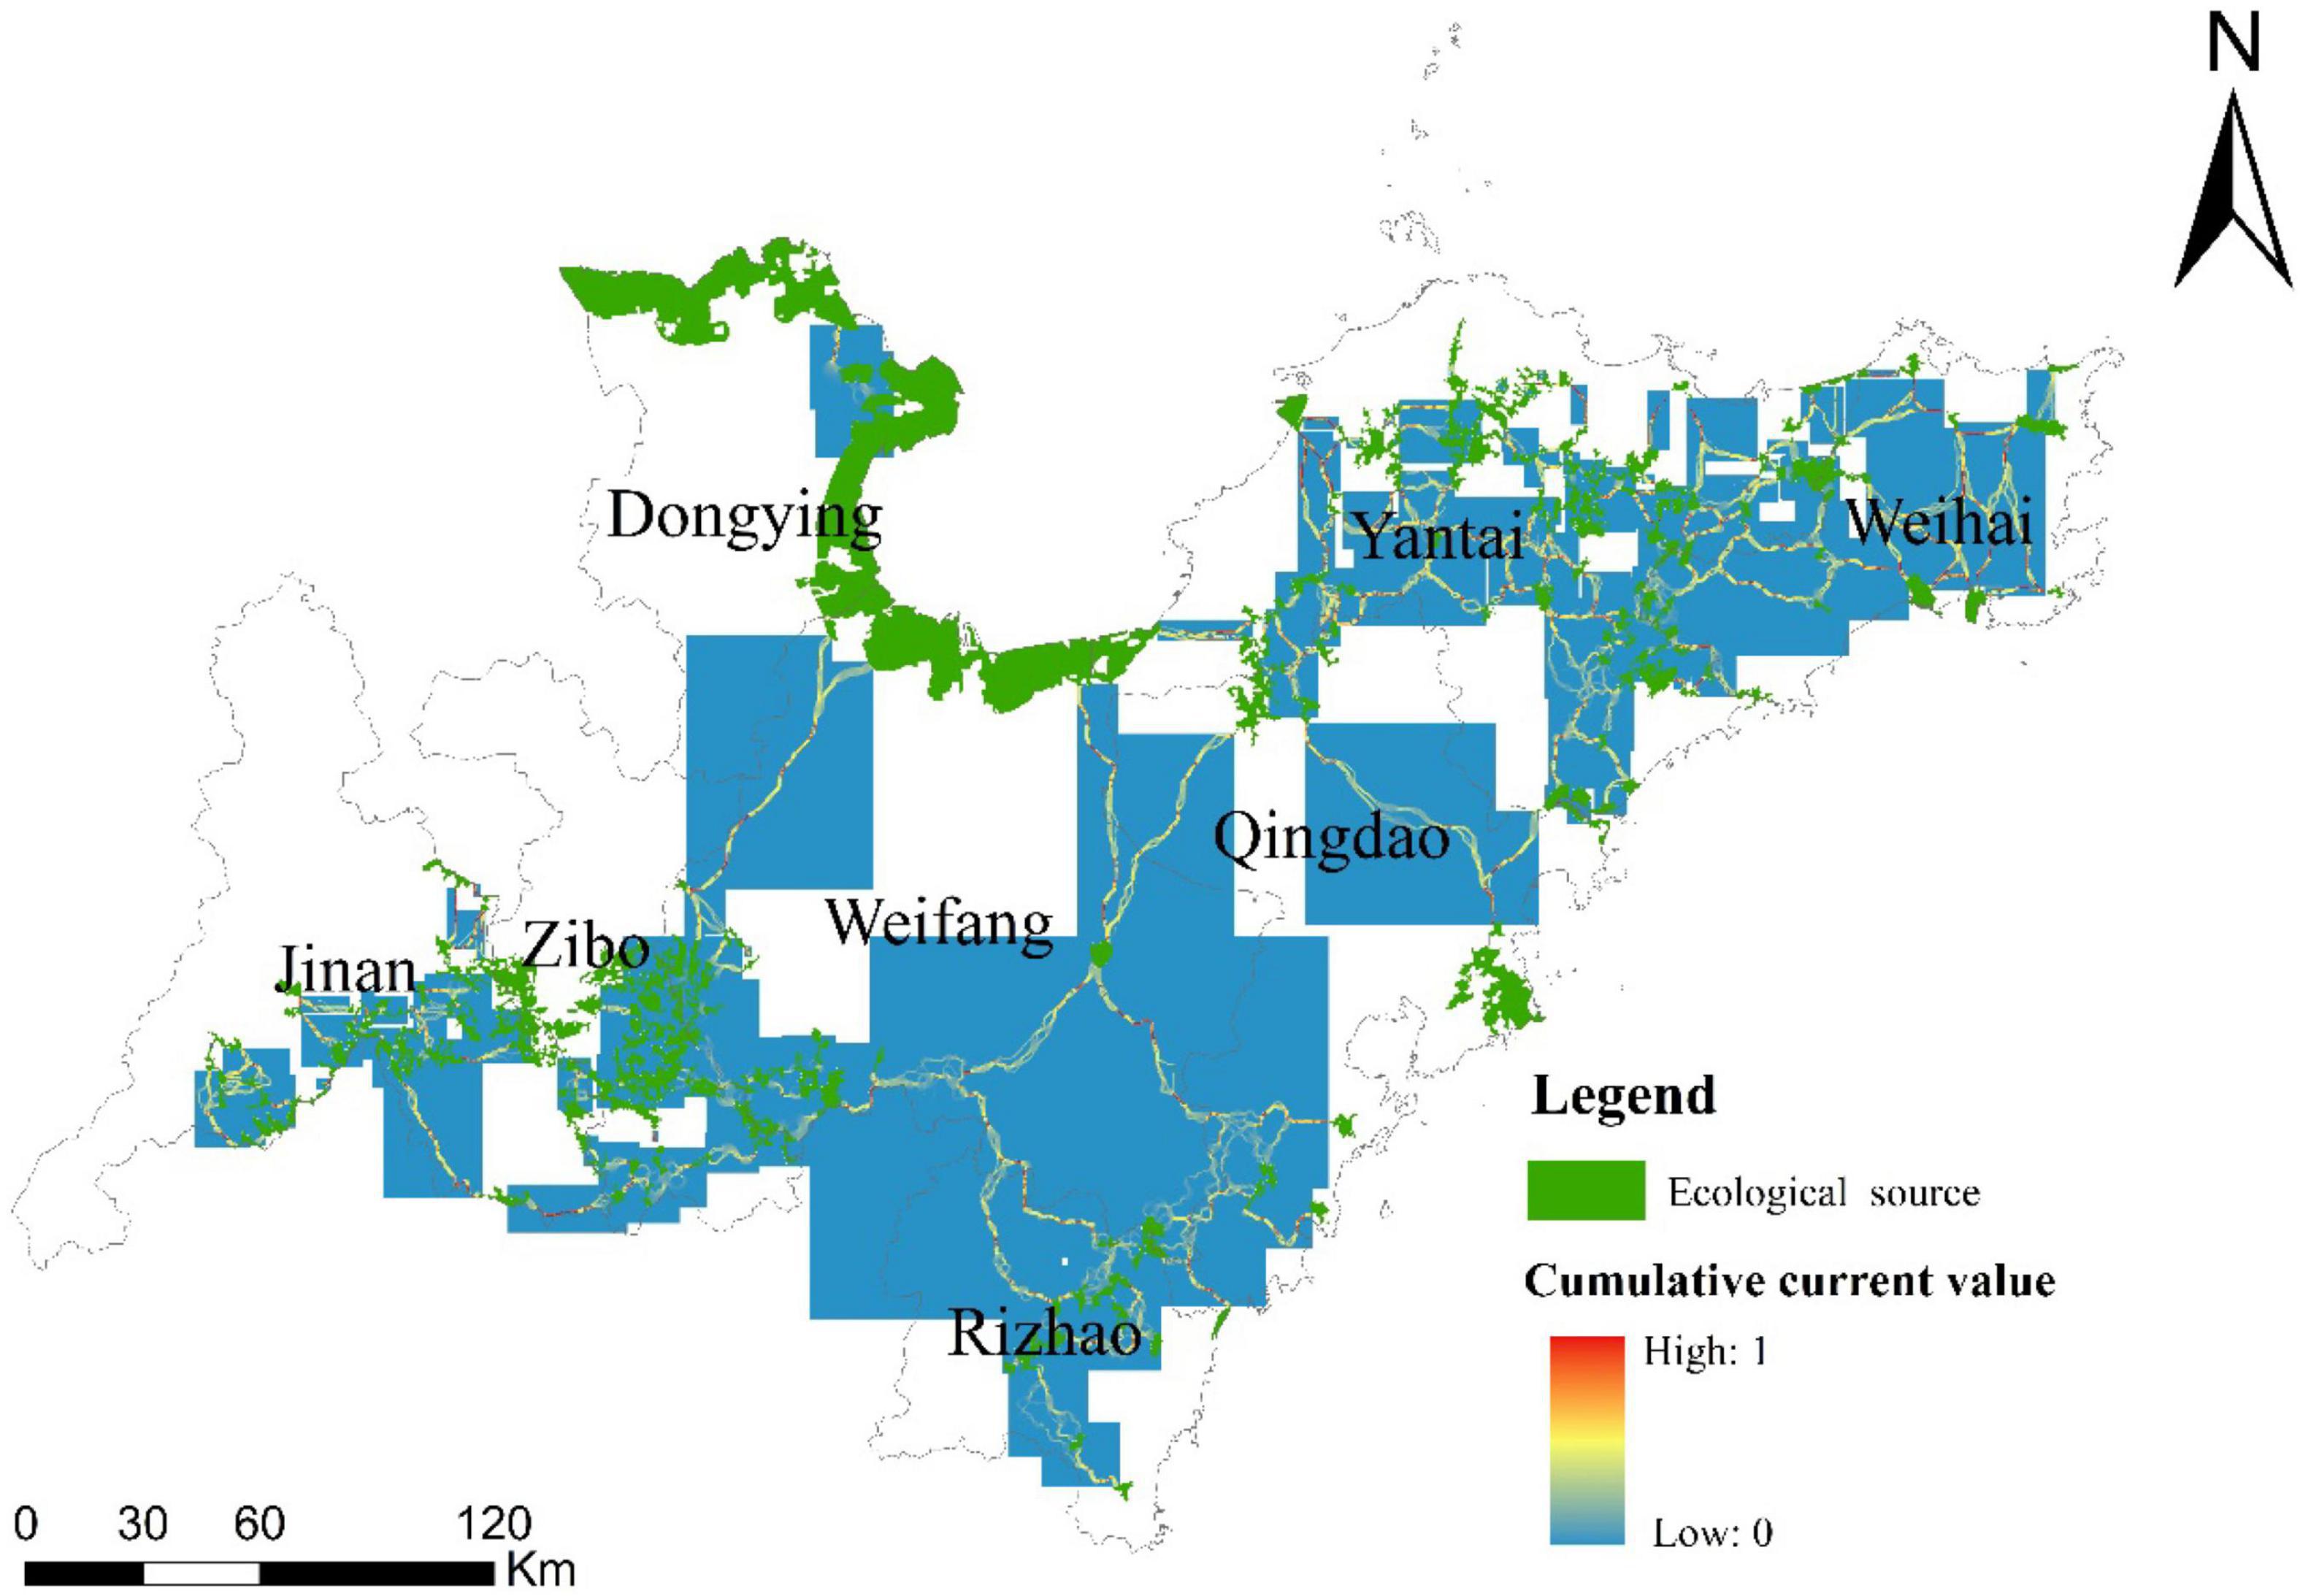
Figure 8. Cumulative current value of ecological corridors in Shandong Peninsula urban agglomeration.
Integrating ecological sources and ecological corridors, the spatial range of the ENs of the Shandong Peninsula urban agglomeration was identified (Figure 9). The total area of the ENs was 12136.61 km2, accounting for 16.18% of the total area of the study area. Among them, they were mainly distributed in Dongying, Zibo and Yantai, accounting for 25.26/19.91/18.27%, respectively; Weihai, Rizhao and Weifang each accounted for about 15%; Jinan and Qingdao accounted for the lowest percentage, about 10% each. The overall ENs also shown the spatial characteristics that dense surrounding and scarcity in the middle, influenced by the concentrated distribution of ecological sources in the periphery of the urban agglomeration.
Figure 9. Spatial distribution of ecological networks (ENs) in Shandong Peninsula urban agglomeration.
Priority Conservation and Restoration Areas in the Ecological Networks of Shandong Peninsula Urban Agglomeration
The priority conservation areas are the pinch points on the ecological corridor. As shown in Figure 10, the total area of the high value of cumulative current intensity (pinch points) was about 283.61 km2, accounting for 2.33% of the total area of the ENs. The pinch points were concentrated on the inter-group corridors and the corridors within the Yantai-Weihai group. Most of these corridors passed through dense urban areas and were poorly replaceable; once the function of the pinch point was degraded or lost, it will affect the connection of the whole ENs. Therefore, including the pinch point areas into the priority conservation areas of the ENs and ensuring the smooth flow of ecological corridors in the pinch point areas was the key to ensure that the ecological corridors effectively perform their ecological functions.
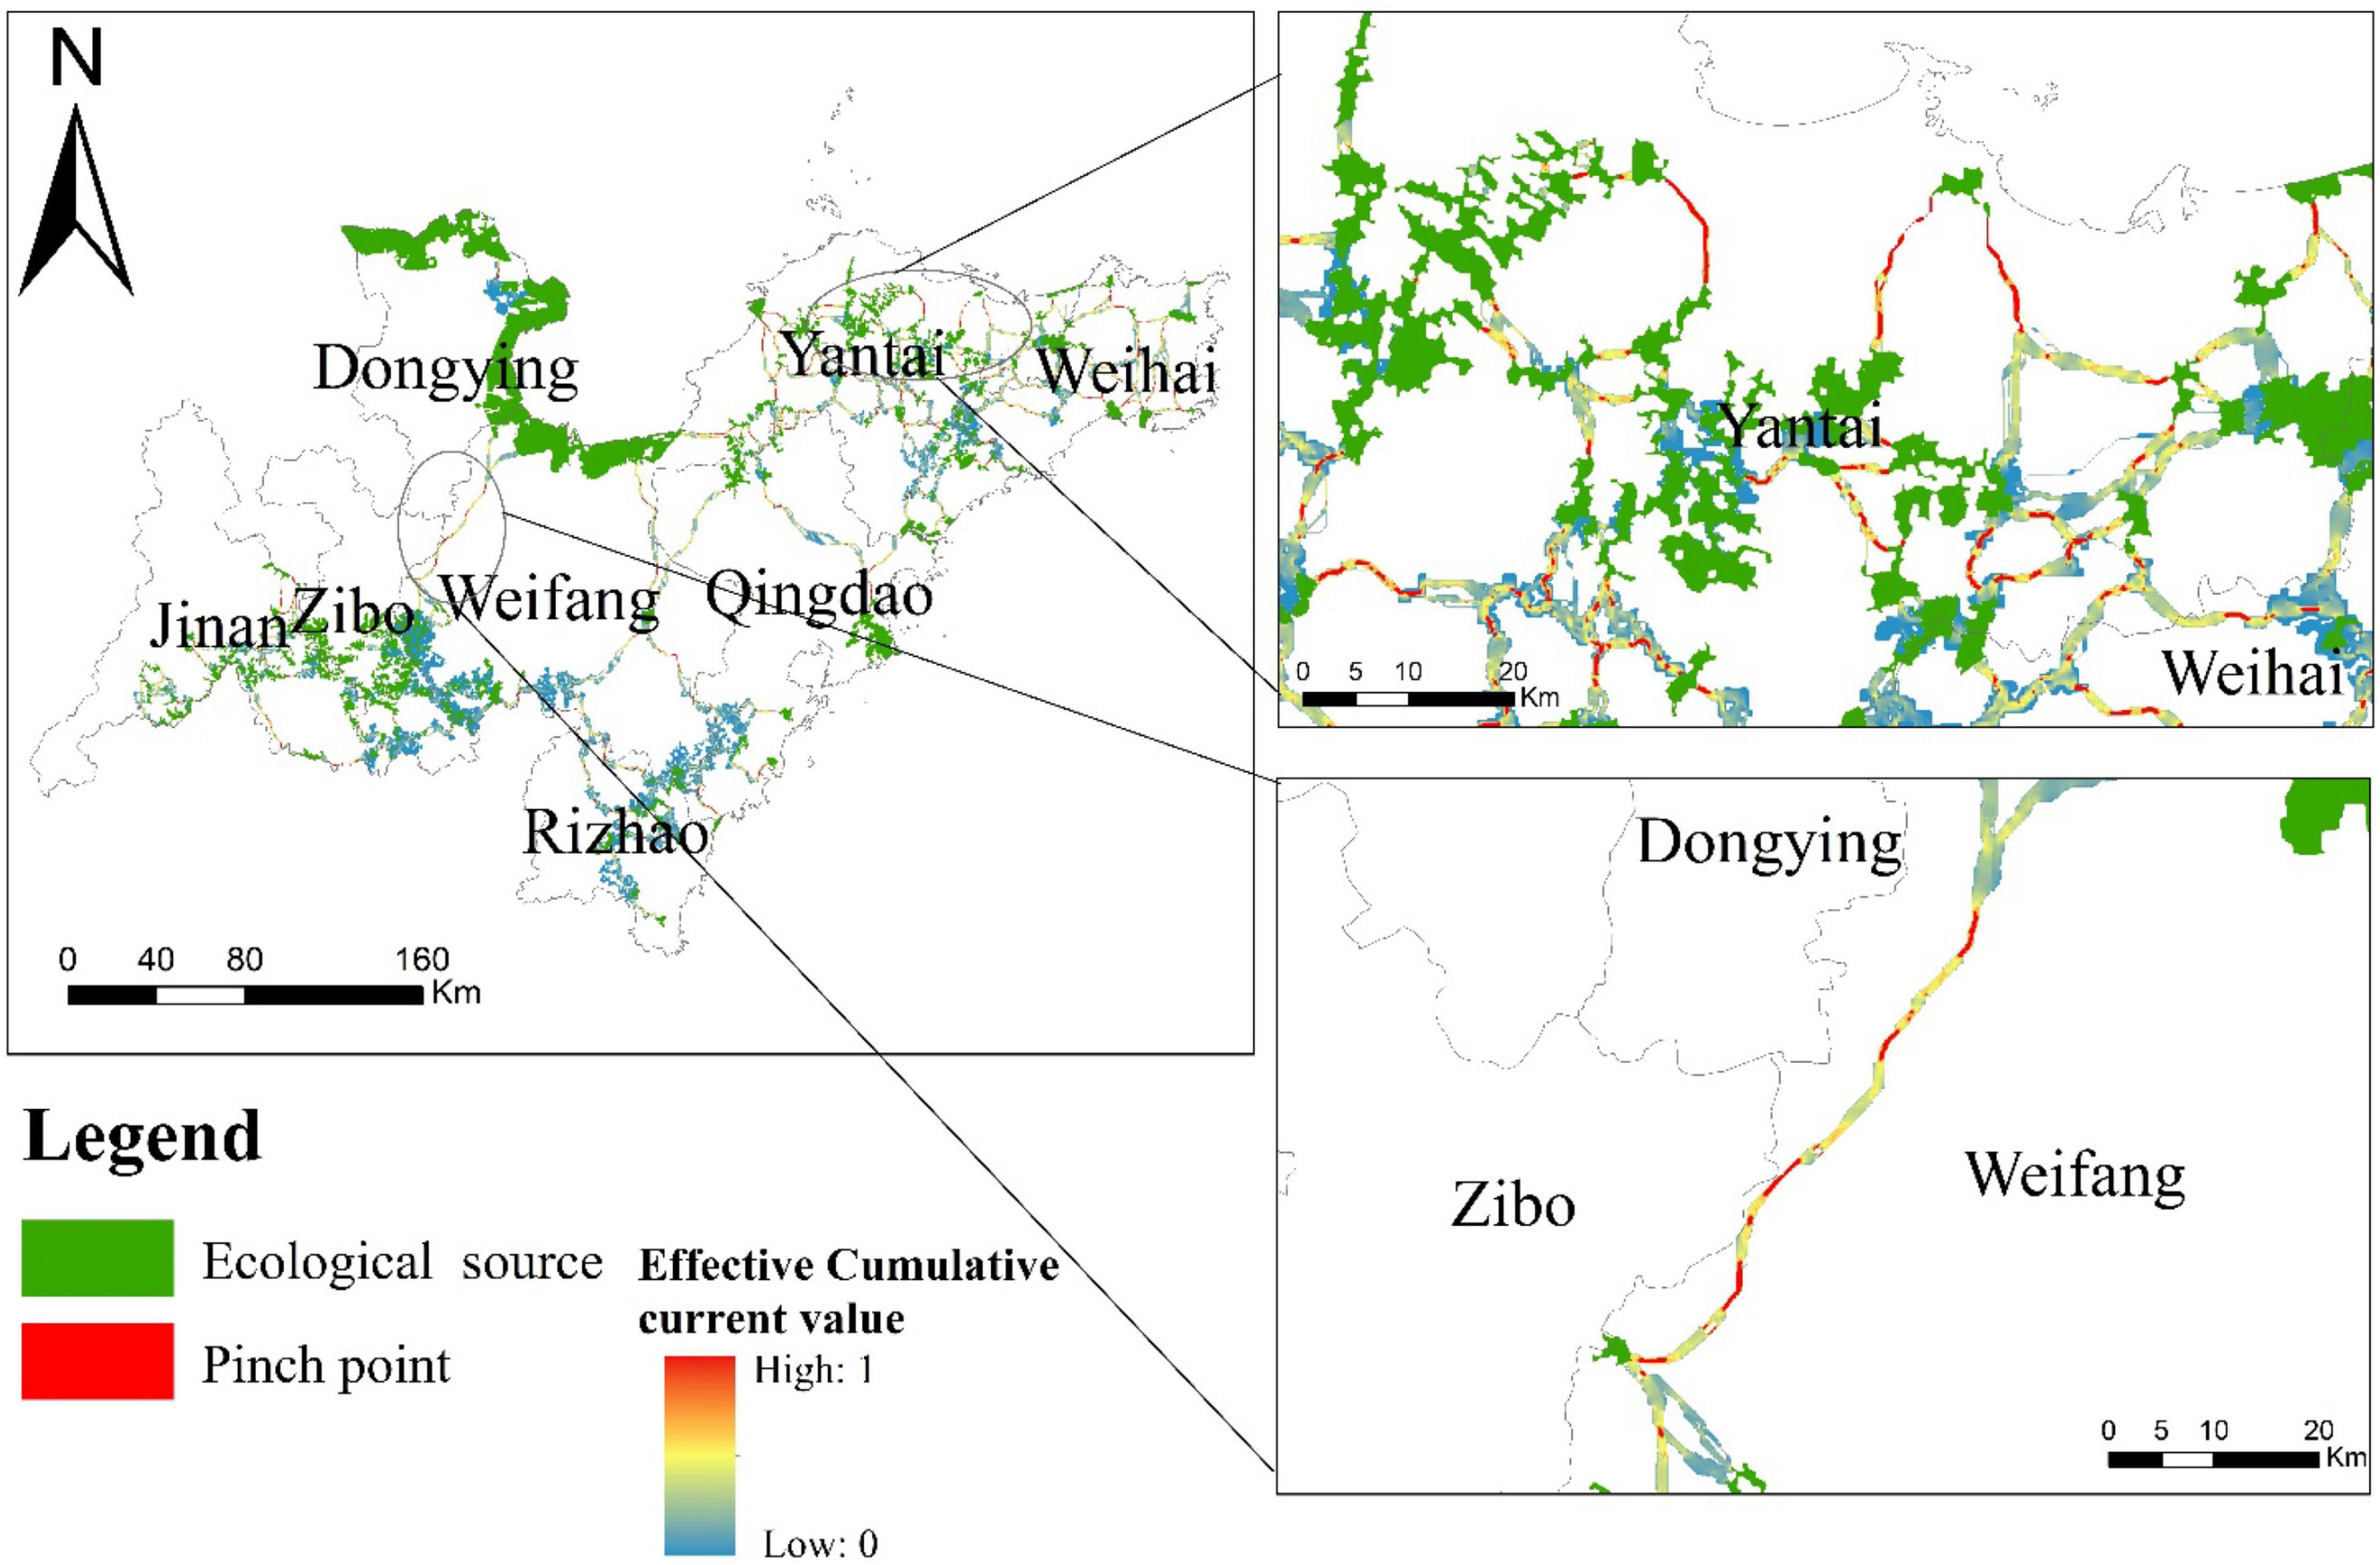
Figure 10. Spatial distribution of conservation priority areas in the ENs of Shandong Peninsula urban agglomeration.
The priority restoration area is the barrier on the ecological corridor. As shown in Figure 11, the high value areas of cumulative current recovery value (barriers) were mainly distributed in the eastern part of the central urban area of Jinan, the eastern part of the central urban area of Zibo, the eastern part of Qingdao, the southern part of the central urban area of Yantai and the southern part of the southwestern part of the central urban area of Weihai, with a total of 266 locations and a total area of 347.51 km2, accounting for 2.86% of the total area of the ENs. Among them, there were 61 obstacle points with an area of more than 1 km2, mainly distributed in the No. 1 inter-group corridor, No. 6 inter-group corridor and within the Yantai-Weihai ecological source group. These areas were densely populated with towns, concentrated contiguous construction land, intensive human activities, fragmented ecological land, narrow ecological corridors, and actual in a fractured state. Among them, the most urgent need for restoration measures was the area where pinch points and barriers overlap, with an area of 88.37 km2. These areas were the only corridors for biological flow between sources, with no alternative paths, but at the same time were in a broken state, indicating that there were no available paths between the ecological sources connected by this corridor. Therefore, if restoration measures were not taken in time, the connectivity of the urban agglomeration ecosystem and the effectiveness of ecological functions will be seriously affected.
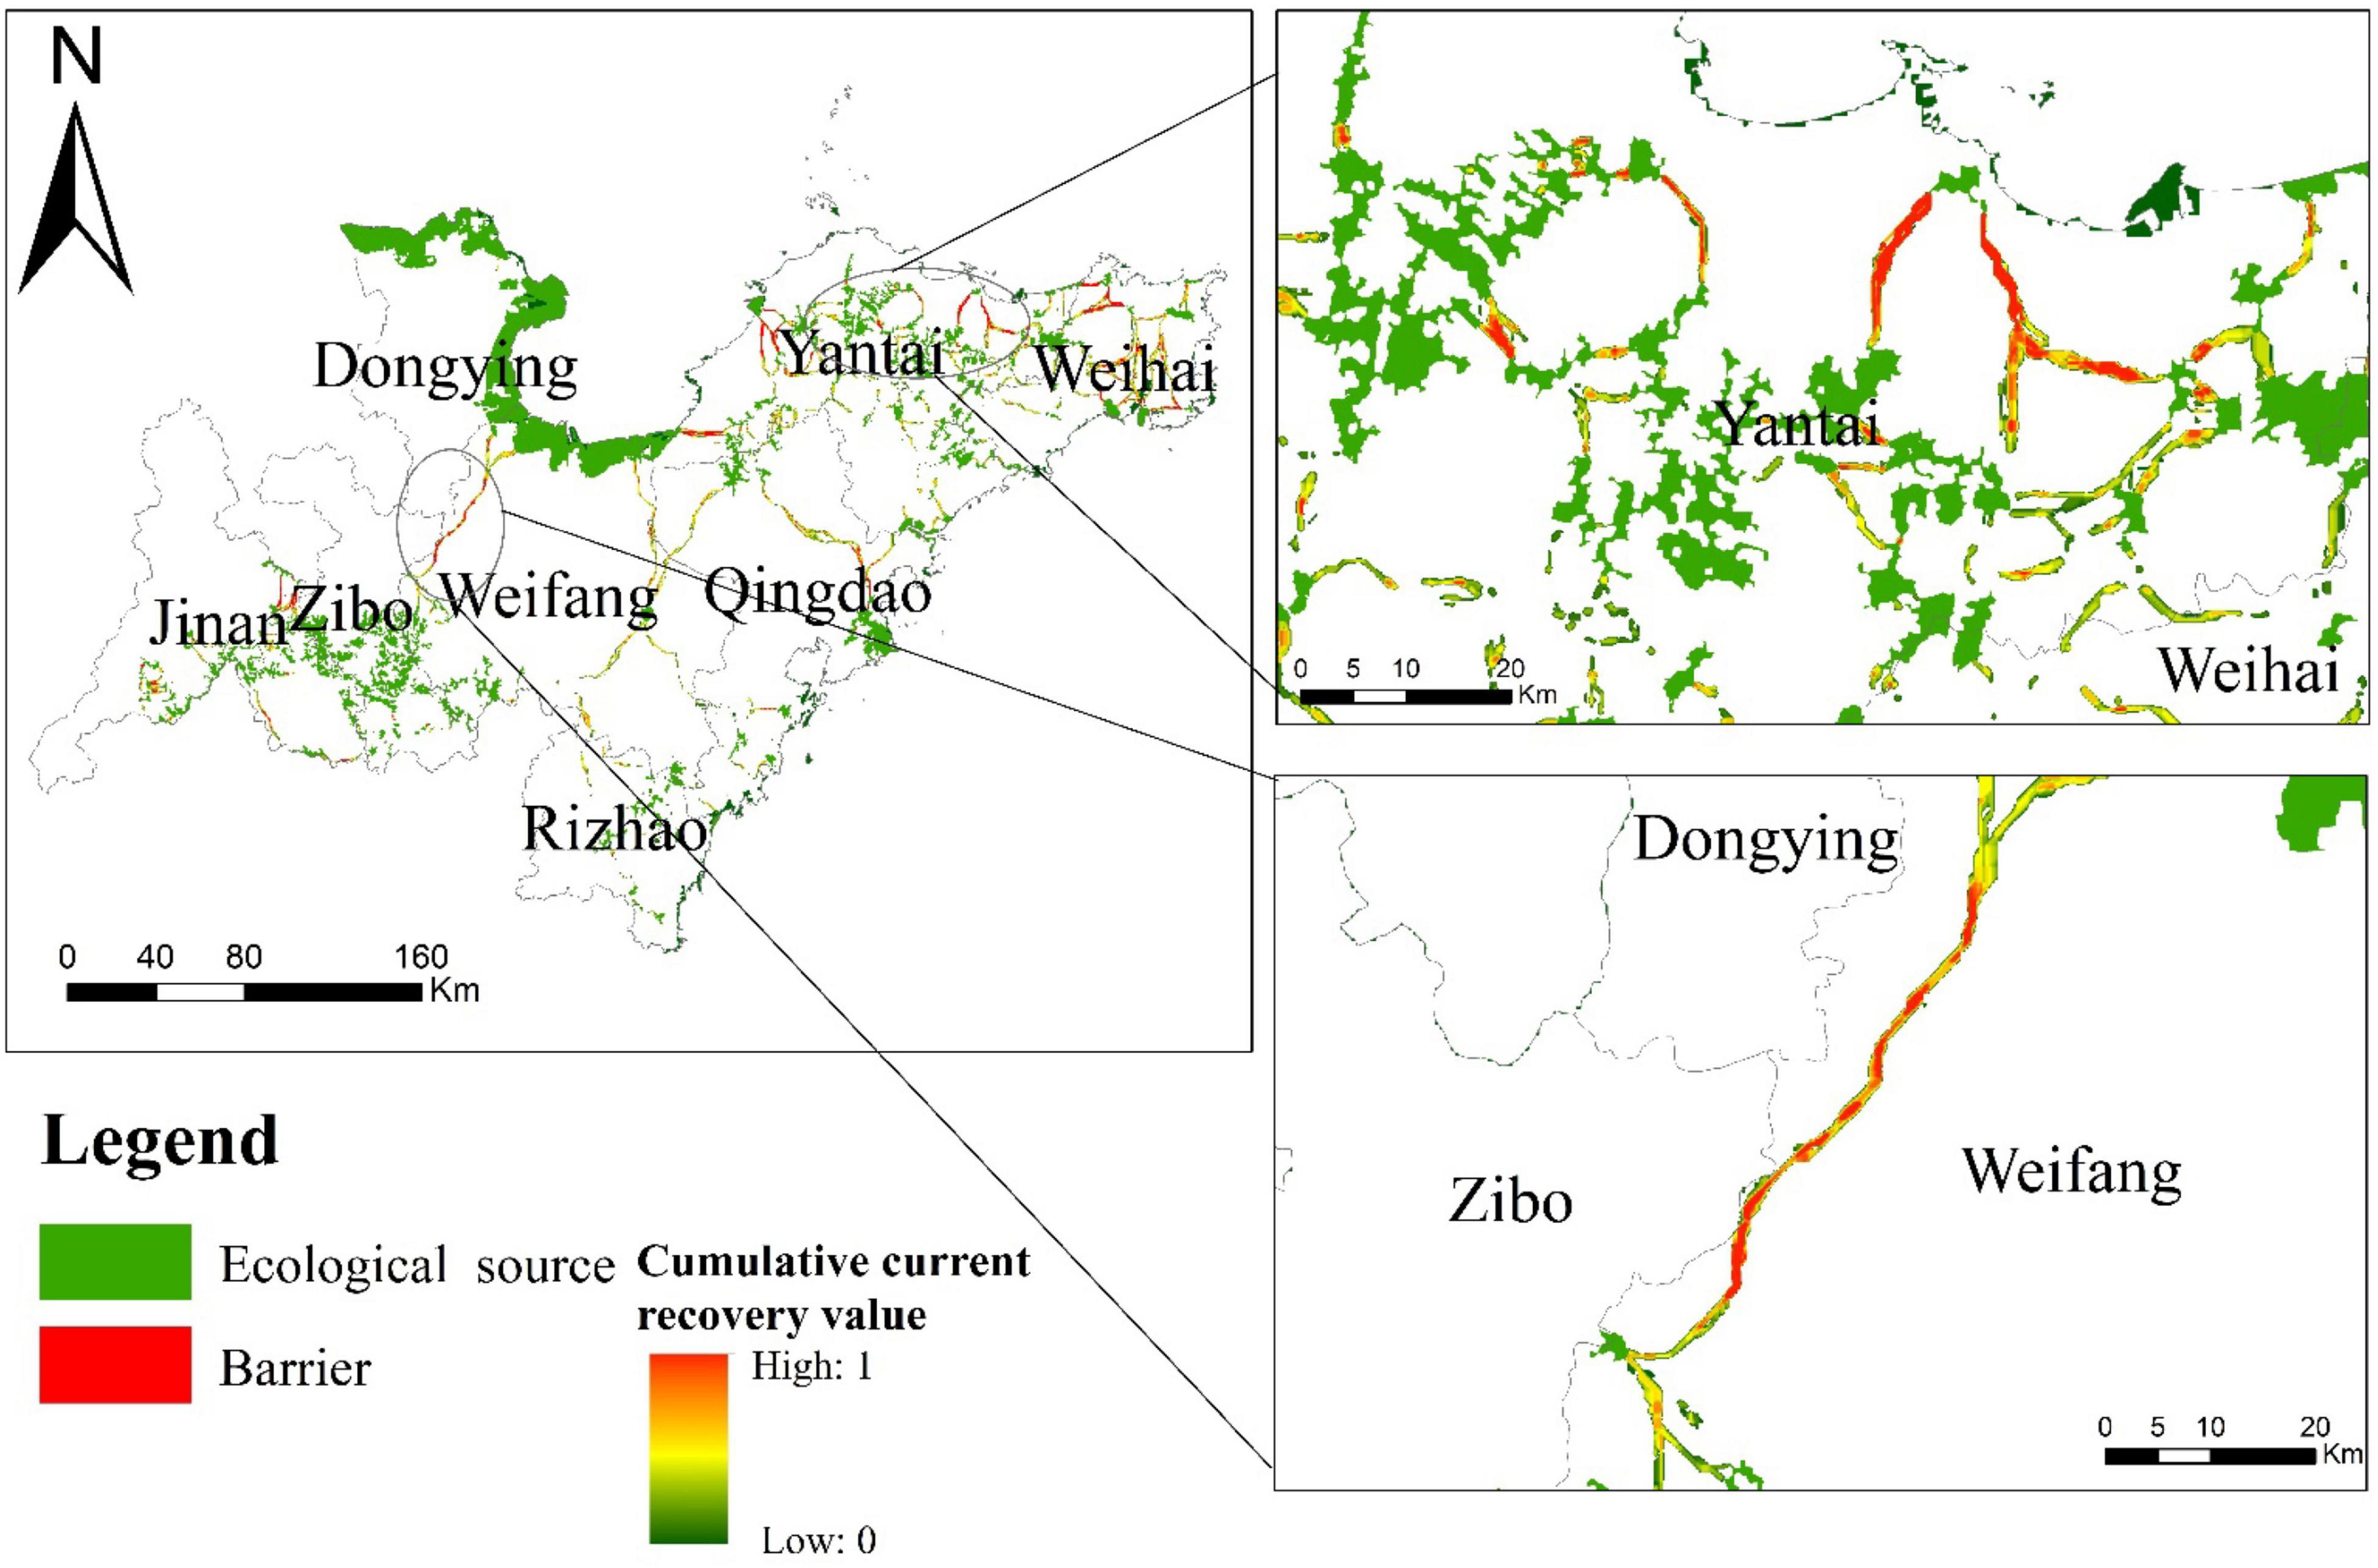
Figure 11. Spatial distribution of restoration priority areas in the ENs of Shandong Peninsula urban agglomeration.
In general, although the ENs in the Shandong Peninsula urban agglomeration consisted of large ecological sources and large-scale ecological corridors, the construction of ENs needs to focus on only a small part of the study area while maintaining the status quo. Most ecological corridors were in a reliable state, and the area that was in a broken state and must be restored does not exceed 350 km2. Although it is difficult to maintain the status quo, which is needed to control the rate, scale and direction of urban expansion. However, by focusing on priority areas for restoration and conservation, it provides a viable option for ENs construction.
Discussion and Conclusion
The Role of Ecosystem Functionally Important Areas in Ecological Networks
In this study, we identified ecological sources based on MSPA analysis and habitat quality assessment, constructed ecological resistance surfaces based on habitat risk and nighttime light data, and identified ecological corridors based on circuit theory. In general, we constructed an ENs for the Shandong Peninsula urban agglomeration from the perspective of maintaining ecosystem connectivity. However, the ENs should promote nature conservation on the one hand, and take into account the human demand for ecological products on the other hand, especially in large urban agglomeration. Therefore, ENs should not only maintain the integrity and connectivity of ecosystems, but also maintain and promote the effective performance of ecosystem functions and the effective supply of ecosystem services. Ecosystem functions include four aspects such as production function, regulation function, habitat maintenance function and information function (O’Farrell and Anderson, 2010). Ecosystem functionally important areas are key areas within an ecosystem that can effectively perform ecosystem functions. In the past studies, ecosystem functionally important areas were often directly considered as ecological sources (Weber et al., 2006; Peng et al., 2018b). However, connecting ecosystem functionally important areas (e.g., water connotation areas and recreational recreation areas) using ecological corridors does not seem to promote ecosystem function per se. Considering the natural ecological conditions and ecological needs of the study area, this study discusses the role of ecosystem functionally important area in the ENs by identifying important area of carbon sequestration function and PM2.5 removal function in the regulating function (the detailed calculation process in Supplementary Material).
In terms of spatial distribution (Figure 12), the scope and area of the ecosystem functionally important areas are much larger than the ecological sources. If the ecosystem functionally important areas are included in the ecological sources, it is likely to identify ineffective ecological corridors, increase the scale and protection cost of the ENs, and reduce the nature conservation value and efficiency. Looking at the spatial overlay of ecological networks and ecosystem functionally important areas, a clear spatial hierarchy can be found. The ecological sources are the core, the ecological corridors are the channels that disperse around the ecological sources, and the ecosystem functionally important areas surround them. Therefore, we consider the ecosystem functionally important areas as a low-intensity land use buffer around the ecological network, which protects the ENs from the high-intensity disturbances associated with urban development and is an important part of the ENs. It can also be considered as a transition area between the natural ecosystem represented by the ENs and the socio-economic system, which provides both a buffer zone for the protection of the ENs and an effective ecosystem service for human society.
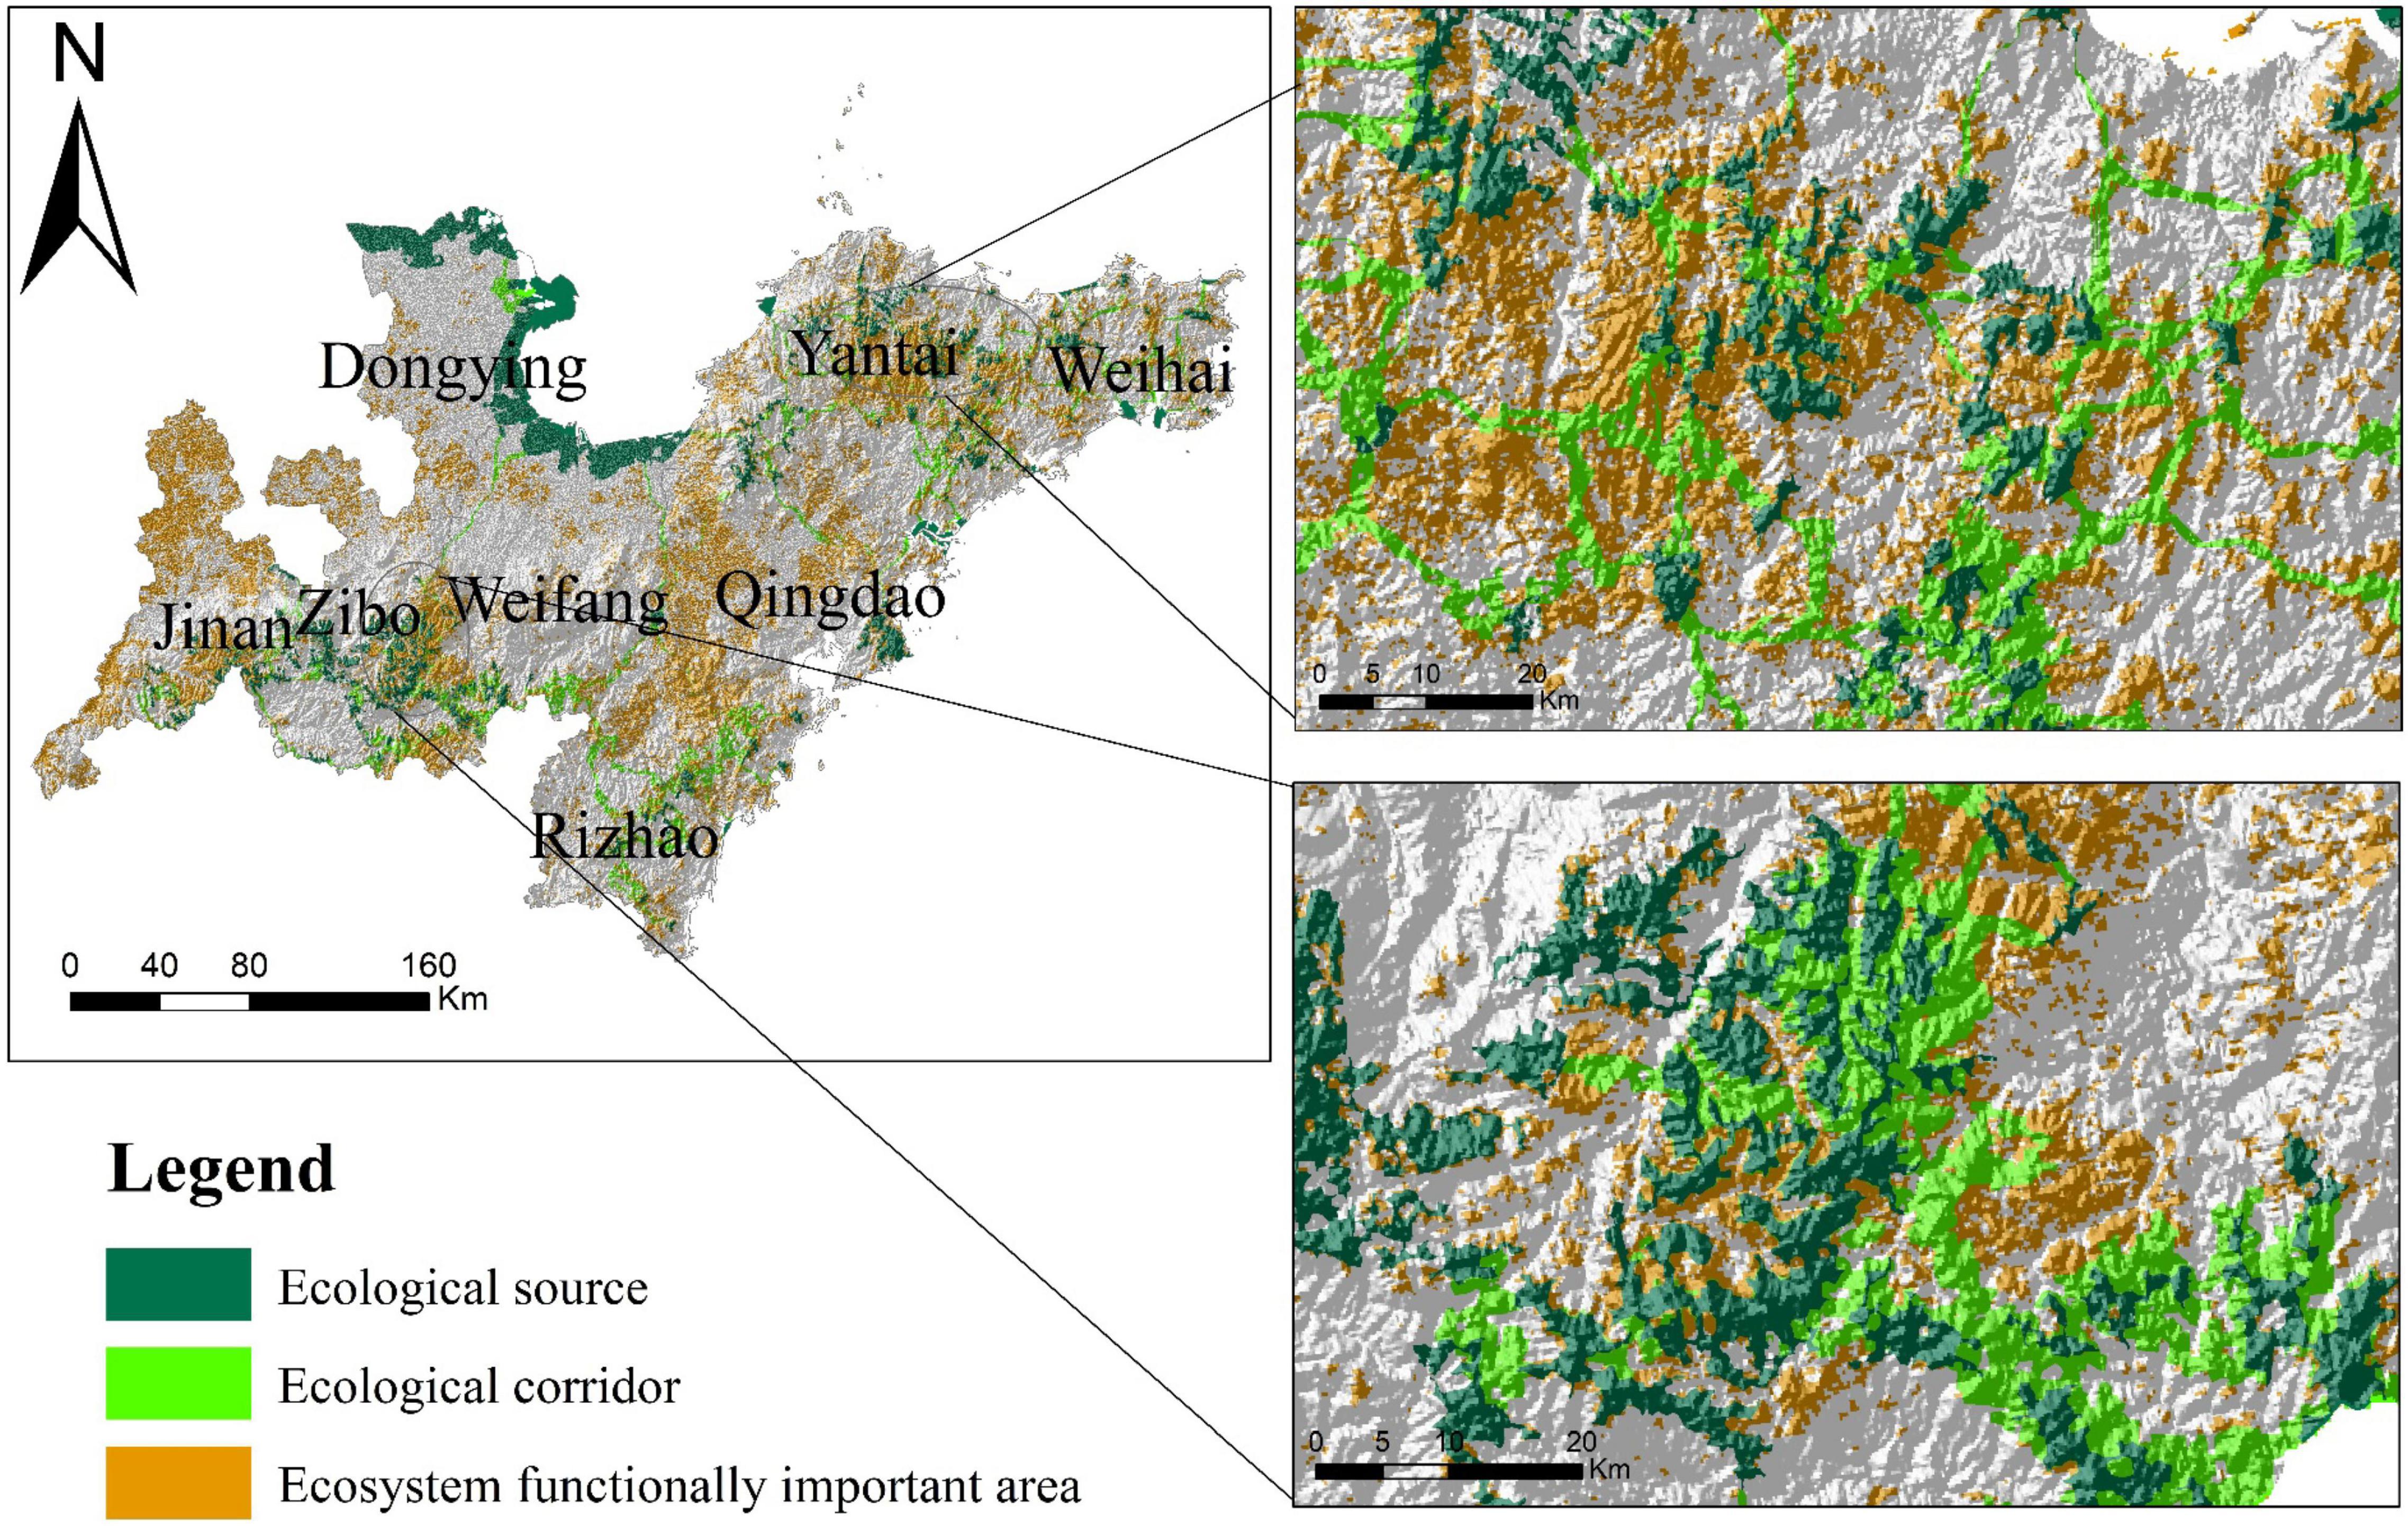
Figure 12. Spatial overlap of ENs and ecosystem functionally important areas.
Achieving nature conservation and maintaining ecosystem functions are two aspects of ENs, which should not be confused with each other but not completely separated. We believe that on the basis of constructing ENs that maintains regional biodiversity and regional ecosystem connectivity, integrating ecosystem functionally important areas into the ENs and acting as buffer zones for the core elements of the ENs can realize the integration of the structure and function of the ENs.
Implications for the Implementation Plan of Ecological Conservation and Restoration in Shandong Peninsula Urban Agglomeration
For different spatial elements in the ENs, according to the ecological characteristics of various spatial elements and their sensitivity to human activities, the implementation plan for ecological conservation and restoration of large urban agglomeration should develop different conservation and restoration measures. First, the ecological source areas that need strict conservation. For core habitats such as Mount Lu, Mount Yi and Kunyu mountain, ecological conservation measures must be strictly implemented to enhance the conservation and maintenance of habitat systems on the premise of ecological conservation; the intensity of human activities must be reduced as much as possible, and all large-scale production and construction activities are prohibited. Second, ecological corridors that need to be maintained and constructed. For the priority conservation areas on ecological corridors, land use type conversion should be strictly restricted to avoid the loss of ecological functions and affect the efficiency and stability of ENs connectivity. For the priority restoration areas on ecological corridors, engineering measures such as returning farmland to forest and grass, ecological re-greening, and building wildlife corridors should be taken to restore corridor functions and improve the connectivity of ENs. Third, ecosystem functionally important areas that need to be maintained and protected. Destructive and high-intensity urban development should be avoided in these areas, and agricultural development, tourism development and other development and utilization activities should be carried out without destroying the corresponding ecological functions.
Limitations and Directions for Future Work
In China, ecosystem conservation and restoration has been elevated to a national strategy in response to the enormous threats to the country’s natural ecosystem caused by rapid urban expansion over the past decades. Especially in large urban agglomeration, there is an urgent need to identify key ecological spaces and prioritize conservation and restoration. Based on the integration of MSPA and circuit theory, this study develops an integrated approach to identify the spatial range and key areas of ENs and integrate ecosystem functionally important areas into them to form a spatial scheme of ENs that both achieve nature conservation and maintain ecosystem functions. In the ENs identification, we improved the method of setting ecological resistance surface. Unlike most past studies that assigned ecological resistance values based on land use types, we constructed ecological resistance surfaces based on habitat risk and nighttime lighting data. This method takes into account the landscape variability of the same land type in different areas, which makes the setting of resistance values more objective. Based on the effective current intensity and cumulative recovery current values of the ecological corridor calculated by circuit theory, this study identified the width and key areas of the ecological corridor. Compared with most past studies that could only identify the direction of ecological corridors, this made the ENs no longer an abstract network of points and lines, but a spatially presentable landscape entity. And it allows ENs planning and ecological protection and restoration measures for large urban agglomeration to be implemented to specific patches. By focusing on priority conservation and restoration areas in ENs, the effectiveness and connectivity of ENs can be ensured as much as possible by concentrating ecological investments in a few priority areas with limited investments. In addition, we have explored the integration of ecologically important areas into ENs, rather than simply including ecologically important areas into ecological sources, to avoid the creation of ineffective corridors.
However, combined with the existing studies, we believe that there are still some shortcomings in this study that need to be further explored. The determination of the width of ecological corridors is still a difficult problem in ENs research (Weber et al., 2006; Wang et al., 2019; Huang L. et al., 2021). Research on ecological corridor width determination is not mature. This study took the effective current value of the ecological corridor calculated by the model as the spatial range of the ecological corridor. Although it avoids the subjectivity of indicator selection and spatial gradient setting in existing methods and improves the spatial precision of corridor identification, it does not take into account the landscape characteristics, spatial heterogeneity and functional effectiveness inside and outside the corridor. These are the key indicators that may affect the corridor width. Therefore, the accuracy and validity of ecological corridor width still need to be further tested and studied. The design of ecological corridors strictly depends on the spatial scale (Fichera et al., 2015; Liang et al., 2018), so what is the appropriate width of ecological corridors under different geographic environments and spatial scales? Further research should be conducted from different perspective and corridor ecological effect measurement. In addition, in-depth research is needed on the coupling and coordination of nature conservation and ecosystem functions in ENs. In addition to the simple inclusion of ecosystem functionally important areas into ecological networks, the coupling and coordination relationship between biodiversity conservation and multiple ecosystem functions, and the difference in sensitivity of different ecosystem functions to human activities should be explored.
Conclusion
Most previous studies on ENs can only determine the orientation of ecological corridors, and were not mature enough in determining their spatial range. In this study, an integrated approach based on MSPA analysis and circuit theory was developed for determining the spatial range of ENs of the Shandong Peninsula urban agglomeration and the priority areas for restoration and protection. The results shown that the ENs of the Shandong Peninsula urban agglomeration consists of 6,263.73 km2 of ecological sources and 12136.61 km2 of ecological corridors, accounting for about 16.18% of the total area of the study area. Ecological sources were distributed in groups, and ecological corridors were distributed in a network within each source group and in a narrow line between source groups. The priority conservation areas and priority restoration areas in the ENs were pinch points and barriers on the ecological corridors, respectively, with a total area of 542.75 km2. Planners and the government should focus implementation planning on priority areas through effective restoration and protection measures, such as eco-redlining policies, eco-agriculture, and reforestation. This method can provide spatial guidance for the implementation of ENs and urban planning for the Shandong Peninsula urban agglomeration. This approach prioritizes ENs in a simple but effective way, which may help planners and the government to implement ecological protection and restoration projects, and more funds and resources should be allocated to priority areas.
Data Availability Statement
The raw data supporting the conclusions of this article will be made available by the authors, without undue reservation.
Author Contributions
TZ and LH: conceptualization, methodology, software, writing—original draft preparation, formal analysis, and visualization. TZ: investigation, resources, data curation, writing—review and editing, supervision, project administration, and funding acquisition. Both authors have read and agreed to the published version of the manuscript.
Funding
This research was funded by the National Natural Science Foundation of China (grant no. 42101298).
Conflict of Interest
The authors declare that the research was conducted in the absence of any commercial or financial relationships that could be construed as a potential conflict of interest.
Publisher’s Note
All claims expressed in this article are solely those of the authors and do not necessarily represent those of their affiliated organizations, or those of the publisher, the editors and the reviewers. Any product that may be evaluated in this article, or claim that may be made by its manufacturer, is not guaranteed or endorsed by the publisher.
Supplementary Material
The Supplementary Material for this article can be found online at: https://www.frontiersin.org/articles/10.3389/fevo.2022.828979/full#supplementary-material
Footnotes
References
Afionis, S., Mkwambisi, D. D., and Dallimer, M. (2020). Lack of cross-sector and cross-level policy coherence and consistency limits urban green infrastructure implementation in Malawi. Front. Environ. Sci. 8:558619. doi: 10.3389/fenvs.2020.558619
Arkema, K. K., Verutes, G., Bernhardt, J. R., Clarke, C., Rosado, S., Canto, M., et al. (2014). Assessing habitat risk from human activities to inform coastal and marine spatial planning: a demonstration in Belize. Environ. Res. Lett. 9:114016. doi: 10.1088/1748-9326/9/11/114016
Coppola, E., Rouphael, Y., Pascale, S. D., Moccia, F. D., and Cirillo, C. (2019). Ameliorating a complex urban ecosystem through instrumental use of softscape buffers: proposal for a green infrastructure network in the metropolitan area of Naples. Front. Plant Sci. 10:410. doi: 10.3389/fpls.2019.00410
Cunha, N. S., and Magalhães, M. R. (2019). Methodology for mapping the national ecological network to mainland Portugal: a planning tool towards a green infrastructure. Ecol. Indic. 104, 802–818. doi: 10.1016/j.ecolind.2019.04.050
Dai, L., Liu, Y., and Luo, X. (2021). Integrating the MCR and DOI models to construct an ecological security network for the urban agglomeration around Poyang Lake, China. Sci. Total Environ. 754:141868. doi: 10.1016/j.scitotenv.2020.141868
D’Aloia, C. C., Naujokaitis-Lewis, I., Blackford, C., Chu, C., Curtis, J. M. R., Darling, E., et al. (2019). Coupled networks of permanent protected areas and dynamic conservation areas for biodiversity conservation under climate change. Front. Ecol. Evol. 7:27. doi: 10.3389/fevo.2019.00027
De Montis, A., Ganciu, A., Cabras, M., Bardi, A., Peddio, V., Caschili, S., et al. (2019). Resilient ecological networks: a comparative approach. Land Use Policy 89, 104207. doi: 10.1016/j.landusepol.2019.104207
Deng, J. S., Wang, K., Hong, Y., and Qi, J. G. (2009). Spatio-temporal dynamics and evolution of land use change and landscape pattern in response to rapid urbanization. Landsc. Urban Plann. 92, 187–198. doi: 10.1016/j.landurbplan.2009.05.001
Dong, J., Peng, J., Liu, Y., Qiu, S., and Han, Y. (2020). Integrating spatial continuous wavelet transform and kernel density estimation to identify ecological corridors in megacities. Landsc. Urban Plann. 199:103815. doi: 10.1016/j.landurbplan.2020.103815
Duggan, J. M., Eichelberger, B. A., Ma, S., Lawler, J. J., and Ziv, G. (2015). Informing management of rare species with an approach combining scenario modeling and spatially explicit risk assessment. Ecosyst. Health Sustain. 1, 1–18. doi: 10.1890/EHS14-0009.1
Elansky, N. F., Ponomarev, N. A., and Verevkin, Y. M. (2018). Air quality and pollutant emissions in the moscow megacity in 2005–2014. Atmos. Environ. 175, 54–64. doi: 10.1016/j.atmosenv.2017.11.057
Fichera, C. R., Laudari, L., and Modica, G. (2015). Application, validation and comparison in different geographical contexts of an integrated model for the design of ecological networks. J. Agric. Eng. 46, 52–61. doi: 10.4081/jae.2015.459
Gaston, K. J., Bennie, J., and Davies, T. W. (2013). The ecological impacts of nighttime light pollution: a mechanistic appraisal. Biol. Rev. 88, 912–927. doi: 10.1111/brv.12036
Hammad, A. A., and Tumeizi, A. (2012). Land degradation: socioeconomic and environmental causes and consequences in the eastern mediterranean. Land Degrad. Dev. 23, 216–226. doi: 10.1002/ldr.1069
Huang, L., Wang, J., Fang, Y., Zhai, T., and Cheng, H. (2021). An integrated approach towards spatial identification of restored and conserved priority areas of ecological network for implementation planning in metropolitan region. Sustain. Cities Soc. 69:102865. doi: 10.1016/j.scs.2021.102865
Huang, L. Y., Liu, S. H., Fang, Y., and Zou, L. (2019). Construction of Wuhan’s ecological security pattern under the” quality-risk-requirement” framework. J. Appl. Ecol. 30, 615–626. doi: 10.13287/j.1001-9332.201902.014
Huang, X., Wang, H., Shan, L., and Xiao, F. (2021). Constructing and optimizing urban ecological network in the context of rapid urbanization for improving landscape connectivity. Ecol. Indic. 132:108319. doi: 10.1016/j.ecolind.2021.108319
Isaac, N. J., Brotherton, P. N., Bullock, J. M., Gregory, R. D., Boehning-Gaese, K., Connor, B., et al. (2018). Defining and delivering resilient ecological networks: nature conservation in England. J. Appl. Ecol. 55, 2537–2543. doi: 10.1111/1365-2664.13196
Jin, G., Chen, K., Liao, T., Zhang, L., and Najmuddin, O. (2020). Measuring ecosystem services based on government intentions for future land use in Hubei Province: implications for sustainable landscape management. Landsc. Ecol. 36, 2025–2042. doi: 10.1007/s10980-020-01116-3
Kong, F., Ban, Y., Yin, H., James, P., and Dronova, I. (2017). Modeling stormwater management at the city district level in response to changes in land use and low impact development. Environ. Modell. Softw. 95, 132–142. doi: 10.1016/j.envsoft.2017.06.021
Li, F., Wang, L., Chen, Z., Clarke, K. C., Li, M., and Jiang, P. (2018). Extending the SLEUTH model to integrate habitat quality into urban growth simulation. J. Environ. Manag. 217, 486–498. doi: 10.1016/j.jenvman.2018.03.109
Li, S., Wu, X., Zhao, Y., and Lv, X. (2020). Incorporating ecological risk index in the multi-process mcre model to optimize the ecological security pattern in a semi-arid area with intensive coal mining: a case study in northern china - sciencedirect. J. Clean. Prod. 247:119143. doi: 10.1016/j.jclepro.2019.119143
Liang, J., He, X., Zeng, G., Zhong, M., Gao, X., Li, X., et al. (2018). Integrating priority areas and ecological corridors into national network for conservation planning in China. Sci. Total Environ. 626, 22–29. doi: 10.1016/j.scitotenv.2018.01.086
Liquete, C., Kleeschulte, S., Dige, G., Maes, J., Grizzetti, B., Olah, B., et al. (2015). Mapping green infrastructure based on ecosystem services and ecological networks: a Pan-European case study. Environ. Sci. Policy 54, 268–280. doi: 10.1016/j.envsci.2015.07.009
Marchant, S. C. (2014). Investing in Ecological Infrastructure: A Framework for Sustainable Development. Brisbane, QLD: The University of Queensland, doi: 10.14264/UQL.2014.425
Masum, K. M., Mansor, A., Sah, S. A. M., and Lim, H. S. (2017). Effect of differential forest management on land-use change (luc) in a tropical hill forest of malaysia. J. Environ. Manag. 200, 468–474. doi: 10.1016/j.jenvman.2017.06.009
Mcdonald, R. I., Güneralp, B., Chun-Wei, H., Seto, K. C., and Mingde, Y. (2018). Conservation priorities to protect vertebrate endemics from global urban expansion. Biol. Conserv. 224, 290–299. doi: 10.1016/j.biocon.2018.06.010
McRae, B. H., and Beier, P. (2007). Circuit theory predicts gene flow in plant and animal populations. Proc. Natl. Acad. Sci. U.S.A. 104, 19885–19890. doi: 10.1073/pnas.0706568104
McRae, B. H., Dickson, B. G., Keitt, T. H., and Shah, V. B. (2008). Using circuit theory to model connectivity in ecology, evolution, and conservation. Ecology 89, 2712–2724. doi: 10.1890/07-1861.1
O’Farrell, P. J., and Anderson, P. M. (2010). Sustainable multifunctional landscapes: a review to implementation. Curr. Opin. Environ. Sustain. 2, 59–65. doi: 10.1016/j.cosust.2010.02.005
Pei, F., Li, X., Liu, X., Lao, C., and Xia, G. (2015). Exploring the response of net primary productivity variations to urban expansion and climate change: a scenario analysis for guangdong province in china. J. Environ. Manag. 150, 92–102. doi: 10.1016/j.jenvman.2014.11.002
Peng, J., Lin, H., Chen, Y., Blaschke, T., Luo, L., Xu, Z., et al. (2020). Spatiotemporal evolution of urban agglomerations in China during 2000–2012: a nighttime light approach. Landsc. Ecol. 35, 421–434. doi: 10.1007/s10980-019-00956-y
Peng, J., Pan, Y., and Liu, Y. (2018a). Linking ecological degradation risk to identify ecological security patterns in a rapidly urbanizing landscape. Habitat Int. 71, 110–124. doi: 10.1016/j.habitatint.2017.11.010
Peng, J., Tian, L., Liu, Y., Zhao, M., Hu, Y., and Wu, J. (2017). Ecosystem services response to urbanization in metropolitan areas: thresholds identification. Sci. Total Environ. 60, 706–714. doi: 10.1016/j.scitotenv.2017.06.218
Peng, J., Yang, Y., Liu, Y., Du, Y., Meersmans, J., and Qiu, S. (2018b). Linking ecosystem services and circuit theory to identify ecological security patterns. Sci. Total Environ. 644, 781–790. doi: 10.1016/j.scitotenv.2018.06.292
Peng, J., Zhao, S., Dong, J., Liu, Y., Meersmans, J., Li, H., et al. (2019). Applying ant colony algorithm to identify ecological security patterns in megacities. Environ. Modell. Softw. 117, 214–222. doi: 10.1016/j.envsoft.2019.03.017
Pierik, M. E., Dell’Acqua, M., Confalonieri, R., Bocchi, S., and Gomarasca, S. (2016). Designing ecological corridors in a fragmented landscape: a fuzzy approach to circuit connectivity analysis. Ecol. Indic. 67, 807–820. doi: 10.1016/j.ecolind.2016.03.032
Rebelo, A. G., Holmes, P. M., Dorse, C., and Wood, J. (2011). Impacts of urbanization in a biodiversity hotspot: conservation challenges in metropolitan cape town. South Afr. J. Bot. 77, 20–35. doi: 10.1016/j.sajb.2010.04.006
Salvati, L., Zambon, I., Chelli, F. M., and Serra, P. (2018). Do spatial patterns of urbanization and land consumption reflect different socioeconomic contexts in europe? Sci. Total Environ. 625, 722–730. doi: 10.1016/j.scitotenv.2017.12.341
Sharp, R., Tallis, H. T., Ricketts, T., Guerry, A. D., Wood, S. A., Chaplin-Kramer, R., et al. (2016). InVEST+ VERSION+ User’s Guide. The Natural Capital Project.
Sigwela, A., Elbakidze, M., Powell, M., and Angelstam, P. (2017). Defining core areas of ecological infrastructure to secure rural livelihoods in South Africa. Ecosyst. Serv. 27, 272–280. doi: 10.1016/j.ecoser.2017.07.010
Soille, P., and Vogt, P. (2009). Morphological segmentation of binary patterns. Pattern Recogn. Lett. 30, 456–459. doi: 10.1016/j.patrec.2008.10.015
Su, Y., Chen, X., Liao, J., Zhang, H., Wang, C., Ye, Y., et al. (2016). Modeling the optimal ecological security pattern for guiding the urban constructed land expansions. Urban For. Urban Green. 19, 35–46. doi: 10.1016/j.ufug.2016.06.013
Sun, X., Jiang, Z., Liu, F., and Zhang, D. (2019). Monitoring spatio-temporal dynamics of habitat quality in Nansihu Lake basin, eastern China, from 1980 to 2015. Ecol. Indic. 102, 716–723. doi: 10.1016/j.ecolind.2019.03.041
Tang, F., Zhou, X., Wang, L., Zhang, Y., Fu, M., and Zhang, P. (2021). Linking ecosystem service and MSPA to construct landscape ecological network of the huaiyang section of the grand canal. Land 10:919. doi: 10.3390/land10090919
Wang, S., Liu, X., Wu, P., Feng, K., and Sun, L. (2019). Impacts of urban expansion on terrestrial carbon storage in china. Environ. Sci. Technol. 53, 6834–6844. doi: 10.1021/acs.est.9b00103
Wang, Y., and Pan, J. (2019). Building ecological security patterns based on ecosystem services value reconstruction in an arid inland basin: a case study in Ganzhou District, NW China. J. Clean. Prod. 241:118337. doi: 10.1016/j.jclepro.2019.118337
Weber, T., Sloan, A., and Wolf, J. (2006). Maryland’s green infrastructure assessment: development of a comprehensive approach to land conservation. Landsc. Urban Plann. 77, 94–110. doi: 10.1016/j.landurbplan.2005.02.002
Wyatt, K. H., Griffin, R., Guerry, A. D., Ruckelshaus, M., Fogarty, M., and Arkema, K. K. (2017). Habitat risk assessment for regional ocean planning in the U.S. Northeast and Mid-Atlantic. PLoS One 12:e0188776. doi: 10.1371/journal.pone.0188776
Xiao, L., Cui, L., Jiang, Q., Wang, M., Xu, L., and Yan, H. (2020). Spatial structure of a potential ecological network in Nanping, China, based on ecosystem service functions. Land 9:376. doi: 10.3390/land9100376
Xu, Q., Zheng, X., and Zheng, M. (2019). Do urban planning policies meet sustainable urbanization goals? A scenario-based study in Beijing, China. Sci. Total Environ. 670, 498–507. doi: 10.1016/j.scitotenv.2019.03.128
Yang, J., Wang, Y., Xiu, C., Xiao, X., Xia, J., and Jin, C. (2020). Optimizing local climate zones to mitigate urban heat island effect in human settlements. J. Clean. Prod. 275:123767. doi: 10.1016/j.jclepro.2020.123767
Yang, R., Bai, Z., and Shi, Z. (2021). Linking morphological spatial pattern analysis and circuit theory to identify ecological security pattern in the loess plateau: taking Shuozhou City as an example. Land 10:907. doi: 10.3390/land10090907
Yu, H., Huang, J., Ji, C., and Li, Z. (2021). Construction of a landscape ecological network for a large-scale energy and chemical industrial base: a case study of Ningdong, China. Land 10:344. doi: 10.3390/land10040344
Zhai, T., Wang, J., Fang, Y., Qin, Y., Huang, L., and Chen, Y. (2020). Assessing ecological risks caused by human activities in rapid urbanization coastal areas: towards an integrated approach to determining key areas of terrestrial-oceanic ecosystems preservation and restoration. Sci. Total Environ. 708:135153. doi: 10.1016/j.scitotenv.2019.135153
Keywords: ecological networks, MSPA, habitat risk, circuit theory, spatial range of ecological corridors, pinch points, barriers, Shandong Peninsula urban agglomerations
Citation: Zhai T and Huang L (2022) Linking MSPA and Circuit Theory to Identify the Spatial Range of Ecological Networks and Its Priority Areas for Conservation and Restoration in Urban Agglomeration. Front. Ecol. Evol. 10:828979. doi: 10.3389/fevo.2022.828979
Received: 04 December 2021; Accepted: 10 January 2022;
Published: 02 February 2022.
Edited by:
Fan Zhang, Institute of Geographic Sciences and Natural Resources Research, Chinese Academy of Sciences (CAS), ChinaReviewed by:
Shuyao Wu, Shandong University, ChinaDan Roesiemphrey Hu, Research Center for Eco-Environmental Sciences, Chinese Academy of Sciences (CAS), China
Gui Jin, China University of Geosciences Wuhan, China
Copyright © 2022 Zhai and Huang. This is an open-access article distributed under the terms of the Creative Commons Attribution License (CC BY). The use, distribution or reproduction in other forums is permitted, provided the original author(s) and the copyright owner(s) are credited and that the original publication in this journal is cited, in accordance with accepted academic practice. No use, distribution or reproduction is permitted which does not comply with these terms.
*Correspondence: Longyang Huang, aGx5QHdodS5lZHUuY24=