 Laura Poitou1Mathieu Laparie1Sylvain Pincebourde2Jérôme Rousselet1Christelle Suppo2†Christelle Robinet1*†
- 1INRAE, URZF, Orléans, France
- 2Institut de Recherche sur la Biologie de l’Insecte, UMR 7261, CNRS-Université de Tours, Tours, France
Climate change profoundly alters the phenology of insects, yet the mechanisms at play remain particularly elusive for univoltine species. Those species typically have to deal with contrasting thermal conditions across their development and life stages occurring at different seasons may have different thermal sensitivity. A modeling framework taking into account stage-specific thermal biology is lacking to predict the effect of climate change on the phenology of such species. Insect development rate scales non-linearly with temperature. This can be described with a thermal performance curve within each developmental stage, enabling higher accuracy near developmental thresholds than linear degree-day models. This approach, however, requires ample data to be correctly estimated. We developed a phenological model based on stage-specific performance curves to predict the phenology of a univoltine species undergoing uninterrupted larval development from summer to next spring, the pine processionary moth (Thaumetopoea pityocampa). This gregarious species is an important pine defoliator and is known to readily respond to climate change with a consistent and sustained range expansion/shift since the 1990s, as winter warming facilitates its survival in previously unsuitable areas. First, we determined the thermal performance curve of development rate for each stage from the egg to the fourth larval instar by monitoring molting in larval colonies exposed to fluctuating thermal treatments in controlled conditions. Second, we developed a phenology model to simulate the cumulated development rate across successive life stages, using observation data of adult flights and daily mean temperatures as input variables. A good fit was found between predictions and observations. Finally, the model was used to explore phenological consequences of hypothetical climate variations. With a simulated increase of temperature by 3°C, the model successfully predicted atypical ends of larval development before winter, which are being observed in nature in some regions or during years with autumnal heatwaves. With a simulated heatwave, carry-over effect on life stages development were predicted. On this winter-active species, we illustrate how variations in development rate caused by climate variations in early development can feedback into subsequent stages typically developing slowly in the cold season.
Introduction
Climate change can profoundly alter the phenology of ectotherms. There is growing evidence of insect cycles being advanced or delayed by warming across all regions of the globe. For instance, first flights of two multivoltine butterfly species, Atalopedes campestris (Lepidoptera: Hesperiidae) and Vanessa atalanta (Lepidoptera: Nymphalidae), in North America occur about one month earlier nowadays than they did three decades ago (Forister and Shapiro, 2003). Similar shifts of the same magnitude have also been observed in other parts of the world, including delays, e.g., in the dragonfly Orthetrum albistylum speciosum (Odonata: Libellulidae) in Japan (Doi, 2008). In multivoltine species, such changes can result in additional generations within a year [e.g., Cydia pomonella (Lepidoptera: Tortricidae) and Ips typographus (Coleoptera: Scolytidae) in Northern Europe (Lange et al., 2006; Stoeckli et al., 2012), Hyphantria cunea (Lepidoptera: Arctiidae) in Japan (Lange et al., 2006; Gomi et al., 2007)], which may directly result from changes in the thermal regimes and their impact on physiological and biochemical rates (Hughes, 2000; Deutsch et al., 2008; Glazaczow et al., 2016). The occurrence and consequences of phenological shifts may increase in complexity in univoltine species whose unique cycle can span several seasons and/or depend on the synchrony with other factors. Life stages can be exposed to different environmental conditions because they often occur in different seasons and can live in different (micro) habitats. In Manduca sexta (Lepidoptera: Sphingidae), developmental rates and thermal tolerance vary among eggs, larvae and pupae because of different microclimatic conditions experienced by each stage (Kingsolver et al., 2011). Temperatures higher than 32°C are lethal to eggs of this species while they improve development success and survival of larvae (Kingsolver et al., 2011). In the bog fritillary butterfly, Boloria Eunomia (Lepidoptera: Nymphalidae), the survival of eggs and pupae is positively correlated to temperature, but the survival of overwintering larvae is negatively affected by temperature (Radchuk et al., 2013). Phenology is one of multiple adaptable and/or plastic life traits, ranging from physiological to behavioral levels, that may modulate the ability of some insect species to thrive in different climatic regions or track climate change (van Asch et al., 2007; Chuine, 2010). The understanding of the effects of climatic variations on species phenology, including the underlying physiological or developmental mechanisms, is essential to predict responses of insects to climate change (van Asch et al., 2007; Forrest and Miller-Rushing, 2010; Damos and Savopoulou-Soultani, 2012; Khelifa et al., 2019).
The phenology of a species reflects the integrated response of the multiple life stages to their environment. Increasing temperatures typically accelerate development in ectotherms (Quinn, 2017). Based on thermal performance curves (Sinclair et al., 2016), development rate is determined by three thermal thresholds: the Minimum Critical Temperature (CTmin), the Maximal Critical Temperature (CTmax) and the Optimum Temperature (Topt). These thresholds determine the range within which development is possible (Paaijmans et al., 2013). At temperatures near CTmin, development rate is close to zero, and most arthropods can survive with paused ontogeny for prolonged durations in this state (Wagner et al., 1991). Above CTmin, development rate increases linearly to a maximum rate obtained at Topt and then decreases rapidly to CTmax (Wagner et al., 1984; Sinclair et al., 2016; Rebaudo and Rabhi, 2018), at which development rate drops to zero again and survival decreases.
Thermal performance curves are best approached with non-linear models, but those usually differ between life stages (Mujica et al., 2017) due to the stage-specific thermal biology of many species (Stevens, 2004; Briscoe et al., 2012). Cubic and quadratic equations are largely used in such non-linear models, but they underestimate development rate at Topt (Wagner et al., 1984), whereas the reliability of logistic simulations quickly drops when overreaching Topt because of their asymptotic nature that fails to mimic the decreasing insect performance beyond Topt (Wagner et al., 1991).
A given life stage can be influenced by its direct environment and indirectly influenced by the conditions experienced by previous life stages, the latter being known as a carry-over effect (Briscoe et al., 2012; Helle et al., 2012). Carry-over effects of thermal history on life traits have been reported in many taxa, with particularly widespread evidence of pre-imaginal thermal experience influencing adult life traits. For instance, in the hoverfly Eristalis arbustorum (Diptera: Syrphidae), the thermal experience of pupae affects adult life traits such as the size and shape of wings, thorax and abdomen, as well as abdominal coloration. Similar observations are also frequent in Lepidoptera, with for instance a negative effect of heat during pupation of the speckled wood butterfly Pararge aegeria (Lepidoptera: Nymphalidae) on the mass of the adult head, and consequences on sense organs, feeding structures and overall center of mass (impact on flight) (Stevens, 2004). Thermal experience during earlier stages may also alter adult performance, in many insect species, as shown in the last larval instar of damselfly Ischnura elegans (Odonata: Coenagrionidae) with carry-over effects of heatwaves onto the size and shape of wings, and ultimately, fight ability (Arambourou et al., 2017). While the heatwaves accelerated larval development, they resulted in a decrease of adult body and wing sizes, which was found to decrease the ability to sustain long duration flights in males (Arambourou et al., 2017). Profound thermal carry-over effects are ubiquitous in insects and presumably play a prominent role in one of the most generic and recognized patterns of phenotypic plasticity known in ectotherms, the temperature-size rule (Atkinson, 1994).
How carry-over effects interact with phenology is less documented. In M. sexta (Lepidoptera: Sphingidae), the temperature experienced by eggs was found to influence pupation time (Potter et al., 2013). However, evidence is still mostly lacking despite the central role of phenology in insect ecology and its sensitivity to climate change. Developing modeling frameworks on species impacted by climate change permits to predict how thermal changes influence the overall development when life stages differ in their thermal sensitivity. In common brown butterfly, Heteronympha merope merope (Lepidoptera: Nymphalidae), simulations of a larval thermal responses model demonstrated the effect of oviposition date on the duration of each stage (Briscoe et al., 2012). Most important effects were observed for early and later stages. Response of the species to climate change can be affected by a non-additive effect on phenology due to thermal physiology differences across life-stages (Briscoe et al., 2012). We integrated into a phenological model the thermal performance curves for development rate from the egg to the last larval stage in a year-round active univoltine insect, thereby providing ground for stage-specific thermal preferences, in order to predict the overall developmental consequences of climate variability.
The Pine Processionary Moth (PPM), Thaumetopoea pityocampa (Lepidoptera: Notodontidae), is an important forest pest in Europe. This species is typically univoltine: short lived females lay eggs in summer, and larvae generally develop from mid- or end of summer throughout the cold season to complete larval development in spring. This insect is widely recognized as a model species to study the impacts of climate change, mainly due to its well known distribution shift. Indeed, its range expansion toward higher latitudes and altitudes was shown to respond quickly to winter warming despite only one generation per year (Battisti et al., 2005; Robinet et al., 2014). While animal phenology has long been solely regarded as a by-product of thermal conditions, evidence are now accumulating suggesting that phenology itself can be the result of evolutionary processes to better mitigate environmental conditions, or even an adaptive response to avoid environmental stressors (van Asch et al., 2007; Renner and Zohner, 2018). This is also suggested in the PPM by the existence of phenological variations across its range (Abgrall, 2001; Martin and Brinquin, 2012) that, without taking stage-specific vulnerabilities into account, may appear counter-intuitive (Robinet et al., 2015). Consequently, until the development of each pre-imaginal stage is better understood, its response in time to climate change will remain difficult to dissociate from its response in space. Yet, an increasing phenological variability is being reported since the last two decades in some regions, with larval development shortened to the point that pupation processions (which mark the end of larval feeding) can occasionally occur as early as autumn, instead of spring. In those regions, atypical earlier processions (before winter) and typical processions (spring) often co-occur.
The understanding of PPM phenological variations relative to climate variability is a scientific challenge that also has ecological applications. Populations of the PPM are usually managed because of the impact of defoliation on the growth of host trees (Vega et al., 2011; Parlak et al., 2019), and because of the ability of late instar larvae to disseminate urticating setae in the air, particularly when they leave their silken nests in long processions to seek a suitable pupation soil. As this species is abundant from natural to rural and urban areas, this poses a sanitary threat (from dermatitis to more systemic allergic reactions) to humans, livestock and pets in regions where increasing phenological variability and associated extended procession period are increasingly being observed. The efficiency of most control methods is stage-dependent and requires adequate planning. Bacillus thuringensis spraying yields best results on young larvae, while collar interception traps target only the last instar larvae when they leave their host tree to pupate in the soil. The development of a stage-specific phenological model is therefore crucial not only to understand the responses in space and time of the PPM to climate change, but also to optimize adequate planning of control methods, and to warn citizens and local actors about urtication hazards.
We determined how climate variability influences the development of the PPM by assessing the development time of each life stage in different thermal conditions (direct and carry-over effects). Our approach was to develop a phenological model to predict the development time of successive life stages up to the end of the larval development. First, we determined experimentally the thermal performance curves for development rate in each life stage from the egg to the fourth larval stage (L4). Second, we parameterized the phenological model using the corresponding life stage-specific thermal performance curves (Figure 1). We could not monitor L5 development rate in controlled conditions due to cumulated mortality and because this stage ends with a behavioral event (the pupation procession) that cannot reliably be reproduced in controlled conditions. We used the same parameters as for L4 because those stages typically develop during the same season and the available literature shows that they have the same development rate (Devkota and Schmidt, 1990; Martin, 2005; Berardi et al., 2015). The model was validated by comparing its predictions to field observations of larval instar proportions, and this was repeated over time throughout larval development in nature. Third, the model was used to simulate the impact of different warming/cooling amplitudes on development time to quantify final changes in the timing of pupation processions. Finally, a simulation of a heatwave was made to test whether phenological carry-over effects can occur in this species and contribute to explaining recent reports of atypical early processions.
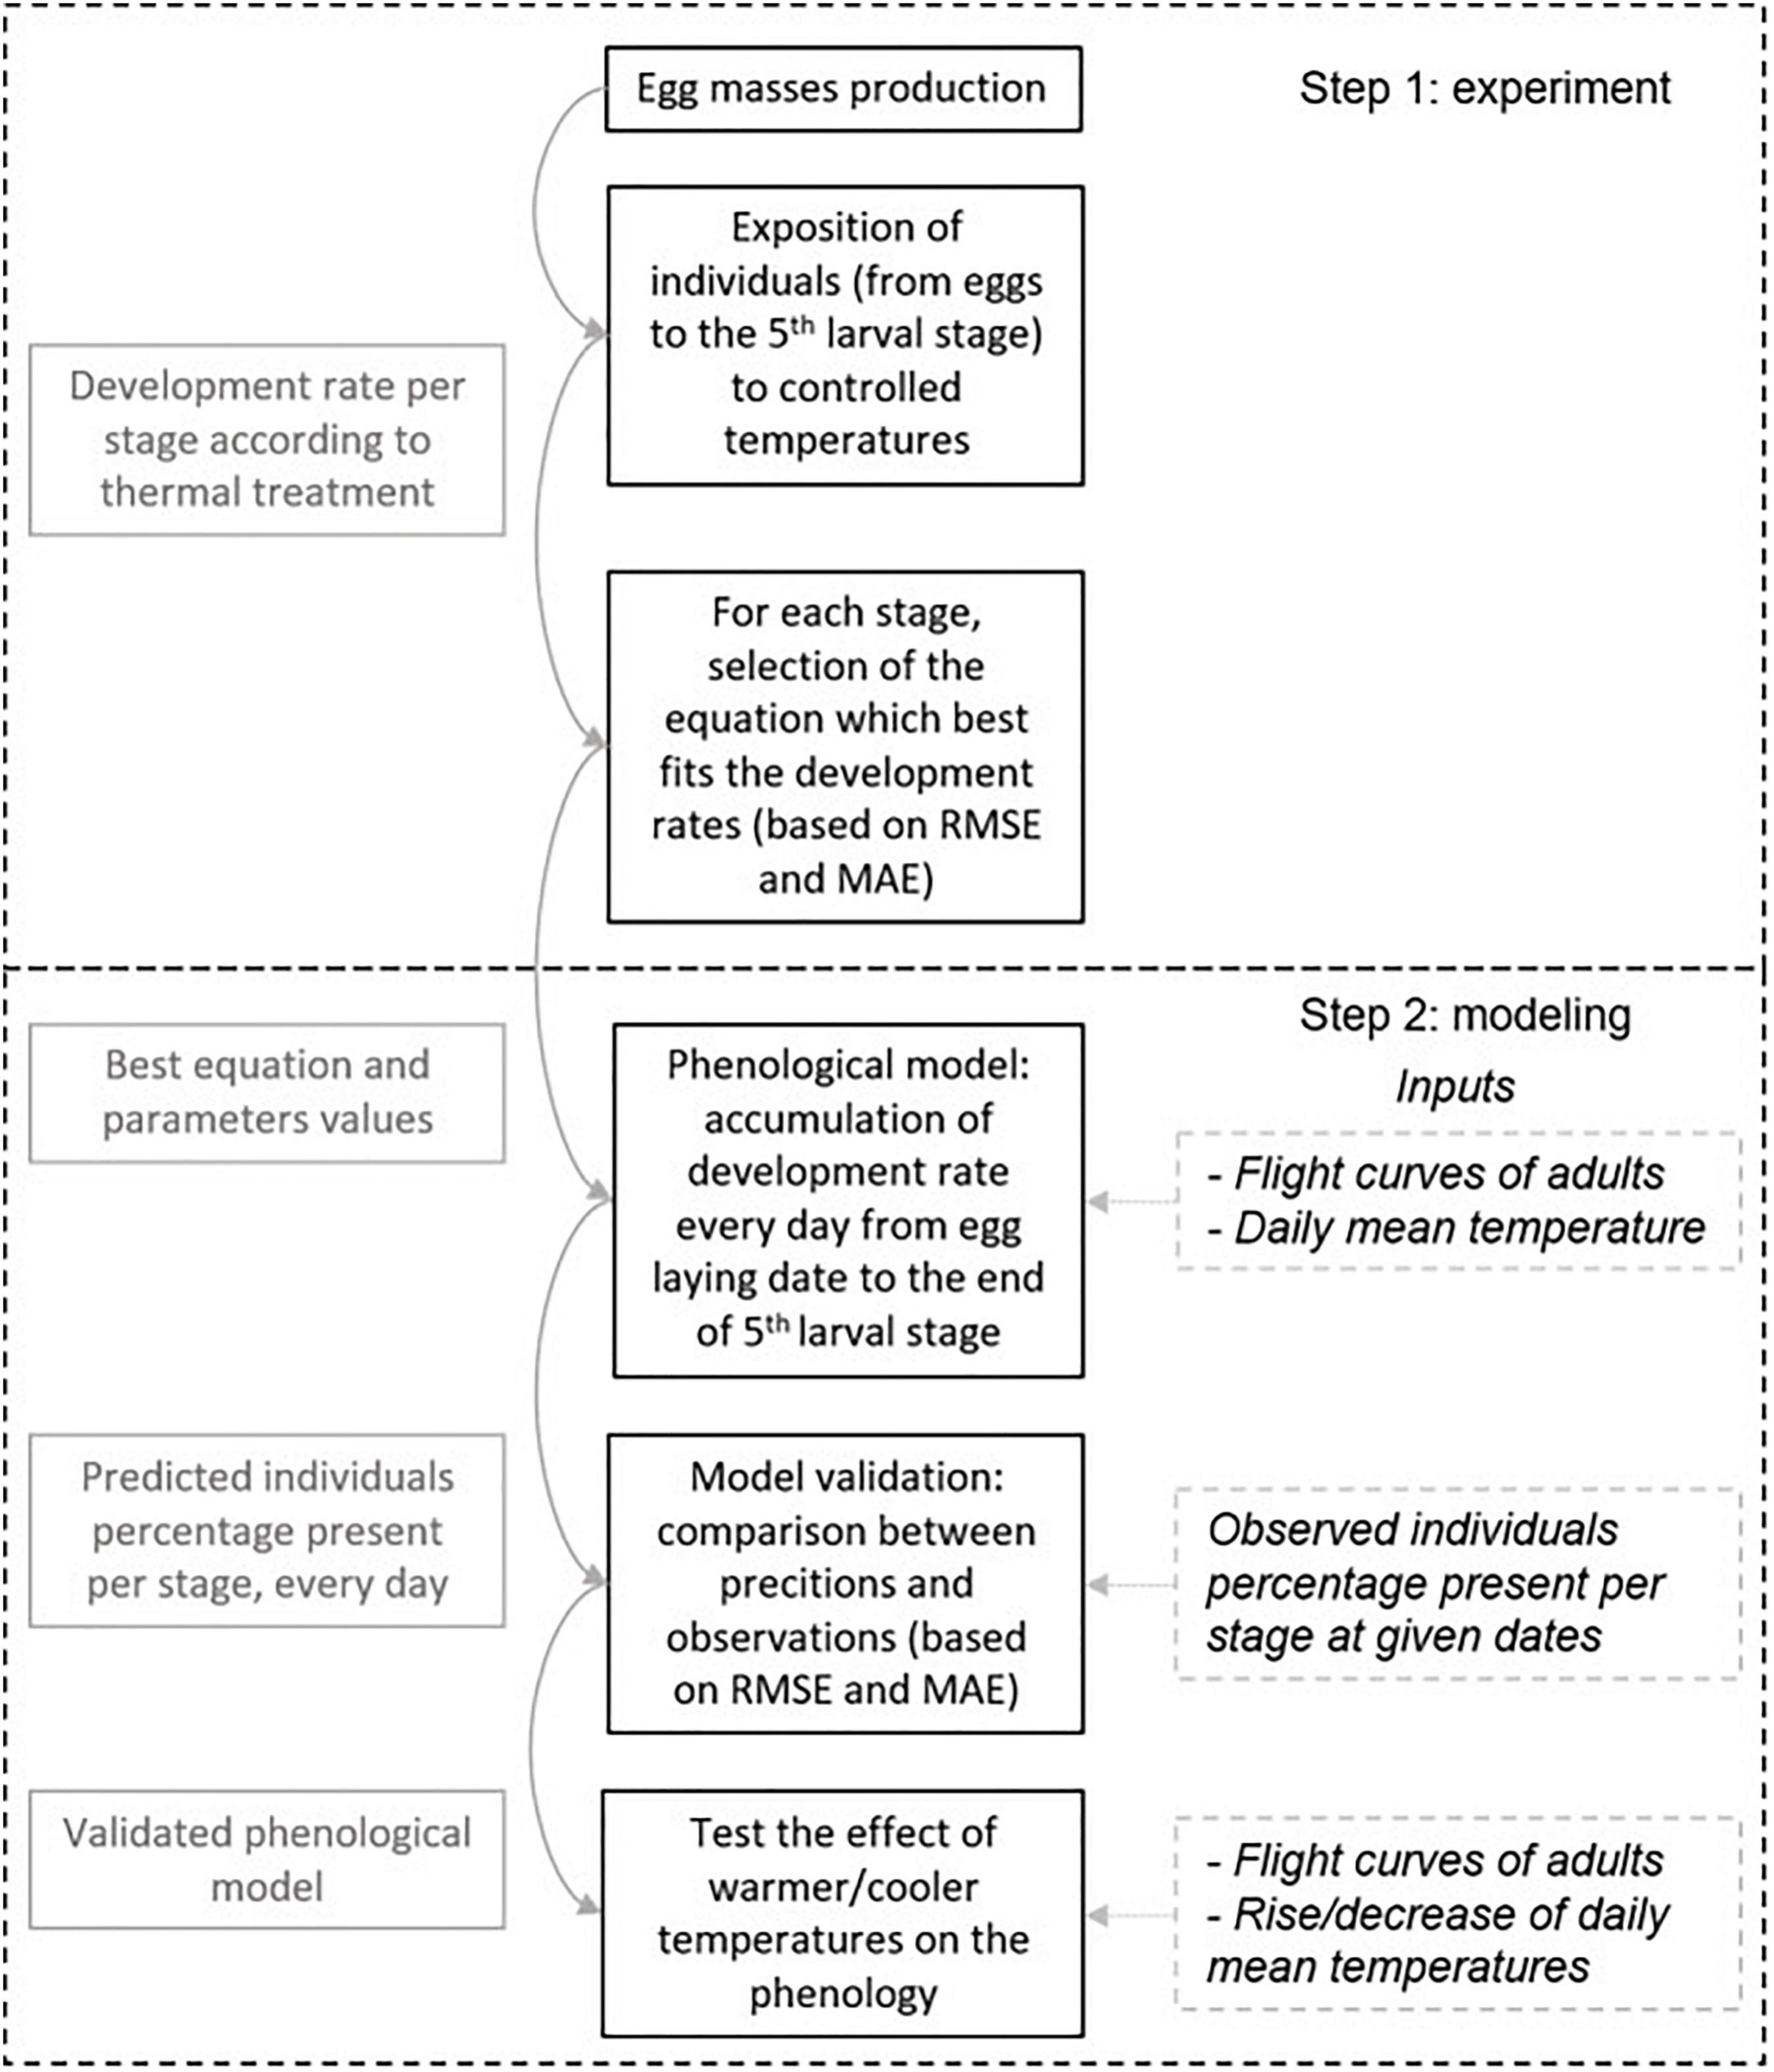
Figure 1. Approach description. Solid black boxes represent the main steps of the approach. Solid gray boxes indicate that the results of one step are used in the following. Dashed gray boxes are model inputs.
Materials and Methods
Study Species Life Cycle
In France, PPM adult emergence generally spans from June to September and is immediately followed by egg laying due to the short lifespan of adults (2–3 days) (Zhang and Paiva, 1998; Abgrall, 2001; Battisti et al., 2015). Eggs hatch between 30 and 45 days later, depending on climatic conditions (Martin, 2005). Then, larvae undergo five larval instars (L1–L5). They are gregarious and weave silk where they gather. Young larvae first build up temporary silken nests as they move to forage on the tree during the first weeks, and then settle in a final permanent winter nest when first cold snaps occur, which can be maintained by a colony of hundreds of larvae until the end of larval development (Huchon and Démolin, 1970). The production of silk, the length and diameter of the abdomen and the width of the head capsule can be used to distinguish larval stages (Martin, 2005). At the end of larval development, larvae show a particular behavior when they leave their winter nest in a head-to-tail procession to seek a suitable pupation site in the soil.
Most pupation processions occur from January to April in French populations, depending on the region considered. Strong variations are observed among bioclimatic regions (Abgrall, 2001; Martin and Brinquin, 2012), with early processions that can occur before winter (e.g., in Ré Island, possibly due to the mild local climate) or as late as June (high elevation mountainous areas) (Abgrall, 2001; Battisti et al., 2015). Atypical processions from November to April are now observed in different areas some years. The duration between hatching and procession fluctuates among years and locations (Abgrall, 2001; Bonsignore et al., 2019). After pupation, individuals enter into a mandatory diapause for several weeks until metamorphosis and emergence in the following summer, or prolonged from one year up to at least eight years (Salman et al., 2016) depending on a mix of genetic and environmental factors [such as winter temperature, population density, food availability (Salman et al., 2018)]. According to latitude and elevation, the duration of the mandatory diapause varies between one month (high latitude and elevation) and 5 months (low latitude and elevation) (Salman et al., 2019a). The mechanisms governing the regulation of this mandatory diapause are still poorly understood, but this phase has been hypothesized as a way to resynchronize adult emergence in spite of larval phenological variations (Huchon and Démolin, 1970; Battisti et al., 2015).
In this study, we focus on individual development from the egg to the fifth larval instar. Pupal development until metamorphosis and emergence was not considered because (1) thermal performance curves cannot be used to describe the complex diapause mechanisms and flexible duration of this phase, and (2) because emergence date is a known input of the model thanks to insect trapping and immediate egg laying.
Development Rate Experiment
Production of Eggs
Eggs of known age and from healthy clutches (e.g., deprived of parasitoids) are necessary to assess the development rate of eggs. Eggs were thus produced in semi-natural conditions under a shelter, from individuals of the previous generation caught in the field during their procession (Saran, 41.946371°N, 1.876850°E). To collect those individuals during their processions, we used ten collar traps (Ecopiège)tm wrapped around distinct tree trunks with collection bags containing substrate. From 29 October 2018 to 3 June 2019, trap bags were collected every 2 weeks. Larvae and prepupae inside those bags were counted and put in vermiculite trays until they developed into adults. Distinct boxes were used for different sampling dates and traps. When emerging, adults were split into two different mating methods to mitigate the risk of mating failure in experimental conditions. The first method consisted in placing 17 open boxes (with a total of 5428 pupae, of which 2729 emerged) in a single, large rearing cage (180 cm × 180 cm × 180 cm) where they were left to mate after emergence. In the second method, 23 open boxes (with a total of 2416 pupae, of which 522 emerged) were placed individually in smaller rearing cages (30 cm × 30 cm × 30 cm). From 24 June 2019 to 31 August 2019, emerging adults were counted every day except during week-ends. Newly emerged adults were allowed to mate in their original setting (large cage vs. small cages), but were then transferred every morning to another cage (40 cm × 40 cm × 60 cm) containing multiple egg-laying supports (wooden skewer sticks, toothpicks, fresh pine branches, and laboratory paper strips). Newly laid egg masses were collected daily and placed in glass tubes capped with a cotton ball, then transferred to climatic chambers for development.
Developmental Time of Eggs and Larvae
Larval molting was monitored under different conditions of fluctuating temperatures to estimate the development rate of each life stage. Fluctuating treatments consisted in a daily succession of four 6-h phases: constant maximal Temperature (Tmax), decreasing ramp to Tmin, constant minimal Temperature (Tmin), and increasing ramp to Tmax (Figure 2). Eight treatments were designed (Tmin/Tmax: 10/20, 14/24, 18/24, 19/29, 23/33, 25/35, 27/37, and 30/40°C; hereafter referred to by their respective average temperatures T15, T19, T21, T24, T28, T30, T32, and T35) in eight climatic chambers (Galli G-TEST and PHCbi MIR-254-PE, ±0.5°C), of which six were applied to eggs and seven to larvae (Figure 2). Tmin and Tmax differed by 10°C in all conditions but one (T21 for eggs), which corresponded to a climatic chamber incorrectly configured at the beginning of the experiment, and later corrected into T24 for larval cultures. Each climatic chamber contained three opaque white boxes (39 cm × 39 cm × 25 cm) covered by a filter paper lid to diffuse artificial light, allow ventilation and limit the dissemination of urticating hairs starting from L3. Each box was positioned five centimeters under a set of three LED spots (Lédis, 3.5W, 300 lumens, 4500K) set to a photoperiod of 14:10 (L:D) (Figure 2). The beginning and the end of the light phase were made gradually using only one LED spot for 30 min, then two spots for another 30 min, then the three spots for 12 h, and the other way around during the last hour of the light phase to mimic sunrise and sunset. The photoperiod was reversed (light during nightime and dark during daytime) to observe larvae during business hours while they were in their active (nocturnal) phase, which eased distinguishing active versus dying larvae.
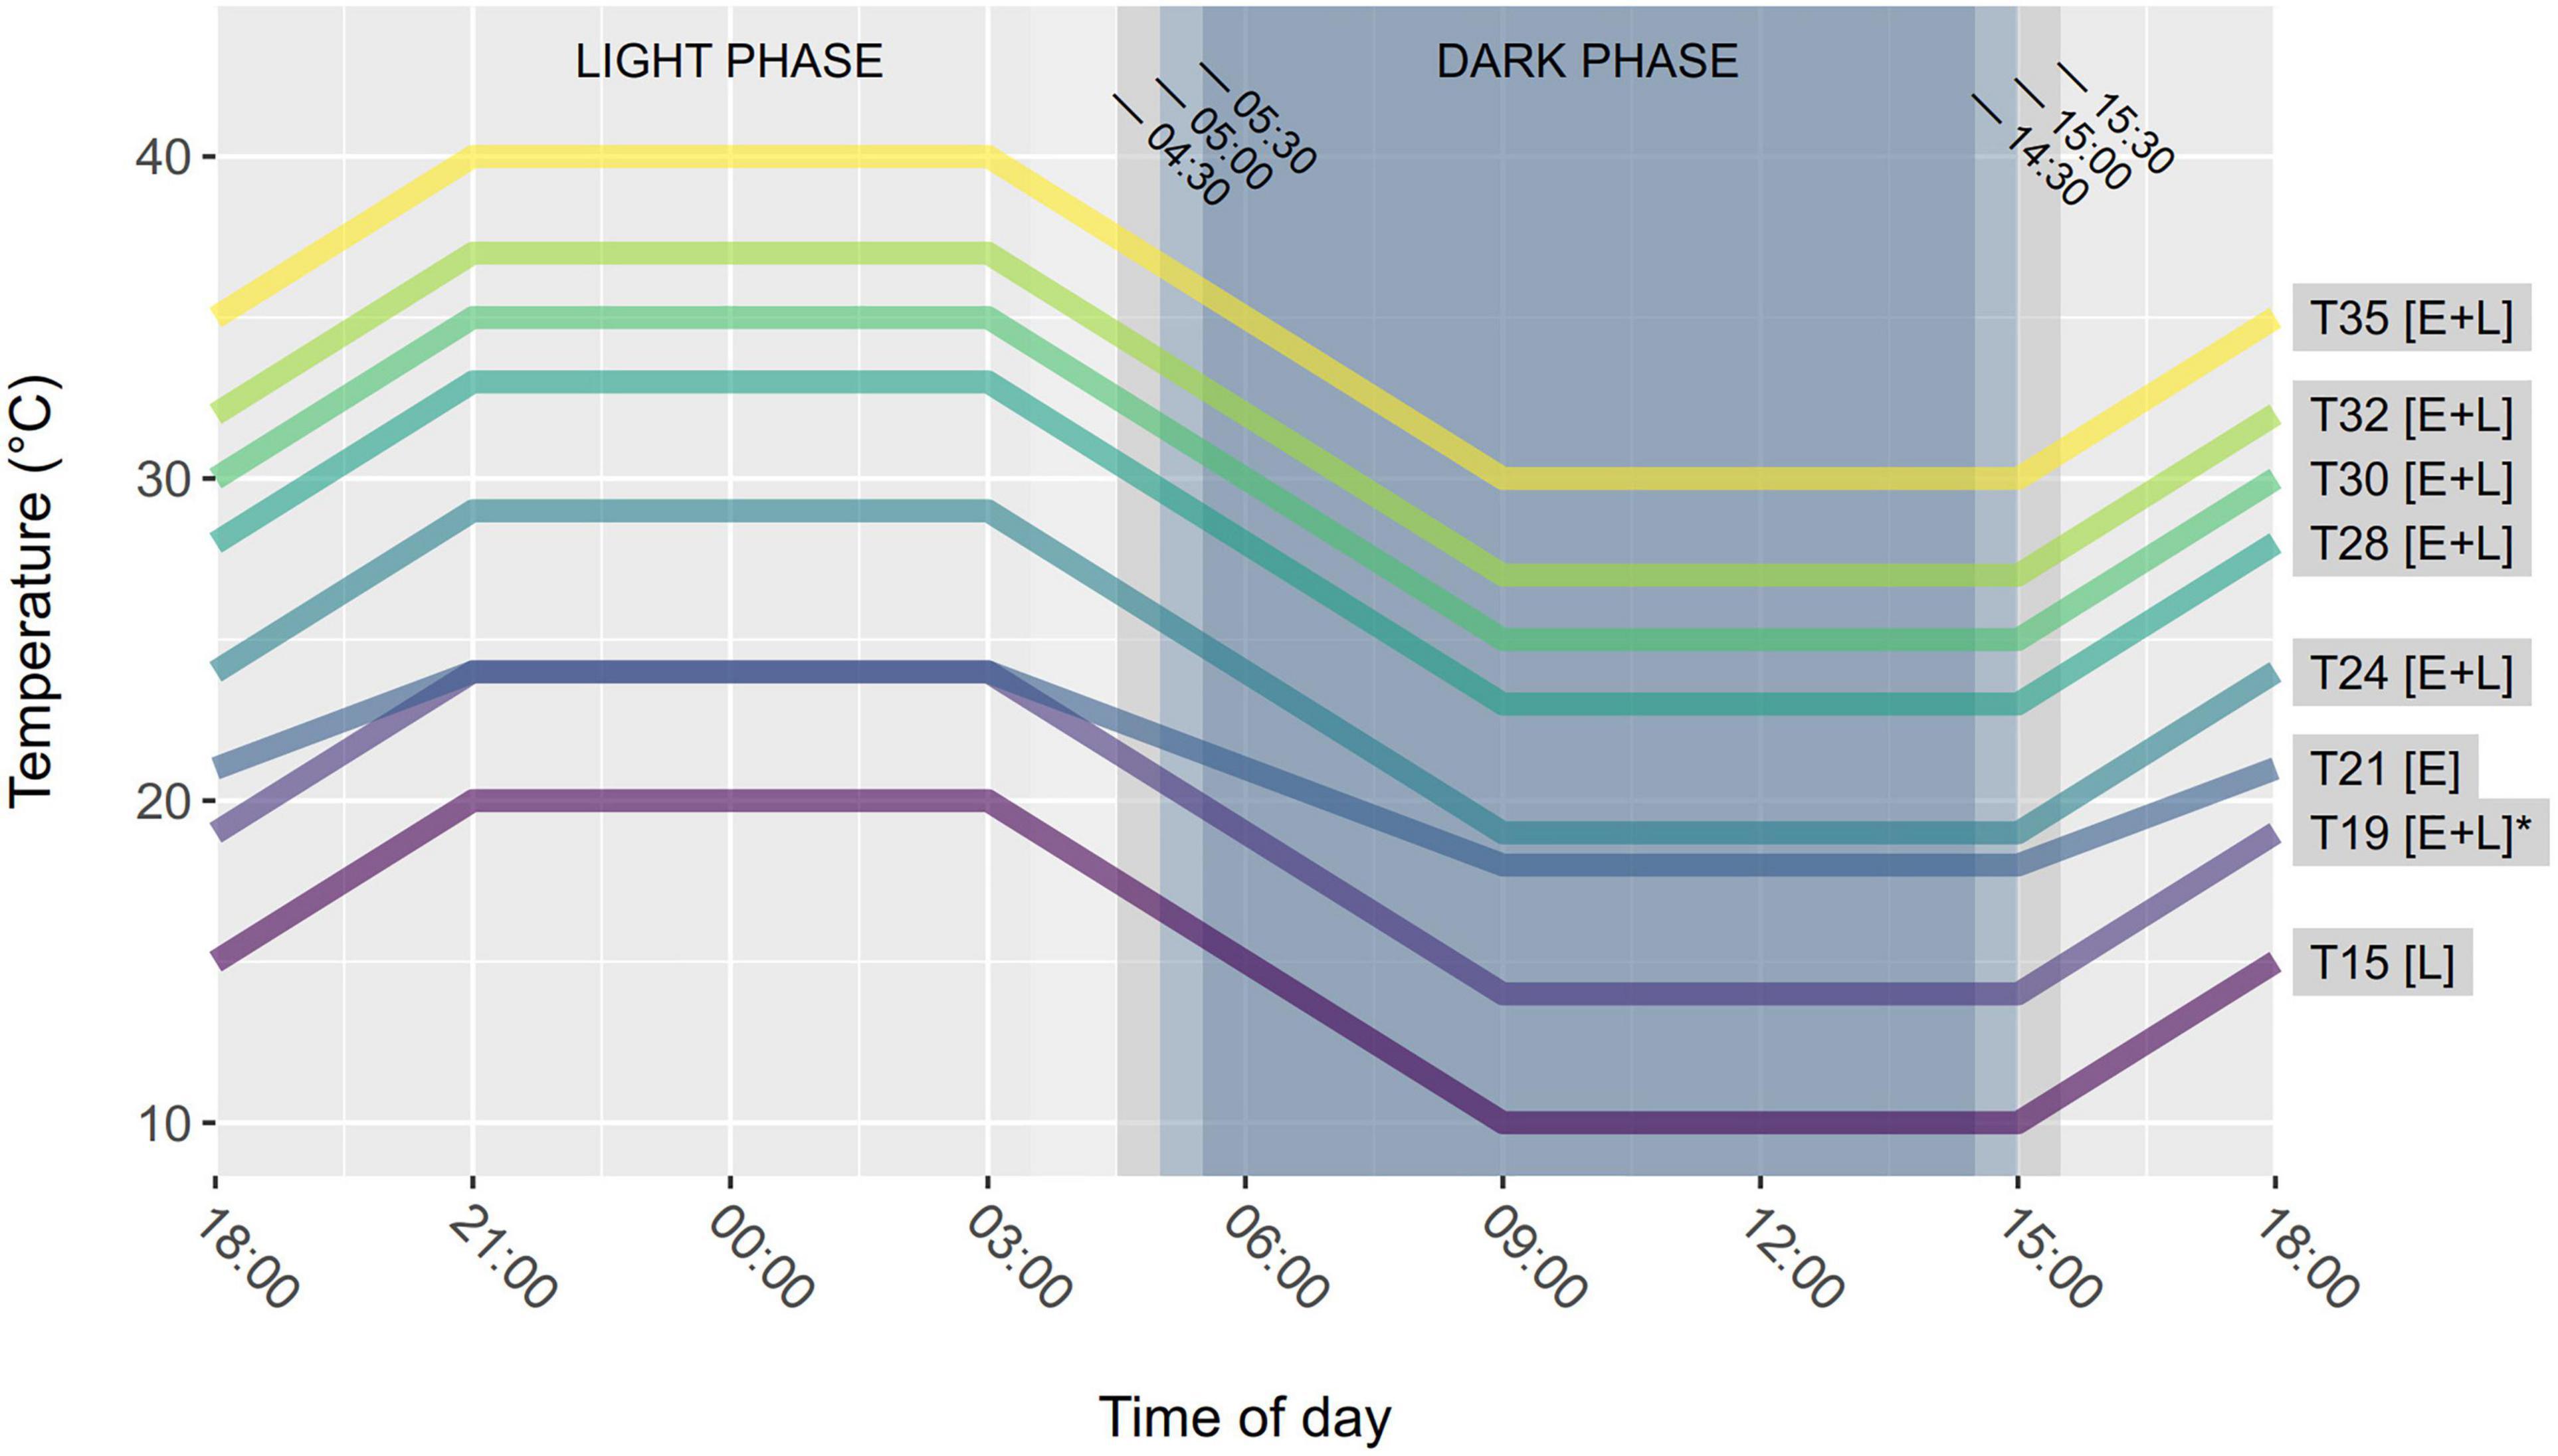
Figure 2. Thermal fluctuations and photoperiod used in each rearing treatment. Transitions between light and dark phases were progressive (30 min with 1/3 of the light source, 30 min with 2/3 of the light source, 9 h with full light). Treatments are named after their average temperature over a 24-h fluctuation cycle. Letters between square brackets indicate whether eggs (E) or larvae (L) were reared in a treatment. T19 is marked with an asterisk because all larvae reared in other treatments originated eggs hatched at T19.
To determine the developmental time of eggs, egg masses kept in glass tubes were randomly assigned to one of six thermal treatments (Figure 2) and distributed into the corresponding opaque boxes. We placed 21–25 egg masses in each treatment (more egg masses were placed in hotter treatments). After 3 weeks, two pine needles were inserted in each tube and renewed every other day to supply food in case of hatching. Hatching was followed three times a week, then every day after 3 weeks of experiment. Newly hatched larvae were counted and collected. During week-ends, close-focus cameras (1920 × 1080p) were used to monitor egg masses and determine hatching time in case hatched larvae would be observed the next Monday.
To determine the developmental time of L1, L2, L3, and L4, we established larval colonies from eggs that developed at T19, because this condition was found to result in the best hatching rate. Every day when newly hatched larvae were found, colonies were created by grouping 15 neonates per colony from the available tubes. Preliminary larval cultures indicated more consistent feeding and survival when the three-dimensional structure of a pine branch and needles was maintained, compared to branches supplied horizontally at the bottom of a container. We therefore used funnel-shaped containers made from plastic bottles, which could hold a vertical pine twig watered from a separate tank (Figure 3). For each thermal treatment, 12 containers (excepted for T19 which had seven more) containing one colony each were transferred to the opaque boxes in the climatic chambers. While five treatments were identical to those used on eggs, the erroneous T21 was changed into T24, and a cooler T15 treatment was added because of its relevance for larvae developing in autumn and winter (Figure 2). In total, 91 colonies were constituted in 15 days, and all seven treatments were equally populated over time. Three colonies (two in T15 and one in T28) were discarded from the analysis because they mistakenly contained 16 larvae initially instead of 15.
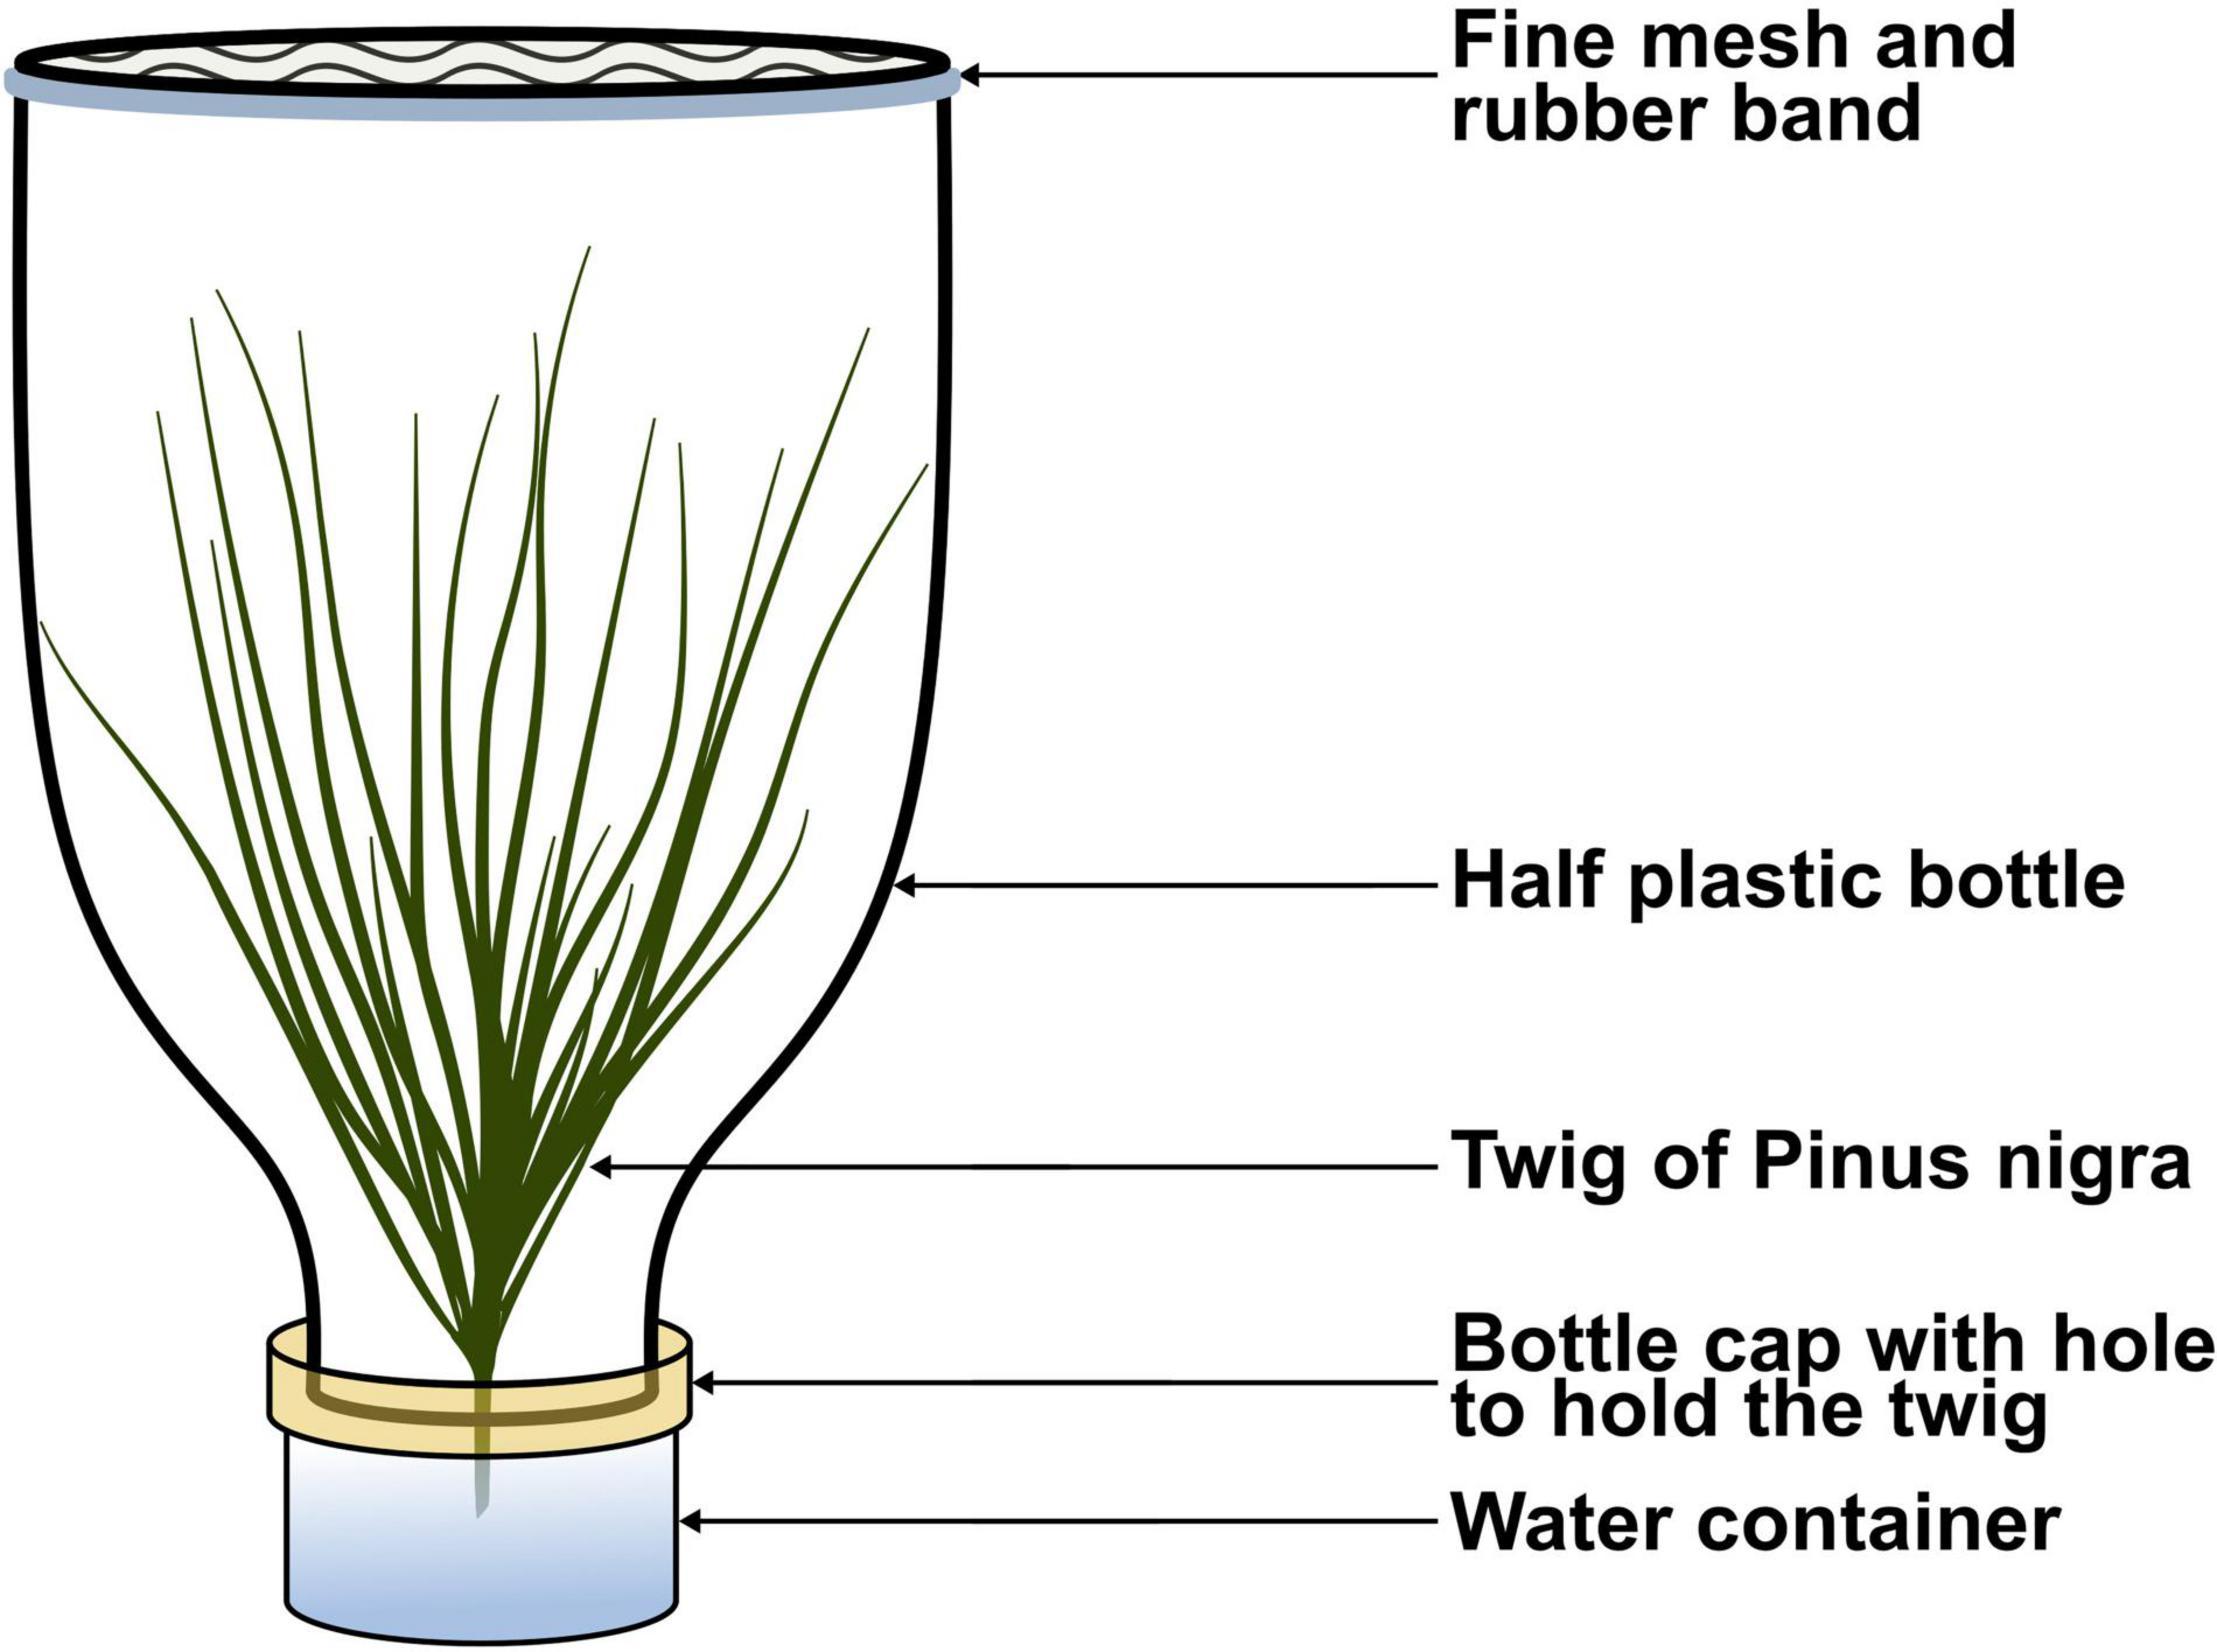
Figure 3. Custom made container for larval development. “Pine leaf” icon by António Ascensão, from thenounproject.com.
Pine twigs and water were renewed every two days when monitoring larval molting and survival. Dead larvae were removed immediately and containers were replaced and cleansed regularly to avoid mold development. The same individuals were followed from the egg stage to the last larval instar from July to December 2019. Due to cumulated mortality over the course of the experiment, sample sizes tended to decrease from one stage to another. Larval development was not completed because the last instar ends with the pupation procession, a behavior that we cannot ascertain would be reliably reproduced or even detected in laboratory conditions with artificial lighting, no tree, and small containers. This behavior is also associated with important health risks and contaminations (urtication) that could not be incurred in a general purpose laboratory. Likewise, cultures at T15 and T32 had to be stopped when all larvae reached L4 because the corresponding climatic chambers were not placed in a room suitable to mitigate the more limited urtication risks associated with this instar, as opposed to the other chambers.
Statistical Analyses
The effect of thermal treatment on stage development rate was tested using Kruskal-Wallis tests. A Benjamini-Hochberg correction was used to deal with false discovery rate (FDR) associated with consecutive tests. All tests were performed using R version 3.5.0 (R Core Team, 2020).
To define performance curves from the experiments. All calculations and analyses were done using R version 3.5.0 (R Core Team, 2020). For each thermal treatment, the mean date of stage changes were calculated per colony and the development time of each stage was considered as the difference between successive mean dates to then compute developmental rates. Subsequently, 37 non-linear equations from the literature [available in the DevRate R package (Rebaudo et al., 2018)] were fitted to development rates to determine the best fit for each stage. The devRateModel function was used to estimate parameters with the Non-linear Least Squares method (NLS method). This function requires initial values of parameters to be provided. DevRate and manipulate packages were used to obtain this set of initial parameter values and ensure that the estimation did not correspond to a local minimum for the least square method. To choose the best function, values of the Root Mean Square Error (RMSE) and Mean Absolute Error (MAE) were calculated. MAE is less impacted by outliers than RMSE. For each stage, the function with the minimal RMSE and MAE values was selected. We adjusted the above method for L3–L5 due to two issues. The first issue was that this method failed for L3 and L4 (unrealistic parameters estimation, such as optimum temperature equal to 516.9°C, for example). Therefore, for L3 and L4, we decided to re-use the same equation that was found to best fit data for egg, L1 and L2 (i.e., Taylor equation, see section “Results”). Then, we set two parameters (Tm, optimal temperature, and Rm, maximal development rate) directly based on the experimental data and used the maximum likelihood method to estimate the last one (To, spread of the curve). The second issue was that the number of individuals decreased progressively from one life stage to the other due to cumulated mortality. Furthermore, the fifth larval stage end with a specific behavior (procession) that is difficult to reproduce in controlled conditions. Thus, based on literature evidence that L4 and L5 share similar development rates, we selected the same function and same parameters for those stages (Devkota and Schmidt, 1990; Martin, 2005; Berardi et al., 2015).
Phenological Model: Development, Field Validation, and Applications
Model Development
A phenological model was developed to determine the development time of each PPM life stage, from the egg to the last larval instar (L5). This model consists in accumulating development rates by considering the stage-specific non-linear relationships between development rate and temperatures (Wagner et al., 1984; Mirhosseini et al., 2017; Rebaudo and Rabhi, 2018). The development rate (days–1) is defined as the inverse of the development time (days). The development times collected under the aforementioned thermal treatments were used to fit performance curves for each life stage (i.e., development rates as a function of temperatures experienced by individuals) (Figure 1).
The model initially considers the male flight curve (i.e., the number of males caught in pheromone traps as a function of time) as input to initialize the calculation of individual phenologies. Considering the short lifespan of adults (2–3 days), we assumed that males and females had roughly the same emergence time. Two days were added to adult emergence dates to estimate egg-laying dates, based on the delay we observed when experimentally producing egg masses. Subsequently, the model considered daily mean temperatures and the fitted performance curves to describe the development of each individual for each prepupal stage. The model consists in accumulating the development rate every day from the egg laying date. The development of a given stage is completed when the accumulation of development rate reaches one, then the same calculation is made for following larval stages. The beginning (first day of development of the first individual who reached the stage), the end (last day of development of the last individual who reached the stage) and the mean duration of each instar, as well as the percentage of individuals therein, were also calculated.
Model Validation Using Field Data
The accuracy of the phenological model was estimated based on an independent dataset (i.e., observation data not used for model construction). PPM phenology was monitored in Orléans (47.947°N, 1.870°E). Automatic pheromone traps (CapTrap)® were used to monitor daily male flights in summer 2019 (Supplementary Figure 1). Larval development was also monitored every 2 weeks in the field, from October 2019 to February 2020. Each time, 15 PPM nests were collected on Pinus nigra and the number of larvae per stage was determined in each nest from 60 randomly sampled larvae. This subsample size was determined after preliminary analyses in which all larvae inside the nests were counted, which showed that 60 larvae were enough to adequately assess the overall percentages without counting thousands of individuals per sampling date (Supplementary Protocol 1). The observed percentages of individuals per stage at given dates were available from L2 to L5. No observation data was recorded on L1 because of the fast development of this stage and the difficult detection of young colonies in the field when foliage damage and silk weaving are not conspicuous yet. This monitoring was part of a broader field survey (Poitou, 2021). Daily mean temperature in 2019–2020 was retrieved from the climatic station of Orléans (ID number 45234, 47.827°N, 1.909°E), which is part of the INRAE National Agroclimatic Network managed by the service unit AgroClim (Avignon, France) (Supplementary Figure 2).
The percentage of individuals per stage that was observed in the field was compared to model predictions for all dates at which observation data was available (8 dates). The RMSE and MAE were calculated to assess the goodness-of-fit of the model simulations to the observed data. Lower values correspond to better predictions. Predicted mean duration of each stage from egg to the end of L5 was compared to literature data.
Simulating the Effects of Temperature Change
To assess the magnitude of predicted phenological changes caused by higher or lower overall temperatures, we simulated an increase and a decrease of 1, 2, and 3°C on the daily mean air temperatures recorded in Orléans in 2019–2020 (Supplementary Figure 3). The seasonal pattern of daily mean air temperature was kept the same and the change in daily temperature was applied throughout days of the year. For each temperature change scenario, we calculated the development time of each stage and the procession timing (i.e., end of larval development).
To test the direct and carry-over effects of an automnal heatwave on phenology depending on egg laying timing, we used daily mean temperatures recorded in Orléans in 2019–2020 and simulated an increase of 10°C for each day from 7 October 2019 to 27 October 2019. The daily mean temperature during the simulated heatwave ranged from 18.5 to 28.8°C. We simulated the development of three egg laying cohorts that corresponded to the dates of the 10, 50, and 90% quantiles of previous generation adult captures (6 July 2019, 18 July 2019, and 4 August 2019, respectively). For each stage, the predicted accumulated development rate was calculated and compared to the development rate obtained with real daily mean temperature recorded in Orléans in 2019–2020.
Results
Mortality and Development Rates
Median development times decreased with increasing temperature until the optimal temperature, then increased slightly (Figure 4). In L1, mortality ranged from 25 to 94% and was the lowest at T15 and the highest at T35, with 75 and 6% of larvae reaching the next instar, respectively. Trends were not as clear in other stages, partly due to the decreasing sample size caused by earlier mortality (Figure 4). Median mortality was obtained mostly before median development time. Mortality was observed in all thermal treatments, but was the highest at T35. In T15, T19, T24, T28, T30, and T32, 86, 38, 29, 65, 43, and 42% of larvae reached L4, respectively (Figure 4). The number of larvae observed in L4 differed from the number of larvae which survived L3 because the experiment had to be stopped in two conditions due to urticating hairs associated with L4 (climatic chambers in rooms not adapted to mitigate contamination risks). When the number of molted larvae at one stage does not match the total number of larvae in the following stage (Figure 4), the difference is due to subsamples sacrificed for another experiment (not shown).
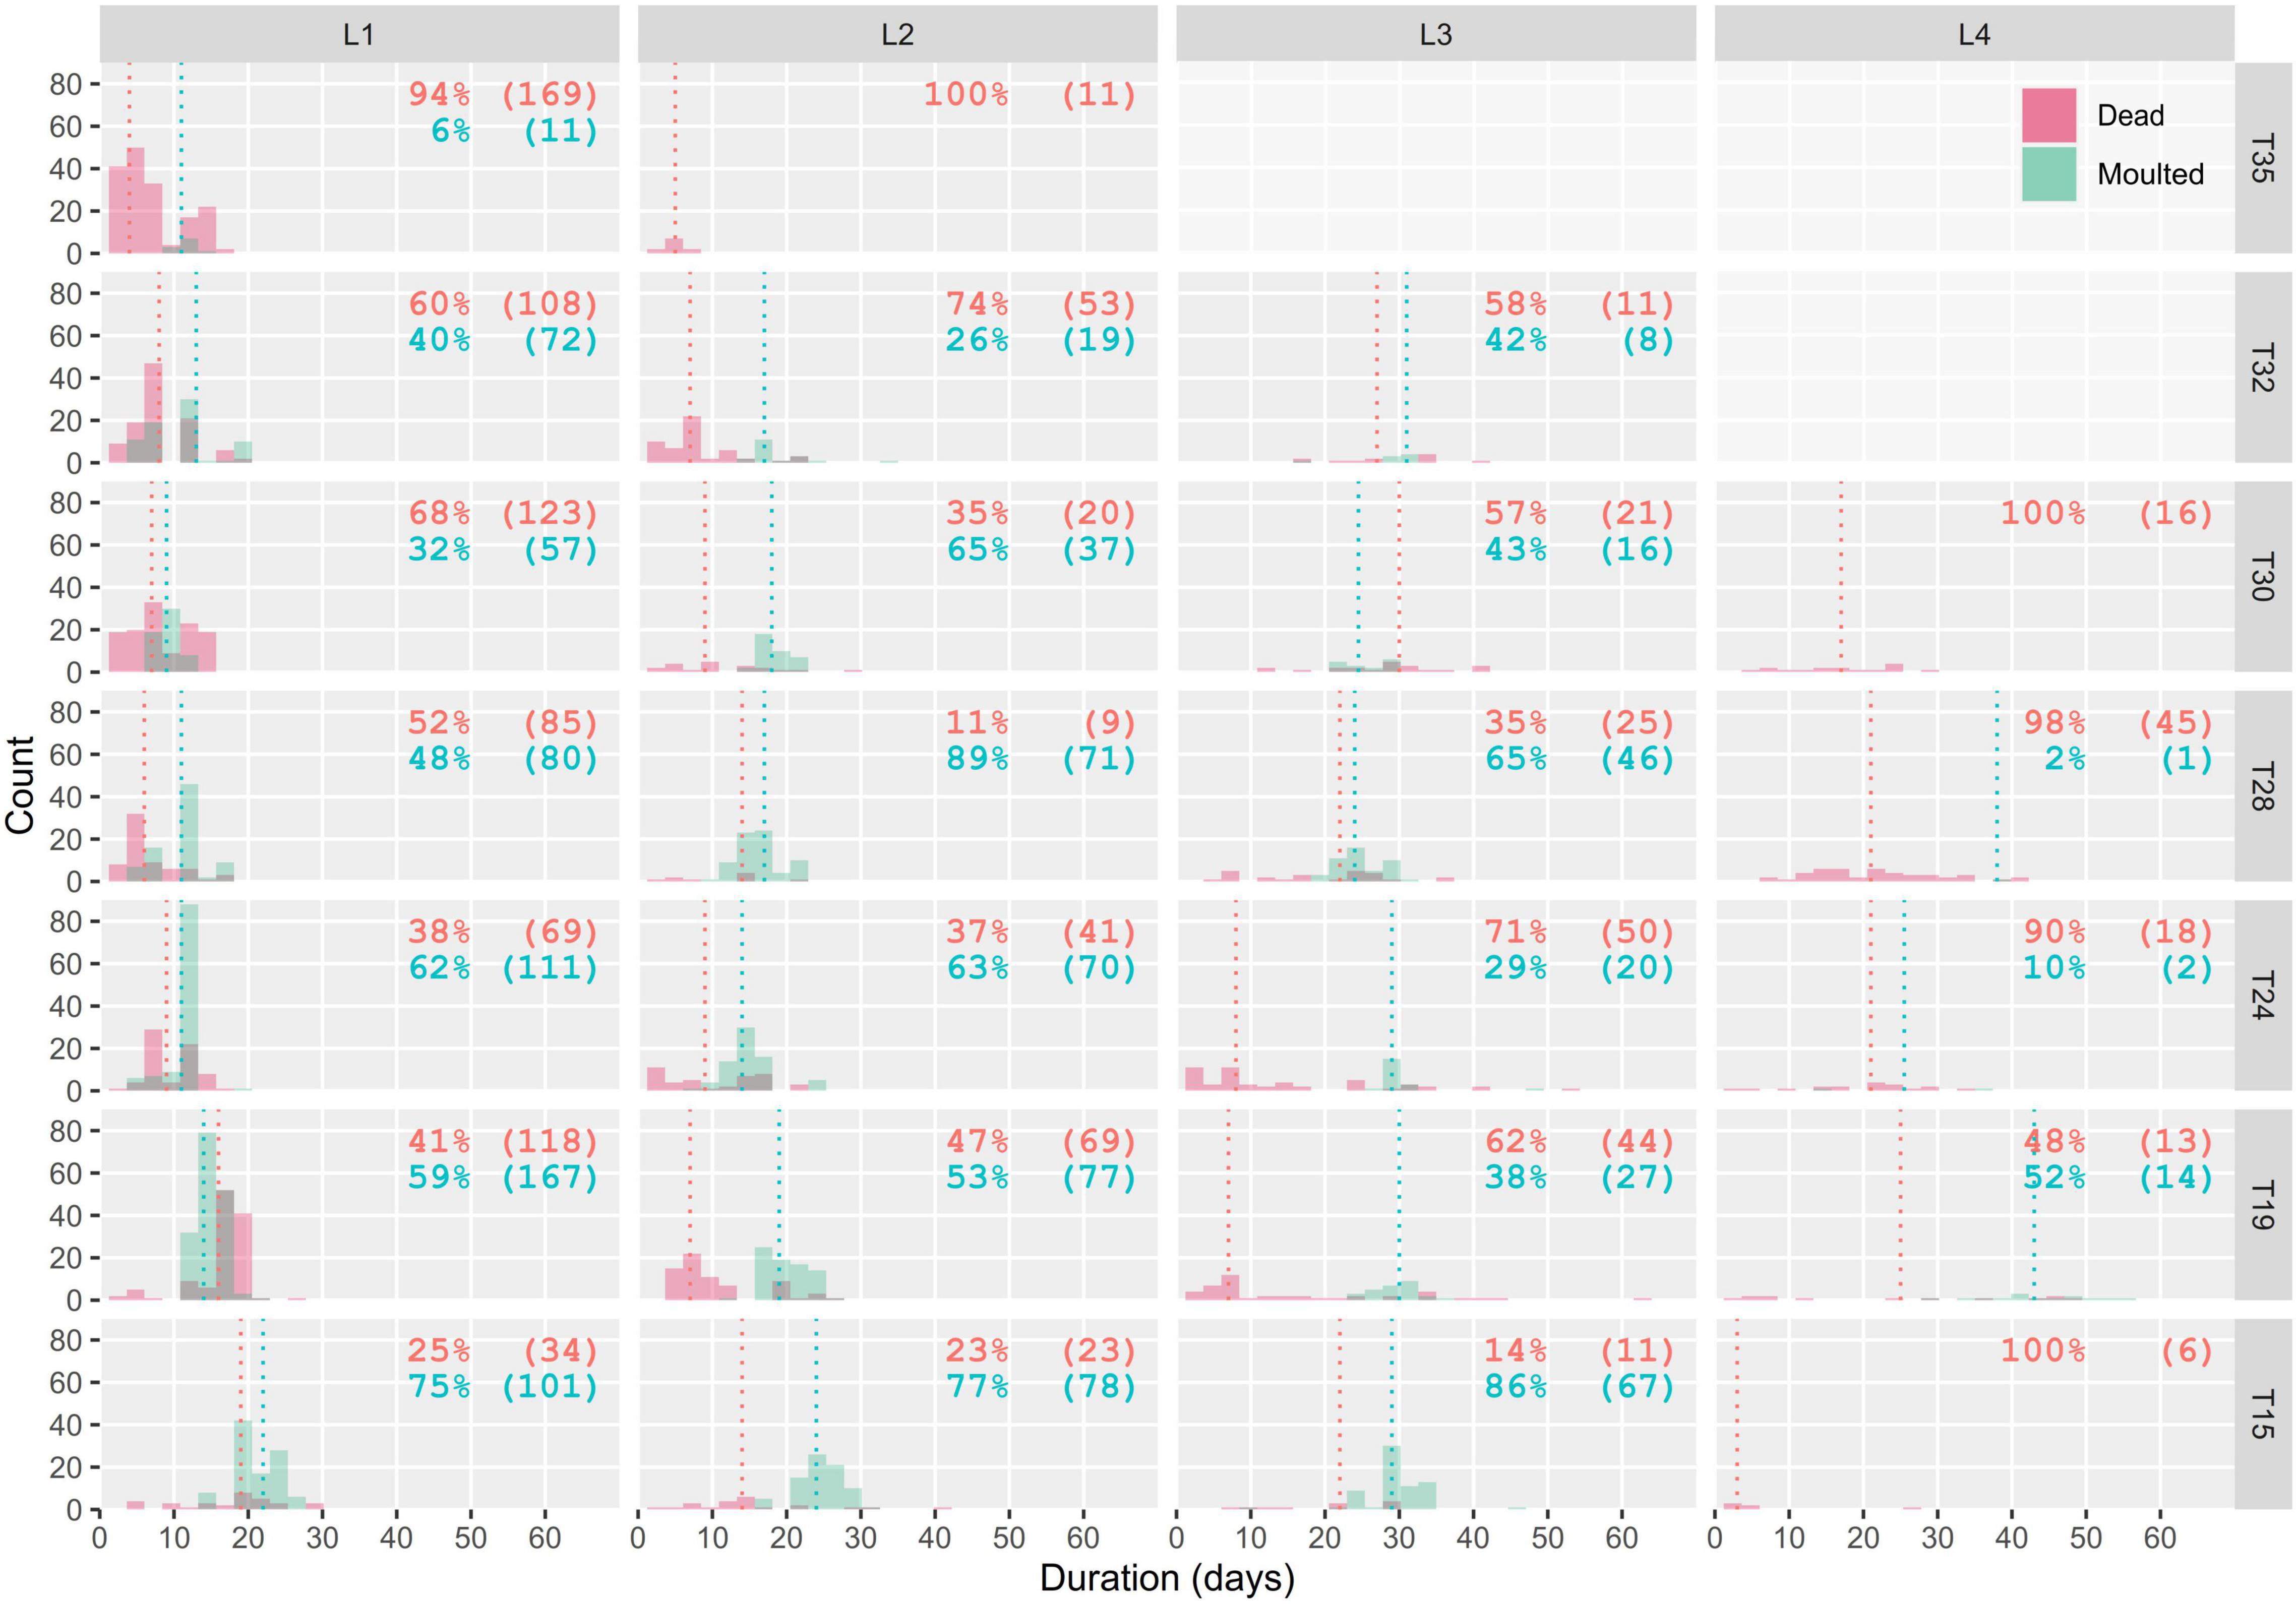
Figure 4. Number of dead larvae and moltings over time, for each stage and thermal treatment. Dashed green and red vertical lines represent the median development times and mortality of each stage, respectively. Percentages (N) of dead (red) and molted larvae (green) are detailed for each panel. In T15 and T32, the experiment was stopped after all individuals completed L3 because of urtication and contamination risks associated with next stages could not be mitigated in the corresponding laboratory. Twenty-one L2 and six L3 were subsampled in T19 for another experiment and are therefore discarded.
The thermal treatment had a significant effect on development rate (Kruskal-Wallis, χ2 = 40.51, df = 6, p.value < 0.01). The development rate increased with temperature to reach a maximum then decreased (Figure 5 and Supplementary Figure 4). The maximum development rate was obtained at different temperatures for each larval stage. A decreasing optimal temperature was observed from egg to L2 (approximatively 31, 29, and 25°C, respectively). Optimal temperature was estimated at 28°C in L3 and 24°C in L4 (Figure 5). The highest values for median development rate were obtained in L1 (0.11) and L2 (0.07), which reflects the fast development of these stages (Supplementary Figure 4). In other stages, the maximal development rate was estimated at 0.03 (egg), 0.04 (L3), and 0.05 (L4) (Figure 5).
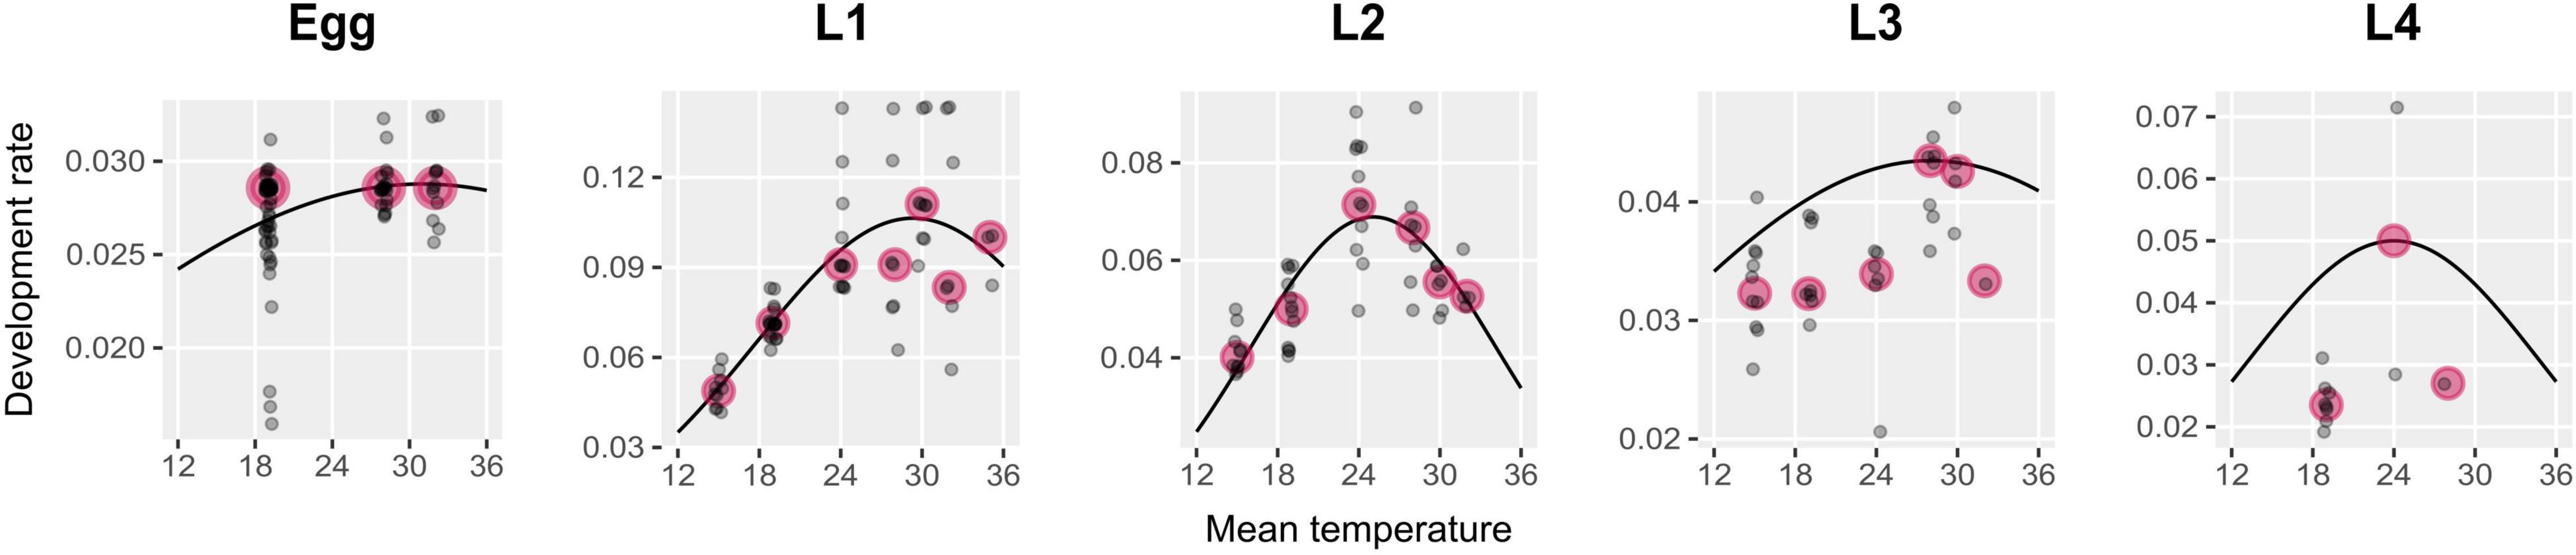
Figure 5. Development rates and thermal performance curves from egg to L4. Gray points represent the mean development rate per colony and are slightly jittered along the x-axis to ease visualization. Pink points indicate the median of development rates among colonies in a treatment.
Thermal Performance Curves
The Taylor equation (1) best fitted the development of eggs, L1 and L2 (RMSEegg = 0.003, MAEegg = 0.002; RMSEL1 = 0.018, MAEL1 = 0.012; RMSEL2 = 0.009, MAEL2 = 0.007) (see parameters’ estimate in Table 1). This equation is given by the following formula:
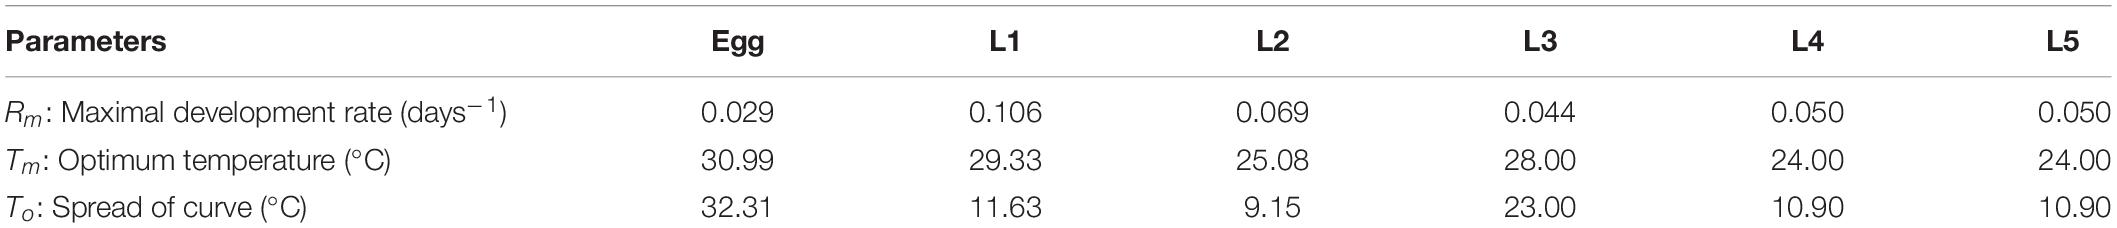
Table 1. Model parameters.
R(T) is the daily development rate (days–1) as a function of the daily mean temperature, T (°C). Rm is the maximal development rate (days–1), Tm the optimum temperature (°C), and To the rate at which development rate falls away from Tm.
This Taylor equation also fitted well L3 and L4 development rates when setting Rm and Tm, and estimating only To (RMSEL3 = 0.007, MAEL3 = 0.006, RMSEL4 = 0.02, and MAEL4 = 0.02). For L5, we considered the same equation and the same parameters’ estimates as for L4.
Validation of the Phenology Model
The relative proportions of stages in Orléans at eight dates were best predicted for L2 and L3 (RMSEL2 = 17%, MAEL2 = 9%; RMSEL3 = 21%, MAEL3 = 14%; RMSEL4 = 30%, MAEL4 = 26%; RMSEL5 = 23%, and MAEL5 = 17%). In sampled nests, we observed mainly L4 and L5 (Figure 6). The highest differences overall between observed and predicted percentages were found for L4 (maximum at 46%, 2020/01/03; Supplementary Table 1). For this stage, in four comparisons out of eight, the predictions fell out of the error bars of observed percentages (Figure 6). For L5, the highest difference was close to that of L4 (44%, 2020/01/03; Supplementary Table 1). For this stage, predictions were out of observed error bars in two comparisons out of six (Figure 6). The predicted mean durations of each stage were 37, 16, 26, 30, 60, and 60 days from egg to L5 in Orléans in 2019–2020. This corresponded to the available data in the literature for eggs, L3, L4, and L5 (Martin, 2005), with just a difference of four and 12 days for L1 and L2, respectively.
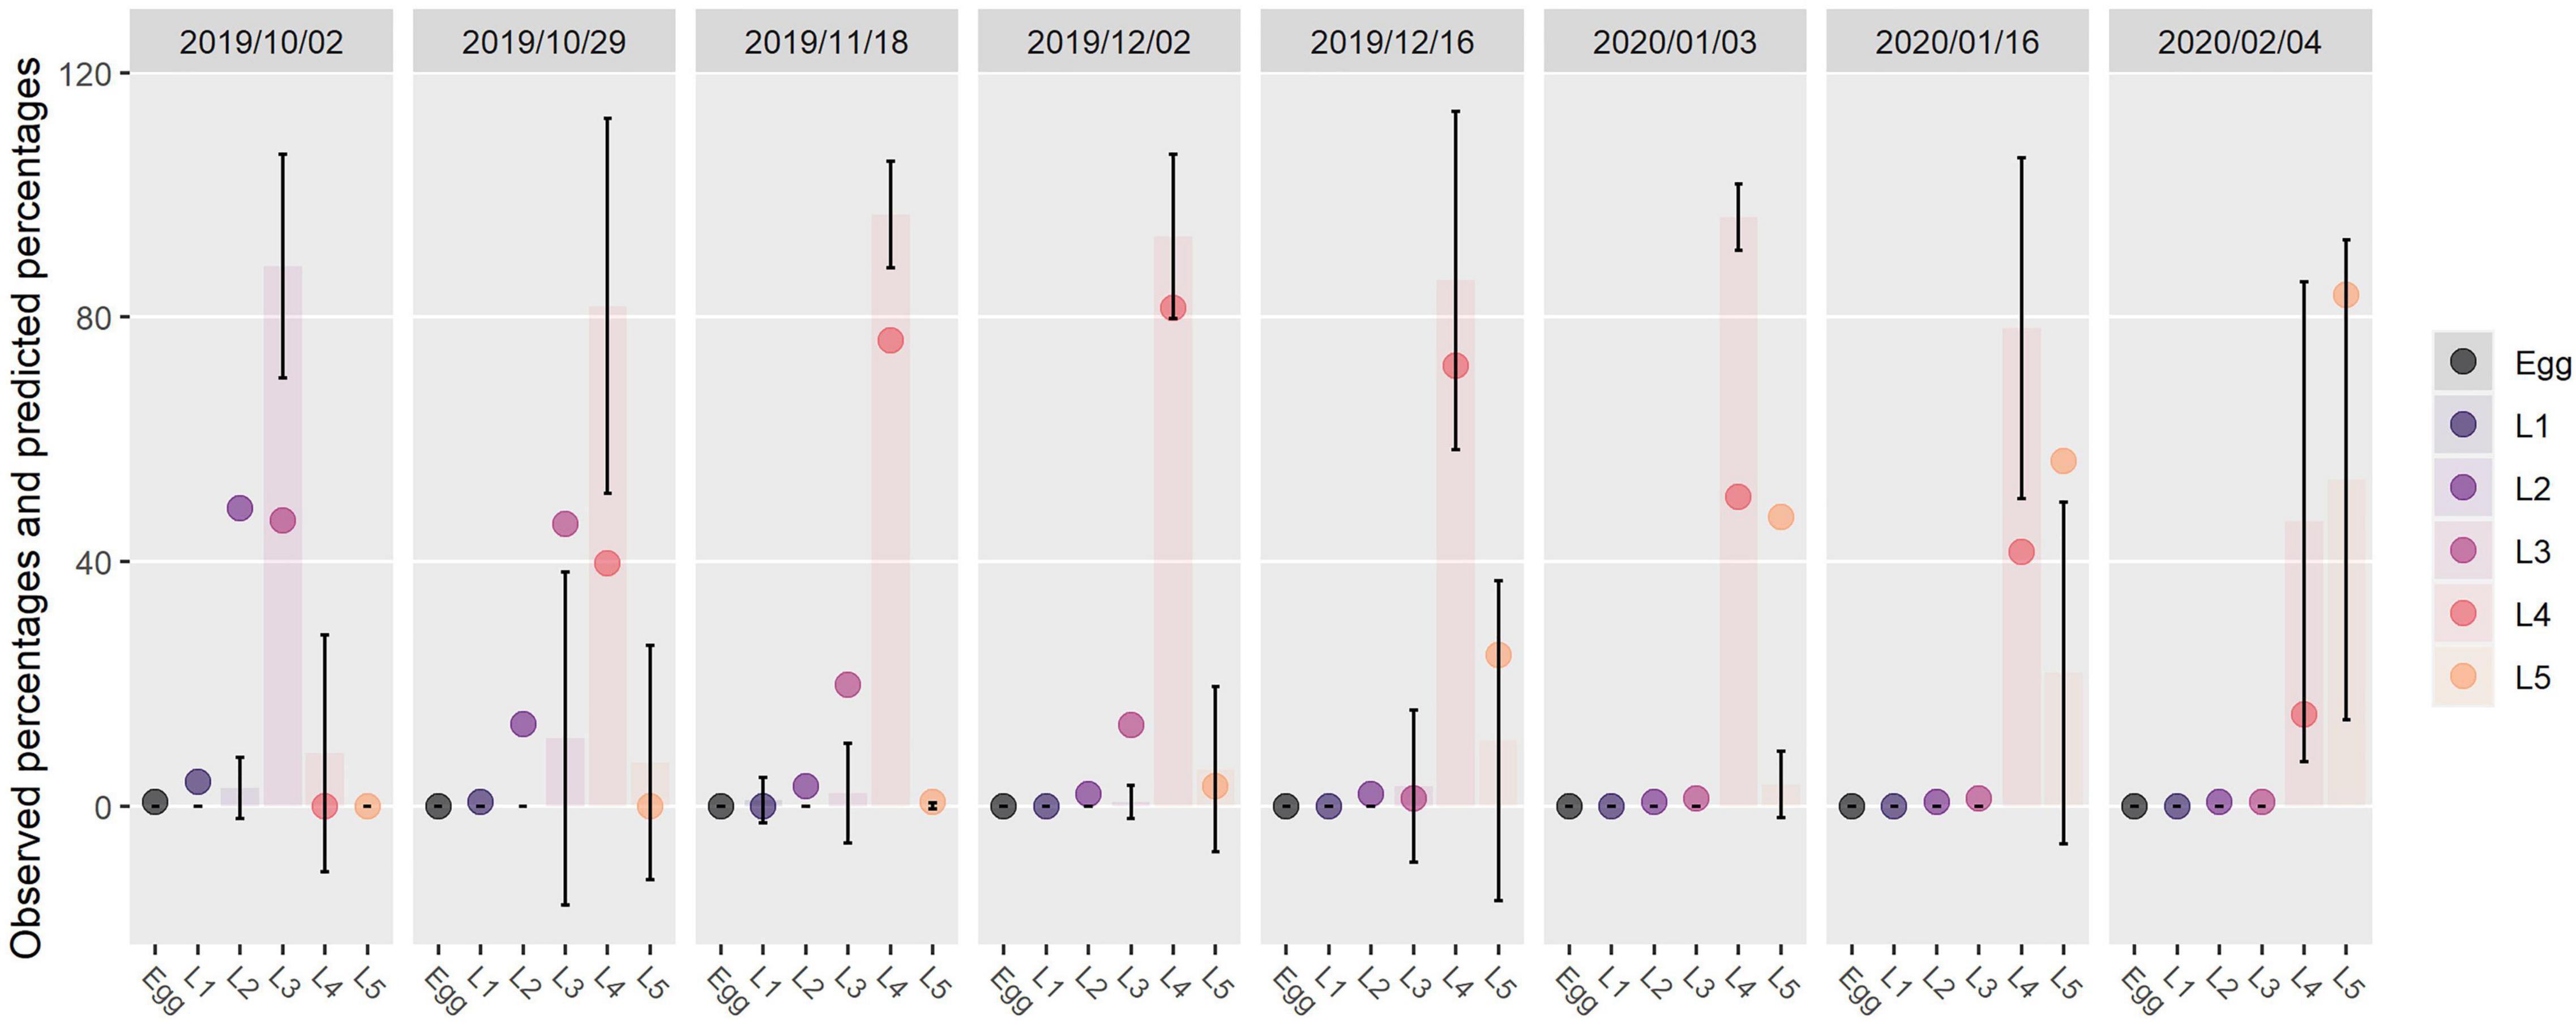
Figure 6. Observed and predicted percentages of individuals in each stage present at each of eight monitoring dates. Bars represent observed percentages (mean of percentages obtained in sampled nests). Error bars: mean percentages ± standard deviation. Points represent percentages predicted by the phenological model.
Simulating the Effects of Temperature Change
The predicted mean duration of each stage varied depending on the amplitude of the simulated thermal changes. With a global increase of 1, 2, and 3°C, the end of L5 development occurred on average 19, 37, and 53 days earlier than in reality, while it was delayed by 24, 46, and 68 days with a decrease of 1, 2, and 3°C, respectively (Figure 7 and Table 2). Considering the temperatures recorded in Orléans in 2019–2020, 5% of L5 completed their larval development by 10 February 2020. This percentage is reached earlier when daily mean temperature is increased by 1, 2, and 3°C (19 January 2020, 2 January 2020, and 20 December 2019 respectively), and later when daily mean temperature is decreased (6 March 2020, 5 April 2020, and 22 April 2020, respectively) (Figure 7). The same trend was observed for the date at which 95% of L5 completed their larval development. Our model predicted that 95% of individuals completed L5 by 6 April 2020, with actual temperatures recorded. Predictions with increases of 1, 2, and 3°C were 15 March 2020, 25 February 2020, and 12 February 2020, respectively, and 26 April 2020, 20 May 2020, and 14 June 2020, for opposite decreases.
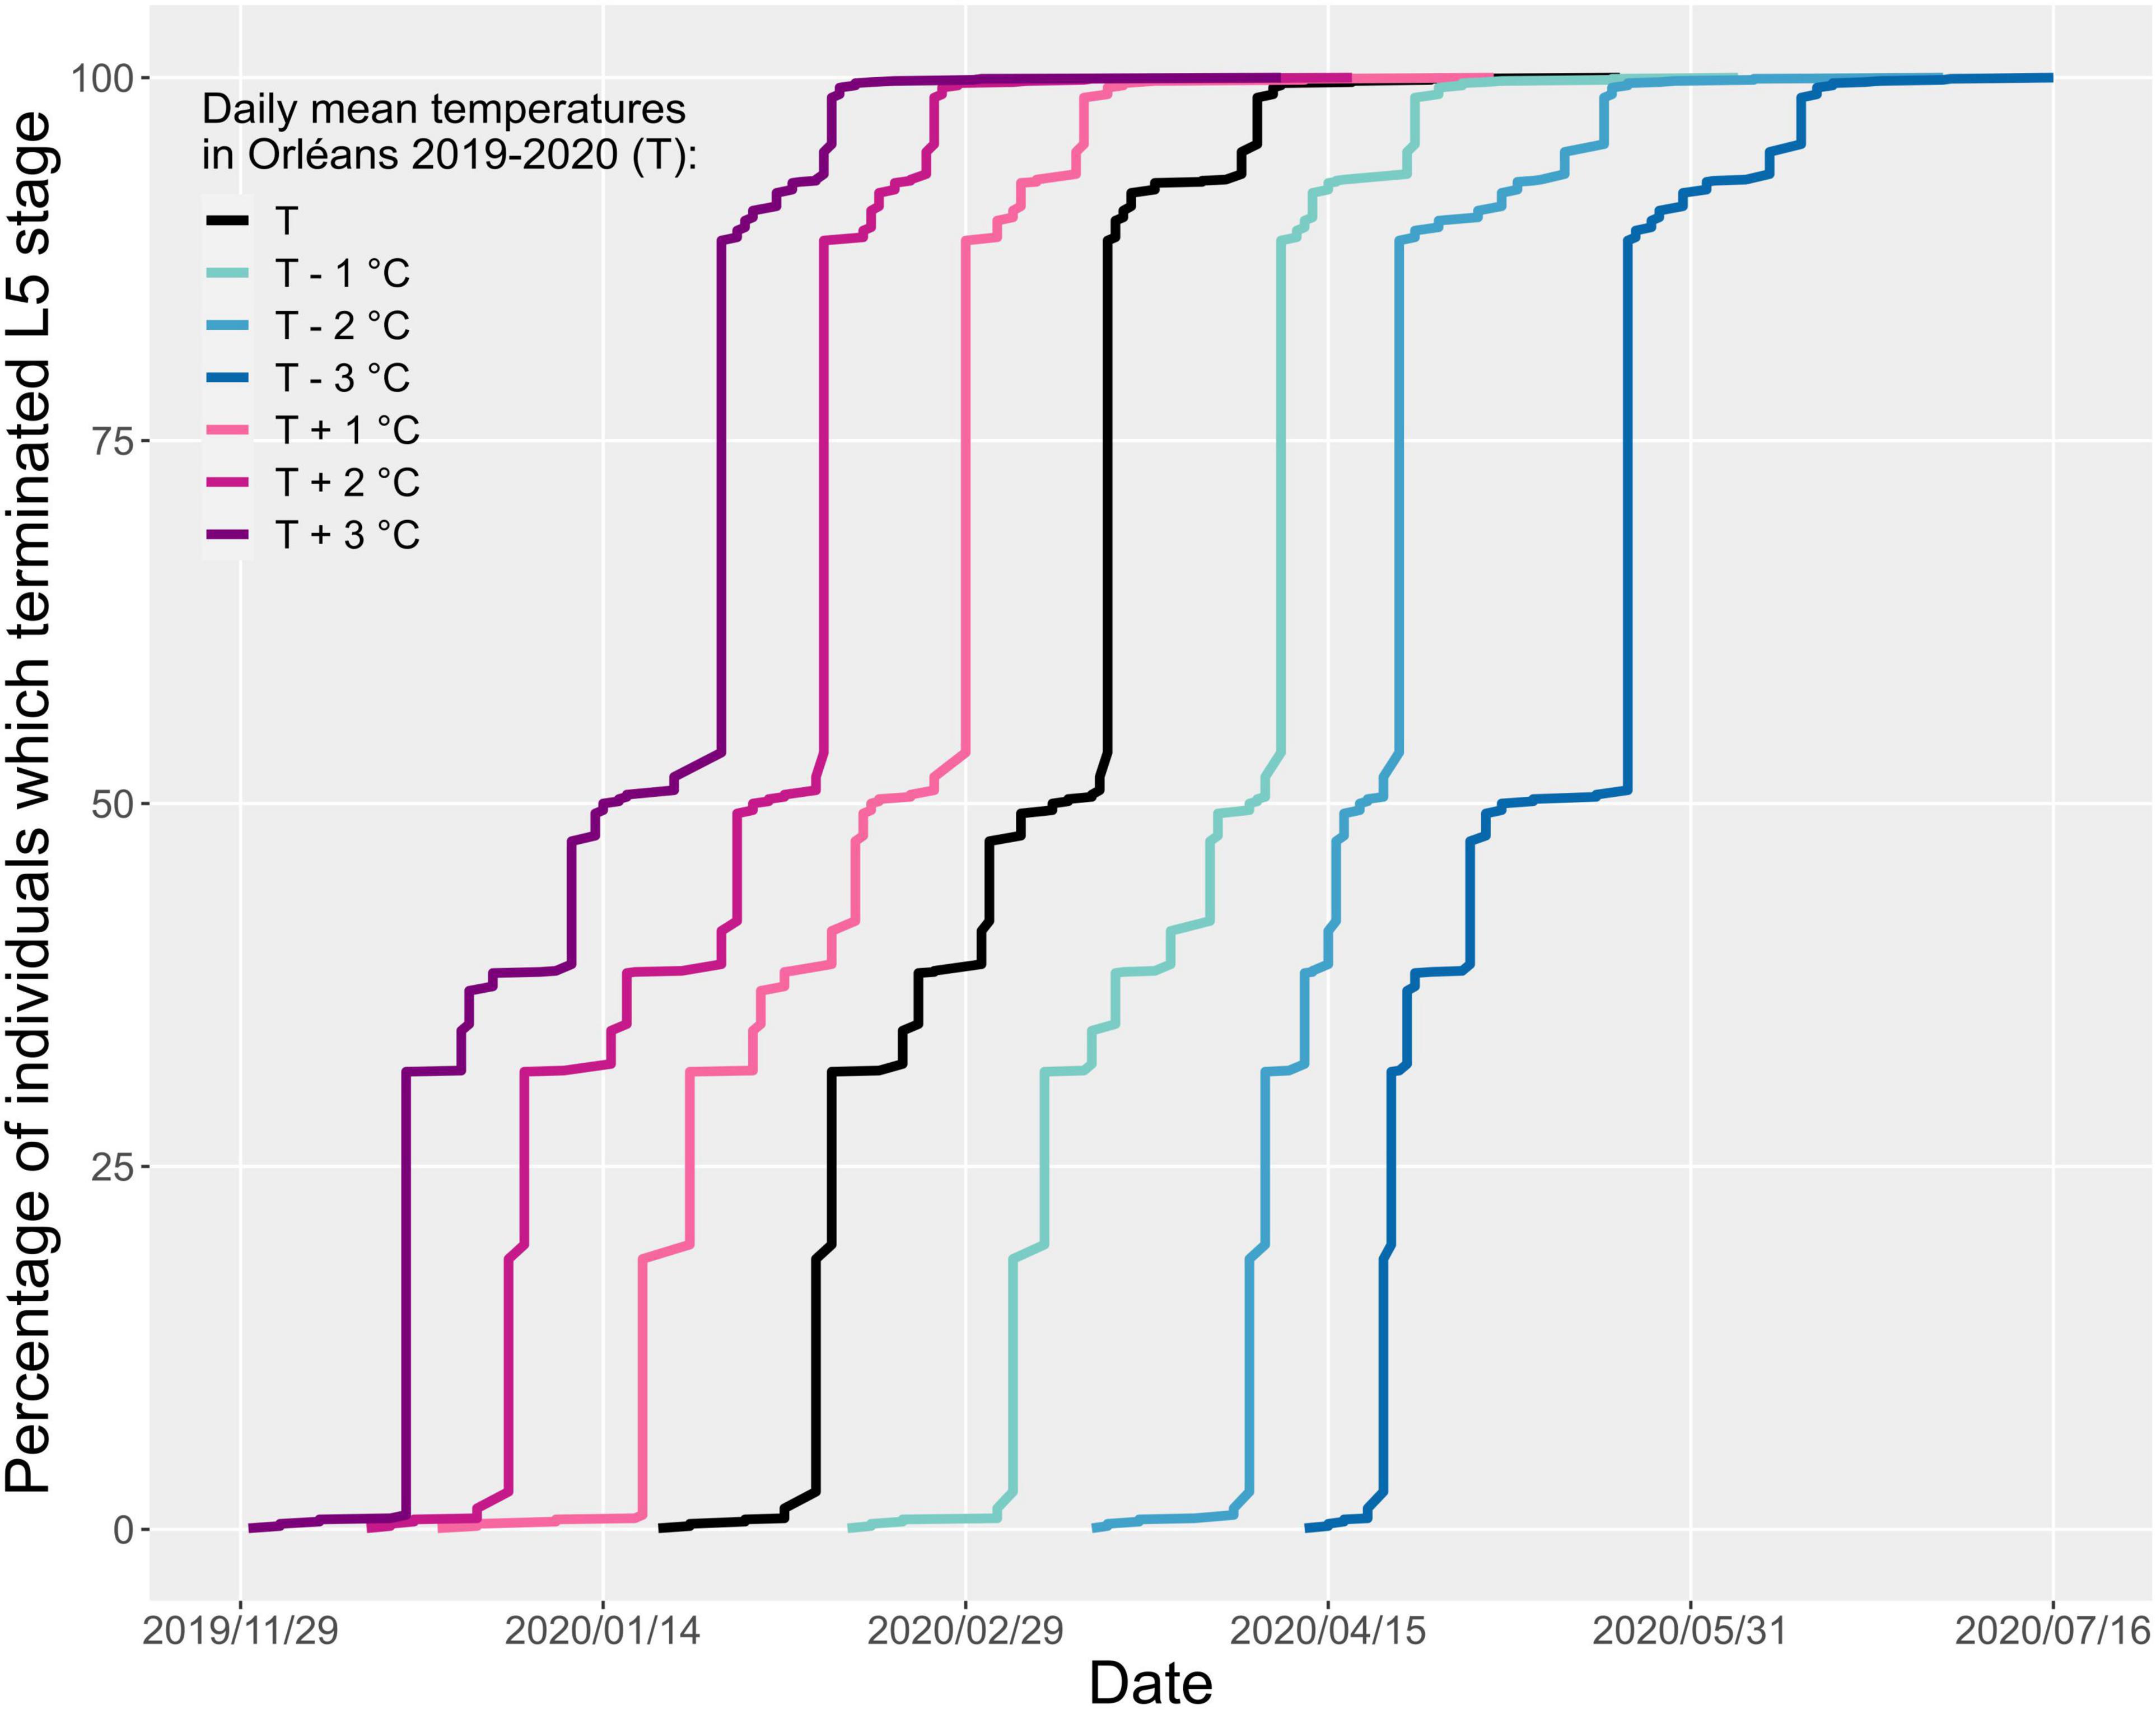
Figure 7. Predicted cumulated percentage of individuals that completed larval development (end of L5) over time, depending on simulated variations of the daily mean temperature in Orléans. This graph represents the times of end of L5 development, depending on arbitrary decrease or increase of temperature. The temperature baseline considered here is the daily mean temperature recorded in Orléans in 2019–2020.
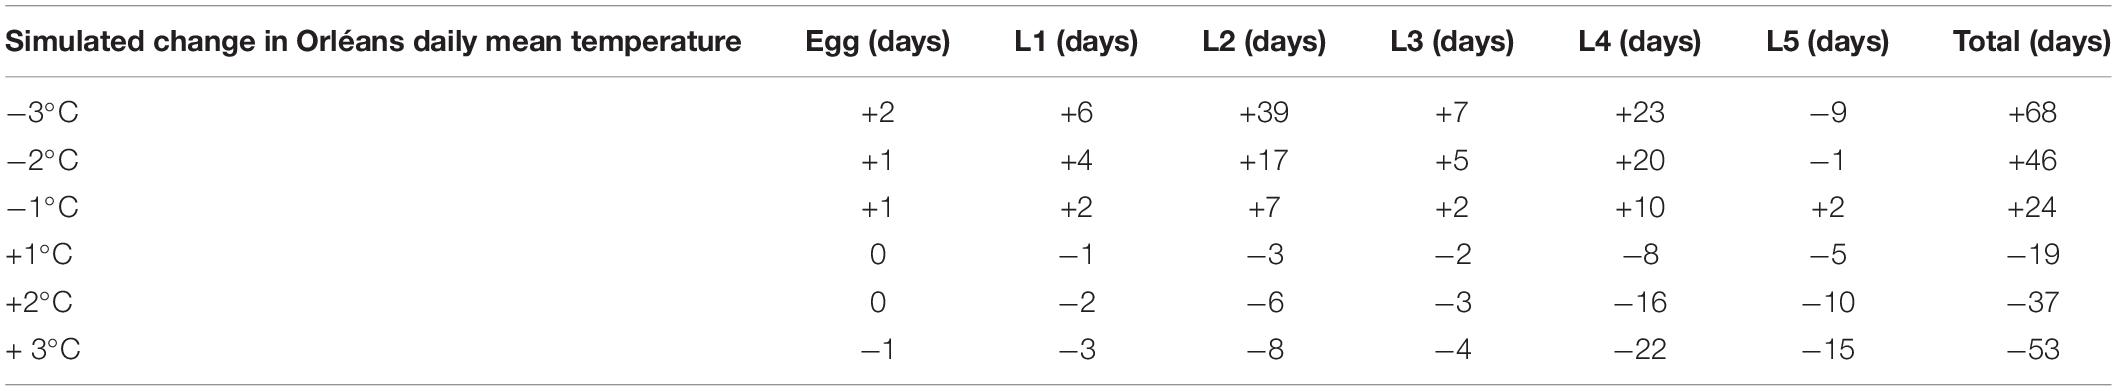
Table 2. Predicted variation of the mean duration of each stage in Orléans depending on simulated changes of daily mean temperature.
Consequences of the heatwave on overall development time were found to be vastly caused by direct exposure to the heatwave (L4 for cohort A, L3 for cohort B, L2 + L3 for cohort C), with only marginal changes in subsequent stages one not directly exposed to the heatwave but developing at different periods due to the prior phenological shifts (L4 and L5 end advanced by 21 and 22 days for cohort A, by 4, 8, and 10 days for L3, L4, and L5 of cohort B and by 11, 16, 17, and 14 days for L2, L3, L4, and L5 of cohort C) (Figure 8).
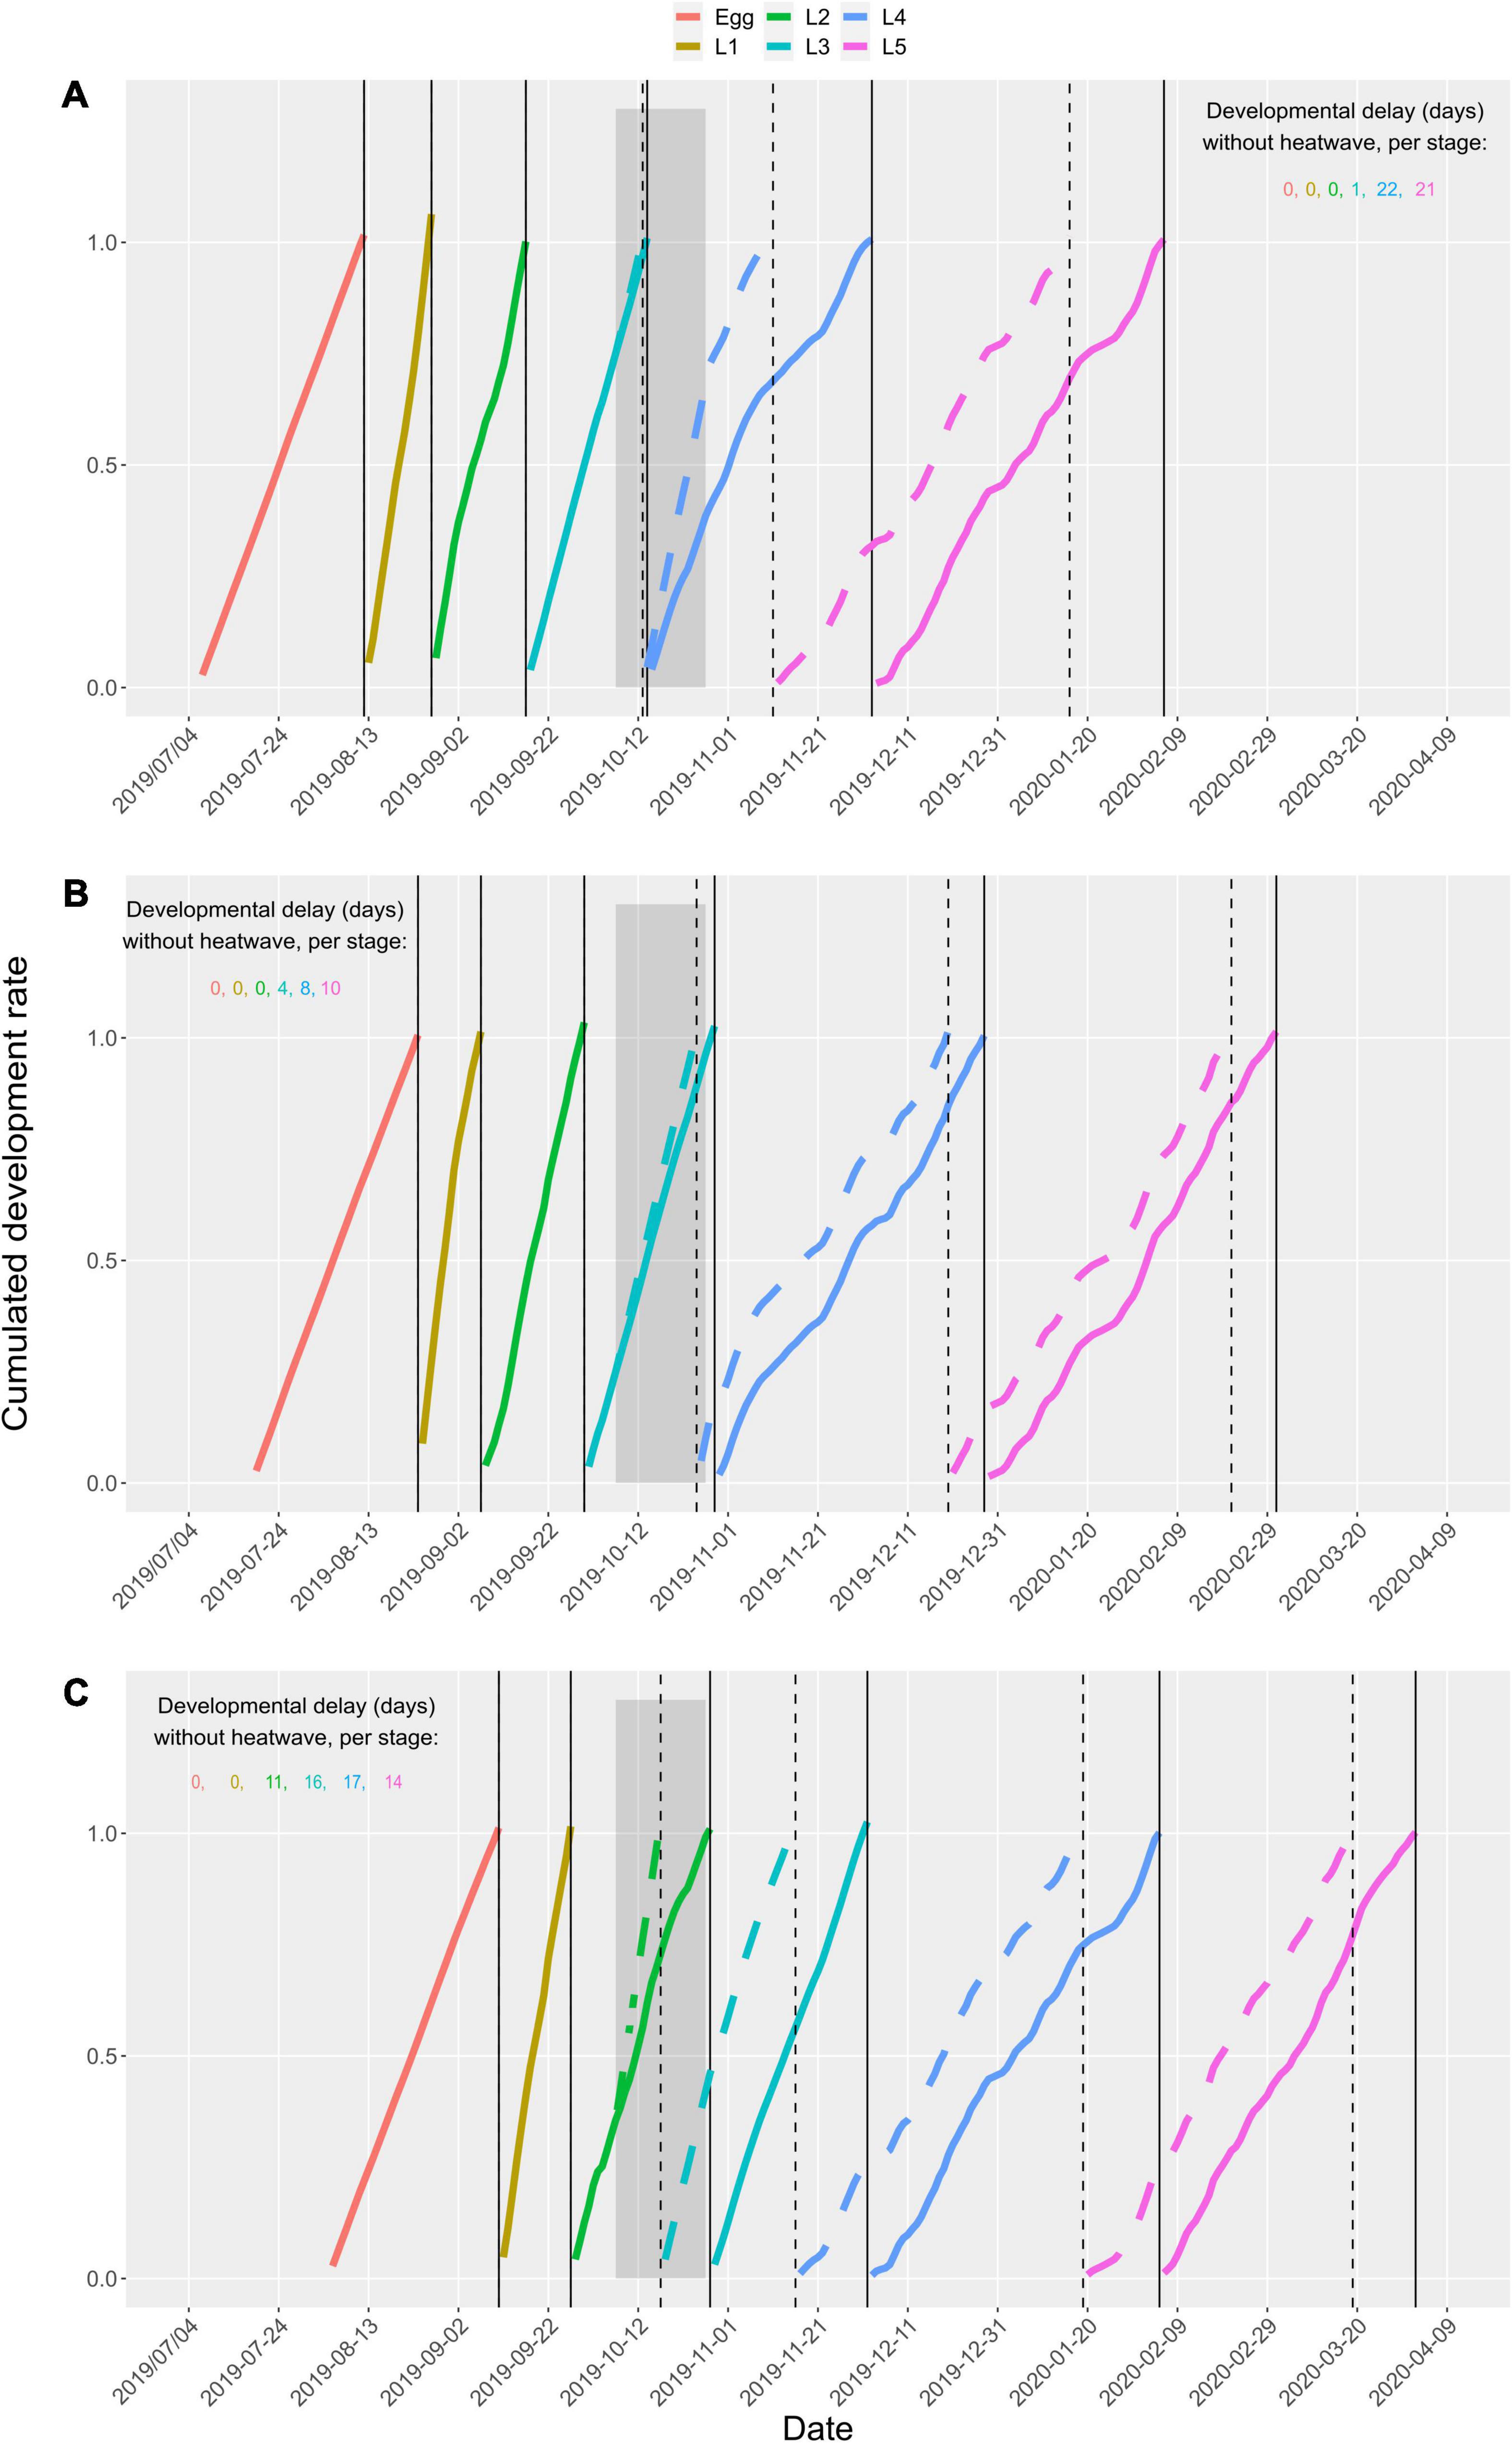
Figure 8. Predicted cumulated development rate of prepupal stages with (dashed lines) or without (solid lines) a + 10°C autumnal heatwave, represented with the dark gray background from 7 October 2019 to 27 October 27 2019. Panels (A–C) correspond to three cohorts of eggs laid at the 10, 50, and 90% quantiles of previous generation adult trappings (6 July 6 2019, A; 18 July 18 2019, B; 4 August 2019, C). Captures of adults from the previous generation (parents) are assumed to reflect egg quantiles given the short adult lifespan of the PPM. Simulations were computed with a temperature baseline corresponding to the daily mean temperature recorded in Orléans in 2019–2020. Color curves represent predicted cumulated development time for each stage simulated with (dashed) and without (solid) a + 10°C autumnal heatwave. Vertical lines mark the predicted end of each stage in the scenario with (dashed) or without (solid) heatwave.
Discussion
Numerous studies have documented the impact of climate warming on the phenology of insects. While most studies in multivoline species have quantified phenological shifts and/or the number of generations that can be completed during the favorable season (Altermatt, 2010; Glazaczow et al., 2016), the mechanisms at play in the response of univoltine species remain poorly understood (Uno and Stillman, 2020). Univoltine species often display complex life cycles with multiple larval stages spanning several seasons with contrasting conditions. Integrated views of how climate variation affects the overall species cycle by influencing differently the phenology of each life stage are rather rare (Uno and Stillman, 2020). Their relevance is particularly striking when intra- and inter-population phenological variability is high enough to allow the co-occurrence of several concurrent stages at the same time in nature, since the vulnerability of each stage to stochastic events may differ. Our experimental results confirmed that different life stages of the PPM have distinct sensitivities to temperature for their development, i.e., different developmental thresholds and rates.
Using a phenology model that integrates these differences in sensitivity across life stages, we demonstrated that development rate of each stage is differentially impacted by a consistent warming scenario throughout the year. The overall influence on development time across stages accumulated to as high as 53 days difference in the most pessimistic scenario (+3°C simulation) relative to the actual meteorological records, and 19 days in a +1°C scenario. The simulation of an autumnal heatwave is more realistic, however, and our results also indicate the high effect observed on early larval instars due to their highly variable development rate between cold and optimal conditions, with a relatively high Topt. A heatwave scenario occurring during these instars but not overreaching Topt could therefore sensibly move the average development rate in those instars, and ultimately result in high phenological shifts that could in turn cascade into subsequent instars by giving them the opportunity to develop in September/October instead of November/December. These results are discussed below in the light of the ecology of the species and of the methodological and model limitations.
Environmental changes likely induce phenological shifts. Simulations performed under a +3°C daily mean scenario predicted pre-winter processions such as those that are increasingly being observed in a fraction of the colonies and populations during unusually warm years, including in Orléans where the individuals used to fit the model originate from. This phenological shift can be an advantage if it permits to maintain the synchronization between life-stages and their preferred environmental conditions (Briscoe et al., 2012; Uno and Stillman, 2020). In contrast, phenological change can cause maladaptation when delayed or advanced life stages are exposed to detrimental conditions there are not typically tolerant to. Partial resynchronization of PPM diapause termination among individuals showing different pupation timings was observed (Salman et al., 2019b), which suggests that adults emerging from early individuals may not experience more unfavorable conditions than adults emerging from more median larvae. The absence of larval diapause, however, makes such resynchronization mechanisms impossible during prepupal stages. Finally, processions before winter are commonly observed in some populations such as Ré island since at least the 1970s (the older observations dates) (Abgrall, 2001), with some years the vast majority of the population pupating before winter, which indicates that this phenology can be viable at the very least under the conditions of Ré island. We suggest that climate warming and increasing climate variability increase the probability of occurrence of both earlier and later processions, ultimately increasing the overall procession temporal range at the local scale. In addition, the simulation of an autumnal heatwave during October predicted carry-over effects on subsequent stages. As a consequence, phenological delays incurred at one stage can be conserved to some extent in subsequent stages, and procession timing is not determined only by the temperature experienced by last larval stage but also by thermal history during earlier development.
When an environmental disturbance affects an earlier life stage, the probability to observe a strong effect on later stage is high (Potter et al., 2011). Our results show that when the third instar was exposed to the simulated heatwave, the development delay was lower than when the other stages (L2 and L4) were exposed. In contrast to those stages, the TPC shape of L3 was different (less concave form). Model predictions are good for L4 stage but the TPC was based only on few colonies (11). The TPC of L1 and L2 were supported by more data. Furthermore, young stages have faster development and the slopes of the TPC linear part are more important than for later stages. Thus, young stages likely have stronger effect on phenology. Other simulations on colonies with artificial phenology (to expose each stage directly to heatwave) can be made to confirm which stage imply more important phenological change.
The accuracy of the model varied among life stage. The predicted mean duration of L1 and L2 differed by 4 and 12 days compared to literature data, respectively. Sensitivity and uncertainty analyses were conducted to determine which parameters had the most impact on model output and to observe the model behavior within parameters’ confidence interval range (Supplementary Supporting Information). Model outputs were greatly impacted by optimal temperature (Tm in our model) but also by maximum development rate (Rm). The uncertainty associated to Tm was higher than that of Rm. Differences between predicted and observed mean duration for L1 and L2 may be therefore depend on the accuracy of the assessment of the Tm estimate. For instance, a change in the Tm value as low as 10% can alter the predicted mean duration of the L2 instar by 31 days (Supplementary Supporting Information). This shows the importance of accurately determining the value of Tm of each life stage to obtain good estimates of development rates.
A phenological model taken into account stage-specific differences as the one developed in this study can be used to better understand the differential effect of climate change on each life stage independently. Moreover, a stage-specific model can help exploring direct effects of climate variability which may have contrasting impacts on each life stage, but also the indirect carry-over effect on the following stages, which we assume to be of importance in such a long-lived species whose development spans multiple seasons.
This study has limitations inherent to both the experimental and the modeling parts. First, determining thermal performance curves for development rate of each life stage in controlled conditions is a technical challenge in a species known to feed more than 6 months to complete larval development. This adds to the challenge of working with a gregarious and urticating species under controlled conditions and contributes to explain the difficulty in obtaining high sample sizes in all larval instars. More thermal traits may be needed to refine the fit of the non-linear models used to describe these TPCs. For example, the CTmax could be used as an upper threshold for development. This threshold was not integrated because it is not known for every stages. Furthermore, larvae likely be affected by high temperature before the CTmax (larvae stressed and limitation of feeding).
Second, our temperature treatments corresponded to a fixed thermal variance (10°C daily temperature range). While choosing fluctuating thermal regimes allowed better mimicking natural conditions (Sinclair et al., 2016) and the actual ecology of ectotherms, whose physiological processes heavily depend on such fluctuations (Colinet et al., 2015), altering the daily thermal variance and even the geometric average over the course of the development to reflect seasonal changes would likely yield slightly different results (Paaijmans et al., 2013; Colinet et al., 2015). However, analyses of development within each instar would also become much more complex to interpret and even design due to individual experience of prior temperature varying depending on their prior development time, let alone the impossibility to maintain intracolony variance in development time if the experimental design implies changing conditions after molting. This approach would be more realistic on a non-gregarious species whereby larvae can be individually exposed to different conditions depending on their development without considering the development of conspecifics. For these reasons, the added complexity of such experimental changes would likely have defeated the point of a modeling approach meant to simplify our understanding of a complex process, and we believe choosing fluctuating thermal regime and using a wide range of experimental temperatures across groups was a better balance to understand the response of each instars to varying seasonal conditions.
Third, our study does not consider the potential impact of colony size on individual survival or physiological performance, despite known influence of group size and nest quality on individual larval survival (Laparie, comm. pers.; see also Poitou et al., 2021). Nonetheless, we reported average mortality rates that are similar to that observed in other studies which considered much larger colony sizes (Pérez-Contreras et al., 2003). However, mortality variability between colonies was important (several colonies were suffered of the experimental conditions).
Fourth, we could not monitor the development of the last larval stage due to cumulated mortality over the course of the experiment at prior stages. While L5 parameters can be inferred from published experimental data obtained on L4 since both stages display similar development rates (Devkota and Schmidt, 1990; Martin, 2005; Berardi et al., 2015), actual experimental data to firmly confirm this assumption would improve the robustness of the model. However, the end of the last stage is marked by a behavioral event, the pupation procession that we cannot ascertain to reliably obtain in controlled conditions without larger colony sizes, meteorological parameters such as sun exposure or thermal variations among days. The accurate prediction of this event alone may not only require data on the ontogeny of L5 instars, but possibly also its own set of input meteorological data that may putatively alter the motivation of individuals to collectively leave the nest and seek a pupation site. Their motivation may also depend on the phenology of other individuals in the colony, as pupation processions most often involve a large number of individuals, thereby suggesting that the earliest individuals may sit and wait in the nest until a certain quantile of larvae are ready to pupate. This raises the complex question of the ultimate fate and fitness of earliest or latest individuals in a colony, when their ability to find a suitable pupation site and survive until emergence is heavily dependent on a collective behavior that involves their siblings, which may not be ready yet or have left the nest earlier.
Finally, field monitoring should ideally begin earlier than October (end of August) to maximize the chance to catch early stages and validate corresponding model predictions, but L1 and L2 last only a few days in nature and are consequently hard to observe due to unconspicuous silken tent or defoliation.
Our study opens new avenues in the study of the PPM ecology and physiology. First, the shape of the thermal performance curve can be affected by abiotic factors other than temperature. For instance, the host tree species is known to alter larval development time and survival (Devkota and Schmidt, 1990). During the experiment, larvae were all fed with black pine needles (the most abundant host tree the surrounding of Orléans). Determining the extent to which thermal performance curve or the best mathematical fit can be modified with different diets appears as an interesting perspective, given that the main host plant available to the PPM may vary across its range. Second, the phenology model was developed and validated for a population originating Orléans, within a degraded oceanic climate (Joly et al., 2010). Since geographical variations of developmental thresholds are ubiquitous in insects (Honek, 1996) and given that phenological variability across bioclimatic regions is known in the PPM (Abgrall, 2001; Martin and Brinquin, 2012; Battisti et al., 2015), this phenology model could be tested for populations thriving under different climates to check the accuracy of predictions (see Poitou, 2021).
Model predictions can be improved by considering the actual temperatures at which larvae are exposed (Potter et al., 2013). Starting from L3, PPM larvae collectively weave a thick silken tent that they will maintain over the cold season until pupation processions. A biophysical model to describe temperature inside the PPM tent has been recently developed (Poitou et al., 2021) and showed noticeable microclimatic effects that could be used to predict internal tent temperature from climate stations. The resulting simulated internal tent temperature could then be used as input for this phenology model instead of meteorological records, thereby potentially improving the reliability of predictions. However, when the temperature is above feeding thresholds (Battisti et al., 2005), larvae leave their tent during the night to feed on pine needles for durations that are hard to monitor or estimate. Two feeding thresholds have been estimated: larvae feed only when daytime tent temperature is higher than 9°C and followed by night temperature higher than 0°C (Battisti et al., 2005). Air temperature should therefore be used in combination with internal tent temperature when both conditions are satisfied, and internal tent temperature only when they are not. However, each larva may leave the tent to feed for variable durations depending on their physiological status that may be difficult to include in the model.
Pupal diapause was not integrated to our model because of the complexity of both obligatory diapause and non-obligatory prolonged diapause mechanisms, which remain poorly understood in this species. Recent work showed, however, that the obligatory phase of diapause that immediately follows pupation procession may vary in duration in a given population depending on procession timing, thereby contributing to resynchronizing emergences and matings (Salman et al., 2019b). A better understanding of how pupal diapause is modulated would be necessary before associated parameters can be integrated in the model to simulate the entire life cycle from the egg to the adult, and loop several generations in silico without re-initialization from observational flight data. This way, the effects of climate change on flight periods and potential carry-over effects on the next generation(s) could also be explored.
Our study has direct implications for ecological applications. This first version of a PPM phenological model can help produce urtication risk alerts near the predicted procession times, which is critical when meteorological conditions yield predictions of unusually early or atypical pupation processions. It can also help planning stage-specific control methods, which is often crucial to ensure their efficacy. The B. thuringensis affects more strongly young larval stages than older ones. However, since L1 and L2 have a short development time, increasing the efficiency of B. thuringensis sprayings requires anticipating their occurrence. In the same way, the modeling indicated that early processions can occur more frequently in the future with climate change, but also that the overall procession range may be prolonged and therefore the urtication risk period will be longer as well. Collar interception traps targeting L5 processions should therefore be installed as early as autumn in areas where processions historically occurred only in spring, and model prediction of the end of L5 can be considered to plan the removal of collection bags.
Conclusion
This study provides a stage-specific phenological model for egg and larval development of the pine processionary moth. It highlights that: (1) different prepupal life stages of the PPM have different developmental thresholds and rates, (2) meteorological variability consequently has differential impacts on different instars which reflect onto the whole larval phenology, and therefore (3) these physiological differences between instars as well as the phenological variability among individuals at the beginning of the cycle (egg-laying) should be considered to correctly predict the phenology of this insect and its variance. Our study provides a simulation-based explanation and a quantification of atypical pre-winter processions. In the autumnal heatwave scenario we tested, only a carry-over effect of the transient warming was observed (i.e., the development time gained during the direct exposure to the heatwave was conserved until the end of the larval development). However, we found no indirect snowball effect expected with the advanced development of subsequent instars in autumn (i.e., no accelerated development of subsequent instars despite the temporal shift before the onset of winter). However, this putative mechanism should be further investigated with other scenarios by modulating different parameters of timing, intensity and duration of the heatwave in different bioclimatic areas. Moreover, acute stochastic events such as heatwaves co-occur in nature with chronic warming. Considering the effects of those mechanisms individually already shows phenological consequences, but the likelihood of pre-winter processions and snowball effects may be underestimated until the joint effects are taken into account. In this context, atypical processions are expected to become more frequent with ongoing climate warming and weather stochasticity.
Data Availability Statement
The datasets presented in this study can be found in online repositories. The names of the repository/repositories and accession number(s) can be found below: https://zenodo.org/record/5549323.
Author Contributions
LP, ML, SP, CR, JR, and CS: conceptualization, experimental design, review, and final editing. LP, ML, SP, and CS: sampling, experiments, and monitoring. LP, ML, SP, CR, and CS: data and statistical analyses, original draft writing, and preparation. All authors have read and agreed to the final version of the manuscript.
Funding
This work was supported by Centre Val de Loire Region for LP’s Ph.D. grant, ANR PHENEC for data collections, field samplings, and equipments (grant number19-CE32-0007), and SOERE TEMPO for part of the traps (https://tempo.pheno.fr).
Conflict of Interest
The authors declare that the research was conducted in the absence of any commercial or financial relationships that could be construed as a potential conflict of interest.
Publisher’s Note
All claims expressed in this article are solely those of the authors and do not necessarily represent those of their affiliated organizations, or those of the publisher, the editors and the reviewers. Any product that may be evaluated in this article, or claim that may be made by its manufacturer, is not guaranteed or endorsed by the publisher.
Acknowledgments
We greatly thank Alexis Bernard, Louis Gross, and Patrick Pineau for their crucial technical assistance toward this work. We acknowledge the city of Saran for kindly allowing us to install traps, as well as the AgroClim unit from INRAE for providing daily temperature data. We are grateful to François Rebaudo for his help on the use of the DevRate package. This study was made possible with the financial support from the Centre Val de Loire Region (LP’s Ph.D. grant), the French National Research Agency (ANR) in the frame of the project called PHENEC (data collections, field samplings, equipments), and the TEMPO French Network—tempo.pheno.fr—for providing support which contributed to fund the automated monitoring equipment essential to this study.
Supplementary Material
The Supplementary Material for this article can be found online at: https://www.frontiersin.org/articles/10.3389/fevo.2022.825875/full#supplementary-material
References
Abgrall, J. F. (2001). “Le réseau surveillance processionnaire du pin en France 1969-1989,” in Conception – Historique – Résultats, ed. R. Cemagref (Nogent sur Vernisson: CemOA Publications).
Altermatt, F. (2010). Climatic warming increases voltinism in European butterflies and moths. Proc. R. Soc. B Biol. Sci. 277, 1281–1287. doi: 10.1098/rspb.2009.1910
Arambourou, H., Sanmartín-Villar, I., and Stoks, R. (2017). Wing shape-mediated carry-over effects of a heat wave during the larval stage on post-metamorphic locomotor ability. Oecologia 184, 279–291. doi: 10.1007/s00442-017-3846-z
Atkinson, D. (1994). Temperature and Organism Size—A Biological Law for Ectotherms?. Amsterdam: Elsevier, 1–58.
Battisti, A., Avcı, M., Avtzis, D. N., Jamaa, M. L. B., Berardi, L., Berretima, W., et al. (2015). “Natural history of the processionary moths (Thaumetopoea spp.): new insights in relation to climate change,” in Processionary Moths and Climate Change: An Update, ed. A. Roques (Dordrecht: Springer Netherlands), 15-79.
Battisti, A., Stastny, M., Netherer, S., Robinet, C., Schopf, A., Roques, A., et al. (2005). Expansion of geographic range in the pine processionary moth caused by increased winter temperatures. Ecol. Applic. 15, 2084–2096. doi: 10.1890/04-1903
Berardi, L., Branco, M., Paiva, M. R., Santos, H., and Battisti, A. (2015). Development time plasticity of the pine processionary moth (Thaumetopoea pityocampa) populations under laboratory conditions. Entomologia 3, 19–24.
Bonsignore, C. P., Manti, F., Castiglione, E., and Battisti, A. (2019). Pupal traits and adult emergence in the pine processionary moth Thaumetopoea pityocampa (Lepidoptera: Notodontidae) are affected by pupal density. Eur. J. Entomol. 116, 320–329. doi: 10.14411/eje.2019.035
Briscoe, N. J., Porter, W. P., Sunnucks, P., and Kearney, M. R. (2012). Stage-dependent physiological responses in a butterfly cause non-additive effects on phenology. Oikos 121, 1464–1472.
Chuine, I. (2010). Why does phenology drive species distribution? Philos. Trans. R. Soc. B Biol. Sci. 365, 3149–3160. doi: 10.1098/rstb.2010.0142
Colinet, H., Sinclair, B. J., Vernon, P., and Renault, D. (2015). Insects in fluctuating thermal environments. Annu.l Rev. Entomol. 60, 123–140. doi: 10.1146/annurev-ento-010814-021017
Damos, P., and Savopoulou-Soultani, M. (2012). Temperature-driven models for insect development and vital thermal requirements. Psyche J. Entomol. 2012, 1–13. doi: 10.1155/2012/123405
Deutsch, C. A., Tewksbury, J. J., Huey, R. B., Sheldon, K. S., Ghalambor, C. K., Haak, D. C., et al. (2008). Impacts of climate warming on terrestrial ectotherms across latitude. Proc. Natl. Acad. Sci. U.S.A. 105, 6668–6672. doi: 10.1073/pnas.0709472105
Devkota, B., and Schmidt, G. H. (1990). Larval development of Thaumetopoea pityocampa (Den. & Schiff.) (Lep., Thaumetopoeidae) from Greece as influenced by different host plants under laboratory conditions. J. Appl. Entomol. 109, 321–330.
Doi, H. (2008). Delayed phenological timing of dragonfly emergence in Japan over five decades. Biol. Lett. 4, 388–391. doi: 10.1098/rsbl.2008.0234
Forister, M. L., and Shapiro, A. M. (2003). Climatic trends and advancing spring flight of butterflies in lowland California: phenological changes in California butterflies. Glob. Change Biol. 9, 1130–1135. doi: 10.1046/j.1365-2486.2003.00643.x
Forrest, J., and Miller-Rushing, A. J. (2010). Toward a synthetic understanding of the role of phenology in ecology and evolution. Philos. Trans. R. Soc. B Biol. Sci. 365, 3101–3112. doi: 10.1098/rstb.2010.0145
Glazaczow, A., Orwin, D., and Bogdziewicz, M. (2016). Increased temperature delays the late-season phenology of multivoltine insect. Sci. Rep. 6, 1–8. doi: 10.1038/srep38022
Gomi, T., Nagasaka, M., Fukuda, T., and Hagihara, H. (2007). Shifting of the life cycle and life-history traits of the fall webworm in relation to climate change. Entomol. Exp. Appl. 125, 179–184.
Helle, H., Koskela, E., and Mappes, T. (2012). Life in varying environments: experimental evidence for delayed effects of juvenile environment on adult life history: life in varying environments. J. Anim. Ecol. 81, 573–582. doi: 10.1111/j.1365-2656.2011.01937.x
Honek, A. (1996). Geographical variation in thermal requirements for insect development. Eur. J. Entomol. 93, 303–312.
Huchon, H., and Démolin, G. (1970). La bioécologie de la Processionnaire du pin: dispersion potentielle, dispersion actuelle. Rev. For. Française 22, 220–234. doi: 10.4267/2042/20421
Hughes, L. (2000). Biological consequences of global warming: is the signal already apparent? Trends Ecol. Evol. 15, 56–61. doi: 10.1016/s0169-5347(99)01764-4
Joly, D., Brossard, T., Cardot, H., Cavailhes, J., Hilal, M., and Wavresky, P. (2010). Les types de climats en France, une construction spatiale. Cybergeo 501:23155.
Khelifa, R., Blanckenhorn, W. U., Roy, J., Rohner, P. T., and Mahdjoub, H. (2019). Usefulness and limitations of thermal performance curves in predicting ectotherm development under climatic variability. J. Anim. Ecol. 88, 1901–1912. doi: 10.1111/1365-2656.13077
Kingsolver, J. G., Arthur Woods, H., Buckley, L. B., Potter, K. A., MacLean, H. J., and Higgins, J. K. (2011). Complex life cycles and the responses of insects to climate change. Integr. Comp. Biol. 51, 719–732. doi: 10.1093/icb/icr015
Lange, H., Økland, B., and Krokene, P. (2006). Thresholds in the life cycle of the spruce bark beetle under climate change. Interjournal Complex Syst. 1648, 1–10.
Martin, J.-C. (2005). La Processionnaire Du Pin Thaumetopoea Pityocampa, Biologie et Protection Des Forêts. Paris: INRA.
Martin, J. C., and Brinquin, A. S. (2012). La processionnaire du pin: la connaître pour mieux se protéger. Nuisibles Paras. Inform. 75, 23–26.
Mirhosseini, M. A., Fathipour, Y., and Reddy, G. V. P. (2017). Arthropod development’s response to temperature: a review and new software for modeling. Ann. Entomol. Soc. Am. 110, 507–520. doi: 10.1093/aesa/sax071
Mujica, N., Sporleder, M., Carhuapoma, P., and Kroschel, J. (2017). A temperature-dependent phenology model for Liriomyza huidobrensis (Diptera: Agromyzidae). J. Econ. Entomol. 110, 1333–1344. doi: 10.1093/jee/tox067
Paaijmans, K. P., Heinig, R. L., Seliga, R. A., Blanford, J. I., Blanford, S., Murdock, C. C., et al. (2013). Temperature variation makes ectotherms more sensitive to climate change. Glob. Change Biol. 19, 2373–2380. doi: 10.1111/gcb.12240
Parlak, S., Özçankaya, ÝM., Batur, M., Akkas̨, M. E., Boza, Z., and Toprak, Ö (2019). Determining the edge effect of pine processionary moth (Thaumetopoea pityocampa) in its horizontal distribution in the stand. J. For. Res. 30, 347–352. doi: 10.1007/s11676-018-0634-5
Pérez-Contreras, T., Soler, J. J., and Soler, M. (2003). Why do pine processionary caterpillars Thaumetopoea pityocampa (Lepidoptera, Thaumetopoeidae) live in large groups? An experimental study. Ann. Zool. Fennici 40, 505–515.
Poitou, L. (2021). Etude De L’impact Du Changement Climatique Sur la Phénologie De la Processionnaire Du Pin. Ph.D. dissertation. France: Université d’Orléans.
Poitou, L., Robinet, C., Suppo, C., Rousselet, J., Laparie, M., and Pincebourde, S. (2021). When insect pests build their own thermal niche: the hot nest of the pine processionary moth. J. Therm. Biol. 98:102947. doi: 10.1016/j.jtherbio.2021.102947
Potter, K. A., Davidowitz, G., and Arthur Woods, H. (2011). Cross-stage consequences of egg temperature in the insect Manduca sexta: cross-stage effects of egg temperature. Funct. Ecol. 25, 548–556. doi: 10.1111/j.1365-2435.2010.01807.x
Potter, K. A., Woods, H. A., and Pincebourde, S. (2013). Microclimatic challenges in global change biology. Glob. Change Biol. 19, 2932–2939. doi: 10.1111/gcb.12257
Quinn, B. K. (2017). A critical review of the use and performance of different function types for modeling temperature-dependent development of arthropod larvae. J. Therm. Biol. 63, 65–77. doi: 10.1016/j.jtherbio.2016.11.013
R Core Team (2020). R: A Language and Environment for Statistical Computing. Vienna: R Foundation for Statistical Computing.
Radchuk, V., Turlure, C., and Schtickzelle, N. (2013). Each life stage matters: the importance of assessing the response to climate change over the complete life cycle in butterflies. J. Anim. Ecol. 82, 275–285. doi: 10.1111/j.1365-2656.2012.02029.x
Rebaudo, F., and Rabhi, V.-B. (2018). Modeling temperature-dependent development rate and phenology in insects: review of major developments, challenges, and future directions. Entomol. Exp. Appl. 166, 607–617.
Rebaudo, F., Struelens, Q., and Dangles, O. (2018). Modelling temperature-dependent development rate and phenology in arthropods: the DevRate package for R. Methods Ecol. Evol. 9, 1144–1150. doi: 10.1111/2041-210x.12935
Renner, S. S., and Zohner, C. M. (2018). Climate change and phenological mismatch in trophic interactions among plants, insects, and vertebrates. Annu. Rev. Ecol. Evol. Syst. 49, 165–182. doi: 10.1146/annurev-ecolsys-110617-062535
Robinet, C., Laparie, M., and Rousselet, J. (2015). Looking beyond the large scale effects of global change: local phenologies can result in critical heterogeneity in the pine processionary moth. Front. Physiol. 6:334. doi: 10.3389/fphys.2015.00334
Robinet, C., Rousselet, J., and Roques, A. (2014). Potential spread of the pine processionary moth in France: preliminary results from a simulation model and future challenges. Ann. For. Sci. 71, 149–160.
Salman, M. H. R., Bonsignore, C. P., El Alaoui El Fels, A., Giomi, F., Hodar, J. A., Laparie, M., et al. (2019a). Winter temperature predicts prolonged diapause in pine processionary moth species across their geographic range. PeerJ 7:e6530. doi: 10.7717/peerj.6530
Salman, M. H. R., Giomi, F., Laparie, M., Lehmann, P., Pitacco, A., and Battisti, A. (2019b). Termination of pupal diapause in the pine processionary moth Thaumetopoea pityocampa. Physiol. Entomol. 44, 53–59. doi: 10.1111/phen.12277
Salman, M. H. R., Giomi, F., Laparie, M., Lehmann, P., and Battisti, A. (2018). Prepupal diapause synchronizes adult emergence in the pine processionary moth Thaumetopoea pityocampa (Lepidoptera: Notodontidae): processionary moth prepupal diapause. Agric. For. Entomol. 20, 582–588. doi: 10.1111/afe.12291
Salman, M. H. R., Hellrigl, K., Minerbi, S., and Battisti, A. (2016). Prolonged pupal diapause drives population dynamics of the pine processionary moth (Thaumetopoea pityocampa) in an outbreak expansion area. For. Ecol. Manag. 361, 375–381. doi: 10.1016/j.foreco.2015.11.035
Sinclair, B. J., Marshall, K. E., Sewell, M. A., Levesque, D. L., Willett, C. S., Slotsbo, S., et al. (2016). Can we predict ectotherm responses to climate change using thermal performance curves and body temperatures? Ecol. Lett. 19, 1372–1385. doi: 10.1111/ele.12686
Stevens, D. J. (2004). Pupal development temperature alters adult phenotype in the speckled wood butterfly, Pararge aegeria. J. Therm. Biol. 29, 205–210.
Stoeckli, S., Hirschi, M., Spirig, C., Calanca, P., Rotach, M. W., and Samietz, J. (2012). Impact of climate change on voltinism and prospective diapause induction of a global pest insect – Cydia pomonella (L.). PLoS One 7:e35723. doi: 10.1371/journal.pone.0035723
Uno, H., and Stillman, J. H. (2020). Lifetime eurythermy by seasonally matched thermal performance of developmental stages in an annual aquatic insect. Oecologia 192, 647–656. doi: 10.1007/s00442-020-04605-z
van Asch, M., van Tienderen, P. H., Holleman, L. J. M., and Visser, M. E. (2007). Predicting adaptation of phenology in response to climate change, an insect herbivore example. Glob. Change Biol. 13, 1596–1604. doi: 10.1111/j.1365-2486.2007.01400.x
Vega, J. M., Moneo, I., Ortiz, J. C. G., Palla, P. S., Sanchís, M. E., Vega, J., et al. (2011). Prevalence of cutaneous reactions to the pine processionary moth (Thaumetopoea pityocampa) in an adult population. Contact Dermatitis 64, 220–228. doi: 10.1111/j.1600-0536.2011.01884.x
Wagner, T. L., Willers, J. L., and Olson, R. L. (1991). Modeling arthropod development time. J. Agric. Urban Entomol. 8, 251–270.
Wagner, T. L., Wu, H.-I., Sharpe, P. J. H., and Coulson, R. N. (1984). Modeling distributions of insect development time: a literature review and application of the weibull function. Ann. Entomol. Soc. Am. 77, 475–483. doi: 10.1093/aesa/77.5.475
Keywords: pine processionary moth, Thaumetopoea pityocampa, phenology, model, carry-over effect, climate change, heatwave
Citation: Poitou L, Laparie M, Pincebourde S, Rousselet J, Suppo C and Robinet C (2022) Warming Causes Atypical Phenology in a Univoltine Moth With Differentially Sensitive Larval Stages. Front. Ecol. Evol. 10:825875. doi: 10.3389/fevo.2022.825875
Received: 30 November 2021; Accepted: 07 January 2022;
Published: 09 February 2022.
Edited by:
Paulo A. V. Borges, University of the Azores, PortugalReviewed by:
Eustachio Tarasco, University of Bari Aldo Moro, ItalyPasquale Trematerra, University of Molise, Italy
Copyright © 2022 Poitou, Laparie, Pincebourde, Rousselet, Suppo and Robinet. This is an open-access article distributed under the terms of the Creative Commons Attribution License (CC BY). The use, distribution or reproduction in other forums is permitted, provided the original author(s) and the copyright owner(s) are credited and that the original publication in this journal is cited, in accordance with accepted academic practice. No use, distribution or reproduction is permitted which does not comply with these terms.
*Correspondence: Christelle Robinet, christelle.robinet@inrae.fr
†These authors have contributed equally to this work