 H. E. Markus Meier
 Florian Börgel
 Claudia Frauen
 Hagen Radtke
- 1Department of Physical Oceanography and Instrumentation, Leibniz Institute for Baltic Sea Research Warnemünde, Rostock, Germany
- 2Department of Research and Development, Swedish Meteorological and Hydrological Institute, Norrköping, Sweden
A Commentary on
Lake or Sea? The Unknown Future of Central Baltic Sea Herring
by Dippner, J. W., Fründt, B., and Hammer, C. (2019). Front. Ecol. Evol. 7:143. doi: 10.3389/fevo.2019.00143
Since the 1970s the weight of 3-year old central Baltic Sea (BS) herring (Clupea harengus) decreased causing a loss in catch which is equivalent to ~100 million € (Dippner et al., 2019; henceforth DFH). DFH suspected that the decline in weight was related to a change in the prey community caused by a reduction in surface layer (<30 m) salinity. They concluded that the changes in herring weight are “indirectly influenced by the Atlantic Multidecadal Oscillation (AMO) via a complex mediator chain,” i.e., increased sea surface temperature (SST) in the North Atlantic (NA), increased precipitation in the BS catchment area, increased river runoff, decreased surface layer salinity in the Baltic proper and decreased zooplankton (Pseudocalanus acuspes) biomass and herring weight. We argue that observational records are too short to verify a causal relationship between AMO and herring weight, because the presented herring weight data cover only 35 years (1974-2010), whereas one period of the AMO lasts 60 to 90 years (Figure 1). The NA SST time series only contains power significantly different from noise for periods in this range (Figure 1).
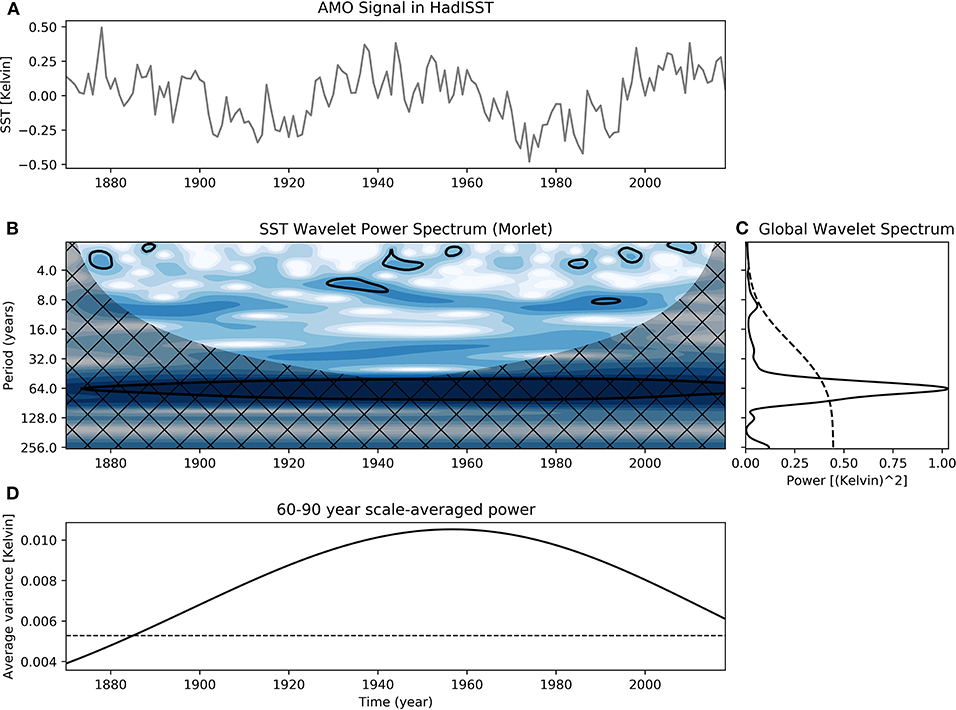
Figure 1. (A) Observed AMO index calculated from annual HadISST data since 1871 (Rayner et al., 2003), (B) corresponding continuous wavelet transform of the AMO index, (C) wavelet power spectrum integrated over time, and (D) average variance in the period band 60–90 years. The black contour lines show statistical significance according to Grinsted et al. (2004). The cone of influence where edge effects might influence the results is hatched (Grinsted et al., 2004).
Further, DFH proposed that “this observed trend is also projected for the future in regional climate change scenarios.” We argue that past correlations between multidecadal climate variations and herring weight should not be extrapolated into the future because the underlying processes of past and expected future changes may differ.
The AMO index is originally defined as monthly mean detrended SST anomalies in the NA region weighted from 0 to 70°N (Enfield et al., 2001) (Figure 1). The AMO index describes basin-wide changes in the Atlantic Ocean probably associated with coupled atmosphere-ocean interactions, the NA subpolar gyre and the Atlantic Meridional Overturning Circulation (AMOC) (e.g., Clement et al., 2015; Delworth and Zeng, 2016; Wills et al., 2019). It is, according to observations, an important driver of multidecadal variations in climate with a period of 60–90 years (e.g., Schlesinger and Ramankutty, 1994; Sutton and Hodson, 2005; Knight et al., 2006). Börgel et al. (2018) showed that under anomalous warm SSTs in the NA (AMO+ phase) moisture is advected into the BS region, leading to increased precipitation during winter and spring, increased river flow and decreased salinity in the BS. Since about the 1980s, the AMO is increasing contributing perhaps to increased bottom and decreased surface salinities (Kniebusch et al., 2019b; Liblik and Lips, 2019) and increased air and water temperatures in the BS region (Kniebusch et al., 2019a).
While there is some variance in the observed NA SST time series at a period of around 8 years (Figure 1), these fluctuations cannot be attributed to variations in AMOC (Delworth and Zeng, 2016). Probably these SST variations are driven by the North Atlantic Oscillation (NAO, Hurrell, 1995), which has a period of less than 10 years. NAO variability is apparently caused by internal atmospheric processes and only enhanced by the ocean (Hurrell et al., 2003). The influence of the NAO on wind fields over the BS region varies with time (Meier and Kauker, 2002). Other teleconnection patterns, such as Scandinavia (blocking) and the East Atlantic/West Russia pattern (Barnston and Livezey, 1987), play an important role as well (Kauker and Meier, 2003).
Further, Kauker and Meier (2003) found an acceptable correlation of r = 0.61 without lag between annual precipitation averaged over the BS catchment area and reconstructed river flow to the entire BS during 1903-1998. For the same period, Meier and Kauker (2003) showed that the freshwater storage anomaly in the BS and the accumulated freshwater inflow are well correlated (r = 0.80), in accordance with a causal relationship between runoff and mean salinity on a time scale of about 30 years. However, on subdecadal time scales, NA SST variations are probably not the reason for large-scale variations in moisture transport into the BS region but SSTs only react to NAO and other atmospheric teleconnection patterns. Further, the links between precipitation, runoff and salinity are more pronounced on multidecadal than on subdecadal time scales (Börgel et al., 2018). Hence, variations in NA SSTs might affect herring weight on multidecadal but very likely not on subdecadal time scales. Since the length of the time series of herring weight is only 35 years, observations only enable a coherence analysis of fluctuations with a period up to ~8–16 years, which is definitely shorter than the period of the AMO of 60–90 years (Figure 1). Indeed, DFH found that the variance in herring weight statistically explained by SSTs in the NA via the proposed effect chain amounts to only 1.5% (product of squared correlation coefficients listed by their Table 1). A direct coherence between both variables—herring weight and AMO—was not identified (DFH, their Figure 6). A cross-wavelet transform analysis, which would reveal common power instead of coherence between herring weight and AMO (Grinsted et al., 2004), was not shown.
To further illustrate our arguments, we have calculated Pearson's correlation coefficients between detrended time series for the period 1870-2009 (140 years) of (1) annual mean NA SSTs (HadISST, Rayner et al., 2003), (2) precipitation averaged over the Baltic Sea catchment area (9.6 to 32°E and 52.4 to 67.4°N) from the HiResAFF dataset (Schenk and Zorita, 2012), and (3) reconstructed river runoff integrated for the Baltic Sea catchment area (Meier et al., 2019b) applying a high- or low-pass filter with a cut-off period of 35 years. 35 years is the length of the shortest time series analyzed by DFH. Although the time series of 140 years investigated here are still too short for analyses of multidecadal variability, we found that all three low-pass filtered records show a pronounced periodicity of about 60–90 years. The low-pass filtered time series are anti-correlated with −0.4 (AMO and precipitation) and −0.7 (AMO and river runoff), where AMO is leading the other two time series with about 30 years (not shown). However, correlations between high-pass filtered (or unfiltered) NA SSTs and precipitation or river runoff data are statistically not significant. Using a cut-off period of 10 years, the correlations between low-pass time series are smaller than with a cut-off period of 35 years and statistically not significant. In this case, both precipitation and river runoff show an additional pronounced periodicity of about 30 years (Figure 2). Hence, variations of precipitation and river runoff on time scales smaller than 35 years cannot be explained by variations of NA SSTs.
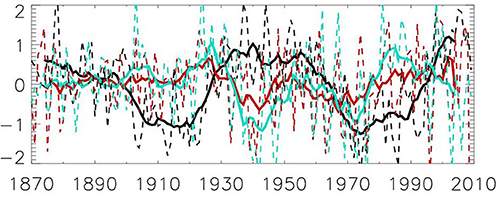
Figure 2. Detrended and normalized (with the standard deviation) anomalies for the period 1870-2009 (140 years) of (1) annual mean North Atlantic (NA) SSTs (HadISST, Rayner et al., 2003) (black lines), (2) precipitation averaged over the Baltic Sea catchment area (9.6 to 32°E and 52.4°N to 67.4°N) from the HiResAFF dataset (Schenk and Zorita, 2012) (red lines) and (3) reconstructed river runoff integrated for the Baltic Sea catchment area (Meier et al., 2019b) (blue lines). Solid and dashed lines indicate low-pass filtered (10-year running mean) and annual mean values, respectively.
The link between diet and herring weight will not be further discussed here. However, the contributions of other drivers for declining weight-at-age were discussed in the literature (e.g., Cardinale and Arrhenius, 2000), which includes fishing gear selectivity (Kuparinen et al., 2009) and food web interactions such as predation (Sparholt and Jensen, 1992) and competition (Casini et al., 2010).
Climate model ensemble projections suggest that depending on the model the freshwater supply from the catchment area will increase between 1 and 21% at the end of the century (Saraiva et al., 2019). Both surface and bottom salinities were projected to decrease by 0.6 g kg−1 in the ensemble mean with a large spread among the ensemble members (Saraiva et al., 2019). Intensity and frequency of saltwater inflows are projected to remain unchanged, with a potential tendency of a slight increase (Schimanke et al., 2014). Uncertainties in salinity projections are dominated by the incompletely understood response of the regional hydrological cycle and global mean sea level under climate change (Meier et al., 2018, 2019a).
Since past trends in salinity have been dominated by multidecadal variations, correlations between variables in the past may not necessarily hold in the future as underlying processes responsible for changes in salinity and other relevant environmental drivers of ecosystem structure and functioning might be different in future climate. Therefore, in this case, statistical approaches may be inappropriate for projections of future herring weight.
Data Availability Statement
Precipitation (Schenk and Zorita, 2012) and river runoff (Meier et al., 2019b) data are available from the corresponding authors of the cited literature upon request.
Author Contributions
The general commentary was discussed by all co-authors. HM wrote the first draft of the manuscript and all co-authors contributed, edited and approved the submitted version. FB produced Figure 1 based on HadISST data and HM produced Figure 2 based on HadISST, HiResAFF and river runoff data.
Conflict of Interest
The authors declare that the research was conducted in the absence of any commercial or financial relationships that could be construed as a potential conflict of interest.
Acknowledgments
The research presented in this study is part of the Baltic Earth program (Earth System Science for the Baltic Sea region, see http://www.baltic.earth). Sea surface temperature data from the Met Office, Hadley Centre have been used (HadISST 1.1 - Global sea-Ice coverage and SST (1870-2018). NCAS British Atmospheric Data Centre, 2006, Date of citation: 2019-06-29. Available from http://badc.nerc.ac.uk/view/badc.nerc.ac.uk__ATOM__dataent_hadisst).
References
Barnston, A. G., and Livezey, R. E. (1987). Classification, seasonality and persistence of low-frequency atmospheric circulation patterns. Mon. Weather Rev. 115, 1083–1126. doi: 10.1175/1520-0493(1987)115<1083:CSAPOL>2.0.CO;2
Börgel, F., Frauen, C., Neumann, T., Schimanke, S., and Meier, H. E. M. (2018). Impact of the Atlantic multidecadal oscillation on Baltic Sea variability. Geophys. Res. Lett. 45, 9880–9888. doi: 10.1029/2018GL078943
Cardinale, M., and Arrhenius, F. (2000). The influence of stock structure and environmental conditions on the recruitment process of Baltic cod estimated using a generalized additive model. Can. J. Fish. Aquat. Sci. 57, 2402–2409. doi: 10.1139/f00-221
Casini, M., Bartolino, V., Molinero, J. C., and Kornilovs, G. (2010). Linking fisheries, trophic interactions and climate: threshold dynamics drive herring Clupea harengus growth in the central Baltic Sea. Mar. Ecol. Prog. Ser. 413, 241–252. doi: 10.3354/meps08592
Clement, A., Bellomo, K., Murphy, L. N., Cane, M. A., Mauritsen, T., Rädel, G., et al. (2015). The Atlantic Multidecadal Oscillation without a role for ocean circulation. Science 350, 320–324. doi: 10.1126/science.aab3980
Delworth, T. L., and Zeng, F. (2016). The impact of the North Atlantic Oscillation on climate through its influence on the Atlantic Meridional Overturning Circulation. J Clim. 29, 941–962. doi: 10.1175/JCLI-D-15-0396.1
Dippner, J. W., Fründt, B., and Hammer, C. (2019). Lake or sea? The unknown future of central Baltic Sea herring. Front. Ecol. Evol. 7:143. doi: 10.3389/fevo.2019.00143
Enfield, D. B., Mestas-Nunez, A. M., and Trimble, P. J. (2001). The Atlantic Multidecadal Oscillation and its relation to rainfall and river flows in the continental U.S. Geophys. Res. Lett. 28, 2077–2080. doi: 10.1029/2000GL012745
Grinsted, A., Moore, J. C., and Jevrejeva, S. (2004). Application of the cross wavelet transform and wavelet coherence to geophysical time series. Nonlinear Process. Geophys. 11, 561–566. doi: 10.5194/npg-11-561-2004
Hurrell, J. W. (1995). Decadal trends in the North Atlantic Oscillation: regional temperatures and precipitation. Science 269, 676–679. doi: 10.1126/science.269.5224.676
Hurrell, J. W., Kushnir, Y., Ottersen, G., and Visbeck, M. (2003). “An overview of the North Atlantic Oscillation,” in The North Atlantic Oscillation: Climatic Significance and Environmental Impact, eds. J. W. Hurrell, Y. Kushnir, G. Ottersen, and M. Visbeck (Geophysical Monograph - American Geophysical Union), 134, 1–36.
Kauker, F., and Meier, H. E. M. (2003). Modeling decadal variability of the Baltic Sea: 1. Reconstructing atmospheric surface data for the period 1902-1998. J. Geophys. Res. 108:3267. doi: 10.1029/2003JC001797
Kniebusch, M., Meier, H. E. M., and Neumann, T. (2019a). Temperature variability of the Baltic Sea since 1850 in model simulations and observations and attribution to atmospheric forcing. J. Geophys. Res. Oceans 124, 4168–4187. doi: 10.1029/2018JC013948
Kniebusch, M., Meier, H. E. M., and Radtke, H. (2019b). Changing salinity gradients in the Baltic Sea as a consequence of altered freshwater budgets. Geophys. Res. Lett. 46, 9739–9747. doi: 10.1029/2019GL083902
Knight, J. R., Folland, C. K., and Scaife, A. A. (2006). Climate impacts of the Atlantic Multidecadal Oscillation. Geophys. Res. Lett. 33. doi: 10.1029/2006GL026242
Kuparinen, A., Kuikka, S., and Merilä, J. (2009). Estimating fisheries-induced selection: traditional gear selectivity research meets fisheries-induced evolution. Evol. Appl. 2, 234–243. doi: 10.1111/j.1752-4571.2009.00070.x
Liblik, T., and Lips, U. (2019). Stratification has strengthened in the Baltic Sea–an analysis of 35 years of observational data. Front. Earth Sci. 7:174. doi: 10.3389/feart.2019.00174
Meier, H. E. M., Edman, M. K., Eilola, K. M., Placke, M., Neumann, T., Andersson, H. S.-E., et al. (2018). Assessment of eutrophication abatement scenarios for the Baltic Sea by multi-model ensemble simulations. Front. Mar. Sci. 5:440. doi: 10.3389/fmars.2018.00440
Meier, H. E. M., Edman, M. K., Eilola, K. M., Placke, M., Neumann, T., Andersson, H. S.-E., et al. (2019a). Assessment of uncertainties in scenario simulations of biogeochemical cycles in the Baltic Sea. Front. Mar. Sci. 6:46. doi: 10.3389/fmars.2019.00046
Meier, H. E. M., Eilola, K., Almroth-Rosell, E., Schimanke, S., Kniebusch, M., Höglund, A., et al. (2019b). Disentangling the impact of nutrient load and climate changes on Baltic Sea hypoxia and eutrophication since 1850. Clim. Dyn. 53, 1145–1166. doi: 10.1007/s00382-018-4296-y
Meier, H. E. M., and Kauker, F. (2002). Simulating Baltic Sea Climate for the Period 1902-1998 With the Rossby Centre Coupled Ice-Ocean Model. Reports Oceanography No.30, SMHI. Norrköping, 111.
Meier, H. E. M., and Kauker, F. (2003). Modeling decadal variability of the Baltic Sea: 2. Role of freshwater inflow and large-scale atmospheric circulation for salinity. J. Geophys. Res. 108:3368. doi: 10.1029/2003JC001799
Rayner, N. A. A., Parker, D. E., Horton, E. B., Folland, C. K., Alexander, L. V., Rowell, D. P., et al. (2003). Global analyses of sea surface temperature, sea ice, and night marine air temperature since the late nineteenth century. J. Geophys. Res. Atmos. 108. doi: 10.1029/2002JD002670
Saraiva, S., Meier, H. E. M., Andersson, H. C., Höglund, A., Dieterich, C., Gröger, M., et al. (2019). Uncertainties in projections of the Baltic Sea ecosystem driven by an ensemble of global climate models. Front. Earth Sci. 6:244. doi: 10.3389/feart.2018.00244
Schenk, F., and Zorita, E. (2012). Reconstruction of high resolution atmospheric fields for Northern Europe using analog-upscaling. Clim. Past 8:1681. doi: 10.5194/cp-8-1681-2012
Schimanke, S., Dieterich, C., and Meier, H. E. M. (2014). An algorithm based on sea-level pressure fluctuations to identify major Baltic inflow events. Tellus A Dyn. Meteorol. Oceanogr. 66, 23452. doi: 10.3402/tellusa.v66.23452
Schlesinger, M. E., and Ramankutty, N. (1994). An oscillation in the global climate system of period 65–70 years. Nature 367, 723. doi: 10.1038/367723a0
Sparholt, H., and Jensen, I. B. (1992). The effect of cod predation on the weight-at-age of herring in the Baltic. ICES Mar. Sci. 195, 488–491.
Sutton, R. T., and Hodson, D. L. (2005). Atlantic Ocean forcing of North American and European summer climate. Science 309, 115–118. doi: 10.1126/science.1109496
Keywords: Atlantic Multidecadal Oscillation, North Atlantic Oscillation, climate change, natural variability, Baltic Sea, Central Baltic Sea Herring
Citation: Meier HEM, Börgel F, Frauen C and Radtke H (2020) Commentary: Lake or Sea? The Unknown Future of Central Baltic Sea Herring. Front. Ecol. Evol. 8:55. doi: 10.3389/fevo.2020.00055
Received: 29 June 2019; Accepted: 19 February 2020;
Published: 03 March 2020.
Edited by:
Tomas Halenka, Charles University, CzechiaReviewed by:
Agneta Andersson, Umeå University, SwedenCopyright © 2020 Meier, Börgel, Frauen and Radtke. This is an open-access article distributed under the terms of the Creative Commons Attribution License (CC BY). The use, distribution or reproduction in other forums is permitted, provided the original author(s) and the copyright owner(s) are credited and that the original publication in this journal is cited, in accordance with accepted academic practice. No use, distribution or reproduction is permitted which does not comply with these terms.
*Correspondence: H. E. Markus Meier, bWFya3VzLm1laWVyQGlvLXdhcm5lbXVlbmRlLmRl