
94% of researchers rate our articles as excellent or good
Learn more about the work of our research integrity team to safeguard the quality of each article we publish.
Find out more
ORIGINAL RESEARCH article
Front. Ecol. Evol. , 30 April 2019
Sec. Interdisciplinary Climate Studies
Volume 7 - 2019 | https://doi.org/10.3389/fevo.2019.00143
A commentary has been posted on this article:
Commentary: Lake or Sea? The Unknown Future of Central Baltic Sea Herring
The understanding of natural variability of harvestable fish stocks is of fundamental interest for their management; however, time series are often biased by the impact of fisheries. Observations suggest that the mean weight of central Baltic Sea herring (Clupea harengus), a quantity unbiased by fisheries, is indirectly influenced by the Atlantic Multi-decadal Oscillation (AMO) via a complex mediator chain, in which a transition from a marine to a freshwater state plays a major role. This observed trend is also projected for the future in regional climate change scenarios. The consequence of increasing precipitation is a reduction in the marine habitat, a change in the prey community and a decrease in the mean weight of 3-year-old central Baltic Sea herring from 50 to 70 g in the late 1970s to 25–30 g today. The reduction in weight over this period represents a reduction in landings of approximately one million tons of herring and an economic loss of the order of €100 million.
Global fish production is under threat from overexploitation and climate change (Jackson et al., 2001; Drinkwater et al., 2003; Brander, 2007, 2010). The strongest impact from climate variability occurs in northern areas like the Barents and Baltic Sea (ACIA, 2015), as well as in enclosed areas, e.g., the Black and Baltic Seas (BACC Author Team, 2008; Philippart et al., 2011). The Baltic Sea is an intra-continental dilution basin with a total area of 415,000 km2 (including Kattegat, Figure 1) that has a highly productive but low-diversity ecosystem with cod, sprat, and herring as top predators. It is also characterized by a closed basin circulation (Voss et al., 2005) and by strong horizontal and vertical gradients in salinity and in ecosystem variables. The distribution of salinity is responsible for the low biodiversity of the Baltic Sea with marine species at the entrance to the North Sea decreasing eastwards and ultimately replaced by freshwater species in the inner reaches. A local minimum in species numbers occurs in the 5–7 salinity range (Remane, 1934).
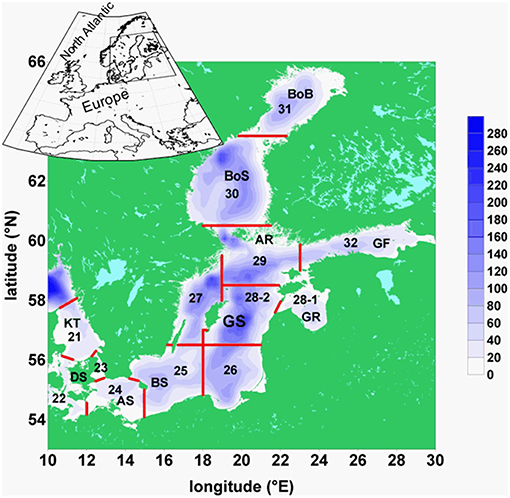
Figure 1. Map of the Baltic Sea: Baltic Sea topography, its basins, and ICES subdivisions: BoB, Bothnian Bay; BoS, Bothnian Sea; AR, Archipelago Sea; GF, Gulf of Finland; GR, Gulf of Riga; GS, Gotland Sea; BS, Bornholm Sea; AS, Arkona Sea; DS, Danish Sounds; KT. Kattegat. The red lines separate the areas of ICES subdivisions, numbered from 21 to 32.
Inter-annual and inter-decadal variability of the Baltic Sea is influenced by the climate variability of the Northern Hemisphere and by major Baltic inflows of water with high salinity and oxygen from the North Atlantic passing through the North Sea into the deeper parts of the Central Baltic Sea (Matthäus and Frank, 1992). The Baltic Sea ecosystem has been shown to be strongly influenced by the interplay of non-periodic shifts from freshwater to marine conditions and back during the early Holocene. These shifts resulted in changes in the relative composition of marine and freshwater species as well as cold and warm water taxa, in the occasional intrusion of non-indigenous species, and changes between oxygen-rich and -poor conditions in the deep basins (BACC Author Team, 2008).
In this paper we show that the decrease in the mean weight of 3-year-old central Baltic Sea herring is caused by climate variability via a complex mediator chain described in the following.
The following time series (Figure 2) were used for the analysis:
A: the Atlantic Multi-decadal Oscillation (AMO) index from 1856 to 2010 defined as the monthly detrended sea surface temperature (SST) anomalies in the North Atlantic area weighted from 0 to 70°N (Enfield et al., 2001).
B: monthly anomalies of precipitation for the period 1948–2013 in the area 10-40°E and 54-70°N from NCAR/NCEP reanalysis (Kalnay et al., 1996). To consider the complex geometry of the Baltic catchment area and the patchy distribution of the precipitation patterns (Figure 3), the whole catchment area was divided into 10 slabs. For each slab the precipitation data were extracted from NCEP/NCAR reanalysis data sets and area weighted. The data were averaged over 1 year. For the 10 slabs, an Empirical Orthogonal Function (EOF) analysis was performed. The 1st EOF has an amount of explained variance of 72.2% and the 2nd mode of 14.5%. Combining the two leading EOF modes to a Canonical Correlation Analysis (CCA) pattern, the corresponding principal component of the CCA pattern serves as the precipitation time series.
C: monthly mean runoff data for the whole Baltic Sea area for the period 1921–2010 were compiled by the SMHI (Bergström and Carlsson, 1994) for the period 1950–1993, extended into the past for the period 1921–1949 by the runoff data of Mikulski (1982) and extended later up to 2010 (Kronsell and Andersson, 2012). The cumulative river runoff integrated over all rivers draining into the Baltic Sea was averaged over 1 year.
D: monthly mean salinity data on oceanographic standard depth has been compiled on 1 × 1° grid for the period 1950–2005 for the whole Baltic Sea (Feistel et al., 2008). We used the salinity data of the upper 30 m from the Gotland Sea averaged over 1 year and performed an EOF analysis. 30 m are the long-term mean depth of thermocline. The corresponding principal component served as the salinity time series.
E: spring values of mesozooplankton for the period 1960–2008 from ICES subdivision SD 28-2 (Figure 1). From these Latvian monitoring data (Kornilovs et al., 2001), we selected the average biomass (Hernroth, 1985) of the adults of Pseudocalanus acuspes in spring of the depth interval 0–150 m. Pseudocalanus sp. is considered as the favorite food of herring in the North Sea as well as in the Central Baltic Sea (Möllmann et al., 2003; Alvarez-Fernandez et al., 2015).
F: yearly values of weighted mean weight of 3-year-old herring of the central Baltic Sea from the ICES subdivision 25–27, 28–2, 29, and 32 (Figure 1) for the period 1974–2010. The data were collected at the Baltic International Trawl Surveys (BITS), which cover the entire distribution area of Baltic Sea cod, is carried out bi-annually and is coordinated by ICES. During this survey, representative samples were taken at randomly carried out trawl stations. At each station, 10 fishes of each cm-class were sub-sampled, length-measured, weighted, sexed and aged.
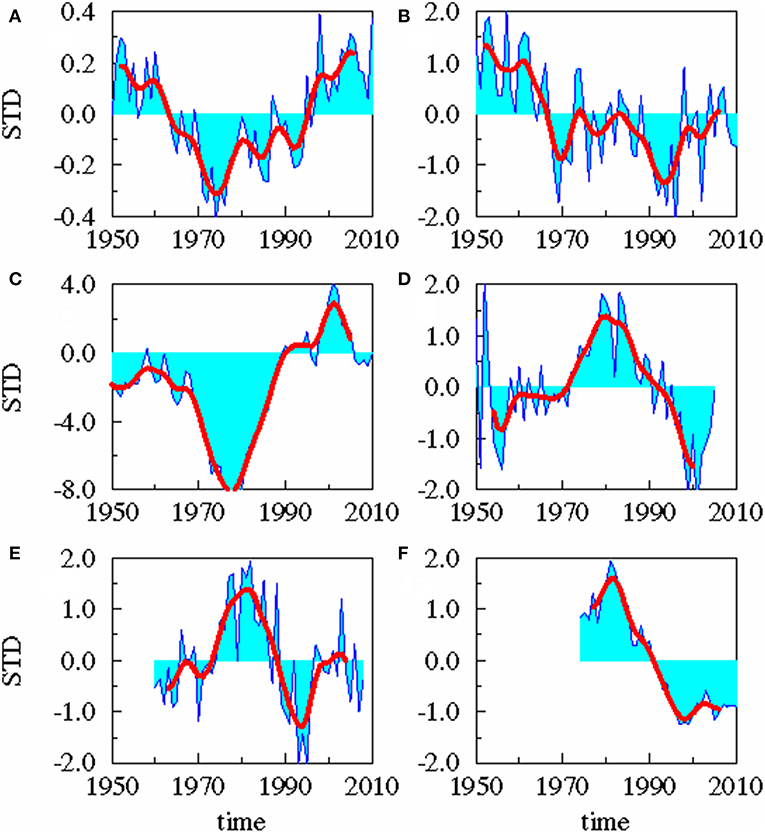
Figure 2. Time series. Standardized yearly mean anomalies of AMO (A), area averaged precipitation (B), cumulative river runoff (C), salinity in the upper 30 m of the Gotland Sea (D), zooplankton spring biomass of P. acuspes (E), and mean weight of 3 years old herring (F). The thick red line is low-pass filtered with a cut off period of 10 years.
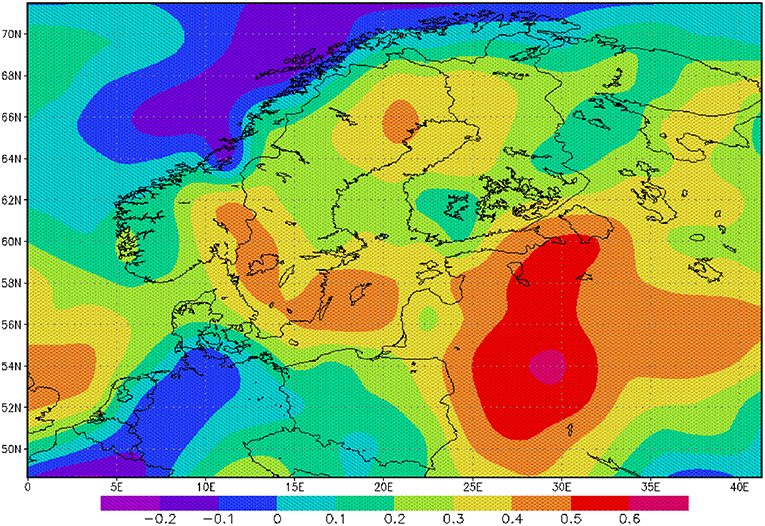
Figure 3. Correlation between AMO and precipitation rate: The correlation is based on monthly mean anomalies for the period 1950–2000.
Statistical downscaling methods, correlation analysis and analysis of complex wavelet coherencies were applied to the datasets. Statistical downscaling methods provides patterns of predictors and predictands in a noise truncated EOF space, which are optimally correlated with each other. In contrast, wavelet coherencies and phase differences allow the identification of periods of synchronous behavior between the time series in a time-frequency space. Statistical downscaling identifies lags and correlations, whereas wavelet coherence and phase identify the dominant modes of variability and how these modes vary with time. In this sense both methods are mutually complementary.
Statistical downscaling method (von Storch et al., 1993) was used to detect relationships between climate predictors and regional predictands. First, EOFs of the anomalies of global climate predictors and the anomalies of local predictands , both of which are functions of space x and time t, are calculated.
Thus, the major part of the variance from a multidimensional vector is concentrated in a few new dimensions, the leading eigenmodes. The advantages are that the dimensionality of the model is kept low and noise is reduced. Second, a CCA is performed between the leading eigenmodes in a way that the time series are optimally correlated with each other. Hence the regional time series can be regressed from the climate predictor.
where ρ is the correlation coefficient. Model validation was done by cross-validation technique (Michaelsen, 1987) and by Monte Carlo technique (Livezey, 1995). A detailed description of the method is provided in Dippner et al. (2001).
Spatial correlation pattern between AMO and precipitation patterns were computed using the standard web routine of NCEP/NCAR.
The wavelet transform can be used to analyse time series that contain non-stationary power at many different frequencies (Daubechies, 1990; Lau and Weng, 1995). The wavelet transform of a time series γ(t) with respect to the wavelet ψ is defined as:
where the asterisk denotes complex conjugation and s is a scale, which is linearly related to the characteristic period of the wavelet. The wavelet transform decomposes the time series into time-frequency space. Varying the wavelet scale s allows the identification of both the dominant modes of variability and how these modes vary with time. According to Torrence and Compo (1998), we used a complex Morlet wavelet (Morlet, 1983). The advantage of the Morlet wavelet is its complex nature, which allows to detect both, time-dependent amplitude and phase for different frequencies in the time series (Farge, 1992). These wavelets were used to construct coherencies and phase differences to identify periods of synchronous behavior between time series (Jevrejeva et al., 2003). For analyzing the covariance of two time series we use the definitions of Torrence and Compo (1998) to compute cross wavelet spectrum of two time series γ and λ with wavelet transforms Wγ and Wλ as
where the asterisk marks complex conjugation, and the wavelet coherence as:
S is a smoothing factor. Details are given in Jevrejeva et al. (2003). Following Torrence and Compo (1998), the corresponding coherence phase is defined as:
Here ℜ and ℑ are the real and imaginary part of the complex cross wavelet spectrum. The wavelet coherence is a measure of the intensity of the covariance and the phase angle describes the phase relationship of the two time series γ and λ in the time-frequency space. The statistical significance is estimated against a red noise model (Torrence and Compo, 1998).
A statistical downscaling between the time series (Figure 4; Table 1) shows a significant correlation between the AMO and precipitation over the catchment area without any time lag. AMO and river runoff show a time lag of between −2 and 0 years and the rain and river runoff of −1 year. The three identified relationships between AMO and river runoff (lag = −2, −1, 0) have all the same correlation coefficient r and the same skill β (Table 1). Cumulative river runoff and salinity in the Gotland Sea are highly correlated with a lag of between −4 and −3 years, the time taken by the rain in the catchment to reach the central Gotland Sea. Here again both identified relationships have the same correlation coefficient and the same skill. Salinity and P. acuspes are weakly correlated with a lag of −1 year, as are the zooplankton and the herring weight, which show a time lag of −3 to 0 years. This lag is meaningful regarding the weight of 3-year-old herring. The four identified relationships (lag = −3, −2, −1, 0) have slightly different correlation coefficients (r = 0.66, 0.64, 0.59, 0.63) and different skills (β = 0.41, 0.39, 0.33, 0.37). The combination with the highest values (lag = −3) is used. The red filtered curves in Figure 2 show a strong similarity in their inter-decadal variability, which is comparable to the identified long-term trends across different trophic levels in the North Sea (Aebischer et al., 1990).
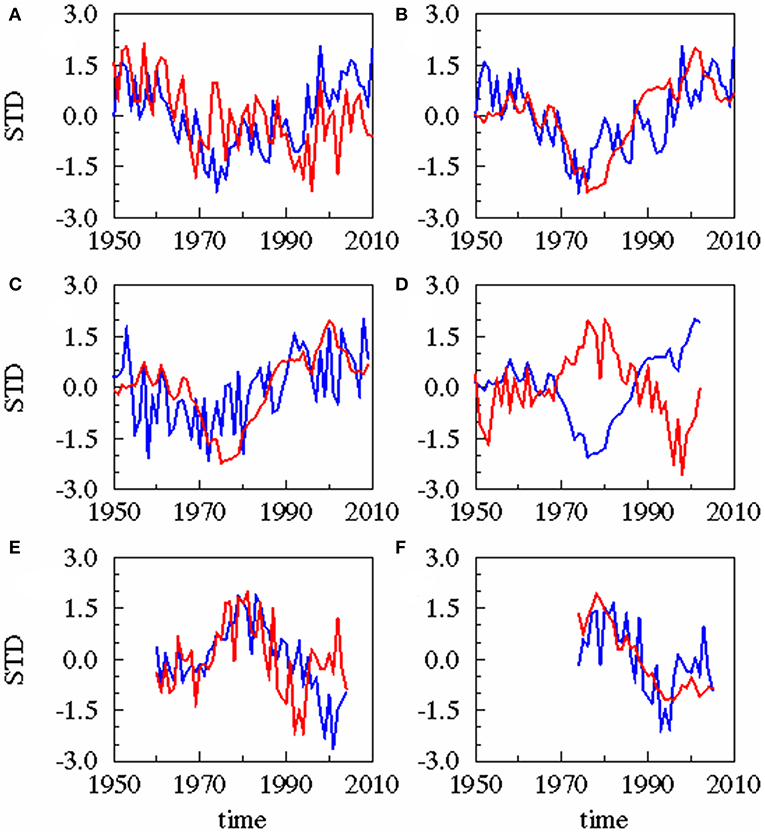
Figure 4. Results of statistical downscaling experiment: Principle Component of the 1st Canonical Correlation Analysis (CCA) patterns of predictor (blue) and predictand (red). All experiments are based on annual averaged time series. Different time lags exist for these combinations. (A) AMO (blue), precipitation (red), lag = 0 year; (B) AMO (blue), cumulative river runoff (red), lag = −2 years; (C) precipitation (blue), cumulative river runoff (red), lag = −1 year; (D) cumulative river runoff (blue), salinity (red), lag = −3 years; (E) salinity (blue), zooplankton spring biomass of P. acuspes (red), lag = −1 year; (F) zooplankton (blue) herring weight (red), lag = −3 years. Lag, correlation, skill, and significance are also given in Table 1.
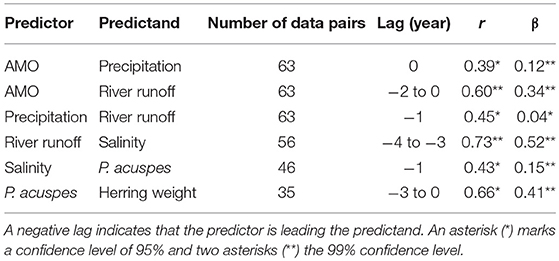
Table 1. The table displays the results of the statistical downscaling: the predictor and predictand, the time lag in year, the CCA correlation coefficient r and the Brier based skill score β (Livezey, 1995).
The results of the downscaling experiment are supported by a complex wavelet analysis, which suggests that the AMO forces the precipitation over the Baltic Sea catchment directly without phase difference (Figure 5A), whereas river runoff is hardly linked to the AMO (Figure 5B). This might be related to the result that the cumulative river runoff responds to the precipitation with an additional time lag of ~3 years (phase difference 270°) in lower periods (~4 years; Figure 5C). A small gap exists in the coherence between the cumulative river runoff and the precipitation from the end of the 1970s to the end of the 1980s. This coincides with the period of negative North Atlantic Oscillation (NAO) index (Reid et al., 2001; Dippner et al., 2014). A correlation of the river runoff with the salinity in the upper 30 m in the Gotland Sea only exists since the 1980s on periods of 8 to 15 years with a time lag of 4 years (Figure 5D). Long-term influences of the salinity on the mesozooplankton biomass can only be seen from the 1990s; however, although this result is statistically significant (Figure 5E), it cannot be interpreted because it is in the area of the cone of influence and therefore, the amplitude of coherence is influenced by boundary effects due to zero padding (Torrence and Compo, 1998). The mesozooplankton biomass is directly correlated to the weight of herring on periods of < 4 years (Figure 5F). Here a shift in the response period can be identified from 4 years to 1 year and back to 4 years. The short response period of 1 year between mesozooplankton biomass and herring weight coincides with the period of positive NAO index (Reid et al., 2001; Dippner et al., 2014).
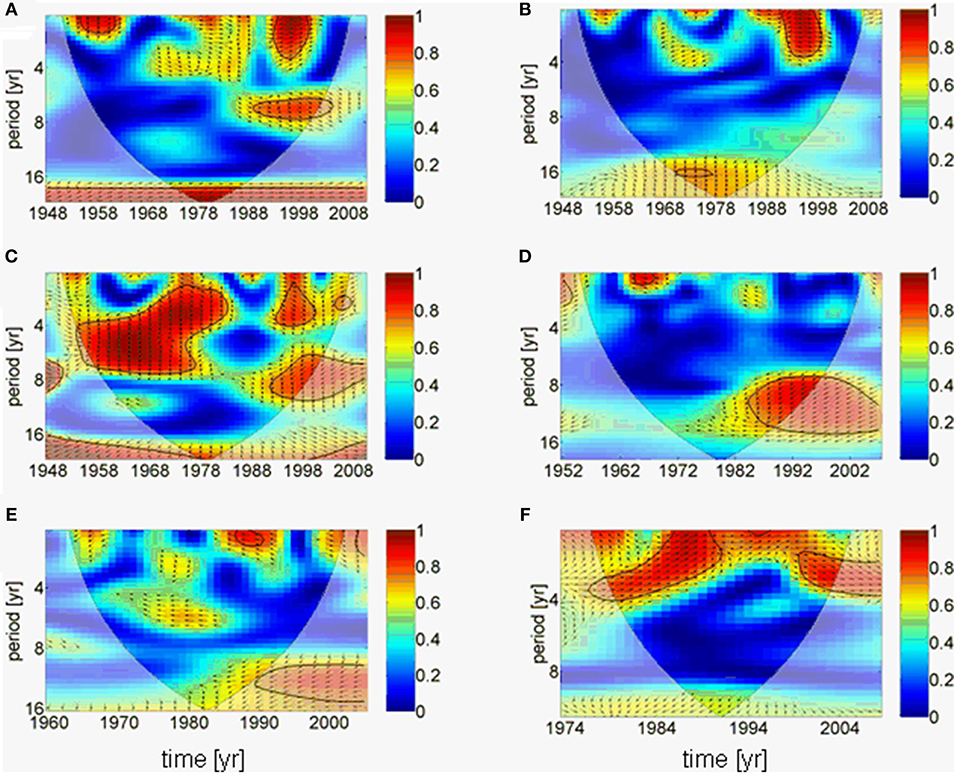
Figure 5. Results of wavelet coherence and phase between different time series as function of time. Contours are wavelet squared coherencies. The vectors indicate the phase difference between time series (a horizontal arrow pointing from left to right signifies in phase and an arrow pointing vertically upward means the second series lags the first by 90°, i.e., the phase angle is 270°). The thick black line is the 5% significance level using the red noise model and the opaque area indicates the cone of influence. (A) AMO and precipitation, (B) AMO and cumulative river runoff, (C) precipitation and cumulative river runoff, (D) cumulative river runoff and salinity, (E) salinity and zooplankton spring biomass, (F) zooplankton spring biomass and herring weight. All wavelets are based on annual averaged time series.
The sea surface temperature (SST) of the North Atlantic has a distinct signal of multi-decadal variability (Schlesinger and Ramankutty, 1994). The AMO and its index are defined as the 10-years running mean of the detrended Atlantic SST anomaly of the Northern Hemisphere (Kerr, 2000). A positive AMO anomaly or a positive SST anomaly in the North Atlantic favors broad cyclonic pressure anomalies (Knight et al., 2006) and is related to a lower mean sea level pressure and higher rainfall in North West Europe during summer (Sutton and Hodson, 2005). Monthly mean precipitation over the catchment area of the Baltic Sea for the period 1950–2000 is significantly correlated to the AMO index for the whole year (Figure 3) indicating a heterogeneous and patchy distribution. Our findings also demonstrate that the effects of increasing rainfall originating in the 1970s have sustained for some decades (Figure 4B). The change in the mid 1970s might be explained by a regime shift of climatic origin, as the trend in the AMO has reversed (Kerr, 2000; Dima and Lohmann, 2007). After the regime shift in 1988/1989 (Reid et al., 2001; Dippner et al., 2014), two further processes might have caused additional warming of the North Atlantic, which also might contribute to increased rainfall in North West Europe. The observed weakening of the sub-polar gyre allowed subtropical warm water to extend farther to the north (Hátún et al., 2005). This period was also characterized by a warming caused by an increased heat transport from the tropics to the extra-tropics (Hoerling et al., 2001). The consequence was a significant increase in precipitation, which caused an increase in total river runoff (Knight et al., 2006), decreasing salinity, resulting in a shift in habitat for marine species, and lower biomass of P. acuspes in the Baltic Sea (Vuorinen et al., 2015). Previous studies have reported that a reduction in the salinity (Casini et al., 2010) of the Gotland Sea (Figure 1) is forced by the NAO and impacts marine copepod abundance and total freshwater runoff (Hänninen et al., 2000). Our investigations do not support these findings. An direct association between herring conditions and salinity has been documented by various authors (Rönkkönen et al., 2004; Casini et al., 2010). However, we could not identify a direct link between the NAO winter index and decreasing salinity or the abundance of P. acuspes. Climate signals have been identified in different mesozooplankton species, but never in Pseudocalanus sp. (Dippner et al., 2000, 2012). However, a significant correlation has been identified between the abundance of P. minutes and the herring recruitment in the Gulf of Finland (Dippner et al., 2001). It seems that our findings support the conclusion of Rajasilta et al. (2018) who argued that salinity acts as background signal that affects fish indirectly through changes in the prey community and fish diet.
The trend of reducing salinity might continue into the future. Different climate change emissions scenarios (IPCC SRES A2 or B2) with regional climate models for the Baltic Sea (Meier et al., 2006; BACC Author Team, 2008) project a decline in salinity of between 8 and 50%. This is likely to lead to a further reduction in habitat availability for marine species (Vuorinen et al., 2015) and even lower abundance and biomass of the marine copepod P. acuspes, the favorite food for central Baltic Sea herring. A continuation of this development might end in a similar situation to that occurring in the early Holocene: a freshwater Baltic Sea.
Two apparently contrasting hypotheses of herring growth regulation, so-called unspecified “hydro-climatic factors” and inter-specific density dependence, have been recently presented (Casini et al., 2010). Spawning stock biomass of sprat, the main food competitor for herring, were increasing up to 1997 (BACC Author Team, 2008), which might explain the reduction in herring weight. However, after 1997 the spawning stock biomass of sprat declined with no positive impact on the weight of herring. Observations in the Gulf of Finland (Figure 1) have shown that a density dependent mechanism is unlikely to have been the cause of the changes in herring weight at age (Rönkkönen et al., 2004); in this region zooplankton community structure changed supporting the theory of bottom-up control. Therefore, we conclude that the weight of herring was controlled by climatic and physical factors, i.e., an indirect mediator chain from the AMO via precipitation, river runoff, and a decrease in salinity (Dippner, 2006). This led to a reduction in habitat available to marine copepods with a lower spring biomass (Möllmann et al., 2009), which affected the weight of central Baltic Sea herring. Due to different time lags a direct coherence between the AMO and herring weight cannot be identified (Figure 6), except for a weak signal around 1984, meaning that any trophic interaction between fish and plankton was likely to be indirect and climate driven (Aebischer et al., 1990).
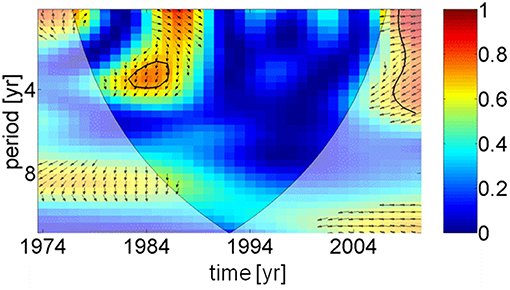
Figure 6. Wavelet coherence and phase between AMO index and herring weight as function of time. For explanation see Figure 5. Except in 1984, the figure indicates that no direct coherence exists between the temperature in the North Atlantic and the weight of 3 years old herring in the Baltic Sea.
Fluctuations in harvestable fish stocks have major economic consequences for human society. The observed reduction in the mean weight of central Baltic Sea herring from 50 to 70 g in the late 1970s to 25–30 g today has resulted in a catch deficit in the weight of fish over this period. This deficit is equivalent to one million tons of herring (by weight), includes a decline in the quality of fish, and represents a strong reduction in ecosystems goods and services. Using a net price of 0.1 € kg−1 according to the European Parliament Report “Industrial Fisheries in the Baltic Sea,” the loss in catch is equivalent to ~100 million € (Lassen, 2011).
Herring in the Central Baltic Sea is managed by means of a special management plan that is in accordance to the maximum sustainable yield concept (ICES Advice, 2014). With decreasing fishing mortality the stock has shown signs of increasing stock biomass since the mid 2000s, although this was not accompanied by an increase in mean weight. The difference between the actual and the potential condition are not only a direct loss to the economy (catch) and ecology (prey) but also a loss in product quality (reduced fat content). Even though fisheries management is one of the few levers human have for “managing” ecosystems like the Baltic Sea, our results show that these attempts may have limited impact when overruled by extrinsic factors such as climate change.
JD performed the statistical downscaling and BF the wavelet analysis. JD, BF, and CH contributed to the writing of the main text.
The authors declare that the research was conducted in the absence of any commercial or financial relationships that could be construed as a potential conflict of interest.
This paper is a contribution to the BONUS+ ERANET Project AMBER (BMBF Project No. 03F0485A). Additional support was received by the Open Access Fund of the Leibniz Association. Cross-wavelet and wavelet coherence software were provided by A. Grinsted. NCEP Reanalysis data provided by the NOAA/OAR/ESRL PSD, Boulder, Colorado, USA, from their Web site at https://www.esrl.noaa.gov/psd/. The authors are indebted to Chris Reid, Katharina Six, and Maren Voss for helpful comments on the manuscript.
Aebischer, N. J., Coulson, J. C., and Colebrook, J. M. (1990). Parallel long-term trends across four marine trophic levels and weather. Nature 347, 753–755.
Alvarez-Fernandez, S., Licandro, P., van Damme, C. J. G., and Hufnagl, M. (2015). Effect of zooplankton on fish larvae abundance and distribution: a long-term study on North Sea herring (Clupea harengus). ICES J. Mar. Sci. 72, 2569–2577. doi: 10.1093/icesjms/fsv140
BACC Author Team (2008) “Assessment of climate change in the Baltic Sea Basin,” in Regional Climate Studies (Springer Verlag Heidelberg) 473 p.
Bergström, S., and Carlsson, B. (1994). River runoff to the Baltic Sea: 1950–1990. Ambio 23, 280–287.
Brander, K. (2010). Impacts of climate change on fisheries. J. Mar. Syst. 79, 389–402. doi: 10.1016/j.jmarsys.2008.12.015
Brander, K. M. (2007). Global fish production and climate change. Proc. Natl. Acad. Sci. U.S.A. 104, 19709–199714. doi: 10.1073/pnas.0702059104
Casini, M., Bartolino, V., Molinero, J. C., and Kornilovs, G. (2010). Linking fisheries, trophic interactions and climate: threshold dynamics drive herring Clupea harengus growth in the central Baltic Sea. Mar. Ecol. Prog. Ser. 413, 241–252. doi: 10.3354/meps08592
Daubechies, I. (1990). The wavelet transform, time-frequency localization and signal analysis. IEEE Trans. Inform. Theory 36, 961–1005.
Dima, M., and Lohmann, G. (2007). Hemisphere mechanism for the Atlantic multidecadal Oscillation. J. Clim. 20:2706. doi: 10.1175/JCLI4174.1
Dippner, J. W. (2006). Future Aspects in Marine Ecosystem modelling. J. Mar. Syst. 61, 246–267. doi: 10.1016/j.jmarsys.2005.06.005
Dippner, J. W., Hänninen, J., Kuosa, H., and Vuorinen, I. (2001). The influence of climate variability on zooplankton abundance in the Northen Baltic Archipelago Sea (SW Finland). ICES J. Mar. Sci. 58. 569–578. doi: 10.1006/jmsc.2001.1048
Dippner, J. W., Kornilovs, G., and Junker, K. (2012). A multivariate Baltic Sea Environmental index. Ambio 41, 699–708. doi: 10.1007/s13280-012-0260-y
Dippner, J. W., Kornilovs, G., and Sidrevics, L. (2000). Long-term variability of mesozooplankton in the Central Baltic Sea. J. Mar. Syst. 25, 23–31. doi: 10.1016/S0924-7963(00)00006-3
Dippner, J. W., Möller, C., and Kröncke, I. (2014). Loss of persistence of the North Atlantic Oscillation and its biological implication. Front. Ecol. Evol. 2:57. doi: 10.3389/fevo.2014.00057
Drinkwater, K. F., Belgano, A., Borja, A., Conversi, A., Edwards, M., Green, C. H., et al. (2003). “The response of marine ecosystems to climate variability associated with the North Atlantic Oscillation,” in The North Atlantic Oscillation, Climatic Significance and Environmental Impact, Vol. 134. eds J. W. Hurrell, Y. Kushnir, G. Ottersen, and M. Visbeck (Washington, DC: AGU Geophysical Monograph Series), 211–234.
Enfield, D. B., Mestas-Nunez, A. M., and Trimble, P. J. (2001). The Atlantic multidecadal oscillation and its relation to rainfall and river flows in the continental U.S. Geophys. Res. Lett. 28, 2077–2080. doi: 10.1029/2000GL0127
Farge, M. (1992). Wavelet transforms and their applications to turbulence. Ann. Rev. Fluid Mech. 24, 395–457.
Feistel, R., Nausch, G., and Wasmund, N. (2008). State and Evolution of the Baltic Sea 1952-2005 – A Detailed 50 Year Survey of Meteorology and Climate, Physics, Chemistry Biology, and Marine Environment. Hoboken, NJ: Wiley-Interscience, John Wiley and Sons Inc. 703p.
Hänninen, J., Vuorinen, I., and Hjelt, P. (2000). Climatic factors in the Atlantic control the oceanographic and ecological changes in the Baltic Sea. Limnol. Oceanogr. 45, 703–710. doi: 10.4319/lo.2000.45.3.0703
Hátún, H., Sandø, A. B., Drange, H., Hansen, B., and Valdimarsson, H. (2005). Influence of the Atlantic Subpolar Gyre on the thermohaline circulation. Science 309, 1841–1844. doi: 10.1126/science.1114777
Hernroth, L. (1985). Recommendations on methods for marine biological studies in the Baltic Sea. Mesozooplankton biomass assessment. Baltic Mar. Biol. 10, 1–32.
Hoerling, M. P., Hurrell, J. W., and Xu, T. (2001). Tropical origin for recent North Atlantic climate change. Science 292, 90–92. doi: 10.1126/science.1058582
ICES Advice (2014). Herring in Subdivision 25-29 and 32 (Excluding Gulf of Riga). Availablre online at:http://wwww.ices.dk/sites/pub/Publication%20Reports/Advice/2014/2014/Her-2532-Ex-Go.pdf
Jackson, J. B., Kirby, M. X., Berger, W. H., Bjorndal, K. A., Botsford, L. W., Bourque, B. J., et al. (2001). Historical overfishing and the recent collapse of coastal ecosystems. Science 293, 629–638. doi: 10.1126/science.1059199
Jevrejeva, S., Moore, J. C., and Grinsted, A. (2003). Influence of the Arctic Oscillation and El Niño-Southern Oscillation (ENSO) on ice conditions in the Baltic Sea: The wavelet approach. J. Geophys. Res. 108:4677. doi: 10.1029/2003JD003417
Kalnay, E., Kanamitsu, M., Kistler, R., Collins, W., Deaven, D., Gandin, L., et al. (1996). The NCEP/NCAR reanalysis 40-year project. Bull. Am. Met. Soc. 77, 437–471.
Kerr, R. A. (2000). A North Atlantic pacemaker for the centuries. Science 288, 1984–1986. doi: 10.1126/science.288.5473.1984
Knight, J. R., Folland, C. K., and Scaife, A. A. (2006). Climate impact of the Atlantic Multidecadal Oscillation. Geophys. Res. Lett. 33:L17706. doi: 10.1029/2006GL026242
Kornilovs, G., Sidrevics, L., and Dippner, J. W. (2001). Fish and zooplankton interaction in the Central Baltic Sea. ICES J. Mar. Sci. 58, 579–588. doi: 10.1006/jmsc.2001.1062
Kronsell, J., and Andersson, P. (2012). Total and Regional Runoff to the Baltic Sea. HELCOM Baltic Sea Environment Fact Sheet 2011. Available online at: http://www.helcom.fi/baltic-sea-trends/environment-fact-sheets/.
Lassen, H. (2011). Industrial Fisheries in the Baltic Sea. Brussels: European Parliament, DG Internal Policies, Policy Department B: Structural and Cohesion Policies, Fisheries. 49 p.
Lau, K.-M., and Weng, H. (1995). Climate signal detection using wavelet transform. How to make a time series sing. Bull. Amer. Meteor. Soc. 76, 2391–2402.
Livezey, R. E. (1995). “The evaluation of forecast,” in Analysis of Climate Variability, eds H. von Storch and A. Navarra (Berlin; Springer-Verlag), 177–196.
Matthäus, W., and Frank, H. (1992). Characteristics of major Baltic inflows — a statistical analysis. Cont. Shelf Res. 12, 1375–1400.
Meier, H. E. M., Kjellström, E., and Graham, L. P. (2006). Estimating uncertainties of projected Baltic Sea salinity in the late 21st century. Geophys. Res. Lett. 33:L15705. doi: 10.1029/2006GL026488
Michaelsen, J. (1987). Cross-validation in statistical climate forecast models. J. Clim. Appl. Meteorol. 26, 1589–1600.
Mikulski, Z. (1982). River Inflow to the Baltic Sea 1921–1975. Warsaw: Polish Academy of Science, Polish National Committee of the IHP UNESCO.
Möllmann, C., Diekmann, R., Müller-Karulis, B., Kornilovs, G., Plikshs, M., and Axe, P. (2009). Reorganization of a large marine ecosystems due to atmospheric and anthropogenic pressure: a discontinuous regime shift in the Central Baltic Sea. Glob. Change Biol. 15, 1377–1393. doi: 10.1111/j.1365-2486.2008.01814.x
Möllmann, C., Kornilovs, G., Fetter, M., Köster, F. W., and Hinrichsen, H. H. (2003). The marine copepod Pseudocalanus elongates as a mediator between climate variability and fisheries in the Central Baltic Sea. Fish. Oceanogr. 12, 360–368. doi: 10.1046/j.1365-2419.2003.00257.x
Morlet, J. (1983). Sampling Theory and Wave Propagation. Berlin: NATO ASI Series FI, Springer. 233–261.
Philippart, C. J. M., Anadon, R., Danovaro, R., Dippner, J. W., Drinkwater, K. F., Hawkins, S. J., et al. (2011). Impacts of climate change on European marine ecosystems: Observations, expectations and indicators. J. Exp. Mar. Biol. Ecol. 400, 52–69. doi: 10.1016/j.jembe.2011.02.023
Rajasilta, M., Hänninen, J., Laaksonen, L., Laine, P., Suomela, J.-P., Vuorinen, I., et al. (2018). Influence of environmental conditions, population density, and prey type on the lipid content in Baltic herring (Clupea harengus membras) from the northern Baltic Sea. Can. J. Fish. Aquat. Sci. 76, 576–585. doi: 10.1139/cjfas-2017-0504
Reid, P. C., de Fatima Borges, M., and Svendsen, E. (2001). A regime shift in the North Sea circa 1988 linked to changes in the North Sea horse mackerel fishery. Fish. Res. 50, 163–171. doi: 10.1016/S0165-7836(00)00249-6
Remane, A. (1934). Die Brackwasserfauna. Verhandlungen der Deutschen Zoologischen Gesellschaft 36, 34–74.
Rönkkönen, S., Ojaveer, E., Raid, T., and Viitasalo, M. (2004). Long-term changes in Baltic herring (Clupea harengus membras) growth in the Gulf of Finland. Can J. Fish. Aquat. Sci. 61, 219–229. doi: 10.1139/f03-167
Schlesinger, M. E., and Ramankutty, N. (1994). An oscillation in the global climate system of period 65-70 years. Nature 367,723–726.
Sutton, R. T., and Hodson, D. R. L. (2005). Atlantic Ocean forcing of North American and European summer climate. Science 309, 115–118. doi: 10.1126/science.1109496
Torrence, C., and Compo, G. P. (1998). A practical guide to wavelet analysis. Bull. Am. Met. Soc. 79, 61–78.
von Storch, H., Zorita, E., and Cubasch, U. (1993). Downscaling of global climate change estimates to regional scales: an application to Iberian rainfall in wintertime. J. Clim. 6, 1161–1171.
Voss, M., Emeis, K.-C., Hille, S., Neumann, T., and Dippner, J. W. (2005). Nitrogen cycle of the Baltic Sea from an isotopic perspective. Glob. Biogeochem. Cycles 19, 1–16. doi: 10.1029/2004GB002338
Vuorinen, I., Hänninen, J., Rajasilta, M., Laine, P., Eklund, J., Montesino-Pouzols, F., et al. (2015). Scenario simulations of future salinity and ecological consequences in the Baltic Sea and adjacent North Sea areas – implications for environmental monitoring. Ecol. Indicat. 50, 196–205. doi: 10.1016/j.ecolind.2014.10.019
Keywords: central Baltic Sea herring, climate variability, statistical downscaling, wavelet analysis, Baltic Sea
Citation: Dippner JW, Fründt B and Hammer C (2019) Lake or Sea? The Unknown Future of Central Baltic Sea Herring. Front. Ecol. Evol. 7:143. doi: 10.3389/fevo.2019.00143
Received: 14 August 2018; Accepted: 11 April 2019;
Published: 30 April 2019.
Edited by:
Klaus D. Joehnk, Commonwealth Scientific and Industrial Research Organisation (CSIRO), AustraliaReviewed by:
Célia M. Teixeira, Center for Marine and Environmental Sciences (MARE), PortugalCopyright © 2019 Dippner, Fründt and Hammer. This is an open-access article distributed under the terms of the Creative Commons Attribution License (CC BY). The use, distribution or reproduction in other forums is permitted, provided the original author(s) and the copyright owner(s) are credited and that the original publication in this journal is cited, in accordance with accepted academic practice. No use, distribution or reproduction is permitted which does not comply with these terms.
*Correspondence: Joachim W. Dippner, ZGlwcG5lckBpby13YXJuZW11ZW5kZS5kZQ==
†Present Address: Birte Fründt, Lloyd Gymnasium, Bremerhaven, Germany
Disclaimer: All claims expressed in this article are solely those of the authors and do not necessarily represent those of their affiliated organizations, or those of the publisher, the editors and the reviewers. Any product that may be evaluated in this article or claim that may be made by its manufacturer is not guaranteed or endorsed by the publisher.
Research integrity at Frontiers

Learn more about the work of our research integrity team to safeguard the quality of each article we publish.