 Shengdi Wang
 Junzhi Chen1*
 Yonggang Zhang
94% of researchers rate our articles as excellent or good
Learn more about the work of our research integrity team to safeguard the quality of each article we publish.
Find out more
METHODS article
Front. Earth Sci. , 10 April 2025
Sec. Geohazards and Georisks
Volume 13 - 2025 | https://doi.org/10.3389/feart.2025.1582941
This article is part of the Research Topic Natural Disaster Prediction Based on Experimental and Numerical Methods View all 10 articles
The stability of the surrounding rock in the goaf of the mine is poor, which can easily cause collapse disasters in the mining area. This paper used orthogonal experiments and multi factor optimization methods to study the optimal mixing ratio of similar materials for limestone surrounding rock in a goaf of a certain iron mine in Yunnan, and introduced a new material combination (quartz, cement, gypsum, barite, and glycerol), and utilized orthogonal experiments alongside machine learning techniques for predictive analysis. Systematic testing of similar material samples with 25 different mixing ratios yielded extensive data on various physical and mechanical parameters, which were then utilized to reveal the complex interactions among various influencing factors.The cement-gypsum-ratio significantly influenced the uniaxial compressive strength and elastic modulus, while the barite content influenced the density, and the glycerol content impacted the internal friction angle. Furthermore, this study proposed a novel machine learning-based prediction model that utilizes a PSO-BP neural network to regress and predict experimental data. Compared with traditional BP neural network, the results show that the PSO-BP model has a higher prediction correlation coefficient R2 than the traditional BP model, while the root mean square error (RMSE) and mean absolute error (MAE) are lower than the traditional BP model, indicating that the PSO-BP model has better and more stable prediction performance.So PSO-BP neural network model can more accurately predict the optimal mixing ratio for similar materials. The effectiveness of this mixing ratio was verified through practical engineering case studies. This study provides new theoretical foundations and technical support for the stability analysis of surrounding rock in goafs, demonstrating significant engineering application value.
The similarity model tests involves constructing laboratory-scale physical models based on similarity theory to replicate natural or engineering phenomena. This method is generally used to simulate the stress and deformation of rock and soil masses, as well as to evaluate and predict their properties and behaviors in actual engineering applications (Zhang and Li, 2005). There have been numerous research achievements in indoor rock mechanics tests both domestically and internationally (Li K. S. et al., 2023; Cao et al., 2024; Gao et al., 2023; Li X. et al., 2023; Liu et al., 2023; Liu et al., 2024). They have been widely applied in the research of excavation-induced deformation and failure of surrounding rocks in goafs, as well as the associated disasters (Mandal and Singh, 2009; Fraldi and Guarracino, 2009).
In recent years, the study of similar materials has become a prominent topic. Numerous scholars have conducted extensive research on the development and application of similar materials (Sun, 2020; Wang, 2022; Zhang et al., 2020; Zhang C. L. et al., 2021; Lü et al., 2021). Li et al. (2021) used the Yudushan Tunnel, a major transportation support project for the 2022 Beijing Winter Olympics, as a case study to address the construction challenges posed by tunneling beneath the goaf using the point column method (The point column method refers to the establishment of point columns in the mining area during underground mining to maintain the stability of the roof and surrounding rock. These pillars not only ensure the safety of the mining site, but also play an important role in improving the ore recovery rate of the mining site). They independently developed a similarity model test system and then combined it with a discrete-continuous coupling analysis to investigate the surrounding rock fracturing. Their research also explored the mechanical mechanism underlying the evolution of surrounding rock failure. Zhan et al. (Zhan et al., 2023) selected river sand, barite, gypsum, and cement of different strength grades as raw materials to prepare ultra-high strength similar materials (with strengths exceeding 10 MPa) suitable for large-scale similarity model tests. A total of 25 mixing ratios were designed using four orthogonal experimental factors: aggregate-to-binder ratio, cement-to-gypsum ratio, barite content, and cement strength grade. Numerous similar material samples were prepared according to experimental requirements, and corresponding rock mechanics tests were conducted to obtain the basic physical and mechanical parameters of similar materials with different proportions. Liu et al. (2017) conducted a similar model test to analyze the deformation and failure patterns of surrounding rock in the goaf of steeply inclined ore bodies. Their findings revealed that, as the experiment progressed, the displacement difference between the surrounding rocks on either sides of the goaf gradually increased, disrupting the stress balance. The temporal variation of displacement could be categorized into three stages: dramatic increase, gradual increase, and another dramatic increase, with the gradual increase stage having the longest duration. The upper surrounding rock subsided towards the goaf, while the lower surrounding rock experienced vertical downward subsidence. The displacement exhibited a decreasing trend in horizontal layers from top to bottom. These results provide valuable insights for effective mining of steeply inclined hard rock ore bodies. Xu et al. (2022) proposed a new type of similar material, which uses gypsum as the bonding agent, engine oil as the regulating material, and fine iron powder, putty powder, and quartz sand as aggregates.
Neural network regression prediction has emerged as an important prediction method. For example, to address the environmental concerns, Yu et al. (2021) employed a combination of on-site testing, drilling observation, numerical simulation to analyze damage zone and mining-induced pressure in surrounding rock across different sections of the goaf at Luling Coal Mine. Hu et al. (2018) analyzed the factors influencing the stability of stratified ore bodies using the BP neural network and systematically reviewed typical case studies on the stability assessment of goafs. Additionally, they identified three key factors affecting the stability of goafs, including rock compressive strength, exposed mining area, and mining span, by referencing several mining design examples. Yang and Zeng (2022) developed a GA-BP neural network model to predict surface subsidence in goaf areas. They independently tested the BP and GA-BP neural network models using MATLAB software to validate the predictive performance of the GA-BP model. Pei et al. (2021) proposed an improved GA-BP model to evaluate the risk levels for complex goafs. This model employed a principal component analysis to reduce the nine evaluation indicators into four key components, which serve as inputs for the BP neural network. The evaluation results included risk levels and their associated probabilities. Genetic algorithms optimized the network parameters, and the improved GA-BP model yielded results aligned with actual conditions. Based on the key indicators, including mining duration, settlement trend, depth-to-thickness ratio, structural complexity, overlying rock strength, relative position, and “activation” factors, Ding and Wang (2009) categorized the goaf stability into four levels. They also applied a BP neural network model to predict and evaluate the stability of goafs. The accurate results offer significant guidance for engineering feasibility assessments and project planning. Fernandez et al. (2023) used discontinuity index and machine learning techniques to study the identification of rock mass structure in drilling monitoring technology for underground mining. Shi et al. (2015) classified microseismic waves using CNN’s transfer learning model.
Although previous studies have achieved certain results in the proportioning of similar materials, there are still some shortcomings: 1) Limitations of proportioning methods: Previous studies relied more on empirical proportioning or simple experiments, lacking systematic experimental design and multi factor optimization, resulting in inaccurate and unreliable proportioning results. 2) Single material selection: Many studies have limited the selection of similar materials, failing to fully utilize the advantages of new material combinations and limiting the improvement of similar material properties. 3) Lack of predictive models: Previous studies lacked machine learning based predictive models, which could not efficiently process and analyze large amounts of experimental data, limiting the efficiency and accuracy of optimizing similar material ratios. The above shortcomings have had a significant impact on current research, specifically reflected in the following aspects: 1) Insufficient experimental design leads to inaccurate results: due to the lack of systematic experimental design, previous research on proportioning results often had significant errors and uncertainties, making it difficult to meet the needs of practical engineering. 2) Material performance limitations: A single material selection restricts the performance improvement of similar materials, making it impossible to accurately simulate the mechanical behavior of real rock masses under certain specific working conditions. 3) Limited predictive ability: The lack of machine learning based predictive models makes it difficult for researchers to quickly and accurately find the optimal mix ratio when faced with a large amount of experimental data, which affects research efficiency and progress.
This paper used orthogonal experiments and multi factor optimization methods to study the optimal mixing ratio of similar materials for limestone surrounding rock in a goaf of a certain iron mine in Yunnan, and introduced a new material combination (quartz, cement, gypsum, barite, and glycerol), and utilized orthogonal experiments alongside machine learning techniques for predictive analysis. Systematic testing of similar material samples with 25 different mixing ratios yielded extensive data on various physical and mechanical parameters, which were then utilized to reveal the complex interactions among various influencing factors.
The design of similar materials for surrounding rock in goafs requires deriving similarity ratios based on similarity theory. The prototype and model must adhere to similarity in size, physical and mechanical parameters, and loads. By determining similarity constants, prototype properties can be deduced from the test results, which allows for the establishment of the similarity relationships for surrounding rock in goafs.
Based on the three similarity theorems, this study determined similarity constants by comprehensively considering the goaf dimensions, physical and mechanical parameters, and applied loads. Geometric similarity is defined as the ratio of prototype size Lp to model size Lm, which is defined as Equation 1:
This study adopted a geometric similarity ratio of SL = 100. The similarity ratios between prototype and model materials were derived using the dimensional analysis and Buckingham π theorem. Key physical quantities considered include density, uniaxial compressive strength, elastic modulus, Poisson’s ratio, cohesion, and internal friction angle. Notably, the compressive strength similarity constant equals the product of the density and similarity constants. The specific similarity constants for various physical quantities are provided in Table 1.

Table 1. Similarity relationship and constants for various physical quantities of materials.
The selection of similar materials is guided by the need for the model to closely replicate the mechanical properties of the simulated surrounding rock while ensuring stable mechanical behavior. Additionally, these materials should be readily available, efficient to mold, simple to produce, cost-effective, safe, and environmentally friendly. Identifying suitable similar materials is critical for experimental success. Quartz is an abundant and cost-effective mineral characterized by its high hardness, making it suitable for large-scale modeling applications. Barite, primarily composed of barium sulfate, possesses a significantly higher density than quartz, enabling precise adjustments to the density of the similar materials by varying the barite content. Its chemical stability ensures that it does not react adversely with other materials, thereby maintaining the stability of the similar materials over time. Cement, a widely used binding agent, effectively bonds with aggregates to form a composite material with adequate strength. The cement ratio can be adjusted to modify the uniaxial compressive strength and elastic modulus of the similar materials, aligning their properties with those of actual rock formations. Although gypsum exhibits lower strength compared to cement, it sets more rapidly and possesses a degree of plasticity during the setting phase, which enhances the simulation of surrounding rock deformation. By adjusting the proportions of cement and gypsum, the mechanical properties of the similar materials can be optimized to meet the specific requirements of various experimental scenarios. Glycerin, utilized as a liquid additive, significantly influences the internal friction angle of the similar materials. Its incorporation improves the flowability of the mixture, facilitating a more uniform blend during mixing and shaping while minimizing the formation of bubbles and voids. Moreover, glycerin slows the setting process of cement and gypsum, facilitating handling and forming while guaranteeing the quality of the samples. Therefore, this study selected quartz (40 mesh) and barite (200 mesh) as aggregates, Portland cement (grade 32.5) and gypsum (1500 mesh) as binding materials, and water and glycerin as modifiers. The main characteristics and parameters of the selected similar materials are detailed in Table 2.
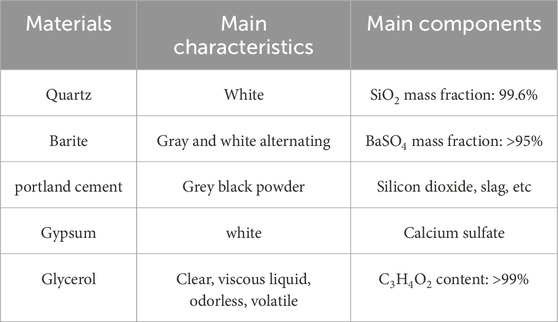
Table 2. Main characteristics and parameters of the selected similar materials.
Orthogonal experimental design is a statistical approach that aids researchers in identifying and selecting factors affecting experimental results. This approach enables researchers to maximize information acquisition by carefully selecting appropriate levels for experimental factors while conducting a limited number of trials. In orthogonal experimental design, factors are typically categorized into various levels, and experiments are executed according to the predefined orthogonal table. This design allows researchers to identify the primary influencing factors and the interactions among them. The benefits of orthogonal design include a reduction in the number of trials, as well as improvements in experimental efficiency and accuracy.
This article proposes the following orthogonal design scheme based on references (Lü et al., 2021; Zhan et al., 2023; Xu et al., 2022) and combined with its own practical situation.
This research examined the changes in the strength of similar materials by controlling the aggregate-to-binder and cement-to-gypsum ratios. The density of similar materials can be modified according to the density differences between quartz and baryte. The addition of glycerol can change the viscosity and density of the experimental solution, which in turn influences the material’s elastic modulus. In solution containing glycerol, the interaction between the particles or test materials and glycerol may affect the measured internal friction angle (Dong et al., 2023). Consequently, this study employed four factors in the orthogonal design: aggregate-to-binder ratio (mass of aggregate/mass of binder), cement-to-gypsum ratio (mass of cement/mass of gypsum), barite content (mass of barite/mass of aggregate), and glycerol content (mass of glycerol/total mass of mixture), with each factor having five levels. The orthogonal design levels for the similar materials are presented in Table 3. The experiment followed a six-factor, five-level orthogonal design scheme, L25 (56). The mixing ratios for similar materials are detailed in Table 4.
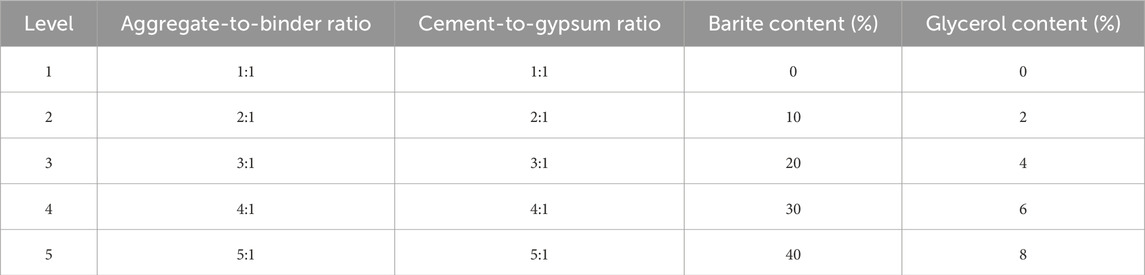
Table 3. Orthogonal design level.

Table 4. Mixing ratio design.
Furthermore, variations in water content also affect material strength. In general, higher water content leads to lower material strength. Experience suggests that setting the water mass to 1/7 of the material mass allows for easier drying and reduces the likelihood of residual creep deformation in the samples.
Samples used for the experiment were prepared based on the mixing ratios listed in Table 4. Molds of various sizes were prepared for sample production. To replicate the mechanical properties of surrounding rock in goafs, 25 sets of mix-ratio experiments were designed by varying the proportions of the test materials, and each set was analyzed in sequence. For each mixing ratio, three cylindrical samples with a diameter of 50 mm and a height of 100 mm, as well as three cubic samples with dimensions of 50 mm × 50 mm × 50 mm (or cylindrical samples with a diameter of 50 mm and a height of 50 mm) were prepared. These samples underwent uniaxial compression and shear tests. Figure 1 outlines the sample preparation process, while the completed samples are presented in Figure 2.
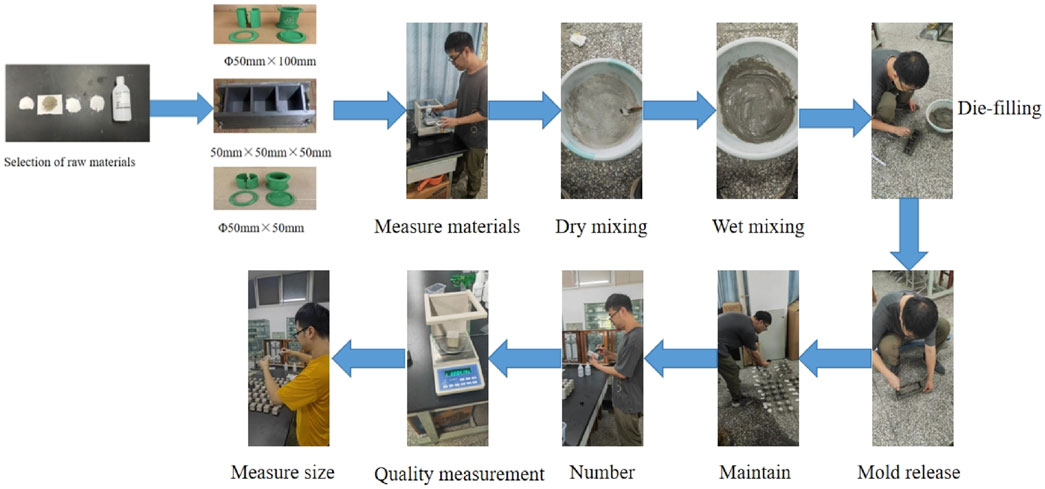
Figure 1. Sample production process.
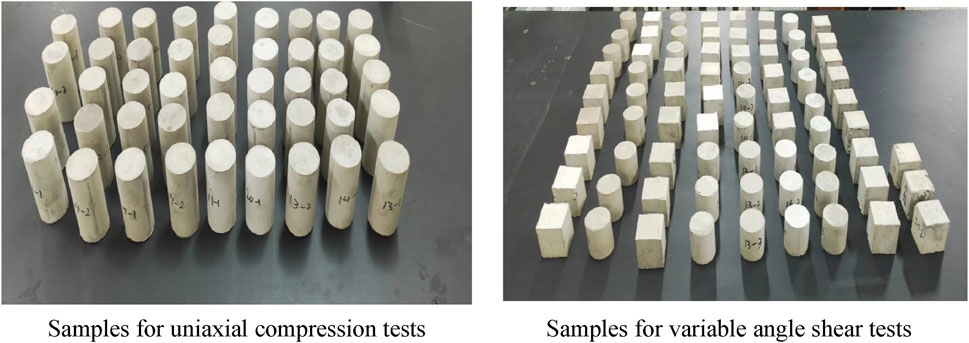
Figure 2. Prepared samples.
This experiment used manual tamping to prepare the specimens. The procedures and precautions are as follows:
(1) Record the temperature and humidity of the experimental environment.
(2) Calculate the quantities of materials by mass according to the mixing ratios specified in Tables 3, 4. The materials for three specimens should be weighed simultaneously, ensuring that the mixture for each batch originates from the same mixing container. The weighing accuracy for quartz and barite should be ±0.5%, while that for cement, gypsum, water and glycerol should be ±0.2%.
(3) Add all weighed raw materials to the mixing container. The specific sequence for feeding and mixing is as follows: aggregate → binder → dry mixing → glycerin and water → wet mixing. Both dry and wet mixing should ensure thorough blending of all materials, with an ideal mixing time of at least 2 min to achieve uniformity.
(4) Apply lubricant to the inner wall of the mold to facilitate easier demolding.
(5) Position the mold on a flat and stable working platform to ensure that its base is flat and secure.
(6) Slowly add the prepared uniform wet material into the mold and use a tamping rod to tamp it. This process ensures the even distribution of materials and the expulsion of air, thereby preventing cavities or voids. It is essential to avoid excessive vibration to prevent the formation of voids and delamination within the specimen. Tamping should be conducted uniformly from the edge toward the center in a spiral motion. When tamping the bottom layer of concrete, the tamping rod should reach the bottom of the mold. For the upper layer, the rod should penetrate the upper layer and be inserted into the lower layer by 20 mm–30 mm. Throughout the tamping process, the tamping rod must remain vertical. After tamping, a trowel should be used to insert and withdraw along the inner wall of the mold several times. Once the tamping is completed, gently tap around the mold using a rubber hammer or wooden mallet until all voids created by the tamping rod disappear. Finally, use a trowel to level the top surface of the mold. The height difference between the specimen surface and the mold edge should not exceed 0.5 mm.
(7) After 14 h, demold the specimens that have set. Label the demolded specimen and initiate proper curing by placing them in a controlled indoor environment at a temperature of 20°C ± 5°C and a relative humidity greater than 50% for 28 days. During this period, avoid any vibrations and impacts. The surface of the specimens can be lightly sprayed with water to prevent premature drying.
(8) Conduct necessary quality checks on the demolded specimens, including assessments of mass, appearance, dimensions, and strength. Additionally, calculate the density based on the mass and dimensions of the specimens.
The uniaxial compression test (Figure 3) was conducted using a HCT206E microcomputer-controlled oil-electric hybrid pressure testing machine to measure the maximum load that each sample could endure at the point of failure. The compressive strength of the sample was calculated using Equation 2.
where R is the compressive strength of the sample, MPa; Pmax is the maximum load at failure, N; D is the diameter of the circular sample, mm.
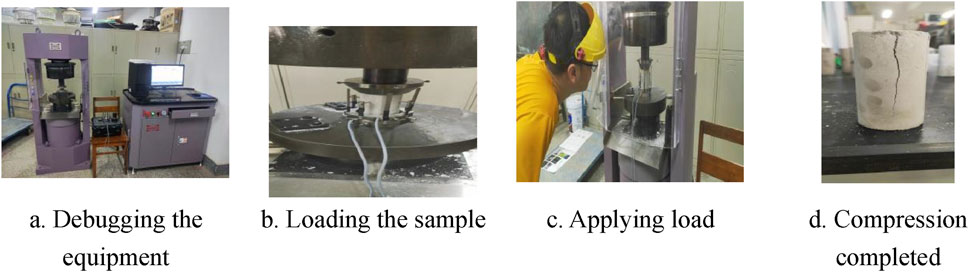
Figure 3. Uniaxial compression test procedure. (a) Debugging the equipment. (b) Loading the sample. (c) Applying load. (d) Compression completed.
The deformation and compression tests were conducted simultaneously. By attaching an extensometer to the testing machine, the compressive strength, elastic modulus, and Poisson’s ratio of the samples were measured. In the deformation test, axial stress was applied to the sample, while the extensometer captured the transverse and longitudinal strains. The elastic modulus was calculated using Equation 3, while the Poisson’s ratio was determined using Equation 4.
where E is the elastic modulus, MPa; μ is Poisson’s ratio; σc is the uniaxial compressive strength, MPa; εx is the transverse strain corresponding to σc; εy is the axial strain corresponding to σc.
The shear test, also known as the variable angle shear test (Figure 4) as employed to determine the cohesion c and internal friction angle φ of the sample. The sample was positioned at the center of the shear mold. The upper and lower halves of the fixture were aligned vertically to ensure that the centerlines of the mold and the specimen were aligned. Subsequently, the assembly was placed into testing machine, while ensuring that the top and bottom surfaces of the shear mold were maintained horizontal. During the shear test, normal and shear stresses were applied to the sample. The shear stress was parallel to the shear direction, while the normal stress was perpendicular to the shear direction. Both stresses were derived from the maximum load Pmax applied by the testing machine to the shear mold. These stresses can be calculated using Equations 5, 6.
where Pmax is the failure load, N; F is the cross-sectional area of the sample, mm2; α is the angle of the shear mold, °; σα and τα are the normal and shear stresses, respectively, MPa.
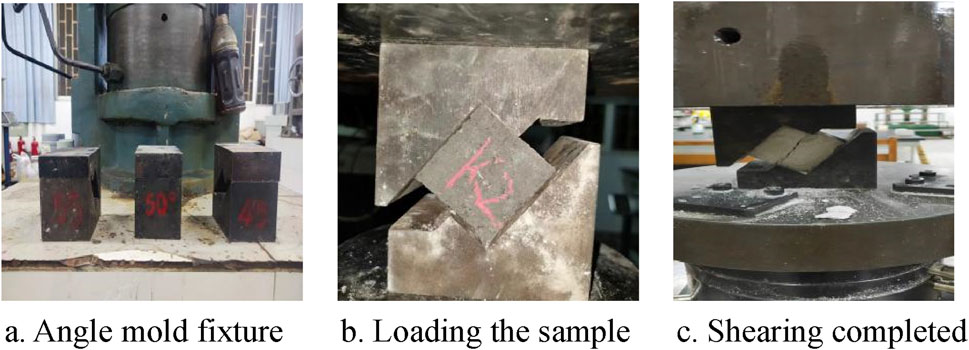
Figure 4. Variable angle shear test procedure (a). Angle mold fixture (b). Loading the sample (c). Shearing completed.
The angles of the mold were set at 45°, 50°, and 55°, respectively. The data obtained were analyzed using a linear regression formula, as detailed in Equation 7, and a strength curve was generated. In this curve, the intercept corresponds to the cohesion, and the slope reflects the internal friction angle.
where φ is the internal friction angle, °; c is the cohesion, MPa.
The average values of physical and mechanical parameters, including density, uniaxial compressive strength, elastic modulus, Poisson’s ratio, cohesion, and internal friction angle, were obtained for 25 sets of material samples with different mixing ratios. These values were determined through mass measurement, size measurement, uniaxial compression tests, and variable angle shear tests, as summarized in Table 5.
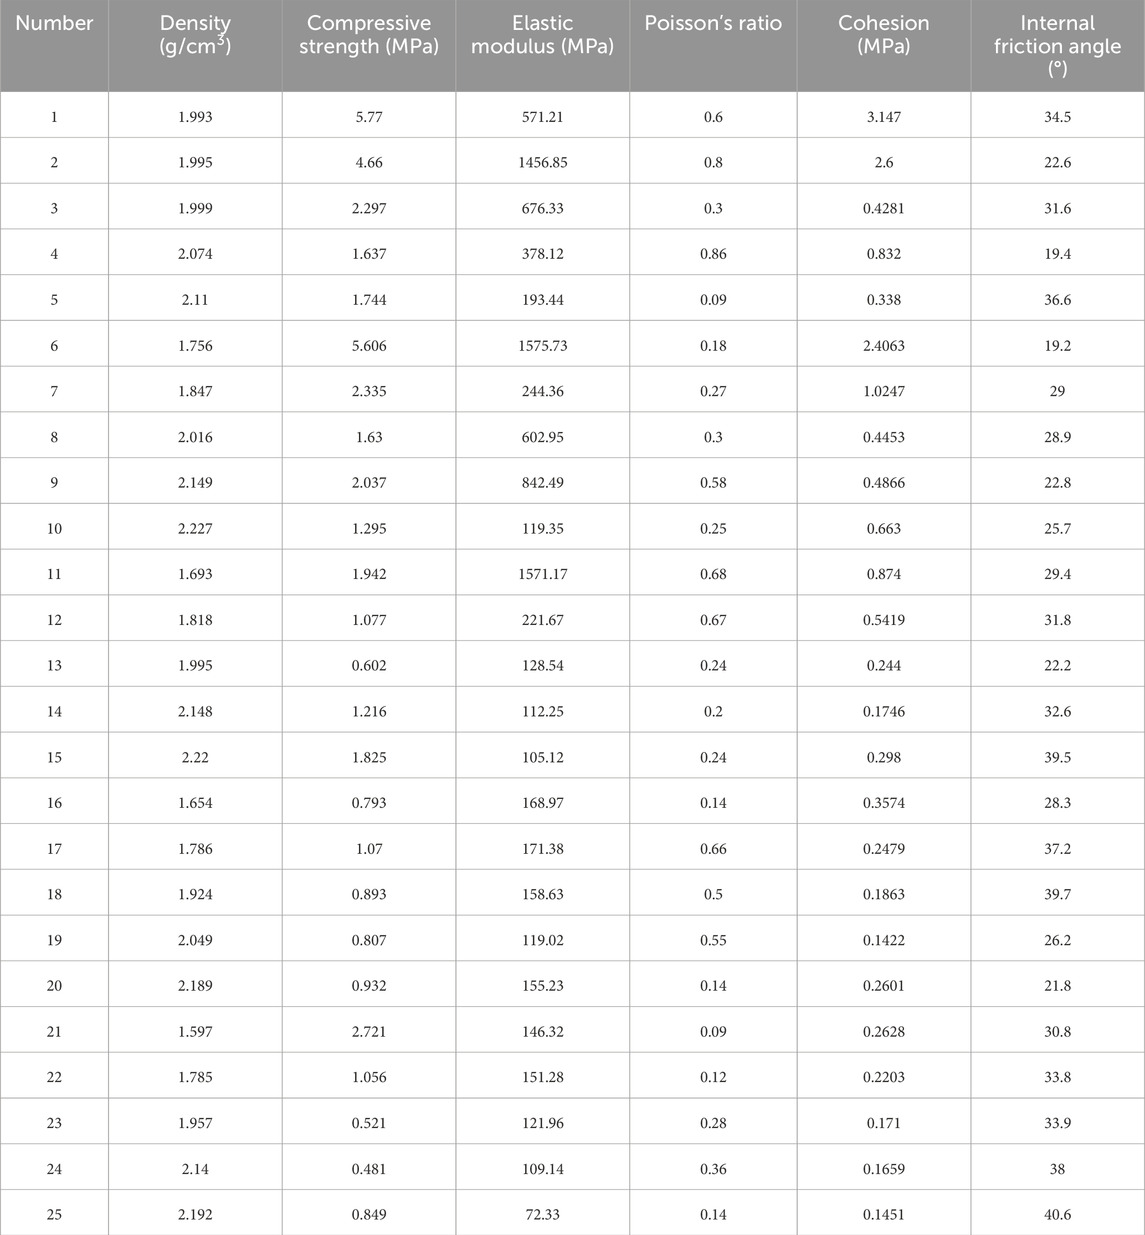
Table 5. Mechanical parameters of similar material samples.
The data presented in Table 5 confirmed that the density, uniaxial compressive strength, elastic modulus, Poisson’s ratio, cohesion, and internal friction angle for similar materials were 1.597–2.227 g/cm3, 0.481–5.77 MPa, 2.33–1575.73 MPa, 0.09–0.86, 0.1422–3.147 MPa, and 19.2°–40.6°, respectively; while their average values were 1.984 g/cm3, 1.771 MPa, 454.74 MPa, 0.39, 0.842 MPa, and 29.5°, respectively. The material exhibited relatively high density but generally low compressive strength, indicating moderate overall strength. The elastic modulus exhibited significant variability, suggesting considerable differences in material stiffness. The Poisson’s ratio was relatively high, indicating some compressibility of the material. The cohesion was low, reflecting moderate internal bonding capacity of the material, while the internal friction angle was relatively high, demonstrating the material has strong shear resistance.
Table 5 presents a total of 25 data sets, each comprising six distinct features. The section analyzed the maximum, minimum, mean, and median values of each feature to assess whether the data exhibited skewed distribution. Given that these six features have different units and meanings, each feature was examined individually. The findings are detailed in Table 6, while the feature distribution map is illustrated in Figure 5.

Table 6. Statistical characteristics of data.
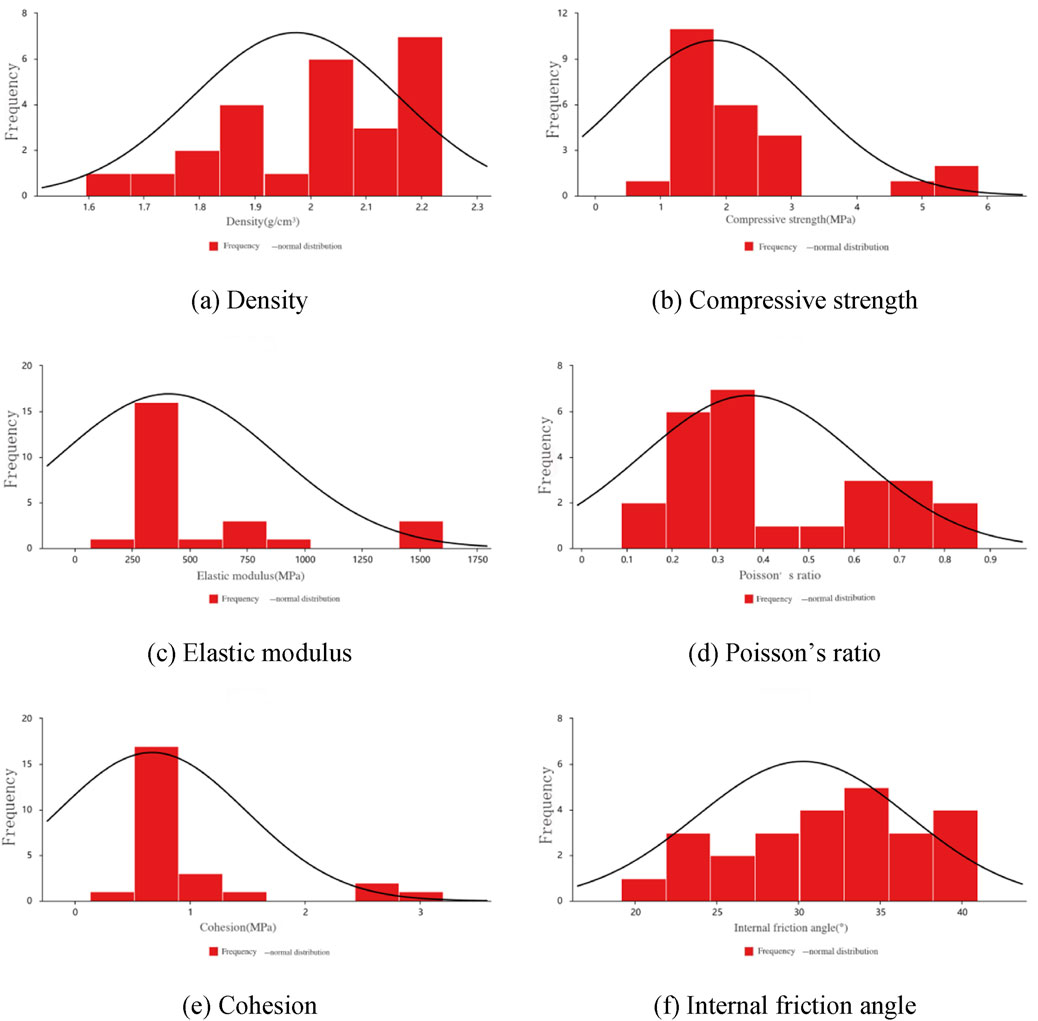
Figure 5. Distribution histogram of each factor. (a) Density. (b) Compressive strength. (c) Elastic modulus. (d) Poisson’s ratio. (e) Cohesion. (f) Internal friction angle.
As depicted in Table 6 and Figures 5a, f, the maximum, minimum, mean, median, and mode values for the density were 2.227, 1.597, 1.972, 1.995, and 1.995, respectively. Similarly, for the internal friction angle, these values were 40.6, 19.2, 30.82, 30.8, and 30.8, respectively. This indicated that the distributions of density and internal friction angle are approximately normal. To further illustrate this, a box plot was constructed, as presented in Figure 6. Table 7 and Figure 5b demonstrated that the minimum, maximum, mean, and median values for the uniaxial compressive strength were 0.481, 5.77, 1.83, and 1.29, respectively. Its distribution curve showed a distinct peak between 1 and 3, indicating a concentration of data within this range. The data for smaller and larger values in this region gradually decreased, showing a right-skewed distribution. As demonstrated in Table 6 and Figure 5c, the minimum, maximum, average, and median values for the elastic modulus were 72.33, 1575.73, 406.95, and 168.97, respectively. Its distribution curve exhibited a clear peak between 500 and 750, suggesting data concentration in this range. The data for smaller and larger values in this region gradually decreased, showing a right skewed distribution. As revealed in Table 6 and Figure 5d, the minimum, maximum, average, and median values for the Poisson’s ratio were 0.09, 0.86, 0.37, and 0.28, respectively. Its distribution curve showed a notable peak between 500 and 750, indicating data concentration in this range. The data for smaller and larger values in this region gradually decreased, demonstrating a right-skewed distribution. As illustrated in Table 6; Figure 5e, the minimum, maximum, average, and median values for the cohesion were 0.142, 3.147, 0.666, and 0.338, respectively. Its distribution curve presented a clear peak near 1, indicating that the data was concentrated within this range. The data for smaller and larger values in this region gradually decreased, showing a right-skewed distribution.
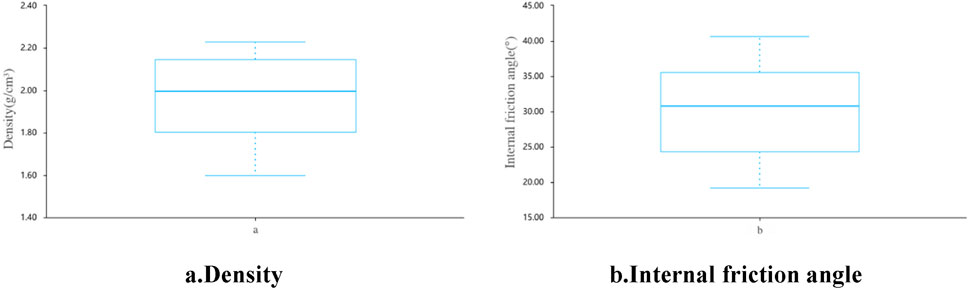
Figure 6. Box plot of density and internal friction angle (a). Density (b). Internal friction angle.

Table 7. Comparison of prediction results between the two models.
The density exhibited a normal distribution because barite has a density significantly greater than that of other materials. As the barite content increased, the density of similar materials also increased. However, the change in barite content was non-linear, it demonstrated a non-linear relationship with density. Specifically, when the barite content was low, the increase in density was more noticeable, but as the barite content continued to rise, the density increase tended to stabilize. This non-linear relationship indicated that the change in density were influenced by multiple factors, resulting in a relatively uniform normal distribution within a specific range.
The internal friction angle, which was significantly influenced by glycerol content, also followed a normal distribution. As glycerol content increased, the internal friction angle initially decreased, then increased, and finally decreased again. This observation occurred because, when the glycerol content was low, its dominant lubricating effect significantly reduced particle friction, thus leading to a significant decrease in the internal friction angle. As the glycerol content continued to increase, the lubricating layer gradually thickened, shifting the particle contact mode from point contact to surface contact, which increased friction. Simultaneously, the viscous effect of glycerol hindered the relative sliding between particles, leading to an increase in the internal friction angle. However, when the glycerol content reached its maximum, the relative sliding between particles became easier. Despite the presence of viscosity, excessive glycerol caused looser particle contact, resulting in a reduction in friction and a subsequent decrease in the internal friction angle. The effect of glycerol on the internal friction angle was non-linear. This nonlinearity diversified the changes in the internal friction angle, which contributed to its distribution approaching a normal distribution.
The compressive strength, elastic modulus, and cohesion all exhibited a right-skewed distribution, which was primarily influenced by the cement-to-gypsum ratio. As the primary bonding material, cement produced hydration products (e.g., calcium hydroxide, calcium silicate, etc.) that strengthen the material by forming strong bonds between aggregates. The hydration reaction of cement is a complex chemical process. As the cement content increased, the quantity of hydration products also rose, thereby improving the compressive strength, elastic modulus, and cohesion of the material. Experimental results demonstrated a non-linear relationship between the cement-to-gypsum ratio and these properties. At a cement-to-gypsum ratio of around 1:1, these properties peaked due to the most efficient hydration and highest material density. However, at higher cement-to-gypsum ratios (e.g., 3:1 or above), stress concentration may occur inside the material. This may lead to the formation of microcracks, ultimately weakening the overall strength of the material. In addition, excessive cement may also increase the porosity of the material, reducing its compactness. Consequently, the compressive strength, elastic modulus, and cohesion decreased, resulting in some samples exhibiting values significantly lower than their peak levels, thereby contributing to the right-skewed distribution.
Similarly, Poisson’s ratio also demonstrated a right-skewed distribution, mainly influenced by aggregate-to-binder ratio. A higher aggregate-to-binder ratio implied a greater involvement of aggregates, which enhances the contact area between particles. This increase in contact area made the material more prone to lateral expansion or contraction under stress, thereby resulting in a higher Poisson’s ratio. A higher aggregate-to-binder ratio weakened the binder’s effectiveness, leading to a reduction in the overall stiffness of the material and a corresponding increase in plasticity. Plastic materials typically exhibit greater deformation under stress, which manifests as larger transverse strains. Consequently, the Poisson’s ratio was elevated. Conversely, lower aggregate-to-binder ratio resulted in stiffer materials with lower Poisson’s ratio. This occurred because the binder effectively consolidated the aggregates, limiting lateral deformation. As the aggregate-to-binder ratio increased, the Poisson’s ratio rose gradually. Particularly at high aggregate-to-binder ratios, material plasticity enhanced, leading to a significant increase in the Poisson’s ratio and a right-skewed distribution.
Neural network algorithms are widely used in engineering. Shi-fan et al. (Qiao et al., 2021) studied the prediction of excavation settlement of foundation pits under different influence states using the GWO-ELM model The application of BP neural network based on water cycle algorithm by Zhang et al. (2021b) in landslide prediction has achieved good prediction results.
The Particle Swarm Optimization (PSO) algorithm is grounded in the concept of swarm intelligence, which simplifies complex mathematical models into a series of particle swarm models that can be effectively simulated. These models can simulate different communities to effectively address complex mathematical problems (Hu et al., 2023). Particles, characterized by their unique perspectives, insights, and collaborative abilities, continually adjust their trajectories and velocities while navigating the boundaries of the analytical universe. The core principle of the PSO algorithm involves iteratively updating the positions and velocities of the particles, guiding the swarm towards the optimal solution. The main components of this algorithm include particles’ position, velocity, and fitness function. The position represents a possible solution, and the velocity determines the direction and speed of particle movement in the solution space. The fitness function is used to evaluate the quality of each particle’s solution. Through iterative updates, the particle swarm gradually converges to the optimal solution.
Assuming a population of N particles in a D-dimensional space, the dimension D is represented by Equation 8:
where I represents the number of nodes in the input layer of the neural network, p represents the number of nodes in the hidden layer, and q represents the number of nodes in the output layer.
Upon initialization, the algorithm automatically generates a set of n-dimensional particles, whose positions can be abstractly represented as nodes in an n-dimensional search space or as solutions in an n-dimensional optimization space. The current position vector of a particle is denoted as Xj:
The current velocity of the jth particle, represented as Vj, is a dynamic variable whose value changes during the optimization process:
Before each iteration, the position vectors of the particles need to be input into a pre-defined fitness function to compute their respective fitness values. By comparing these values, the optimal fitness value can be identified, which enables the determination of the optimal position Pj and global position Gj for each generation of the PSO algorithm. This process ensures the effective operation of the PSO algorithm.
The PSO algorithm iteratively updates particle positions using Pj, Gj, Xj, and Vj for optimizing the objective function, ultimately achieving the optimal solution. Its evolutionary equation can be represented by Equations 9, 10:
where ω represents the inertia weight, c1 and c2 are parameters for generating random numbers; R1 and r2 are two independent random numbers within the range [0,1]. The kth and (k+1)-th generations replace the jth particle. To avoid ineffective searches by particles, the maximum running rate vmax is typically set within the range of [-vmax, vmax].
The efficiency of this algorithm depends on the inertia weight ω. A higher value enhances the overall search capability, whereas a lower value confines the search to specific regions. In addition, a higher ω results in fewer iterations, as described by Equation 11:
where k represents the current number of iterations, and kmax denotes the maximum number of iterations; ωmax and ωmin represent the maximum and minimum values of ω, respectively.
The data utilized for dataset construction were sourced from the mechanical parameters listed in Table 5. These parameters include density, uniaxial compressive strength, elastic modulus, Poisson’s ratio, cohesion, and internal friction angle, which were selected as inputs. The outputs were defined as the aggregate-to-binder ratio, cement-to-gypsum ratio, barite content, and glycerol content. A total of 25 samples were chosen, with the first 20 samples designated as training samples and the remaining 5 samples used as testing samples. Given the small sample size, a 5-fold cross-validation approach was employed to enhance the accuracy and reliability of the prediction results. At the same time, bootstrap method is used to extend the data to improve the reliability of the data and the generalization ability of the model.
The determination of the number of hidden layer neurons in the neural network, although lacking a universally accepted standard, can be approached by combining empirical insights and computational methods. Firstly, the initial number range of hidden layer neurons was empirically. Subsequently, the golden section method was applied to calculate the most optimal number of hidden layer neurons (Chen et al., 2023). The specific steps of the “golden ratio method” are to calculate within the approximate range [a, b] of the determined hidden layer nodes. The error results of two experimental points x1 = 0.618 × (b-a) + a and x2 = 0.382 × (b-a) + a. According to the principle of rounding off “inferior” and taking “excellent,” if the error of x1 is small, then [x2, b] is retained; If the error of x2 is small, retain [a, x1]; if the errors of both are the same, retain [x2, x1]. Repeat sampling within the reserved interval, discard “inferior” and choose “superior” until the result is satisfactory. The calculation formulas for a and b are as follows, see Equation 12:
In the formula, ni, nh, and n0 represent the number of nodes in the input layer, hidden layer, and output layer. As a result, the final number of hidden layer neurons was determined to be 22.
The neural network structure adopted in this study is a (6-22-4) model. This model consists of a single hidden layer, with 6 nodes in the input layer, 22 nodes in the hidden layer, and 4 nodes in the output layer.
Due to the varied dimensions and differing physical meanings of the input data, normalization of the data is essential to prevent features with smaller values from being overshadowed. This study employed the Sigmoid activation function, which provides smooth transitions in the saturation region. However, its low slope may lead to gradient vanishing issues, thereby complicating the training of the neural networks. The sample undergoes a standard normalization process before training, see Equation 13:
where Xi is the input data; Xmin is the minimum value of input data; Xmax is the maximum value of the input data.
Furthermore, a gradient descent method that includes a momentum factor was introduced to minimize learning oscillation and enhance the stability of the algorithm. Based on previous experiences and parameter adjustments, the particle swarm size was set to 10, with a particle dimension of N = 312 and a maximum iteration number of kmax = 50. The inertia weight decreased linearly as the increase of iterations increased. The learning factors were set to c1 = c2 = 4.494, and the maximum particle velocity was set to 1.
The performance of the constructed models needs to be thoroughly validated. Figure 7 illustrates the iteration curves of the PSO-BP and traditional BP neural network models, constructed from the data in Table 5. The initial error of the PSO-BP neural network model (0.7) was smaller than that of the traditional BP neural network model (0.9). The PSO-BP neural network model and the traditional BP neural network model achieved near-zero error after approximately 4 and 6 iterations, respectively. Therefore, the PSO-BP neural network model demonstrated a faster convergence rate in finding the optimal solution. Regression analysis in Figures 8, 9 showed that the PSO-BP neural network model outperformed the traditional BP neural network model in fitting performance across the training, testing, validation, and overall datasets.
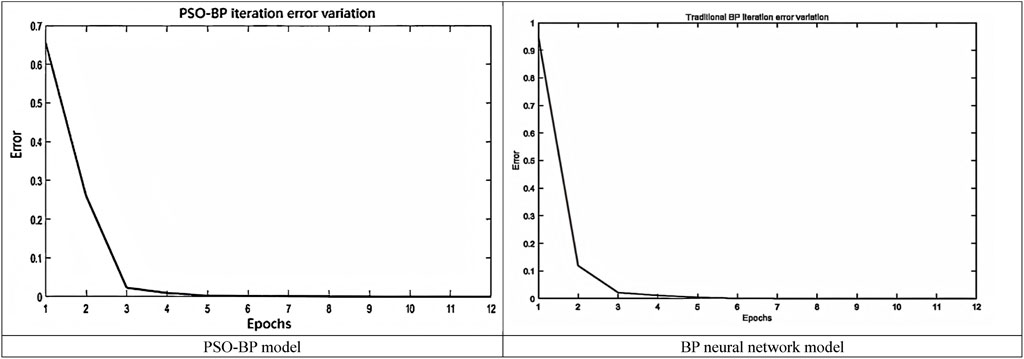
Figure 7. Iteration curves of two models.
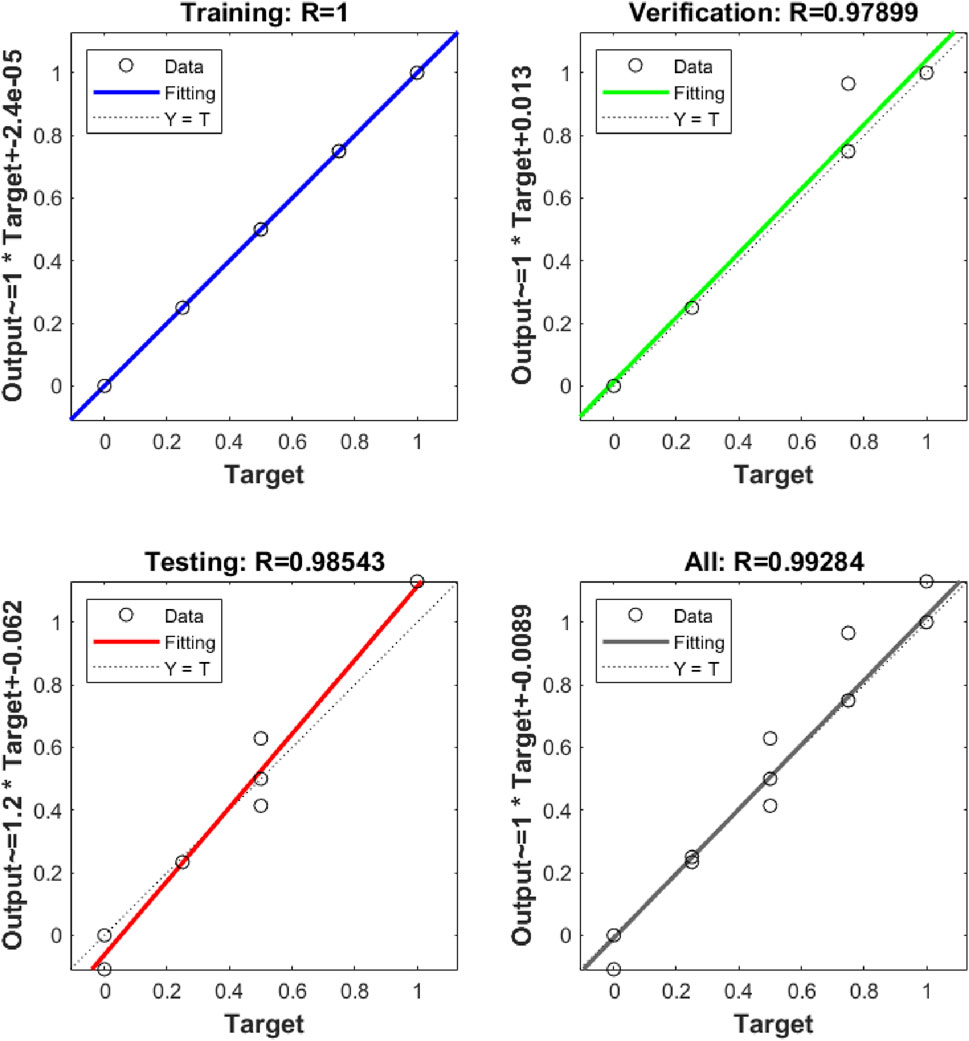
Figure 8. Regression analysis of PSO-BP model.
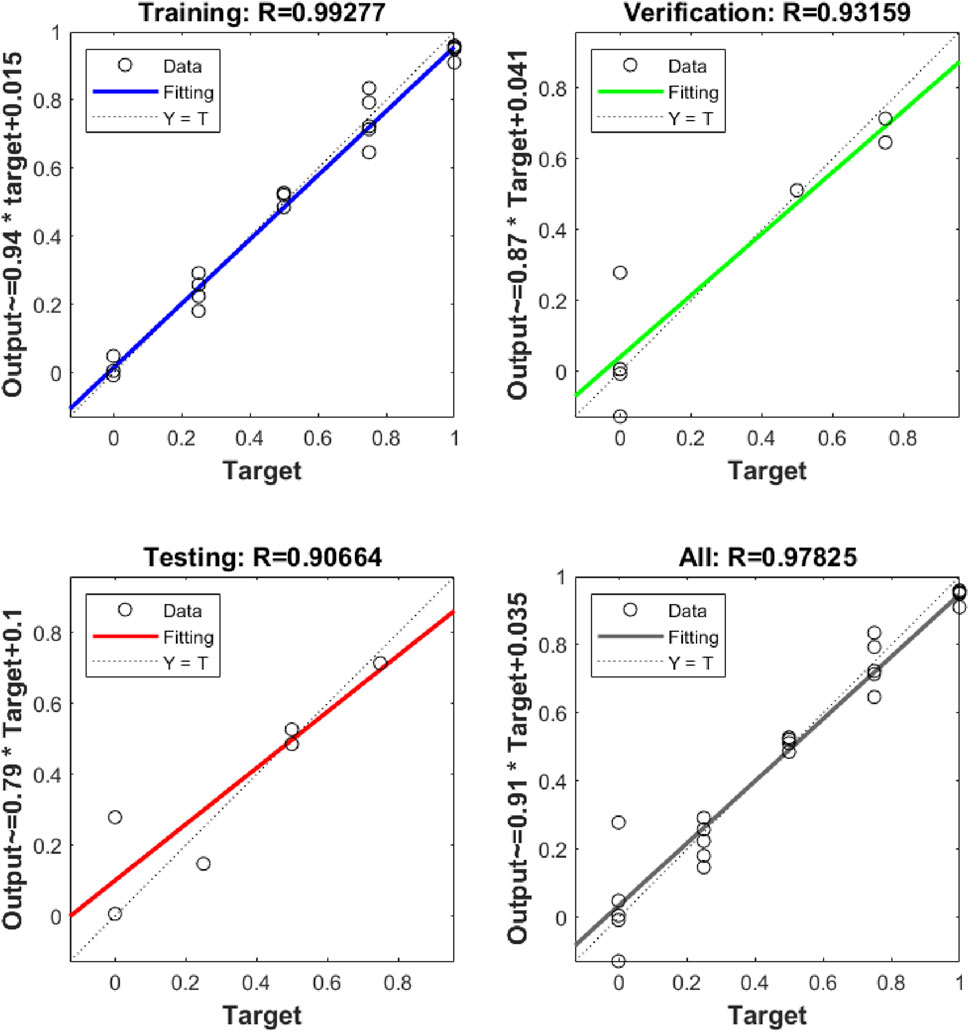
Figure 9. Regression analysis of BP model.
The predicted and actual values of aggregate-to-binder ratio, cement-to-gypsum ratio, barite content, and glycerol content for the PSO-BP and traditional BP neural network models are compared in Table 7.
As illustrated in Table 7, the actual values and predicted values generated by the PSO-BP, model for the five test samples—specifically for aggregate-to-binder ratio, cement-to-gypsum ratio, barite content, and glycerin content—exhibited a high degree of similarity. In contrast, the predicted results from the traditional BP, neural network model were notably less accurate than those of the PSO-BP, model.
To further validate the performance of the established model, it is essential to select various indicators for evaluation. In this study, three key performance indicators were chosen: the correlation coefficient (R2), the root mean square error (RMSE), and the mean absolute error (MAE). The mathematical formulations for these three indicators are as follows, see Equations 14–16:
where n is the length of the data,
Table 8 visually compare the R2, RMSE, and MAE values for the PSO-BP model and BP model, which facilitates a more accurate assessment of their performance. For these three metrics, a larger R2 value indicates better performance, while lower RMSE and MAE values are preferred. According to Table 8, the PSO-BP model had a higher R2 value compared to the BP model, while its RMSE and MAE were lower. This suggested that the PSO-BP model yielded the highest prediction accuracy, better performance, and higher credibility.
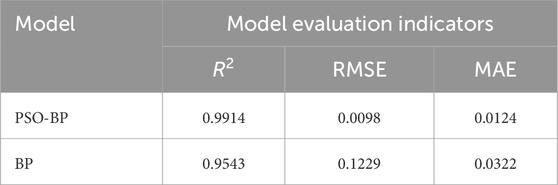
Table 8. Evaluation indicators for different models.
The Xinping Ludian Iron Mine, located in Yuxi City, Yunnan Province, runs in a north-south direction and is inclined to the east, with a gentle slope in the southern and a steeper slope in the northern. The dip angle of the ore body ranges from 25° to 50°, while between lines 3 and 11, the dip angle is generally between 50° and 60°. The ore body is mainly composed of primary siderite, with only a minimal amount of oxidized ore located south of line 0. The quality of the ore body is stable. The roof, floor, and surrounding rock in the mining area are primarily composed of limestone, which belongs to a hard rock group. The integrity of these rock masses good, and their quality is rated as average, reflecting a moderate level of rock mass quality. This study selected the southern 23 # mining area for analysis. The parameters of the surrounding rock are detailed in Table 9.

Table 9. Parameters of surrounding rock.
Based on the physical and mechanical parameters of the original rock and the stress similarity ratio, the theoretical values of the similar materials were calculated and input into the PSO-BP prediction model. The optimal mixing ratios for the similar materials were determined as follows: aggregate-to-binder ratio of 4.7:1, cement-to-gypsum ratio of 4.6:1, barite content of 36%, and glycerol content of 7%. Samples were prepared using these material mixing ratios and the aforementioned methods for mechanical testing. The theoretical and measured values of these parameters for the original rock and similar materials are summarized in Table 10. Simultaneously calculate the relative error between the theoretical value and the actual value, using the following formula, see Equation 17:
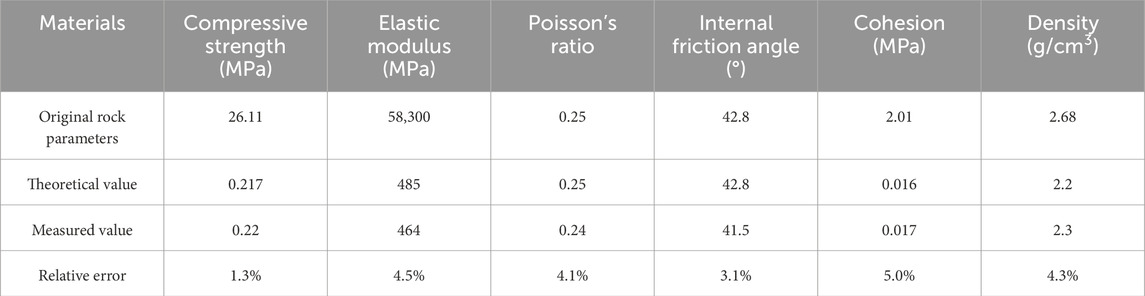
Table 10. Physical and mechanical parameters of prototype and model materials.
A comparison of theoretical and measured values of physical and mechanical parameters for similar materials in Table 10 revealed that the errors for density, uniaxial compressive strength, elastic modulus, Poisson’s ratio, cohesion, and internal friction angle were all within 5%. This confirms the reliability of the empirical formula derived in this study for efficiently determining the mixing ratios for similar materials.
This study investigated the optimal mixing ratio of similar materials for surrounding rock in goafs using orthogonal experiments and machine learning techniques. The results are as follows:
(1) The similar material test used quartz, cement, gypsum, barite, and glycerol as raw materials. The density, uniaxial compressive strength, elastic modulus, Poisson’s ratio, cohesion, and internal friction angle for similar materials were 1.597–2.227 g/cm3, 0.481–5.77 MPa, 2.33–1575.73 MPa, 0.09–0.86, 0.1422–3.147 MPa, and 19.2°–40.6°, respectively; while their average values were 1.984 g/cm3, 1.771 MPa, 454.74 MPa, 0.39, 0.842 MPa, and 29.5°, respectively. The results indicated high density and generally low compressive strength, suggesting moderate strength of the material. The elastic modulus showed significant variation, reflecting large differences in material stiffness. The Poisson’s ratio was relatively high, indicating certain compressibility of the material. The cohesion was low, suggesting average internal bonding capacity of the material. The internal friction angle was relatively high, showing strong shear resistance of the material.
(2) Analysis of the data from 25 sets of mix-ratio tests indicated that the cement-to-gypsum ratio is the primary factor affecting the compressive strength and elastic modulus of similar materials.Barite had a significant impact on the density of similar materials. The aggregate-to-binder and cement-to-gypsum ratios greatly influenced the Poisson’s ratio and cohesion. Glycerol content is the main factor affecting the internal friction angle of similar materials.
(3) Comparison between the PSO-BP and traditional BP prediction models showed that that the PSO-BP neural network model performed better in regression prediction analysis. It offered higher accuracy and efficiency in determining the optimal mixing ratio for similar materials.
(4) By inputting actual mechanical parameters into the PSO-BP prediction model, the optimal mixing ratio for similar materials was obtained. Similar materials that met the requirements of similarity theory were successfully prepared. This provides an effective experimental platform for simulating the mechanical behaviors of surrounding rock in goafs. The errors between theoretical and measured values of key parameters, such as density, compressive strength, elastic modulus, Poisson’s ratio, cohesion, and internal friction angle were all within 5%. This verifies the reliability of the PSO-BP neural network prediction model in quickly determining the mixing ratios for similar materials.
Although this study has achieved certain results, there are still some limitations: 1) limited sample size: although an orthogonal experimental design was used, only 25 different proportioning schemes were tested, which may not fully cover all possible combination situations. 2) Insufficient consideration of environmental factors: During the research process, the impact of different environmental conditions (such as temperature and humidity) on the properties of similar materials was not fully taken into account, which may lead to deviations in material performance from expectations under certain specific conditions. 3) Insufficient long-term stability assessment: There is a lack of in-depth research on the stability and durability of similar materials in long-term use. Based on the shortcomings of the above research, the following future research directions are proposed: 1) Expanding the sample range: further increasing the number of different proportioning schemes, especially for material performance testing under extreme conditions, to obtain more comprehensive data support. 2) Environmental adaptability research: Conduct research on the properties of similar materials under different environmental conditions (such as high temperature, low temperature, high humidity, etc.), explore their adaptability and variation patterns. 3) Long term stability testing: Establish a long-term monitoring mechanism, regularly test the physical and mechanical properties of similar materials, evaluate their stability and durability during long-term use, and ensure their reliability and effectiveness in practical applications. 3) Introducing more advanced algorithms: In addition to the existing PSO-BP neural network model, other advanced machine learning or deep learning algorithms such as Convolutional Neural Networks (CNN), Long Short Term Memory Networks (LSTM), etc. can be attempted to improve prediction accuracy and efficiency. 4) This article mainly focuses on the physical and mechanical parameters of similar materials, but does not involve the analysis of the microstructure of the materials. Future research can combine microscopic analysis techniques such as scanning electron microscopy (SEM) and X-ray diffraction (XRD) to further explore the relationship between material microstructure and macroscopic properties. Through the above improvement measures, the proportioning scheme of similar materials can be further improved, and more solid theoretical and technical support can be provided for their widespread application in engineering practice.
National Natural Science Foundation of China: Research on the Engineering Induced Mechanism and Monitoring and Early Warning of Rock Slope Disasters in Mountainous Areas (U1602232).
The raw data supporting the conclusions of this article will be made available by the authors, without undue reservation.
SW: Writing – original draft. JC: Resources, Supervision, Writing – review and editing. YZ: Resources, Supervision, Writing – review and editing. XQ: Writing – review and editing. ZZ: Writing – review and editing. XW: Writing – review and editing.
The author(s) declare that no financial support was received for the research and/or publication of this article.
Author YZ was employed by China Construction Eighth Engineering Division Corp., Ltd. Author XQ was employed by Zhejiang Construction Co., Ltd. of China Construction Eighth Engineering Division. Author ZZ was employed by Tianin Construction Engineering Co., Ltd. of China Construction Eighth Engineering Division. Author XW was employed by The Fourth Construction. Corp., Ltd. of China Construction Eighth Engineering Division.
The remaining authors declare that the research was conducted in the absence of any commercial or financial relationships that could be construed as a potential conflict of interest.
The author(s) declare that no Gen AI was used in the creation of this manuscript.
All claims expressed in this article are solely those of the authors and do not necessarily represent those of their affiliated organizations, or those of the publisher, the editors and the reviewers. Any product that may be evaluated in this article, or claim that may be made by its manufacturer, is not guaranteed or endorsed by the publisher.
Cao, Y. J., Duan, X. L., Wang, W., Zhu, Q., Zhao, D., Jiang, L., et al. (2024). Experimental investigation on the macro-mechanical behavior and micromechanical damage model of Xiyu conglomerate with pores and inclusions under triaxial compression. Int. J. Min. Sci. Technol. 34 (11), 1529–1549. doi:10.1016/j.ijmst.2024.10.006
Chen, D. N., Zhao, J. D., Deng, X. N., and Deng, X. N. (2023). Research status of intelligent optimization algorithms in China: visualization analysis based on CiteSpace. Comput. Appl. Softw. 40 (4), 251–256.
Ding, C. J., and Wang, J. L. (2009). Stability evaluation of goaf foundation using neural network method. J. Min. Saf. Eng. 26 (2), 208–211.
Dong, L. J., Shu, H. M., Tang, Z., and Yan, X. (2023). Microseismic event waveform classification using CNN-based transfer learning models. Int. J. Min. Sci. Technol. 33 (10), 1203–1216. doi:10.1016/j.ijmst.2023.09.003
Fernandez, A., Sanchidrian, J. A., Segarra, P., Gomez, S., Li, E. M., and Navarro, R. (2023). Rock mass structural recognition from drill monitoring technology in underground mining using discontinuity index and machine learning techniques. Int. J. Min. Sci. Technol. 33 (5), 555–571. doi:10.1016/j.ijmst.2023.02.004
Fraldi, M., and Guarracino, F. (2009). Limit analysis of collapse mechanisms in cavities and tunnels according to the Hoek-Brown failure criterion. Int. J. Rock Mech. Min. Sci. 46 (4), 665–673. doi:10.1016/j.ijrmms.2008.09.014
Gao, H., Zhai, Y., Wang, T., Li, Y., Meng, F., Zhang, H., et al. (2023). Compression failure conditions of concrete-granite combined body with different roughness interface. Int. J. Min. Sci. Technol. 33 (3), 297–307. doi:10.1016/j.ijmst.2022.12.002
Hu, H. W., Ye, Y. C., Geng, H. B., and Zhao, Z. W. (2018). Research on stability evaluation of layered ore deposits in mined areas based on BP neural network. Chem. Minerals Process. 47 (3), 60–63, 69.
Hu, S. W., Li, Y. H., Dan, C. X., Xue, X., and Yang, H. Q. (2023). Research on slope stability based on improved PSO-BP neural network. J. Disaster Prev. Reduct. Eng. 43 (4), 854–861.
Li, J. W., Feng, S. W., and Zhou, Y. (2021). Mechanical mechanism of surrounding rock disaster evolution in tunnel underpass mining area construction. J. Central South Univ. Nat. Sci. Ed. 52 (2), 543–554.
Li, K. S., Yang, S. Q., Liu, C., Chen, Y., Zhang, G., and Ma, Q. (2023a). Mechanical response and microscopic damage mechanism of pre-flawed sandstone subjected to monotonic and multilevel cyclic loading: a laboratory-scale investigation. Int. J. Min. Sci. Technol. 33 (12), 1487–1510. doi:10.1016/j.ijmst.2023.11.002
Li, X., Si, G. Y., Oh, J., Canbulat, I., Kong, R., and Zhang, J. (2023b). A novel elastoplastic model for Yunnan sandstone under poly-axial loading. Int. J. Min. Sci. Technol. 33 (7), 801–814. doi:10.1016/j.ijmst.2023.04.002
Liu, C. Y., Zhao, G. M., Xu, W., Meng, X., Liu, Z., Cheng, X., et al. (2023). Experimental study on failure characteristics of single-sided unloading rock under different intermediate principal stress conditions. Int. J. Min. Sci. Technol. 33 (3), 275–287. doi:10.1016/j.ijmst.2022.12.005
Liu, X. S., Yang, S. L., Tan, Y., Wang, J., Li, X., and Zhang, Y. (2024). An innovative test method for mechanical properties of sandstone under instantaneous unloading confining pressure. Int. J. Min. Sci. Technol. 34 (12), 1677–1692. doi:10.1016/j.ijmst.2024.11.011
Liu, Y. L., Sun, G. H., Ye, H. T., Zhao, K., and Hu, Y. F. (2017). Simulation experiment study on rock movement law in goaf of steeply inclined ore body. Mineral Prot. Util. (1), 29–33.
Lü, Y., Diao, Y. H., Zhou, Z. H., Chai, S. F., and Wang, J. K. (2021). Proportion of granite similar material used in large-scale shaking table tests. China Earthq. Eng. J. 43 (5), 1150–1159.
Mandal, S. K., and Singh, M. (2009). Evaluating extent and causes of overbreak in tunnels. Tunn. Undergr. Space Technol. 24 (1), 22–36. doi:10.1016/j.tust.2008.01.007
Pei, Y. Y., Wu, J. N., Sun, Q. D., Zhang, Z. W., and Yang, X. B. (2021). Improved GA-BP complex goaf hazard level evaluation model. J. Undergr. Space Eng. 17 (S2), 978–984.
Qiao, S. F., Tan, J. K., Yong-gang, Z., Li-jun, W., Ming-fei, Z., Jun, T., et al. (2021). Settlement prediction of foundation pit excavation based on the GWO-ELM model considering different states of influence. Adv. Civ. Eng. 2021, 8896210. doi:10.1155/2021/8896210
Shi, X. M., Liu, B. G., and Xiao, J. (2015). Method for determining the ratio of cement and gypsum bonding similar materials. Geotech. Mech. 36 (5), 1357–1362.
Sun, G. Y. (2020). Research on long-term stability test equipment and similar simulation materials for underground caverns with weak interlayers containing water. Qingdao,China: Qingdao University of Science and Technology, 39–53.
Wang, J. S. (2022). Experimental study on similar materials ratio of weakly expansive mudstone based on orthogonal design. J. Gansu Sci. 34 (4), 130–136.
Xu, T., Gao, Y. W., Zhang, J. X., Ren, X. H., and Ma, Z. C. (2022). Preparation and test of similar materials for novel geomechanical model. Yangtze River 53 (S2), 113–118.
Yang, J., and Zeng, W. W. (2022). Prediction model of surface subsidence in goaf based on GA-BP neural network. Min. Metallurgy Eng. 42 (2), 42–45.
Yu, T., Zhang, Q., Zhang, S. D., Zhao, G. M., and Fang, Y. (2021). Characteristics analysis and stability control of surrounding rock in goaf tunnels. J. Undergr. Space Eng. 17 (3), 909–917.
Zhan, X. Y., Gao, L., Zhao, F. H., Wang, Y. Y., and Liu, P. (2023). Experimental study on the proportioning of ultra-high strength similar materials for large similarity ratio model experiments. Coalf. Geol. Explor. 51 (11), 109–118.
Zhang, C. L., Jiang, G. L., Lei, D., Asghar, A., Su, L., and Wang, Z. (2021a). Large-scale shaking table test on seismic behaviour of anti-slide pile-reinforced bridge foundation and gravel landslide: a case study. Bull. Eng. Geol. Environ. 80, 1303–1316. doi:10.1007/s10064-020-02006-3
Zhang, J. W., Wang, Z., and Song, Z. (2020). Numerical study on movement of dynamic strata in combined open-pit and underground mining based on similar material simulation experiment. Arabian J. Geosciences 13 (16), 785. doi:10.1007/s12517-020-05766-0
Zhang, Q. Y., and Li, S. C. (2005). Numerical analysis methods for rock masses and principles and engineering applications of geomechanical model tests. Beijing: China. Water Resources and Hydropower Press.
Keywords: goaf, limestone, similar materials, machine learning, predictive models
Citation: Wang S, Chen J, Zhang Y, Qiao X, Zhang Z and Wang X (2025) Determination of similar material proportions based on orthogonal experiments and neural network optimization in the goaf area. Front. Earth Sci. 13:1582941. doi: 10.3389/feart.2025.1582941
Received: 25 February 2025; Accepted: 19 March 2025;
Published: 10 April 2025.
Edited by:
Wenling Tian, China University of Mining and Technology, ChinaCopyright © 2025 Wang, Chen, Zhang, Qiao, Zhang and Wang. This is an open-access article distributed under the terms of the Creative Commons Attribution License (CC BY). The use, distribution or reproduction in other forums is permitted, provided the original author(s) and the copyright owner(s) are credited and that the original publication in this journal is cited, in accordance with accepted academic practice. No use, distribution or reproduction is permitted which does not comply with these terms.
*Correspondence: Junzhi Chen, NDY1NDI0ODczQHFxLmNvbQ==
Disclaimer: All claims expressed in this article are solely those of the authors and do not necessarily represent those of their affiliated organizations, or those of the publisher, the editors and the reviewers. Any product that may be evaluated in this article or claim that may be made by its manufacturer is not guaranteed or endorsed by the publisher.
Research integrity at Frontiers
Learn more about the work of our research integrity team to safeguard the quality of each article we publish.