
95% of researchers rate our articles as excellent or good
Learn more about the work of our research integrity team to safeguard the quality of each article we publish.
Find out more
ORIGINAL RESEARCH article
Front. Earth Sci. , 11 March 2025
Sec. Economic Geology
Volume 13 - 2025 | https://doi.org/10.3389/feart.2025.1552058
This article is part of the Research Topic Applications of Artificial Intelligence in Geoenergy View all 5 articles
Unlike conventional sandstone reservoirs, which store hydrocarbons in sandstone pores, fault-controlled tight sandstone reservoirs are unconventional, primarily storing oil or/and gas in fault zones. While these reservoirs have significant reserves, their highly heterogeneous fault zones structures, including fault core and damage zone, pose challenges for geological modeling and precise development. Traditional two-point geostatistics (TPG) struggle to reproduce strike-slip fault zones patterns, and object-based methods have difficulty statistically quantifying their structural parameters. Deterministic methods, truncated by seismic data threshold, often misalign with well data, reducing accuracy in representing fault zone details. To overcome these challenges, we propose a new modeling workflow for fault-controlled tight sandstone reservoirs based on multi-sources information-constrained multiple-point geostatistics (MPG). First, a deep neural network (DNNs) is used to correlate conventional logging curves with fracture density (FD) to obtain well-interpreted facies data. Next, inter-well factors like brittleness index, shale content, and fault proximity are used to construct four single-sources probability bodies. These are combined into a multi-source probability body using the Permanence of Ratios (PR) method, which effectively integrates the contributions of different sources for greater constraint. Finally, the multiple-point geostatistical direct sampling (DS) algorithm generates a three-dimensional (3-D) geological model that captures the reservoir’s geological features, while satisfying the multi-source information constraints. The results shows that the proposed method effectively reduces model uncertainty and improves spatial prediction of the reservoir, achieving over 85% accuracy when compared with field production data. This workflow offers a promising approach for fine-scale modeling of fault-controlled tight sandstone reservoirs, with broad potential for similar reservoir development and management.
The fault zone is a complex volumetric zone composed of various internal structures (Brogi, 2008; Caine et al., 1996), affecting groundwater migration, CO2 sequestration, and geothermal energy development. In conventional reservoirs, fault zones are typically seen as a conduit structural for fluid connectivity but do not serve as reservoir themself (Liu et al., 2020; Zeng and Li, 2009; Wang et al., 2022). However, recent studies have revealed that in the dense lithologies, fault zones can create reservoir space through dissolution by surface water or deep hydrothermal fluids, forming unique fault-controlled reservoir (Li et al., 2019; Qiao et al., 2023). Examples include fracture-cave carbonate reservoirs in the Tarim and Sichuan Basins, China (Deng et al., 2022; Liu et al., 2021; Wang et al., 2021), and fault-controlled tight sandstone reservoirs in the Ordos Basin (He et al., 2020; Zhao et al., 2024; Wang Y. et al., 2023), with reserves in the billions of tons.
Geological modeling integrates multi-source information to accurately represent reservoir spatial distribution, making it essential for oil and gas field development. However, the internal structures of fault zones have high heterogeneity, and the availability of data is limited. For example, in fault-controlled sandstone reservoirs, particularly those formed by strike-slip fault zones, two types of facies are typically identified: the fault core and the damage zone (Berg and Skar, 2005; Faulkner et al., 2010). The fault core is the result of localized strain and intense shear, accommodating most of the displacement within the fault zone and may include slip surfaces, chemically altered rocks, cataclasites, gouges, and breccias (Torabi et al., 2019). The damage zone, with weaker deformation, features subsidiary structures like fractures, folds, and joints (Balsamo et al., 2019; Celestino et al., 2020). In outcrop settings, the fault core and damage zone characteristics are often directly observable. However, the boundary between them becomes less distinct in the subsurface. Due to limited seismic resolution, detailed structural information is difficult to obtain, reducing the accuracy of fault core and damage zone boundary identification. While well data can hint at fracture distribution, its spatial limitation hinders precise delineation of fault structures. Additionally, reservoir location within fault zones increases risks of drilling blowouts and fluid losses, limiting the availability of well data. Both of them pose challenges for fault-controlled tight sandstone reservoir modeling to guide reservoir production and development.
Satellite images or surface scans are often measured and digitally processed to construct conceptual reservoir models (Braathen et al., 2009; Qu and Tveranger, 2016). For example, Choi et al. (2016) defined structural boundaries between fault core and damage zone by measuring fracture density (FD) through fault-controlled tight sandstone reservoirs outcrop observation. Similarly, Silva et al. (2022) built continuous permeability model of a basin-bounding fault damage zone using sequential Gaussian simulation (SGS) techniques based on outcrop measurements. These models align well with fault zone patterns and accurately characterize parameters within fault zone structures, and can provide a conceptual model to guide the understanding of underground fault zones reservoirs.
Common subsurface reservoir modeling methods include deterministic methods (e.g., constrained by seismic data or trend surfaces) and stochastic methods (e.g., two-point geostatistics (TPG) or object-based modeling). Seismic attribute-constrained deterministic methods have been widely used to model subsurface fault-controlled tight sandstone reservoirs (Botter et al., 2017a; Botter and Champion, 2019; Li et al., 2022). This involves establishing thresholds for seismic attribute that define facies boundary, based on the relationship between 1D drilled reservoir intervals at wells and corresponding seismic attribute values. These thresholds are then applied to convert the 3-D seismic volume to the reservoir model (Zhang T. et al., 2021). However, deterministic method often fails to fully align with well data and lack the precision needed to capture fault zones structures due to the amplifying effect of seismic data (Botter et al., 2017b; Fossen et al., 2018), limiting their accuracy for detailed reservoir development.
Compared to deterministic methods, stochastic methods better assess the uncertainty in modeling results. However, few are specifically tailored for fault-controlled tight sandstone reservoir. TPG is unsuitable for this type of modeling, as it struggles to capture the complex morphology of fault zone structures (Deutsch and Journel, 1992). Object-based methods also face challenges in these reservoirs, where statistically quantify key morphological parameters, such as the height and aspect ratio of irregular, banded fault cores, remains difficult.
The multiple-point geostatistics (MPG) method has gained popularity over the past 30 years for its ability to combine data conditioning with geological pattern reconstruction (Mariéthoz and Caers, 2014). This makes it especially effective for reservoir modeling in complex environments like meandering rivers and deltas (e.g., Yin et al., 2020; Wang et al., 2022b). Initially introduced by Farmer, Deutsch and Journel (Farmer, 1988; Deutsch and Journel, 1992), MPG has since evolved to address challenge to non-stationarity, reservoir continuity, conditional processing and simulation speed. Algorithms such as Snesim (Strebelle, 2002), SIMPAT(Arpat, 2005), FILTERSIM (Zhang et al., 2006), iCCSIM (Tahmasebi et al., 2012), DS (Mariethoz et al., 2010) and GOSIM (Yang et al., 2016) have been developed to enhance these aspects. The DS algorithm, in particular, stands out for its simplicity and efficiency, directly samples the training image while effectively preserving the multi-point relationships of complex geological structures. Additionally, MPG can greatly reduce model uncertainty when constrained by accurate probability bodies, which incorporate expert geological knowledge, well data, and other relevant information to improve model accuracy (Tahmasebi, 2018).
Compared to single-sources data constraints, multiple-source probability bodies better handle data noise and reduce uncertainty by minimizing errors from individual source, enhancing model stability (Cui et al., 2021). Common probability fusion methods in MPG include Bayesian updating (Jef, 2011), weighted averaging, and evidence theory (i.e., Dempster-Shafer theory) (Shafer, 1976). These methods combine data from different sources (e.g., logging data, seismic data) to generate a comprehensive probability body model. Bayesian updating incorporates new information progressively by updating prior and posterior probabilities, while weighted averaging integrates data based on reliability. Evidence theory uses belief functions to obtain uncertainty. When dealing with multiple data sources and high uncertainty, Bayesian updating and Dempster-Shafer Theory are computationally intensive, and determining weights for weighted averaging is challenging. Journel (2002) proposed the Permanence of Ratios (PR) model as an alternative probability fusion method. It is computationally simpler in high dimensions, making it suitable for large datasets and complex geological modeling. It assumes that the ratio of probability increments across different data types remains constant, implying that conditional independent between data. This allows the PR model to effectively integrate data from different sources and scales without losing geological information (Journel, 2002). The PR model has been successfully applied in geological modeling of complex underground reservoirs such as braided river sandstones and karst carbonates (Kang et al., 2023; Liu et al., 2018; Liu et al., 2020).
Additionally, fault-controlled tight sandstone reservoirs often have limited well data due to drilling challenges like lost circulation, and core data is particular scarce. Well-interpreted facies data are crucial for subsurface reservoir modeling as they provide reliable hard data. Cumulative FD curves are effective for classifying fault facies (Choi et al., 2016), and conventional logging curves correlate well with fracture development, allowing for the classification of facies at wells by fitting the relationship between logging data and FD. However, traditional approaches like multiple regression analysis struggle with complex nonlinear relationships, especially in uneven fracture distribution. Machine learning (ML), including deep neural networks (DNNs), provide robust tools to model these complexities.
Therefore, to model a more accurate fault-controlled tight sandstone reservoir to meet the needs of reservoir development, we propose a new modeling workflow that combines the DNNs method, the PR model, and the DS algorithm, with surface outcrop patterns as prior information. First, reservoirs characteristics are described using outcrop observation, core data, log data and seismic data. Then, DNNs correlate conventional logging curves with FD to obtain well-interpreted facies data. Inter-well factors like brittleness index, shale content, and fault proximity are used to construct multi-source probability body using the PR probability fusion method. Finally, the DS algorithm stochastically generates several three-dimensional (3-D) geological models that capture the reservoir’s geological features while meeting the multi-source information constraints.
This paper is organized as follows: the first section provides an overview of the study area, followed by the proposed workflow in the second; the third section details the development characteristics of fault-controlled tight sandstone reservoir; the forth section applied the DNNs method for one-dimensional (1-D) well facies interpretation, while the fifth introduce the PR method for constructing 3-D multi-sources probability constraint bodies; the sixth section covers the DS method, 3-D model generation, and accuracy testing; the final two sections include the discussion and conclusions.
The Ordos Basin, a large-scale cratonic basin in western North China, features a research area located at its southern margin, near the Yishan Slope to the north and the Weibei Uplift to the south, within a transitional zone of tectonic activities (Figure 1A). The basin’s tectonic evolution has resulted in the numerous fractures and fissures, especially in the southern region. During the Yanshan and Xishan periods, major fractures and fissures were formed in the Triassic Chang 8 to Chang 6 formations. During the Yanshan period, oblique collision between the Pacific Plate and the Eurasian Plate at the southern margin of the basin created a NW-SE stress field, promoting extensive regional fractures in the Mesozoic strata (Lyu et al., 2019; Wang et al., 2019). During the Xishan period, the subduction of the Indian Plate and the Pacific Plate overlaid or modified the pre-existing faults, resulting in the development of left-lateral strike-slip faults, predominantly trending in the NEE direction, within the Chang 8 to Chang 6 formations (Meng et al., 2023) (Figure 1B).
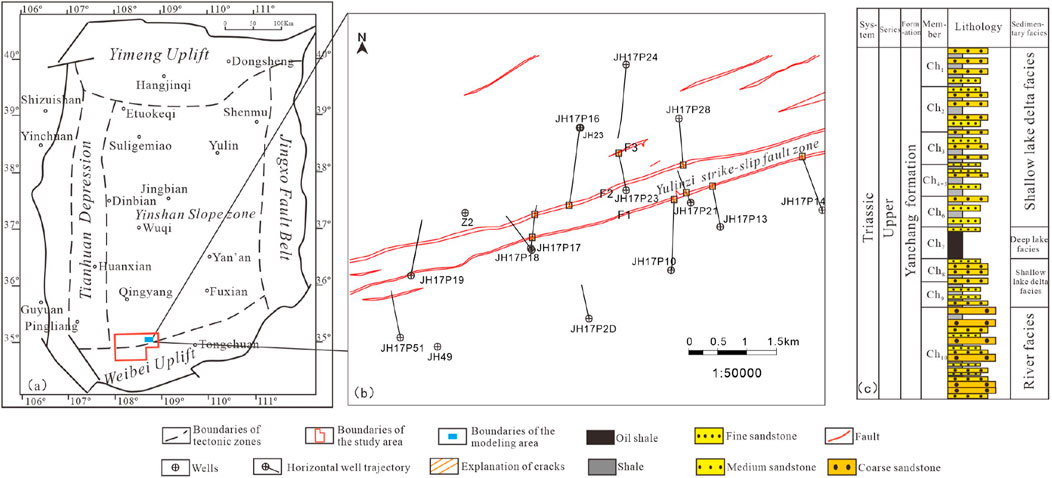
Figure 1. Location of the study area and stratigraphic chart. (A) Regional tectonic setting; (B) Well locations and fault distribution in the modeling area; (C) Stratigraphic columnar section of the Yanchang Formation.
This study focuses on the Chang 8-1 sub-member of the Yanchang Formation, characterized by a braided river delta front depositional system with a thickness of approximately 40 m–60 m. The lithology is mainly light gray fine sandstone, occasionally interbedded with siltstone and dark gray mudstone or silt mudstone (Figure 1C). Core data show that the sandstone porosity in the Chang 8 member ranges from 8% to 12%, with permeability between 0.1 × 10⁻³ μm2 and 0.2 × 10⁻³ μm2, indicating a low porosity and ultra-low permeability reservoir (Sun et al., 2019).
The proposed workflow for modeling fault-controlled tight sandstone reservoirs involves four main steps: reservoirs description, well facies interpretation, multi-source probability fusion, and geological modeling (Figure 2).
In the first step, the internal structure of fault-controlled tight sandstone reservoirs in the study area is described using outcrop observations, core, logging, and seismic data to obtain expert geological knowledge and corresponding prior geological patterns. The second step involves well facies interpretation where DNNs is applied to relate conventional logging data with FD and classify fault facies based on cumulative FD curves. In the third step, four factors—brittleness index, shale content, faults proximity, and coherence attributes—are selected to build single-source probability bodies, which are then integrated into a comprehensive multi-source probability model using PR. Finally, 3-D geological modeling is conducted using DS, and facies-constrained permeability models are then established.
This section first observes the geological pattern of fault-controlled tight sandstone from field outcrops, then describes reservoir characteristics at core, logging, and seismic scales in the study area to guide more accurate 3-D modeling.
Outcrop profiles reveal the geological patterns of fault-controlled tight sandstone reservoirs. Observations of the Xujiahe Formation outcrops in the western Sichuan depression show higher FD in the hanging wall than in the footwall, with fracture frequency increasing near the fault plane (Liu et al., 2023). In the Ruihe section of Pingliang City, Gansu Province, the Yanchang Formation in the Ordos Basin fully exposes well-developed fault-related fractures (Figure 3). Near the fault, fragmented sand bodies create a fault core about 20 cm wide with “cavities,” resulting in higher porosity than the surrounding bedrock. The damage zone, extending 30 cm–50 cm from the fault, contains multiple sets of conjugate fractures, with FD decreasing with distance from the fault.

Figure 3. Outcrop pattern of fault-controlled tight sandstone reservoirs (adapted from Lyu et al., 2019). (A, C) show fault zone outcrops observed in Gansu and Xinjiang, respectively, while (B, D) are the corresponding schematic patterns. The fault core accommodates most of the fault displacement, leading to sandrock fragmentation and the formation of cavities. FD gradually decreases from the damage zone to the wallrock.
Figure 4 show core samples photographs at JH17P23 well from the fault-controlled tight sandstone reservoir in the study area. Core observation directly provide high-resolution subsurface data, revealing detailed fracture developmental characteristics. Most fractures are vertical structural types, with occasional nearhorizontal stratification fractures (Figures 4A, B). They range from 50 cm to 100 cm in length and 0.2 mm–0.5 mm in width, predominantly remaining open, though some are calcite-filled. Fracture development varies notably across lithologies (Figures 4C, D) and will be further elaborated in Section 5.
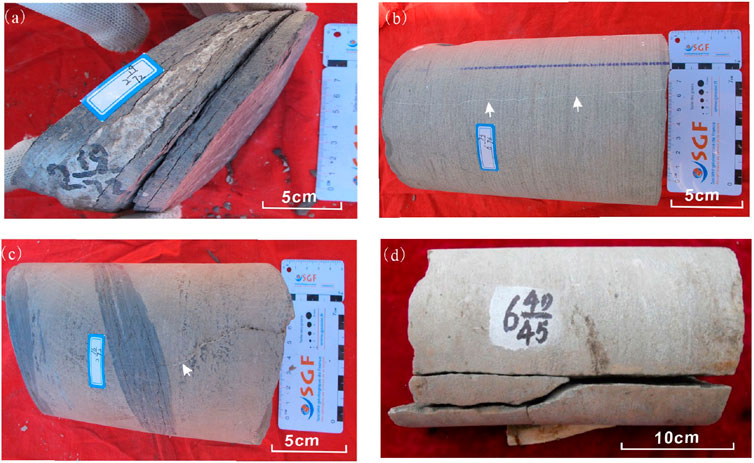
Figure 4. Core samples photographs in the study area. (A) Low-angle bedding-parallel oblique fracture; (B) High-angle vertical structural fractures with calcite-filled fissure; (C) Structural fractures extending along the sandstone and terminating at a mudstone interlayer; (D) High-angle vertical structural fracture.
Compare to direct core observation, conventional logs, imaging logs and seismic data provide an indirect but broader view of the internal structure of fault-controlled tight sandstone reservoirs. For instance, horizontal well JH17P23, which intersects faults F2 and F3 in the Yulinzi fault zone, displays significant stratigraphic displacement in large-scale seismic profiles (Figures 5A, B). In high-resolution imaging logs, capable of detecting features at scale of 2 cm, fractures appear as dark sinusoidal curves, forming black bands as frequency increases. Conventional logs, with a detection scale of 12.5 cm, reveal distinctive fault zone responses, where drilling fluid infiltration along fractures lowers resistivity in fractured segments. The fault core has higher porosity than both the damage zone and the surrounding wallrock, along with greater permeability through the fault zone. Thus, a well-defined vertical damage zone and fault core structure at F3 fault can be identified, displaying a banded structure ranging from less than 1m to nearly 10 m (Figures 5C, D). This detailed fault characterization is essential for accurately represent the heterogeneity of subsurface fault-controlled tight sandstone reservoirs.
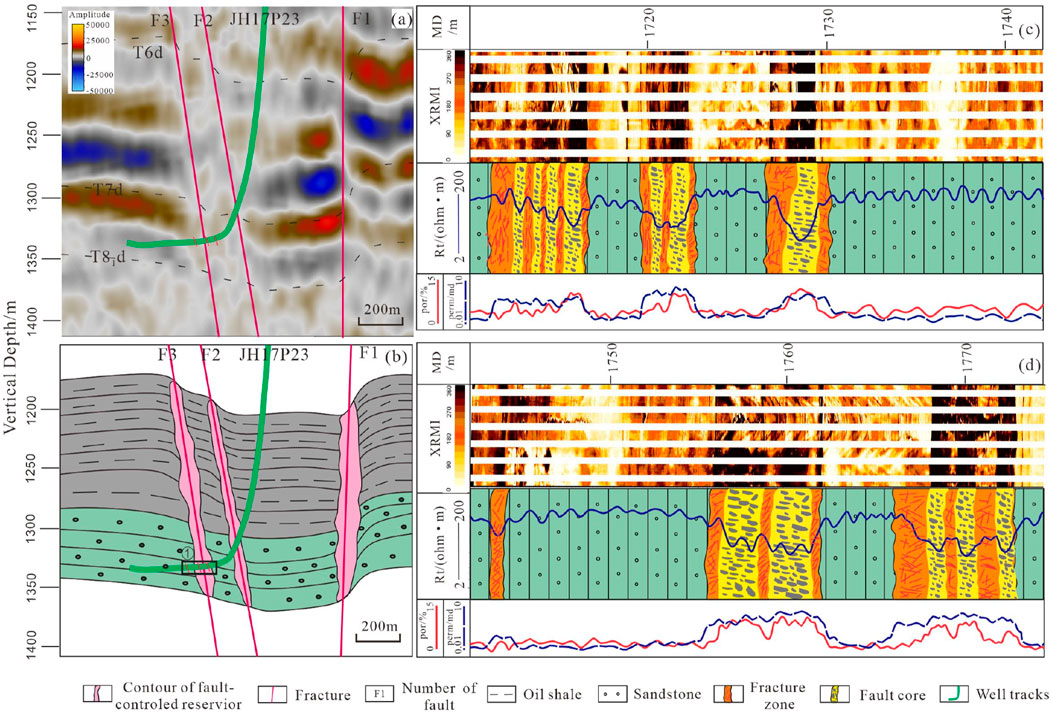
Figure 5. Schematic diagram of the fault-controlled tight sandstone reservoir structure. (A) Seismic profile over well JH17P23; (B) Reservoir pattern for well JH17P23; (C, D) are log-scale views of black frame area in b, displaying the internal structure of the fault-controlled tight sandstone reservoir. Imaging logs characterize the distribution patterns of fault cores and damage zones, which strongly correlate with conventional log curves.
Seismic data is crucial for depicting large-scale inter-well fracture distribution in strike-slip fault zones, revealing structural variability due to differing local stress fields. Figure 6 visualizes of the Yulinzi fault zone structure in the study area. In Figure 6A, the coherence slice clearly highlights the planar distribution of the fault zone, with bright areas indicating lower structural coherence (fault cores) and darker areas indicating higher structural coherence (damage zones). Black areas indicate wallrock without structural activity. The study area consists of two parallel primary strike-slip faults, predominantly exhibiting linear structures with localized braided structures. Figures 6B–E display amplitude distribution maps of different fault segments, illustrating various structural patterns. Figures 6D, E show cross-sections of linear segments with typical graben structures and significant stratigraphic displacement. Figures 6B, C depict cross-sections of braided segments with branching faults, indicating areas of intense local deformation with complex flower structures. A strong correlation exists between seismic attributes and faults, enable a more accurate capture of the complexity of strike-slip fault zone structures.
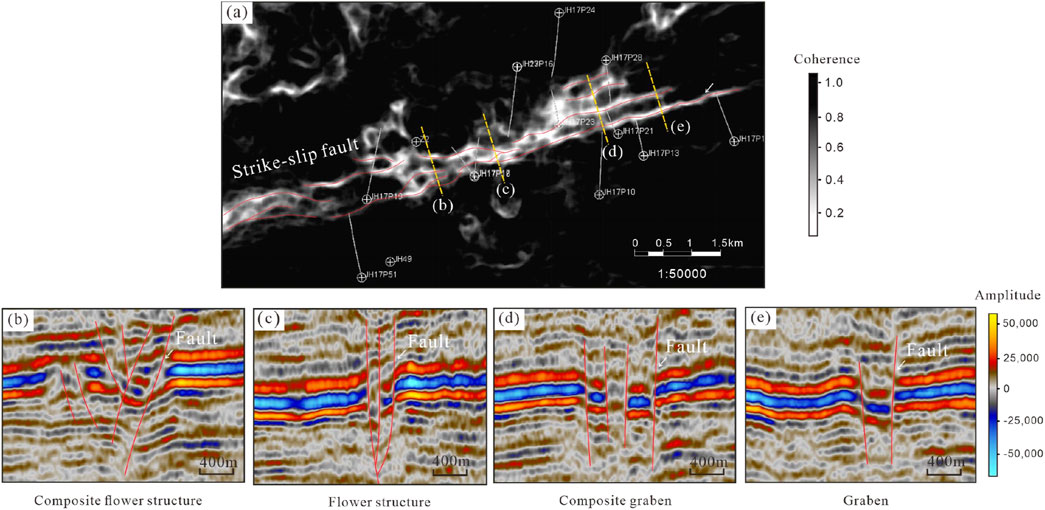
Figure 6. Planer seismic coherence attribute (A) and corresponding seismic amplitude profile (B–E) of fault-controlled tight sandstone reservoirs. The red line represents fault lines, and the yellow dashed line in (A) marks the section line locations for composite flower structure (B) flower structure (C), composite graben (D), and Graben (E).
Our study area contains 13 horizontal wells intersecting strike-slip faults (Figure 1), with two wells (JH17P23, JH23) containing imaging log and core data. From the imaging log, we sampled 845 FD points at 0.1 m intervals. averaged every five points after removing outliers, yielding 169 sample points. Correlation analysis of normalized conventional logs with imaging logs-measured FD in Figure 7A shows strong correlations for wellbore diameter (CNL), resistivity (RT), acoustic transit time (DT), and change in acoustic transit time (ΔDT), indicating their fracture sensitivity. Previous studies support these results, for example, drilling through fault zones can cause wellbore collapse and wellbore diameter enlargement (Tokhmechi et al., 2009; Lyu et al., 2016) and drilling fluid infiltration into fractures often lower resistivity, with more pronounced effect in larger aperture and higher angle (Dong et al., 2020a); Longitudinal waves travel faster through rock than mud in fracture segments, leading to noticeable frequency jumps, particularly with smaller fracture angle (Dong et al., 2020b; Zeng et al., 2016). In contrast, properties like density have week correlation with FD in the fault-controlled tight sandstone reservoir, as fractures development may increase rock pore volume and decrease rock density inconsistently (e.g., calcite-filled fractures may either increase or decrease it).
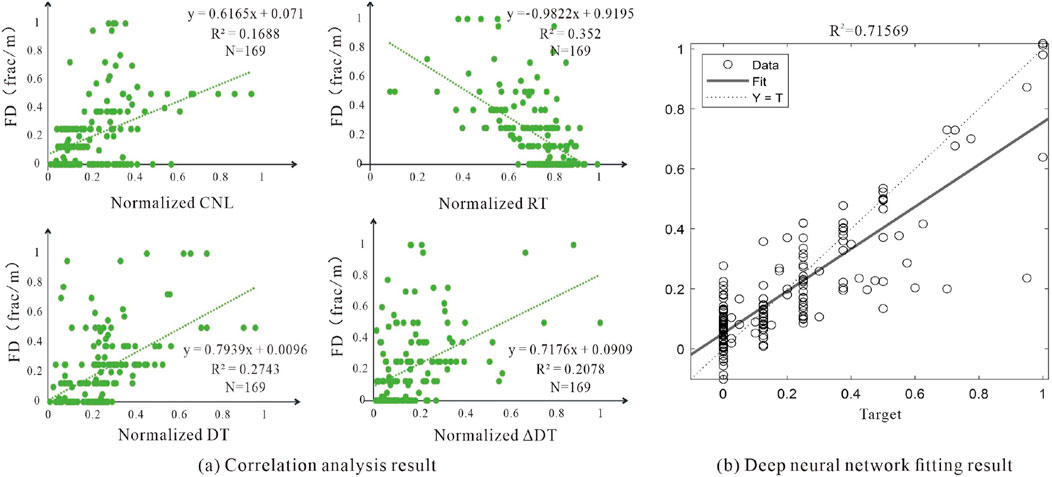
Figure 7. Fitted results. (A) Correlation analysis between CNL, RT, DT, ΔDT, and FD. R2 and N represent the coefficient of determination and the number of sample points, respectively; (B) Neural network fitting results.
We aimed to model the relationship between these four conventional logs with FD using DNNs, which are well-suited for capturing complex nonlinear patterns. DNNs approximate a mapping
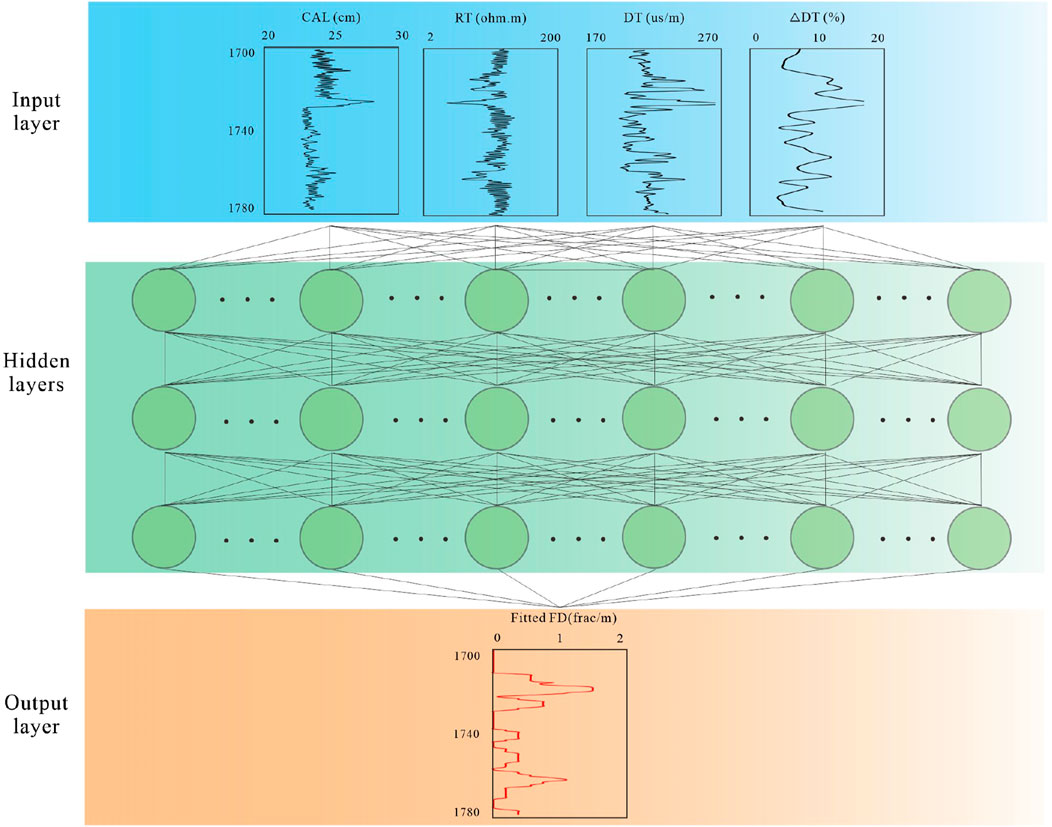
Figure 8. DNNs using in our application. Note that input and output layers represent values at each depth rather than entire log curves.
Figure 9 compares FD values from DNNs prediction (red dashed line), imaging logs interpretations (green bar graph), and core samples measurements (yellow bar graph). The DNNs predictions align closely with actual values, particularly when predicted FD exceed 4 fracture/m (abbreviated as frac/m), indicating fragmentation in core samples and fault core locations. This suggests that FD values can effectively delineate fault facies. Additionally, calculating slope changes in cumulative FD (Choi et al., 2016) helps differentiate between the fault core and the damage zone. Using above methods, we identified 102.5 m of fault core and 217.6 m of damage zone across 13 wells, providing valuable hard data for modeling in the study area.
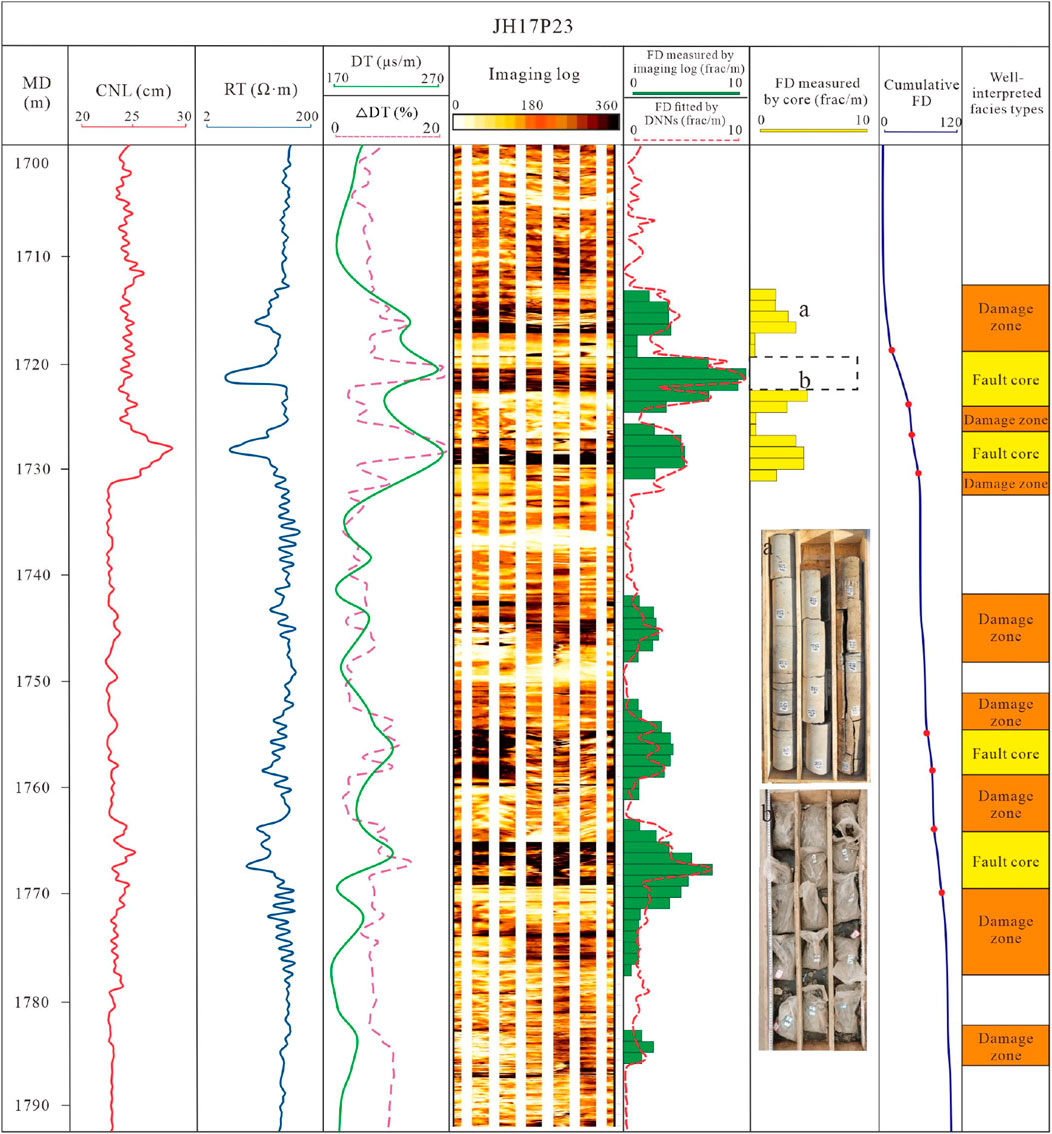
Figure 9. Fault facies analysis in well JH17P23. Conventional log curves (CNL, RT, DT, and ΔDT) strongly correlate with FD identified by imaging logs (green histogram), and fit well with FD prediction from trained DNNs (red dashed line). The yellow histogram represents the FD measurements from core samples. Fragmentation in core sample (b), interpretive of fault core facies type, prevents FD measurement. The boundary between the fault core and the damage zone is identified by the inflection points in the slope of the cumulative FD curve.
After applying the DNNs method for well facies interpretation, reliable well log facies data were obtained. Statistical analysis of the well log and inter-well data allowed the construction of inter-well probability constraint bodies, integrating data from multiple sources to enhance the accuracy and reliability of the geological modeling. This section first introduces geological genesis and seismic responses that affect fractures in our study areas, analysis their relationship to generate single-factor probability constraint body, and integrates them using the PR probability fusion method.
Previous studies have identified key factors influencing fractures in fault-controlled tight sandstones, with a focus on sedimentary and tectonic processes (He et al., 2019; Li et al., 2021; Wang et al., 2016). Sedimentary processes affect FD through lithology (e.g., mineral composition and mechanical parameters) and bed thickness, while tectonic processes affect FD mainly through fault (Finkbeiner et al., 1997; Guo et al., 2025).
Under similar stress conditions, brittle rock with high brittle mineral content fracture more easily than ductile rocks, leading to extensive fracturing (Hanks et al., 1997; Narr, 1991). Brittleness index for tight sandstone is commonly calculated form stress-strain (Grieser and Bray, 2007) or mineral composition (Sondergeld et al., 2007). Here, we calculate brittleness index using longitudinal wave velocities (VP), shear wave velocities (VS), and density (Den) (Supplementary Appendix A). Since VP and Den curves are typical complete but VS curves is limited, we established a VP-VS relationship (
where x1 represents brittleness index, y1 and y2 represents the probability of fault core development and damage zone development under the constraint of brittleness index, respectively.
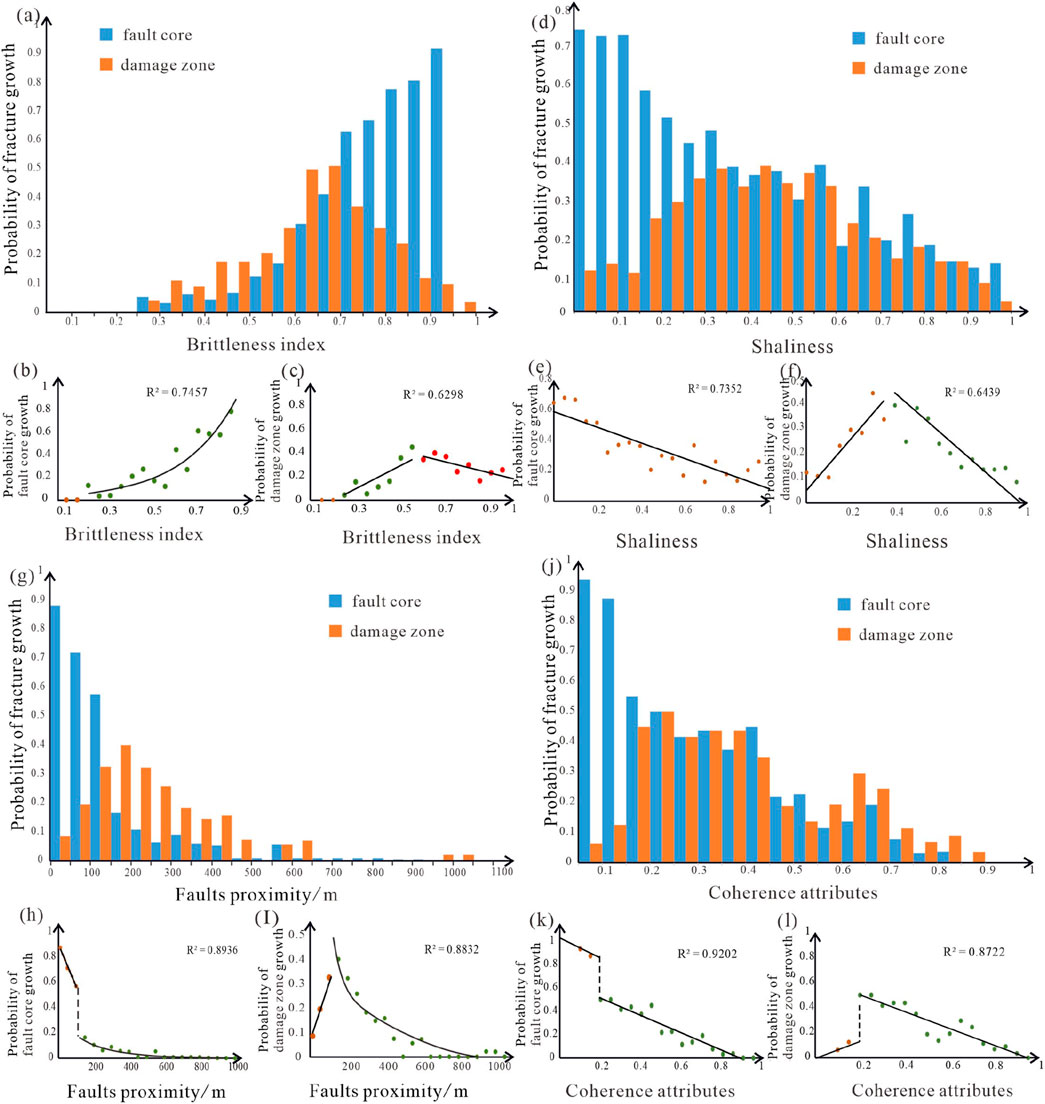
Figure 10. Correlation between various constraint information and the probability of fault-controlled tight sandstone reservoirs development. (A) Histogram of brittleness index versus reservoirs development probability; (B) Relationship between fault core and brittleness index; (C) Relationship between damage zone and brittleness index; (D) Histogram of shaliness versus reservoirs development probability; (E) Relationship between fault core and shaliness; (F) Relationship between damage zone and shaliness; (G) Histogram of versus reservoirs development probability; (H) Relationship between fault core and faults proximity; (I) Relationship between damage zone and faults proximity; (J) Histogram of coherency attribute versus reservoirs development probability; (K) Relationship between fault core and coherency attribute; (L) Relationship between damage zone and coherency attribute.
Similarly, due to a higher shaliness content leading to reduced fracture development, we established a correlation between the shaliness curve from well logs and the development probability of the fault-controlled tight sandstone reservoir (Figures 10D–F; Equations 3, 4):
where y3 represents the probability of fault core development under the constraint of shaliness, y4 represents the probability of damage zone development under the constraint of shaliness, and x2 represents the shaliness value.
Faults proximity also significantly impacts fracture development, which refers to the distance between a given point (e.g., well location or grid cell) and the nearest fault. Statistical analysis of fault-controlled tight sandstone reservoirs and their faults proximity in wells provides a quantitative insight into these patterns. Within 100 m of a fault, the fault core predominantly develops, with the likelihood of fault core and damage zone development decreasing logarithmically beyond this distance (Figures 10G–I; Equations 5, 6), which can be expressed as:
where x3 represents the fault proximity, y5 and y6 represents the probability of fault core development and damage zone development under the constraint of the fault proximity.
In addition, seismic data plays a crucial role in inter-well constraints. Following seismic attribute optimization, the coherence attribute, which measures the similarity between adjacent sampling points to reflect spatial consistency, was chosen to enhance modeling of fault-controlled tight sandstone reservoirs between wells. We established a linear regression between the seismic attribute values at grids identified as developed fault-controlled tight sandstone reservoirs in individual wells and their development probability (Figure 10J). This regression defines a response relationship between coherence attributes and fault-controlled tight sandstone reservoir development probability (Figures 10K, L; Equations 7, 8).
where y7 represents the probability of fault core development under the constraint of coherent attributes, y8 represents the probability of damage zone development under the constraint of coherent attributes, and x4 is the value of the coherent attribute.
Based well data, A brittleness index model and a shaliness model were create using SGS and converted into 3-D brittleness index-based fracture probability model and shaliness-based fracture probability model, respectively. Additionally, according to the relationship between fault proximity and coherence attributes, we enable to convert 3-D structural fault model and seismic coherence model into 3-D fault-proximity-based and coherence attributes-based fracture probability model, respectively (Figure 11).

Figure 11. Probability models for fault core facies (A) and damage zone facies (B) development in the study area. Both models constrained by brittleness index, shaliness, fault proximity, and coherence attributes.
Multi-source information fusion integrates geological and geophysical data from different sources to reduce model uncertainty and improve prediction accuracy. However, differences in scale and precision between the various data sources make this process highly complex. The PR model offers an efficient mathematical approach for multi-source data fusion, providing computational simplicity compared to methods like Bayesian inference, which makes it highly well-suited for reservoir modeling.
Proposed by Journel (2002), the PR probability fusion model integrates geological data from multiple sources and scales, enhancing accuracy and reliability by effectively combining diverse data types and accommodating complex geological structures. PR operates on the principle that the ratio of probability increments across different data sources remains constant, assuming conditional independence between them, meaning that one data type does not influence the probability increment provided by another. Suppose different data sources (e.g., well logs, seismic data) provide varying probability increments. While potentially limiting in some real geological p well-logroblems, greatly simplifies the complexity of data fusion in most application scenarios. The formula for the PR model is as follows:
where P{R│S1, … ,Sn } is the probability of event R given all the data S1, … ,Sn, P{R│Si } is the conditional probability of event R given data S i, P{R} is the probability of R.
The multi-source probability fusion is performed using the PR model. The number of samples for the fault core and damage zone from the well interpretations is divided by the total number of samples to obtain the initial probability P(R), without any additional data source constraints. The calculated probability body (Figure 11) is treated as the conditional probability P (R | Si), and all conditional probabilities along with the initial probability are substituted into the PR formula (Formula 9). The probability bodies for the fault core (Figure 12A) and damage zone (Figure 12B) are then calculated separately.
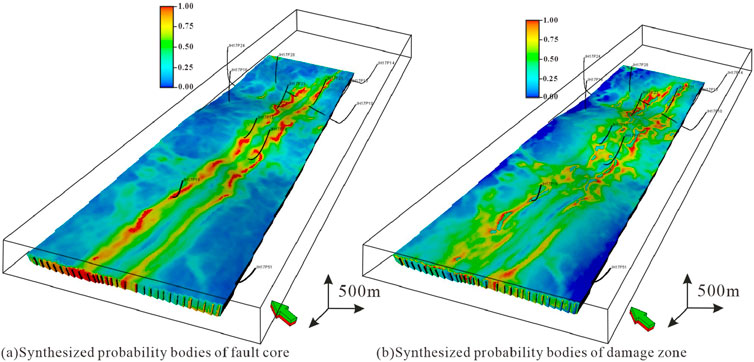
Figure 12. Multi-source probability fusion model for fault core facies (A) and damage zone facies (B) in the study area.
Facies modeling is essential for capturing the complex spatial structure within the reservoir. This section first generated geological facies models using the DS algorithm and corresponding permeability model using SGS, and validated them thought reservoir dynamic at two wells observations.
DS is a wildly used modeling technique that captures the spatial distribution of complex geological structures by uses a training image (TI) to represent nonlinear geological patterns. These patterns, derived from the TI, and scanned and reproduced in the simulated geological model. The TI can construct from observations, experiments, or synthetic models, serves as an idealized template of the target geological structure. Here, we manually construct the TI for reservoir facies modeling based on the geological knowledge from Section 4.
Facies modeling must accurately reflect the multi-scale spatial characteristics of facies distribution while aligning with well facies data and constraints from multi-source data. Thus, besides using well facies interpretation results serve as hard data, we used the integrated probability fusion model provide soft data constraints. Supplementary Appendix B detailed introduced the specific steps of DS algorithm. After testing different sets with a “trial and error” procedure in the DS algorithm, we set a data template 15 × 15 × 3, the multi-grid level 3, and the maximum number of known domain nodes to 8.
Figure 13 shows the results of three DS-generated facies models for fault controlled tight sandstone reservoir. The reservoir is primarily distributed along the Yulinzi strike-slip fault zone in a NEE orientation. The fault core width ranges from 70 m to 100 m, while the damage zone width spans 100 m–300 m on both sides. The reservoir extends along two faults in parallel linear features with localized braided structures, consistent with the fault zone patterns from outcrops observations and seismic data interpretations.

Figure 13. Results of three DS-generated facies models. The fault core is contained within the damage zone, exhibiting a parallel linear distribution and localized braided structures.
Deformation within fault zones significantly affects permeability, especially in tight sandstones, where fracture network characteristics play a key role (Bense et al., 2013). Factors like FD, orientation, and length distribution dictate the network’s connectivity and permeability (Bour and Davy, 1997; De Dreuzy et al., 2001). We correlated well log permeability values with fault facies and faults proximity, finding a trend of decreasing permeability as faults proximity increase (Figure 14), represented by the equation K = 117.02e−0.048d (R2 = 0.51). While traditional TPG methods often struggle to capture intricate geological facies patterns, they are wildly used in reservoir attribute modeling under facies constraint. Thus, we used the SGS algorithm to generated a corresponding 3-D permeability model constraint by fault facies (Figure 15), revealing significant permeability variations across fault facies.

Figure 15. Permeability model. (A) Top view of permeability model; (B) Permeability model profiles along the AB line.
We further enhance understanding by integrating multi-source data, including well logs, seismic data, and field observations, to map the variability in permeability. The approach combines geological and geophysical insights, offering a comprehensive view of the subsurface structure. Permeability ranges from 10 mD to 100 mD in the fault core, 1 mD to 10 mD in the damage zone, and below 1 mD in the surrounding wallrock. Our findings align with previous outcrop measurements and experimental data (Caine et al., 1996; Evans et al., 1997), providing a robust framework for understanding fault-controlled tight sandstone reservoirs dynamics. By embracing the complexity and heterogeneity of the reservoirs, this integrated method offers a more accurate representation of the subsurface, crucial for efficient resource extraction and management.
Using wells JH17P13 and JH17P16 for further model verification, we explore the relationship between fault zone characteristics and production profiles. Figures 16A, B show two cross-sections through the model, which also match the seismic profiles. The DS-generated reservoir is not fully connected along the entire fault but is segmented into smaller fault zone units separated by tight sandstone bedrock, resulting in weak connectivity or disconnection between units. This segmentation aligns with the actual observed production dynamics in the oilfield.
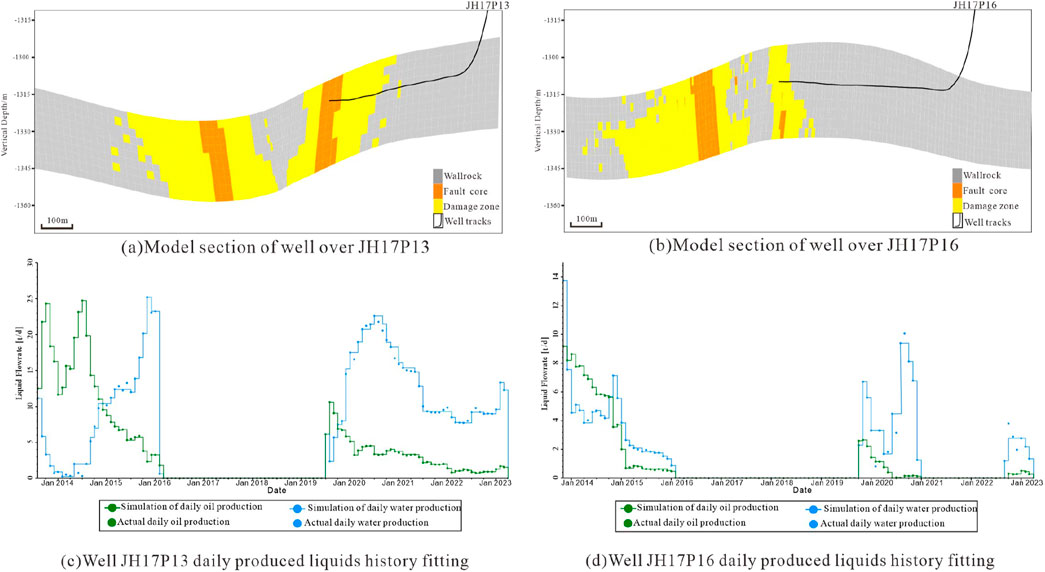
Figure 16. Results of the reservoir numerical simulation history matching. (A, B) respectively display the model cross-sections of horizontal wells encountering the fault core and the damage zone in a fault-controlled tight sandstone reservoir. (C, D) show the actual production data and the results of numerical simulation fitting for these two wells in the oil field from 2014 to the present.
In addition, high initial and stable long-term production observed in the fault core at well JH17P13 suggests a strong correlation between high permeability zones and enhanced oil recovery potential (Figure 16C). In contrast, the moderate and rapidly declining production in the damaged zone at well JH17P16 reflects a less favorable permeability profile (Figure 16D). This difference aligns with the generated model’s permeability distributions, showing significantly higher permeability in the fault core than in the damage zone and bedrock. The model achieves over 85% accuracy in matching actual production data, validating its ability to capture the complex, heterogeneous nature of fault-controlled tight sandstone reservoirs. This detailed understanding supports optimized extraction strategies and underscores the critical role of accurate fault zone characterization in tight sandstone reservoirs development.
Geological modeling enables represent reservoir spatial distribution, making it essential for oil and gas field development. For unconventional fault-controlled tight sandstone reservoirs, oil and gas are primarily stored in fault zones with higher porosity and permeability, rather than in surrounding tight sandstone. Effective static models for this type reservoir requires featuring a vertical banded structure with orderly arranged fault cores and damage zones.
Here, we proposed a workflow for modeling these reservoirs combining DNNs, the PR model, and the DS algorithm. DNNs fit the relationship between conventional logging and FD derived from image log interpretation, providing well fracture interpretation reservoir modeling. The PR model then integrates geological genesis and geophysical data, retaining common features while minimizing errors from single sources. This achieves a multi-source information-driven approach effectively reduces model uncertainty. Using the 3-D geological model based on DS, oil production history matching achieved a fit rate over 85%. Wells intersecting fault cores showed high initial production with sustained output and high cumulative production, while wells in damage zones had moderate initial production, rapid decline, and moderate cumulative production. Validated through numerical simulation, the model can guide future development plans, proving its practical effectiveness.
This workflow can be further improved by optimizing MPG simulation tasks, which are time-consuming and face non-stationarity problem, especially for the 3-D fault-controlled tight sandstone reservoir simulation. Generative method like variational autoencoders (VAEs; Kingma and Welling, 2014), generative adversarial networks (GANs; Goodfellow et al., 2014) or flow-based models (Rezende and Mohamed, 2016) can replace MPG, as they have been wildly used in reconstructing and simulating complex geological bodies like as delta reservoir (Zhang W. et al., 2021), karst cave reservoir (e.g., Song et al., 2022a), and mud drapes inside fluvial point bar reservoirs (Hu et al., 2024). Additionally, probability map can be incorporated into generative models (Song et al., 2022b), allowing our multi-source PR fusion probability map to reduce result uncertainty.
This workflow offers a novel approach for characterizing and developing complex fault-controlled tight sandstone reservoirs, with broad application potential and valuable guidance for reservoir development.
The original contributions presented in the study are included in the article/Supplementary Material, further inquiries can be directed to the corresponding author.
HZ: Writing–original draft, Writing–review and editing. JH: Conceptualization, Funding acquisition, Methodology, Writing–review and editing. QL: Data curation, Writing–original draft. ZL: Investigation, Writing–original draft. QC: Investigation, Writing–original draft.
The author(s) declare that financial support was received for the research, authorship, and/or publication of this article. This work was supported by the National Natural Science Foundation of China (No. 42072146).
The authors declare that the research was conducted in the absence of any commercial or financial relationships that could be construed as a potential conflict of interest.
The author(s) declare that no Generative AI was used in the creation of this manuscript.
All claims expressed in this article are solely those of the authors and do not necessarily represent those of their affiliated organizations, or those of the publisher, the editors and the reviewers. Any product that may be evaluated in this article, or claim that may be made by its manufacturer, is not guaranteed or endorsed by the publisher.
The Supplementary Material for this article can be found online at: https://www.frontiersin.org/articles/10.3389/feart.2025.1552058/full#supplementary-material
Arpat, G. B. (2005). Sequential simulation with patterns. Ph.D. dissertation, Stanford University.Stanford University.
Balsamo, F., Clemenzi, L., Storti, F., Solum, J., and Taberner, C. (2019). Tectonic control on vein attributes and deformation intensity in fault damage zones affecting Natih platform carbonates, Jabal Qusaybah, North Oman. J. Struct. Geol. 122, 38–57. doi:10.1016/j.jsg.2019.02.009
Bense, V. F., Gleeson, T., Loveless, S. E., Bour, O., and Scibek, J. (2013). Fault zone hydrogeology. Earth-Science Rev. 127, 171–192. doi:10.1016/j.earscirev.2013.09.008
Berg, S. S., and Skar, T. (2005). Controls on damage zone asymmetry of a normal fault zone: outcrop analyses of a segment of the Moab fault, SE Utah. J. Struct. Geol. 27, 1803–1822. doi:10.1016/j.jsg.2005.04.012
Botter, C., Cardozo, N., Lecomte, I., Rotevatn, A., and Paton, G. (2017b). The impact of faults and fluid flow on seismic images of a relay ramp over production time. Pet. Geosci. 23, 17–28. doi:10.1144/petgeo2016-027
Botter, C., Cardozo, N., Qu, D., Tveranger, J., and Kolyukhin, D. (2017a). Seismic characterization of fault facies models. Interpretation 5, SP9–SP26. doi:10.1190/int-2016-0226.1
Botter, C., and Champion, A. (2019). “Seismic Fault damage zone characterisation for reservoir modelling using advanced attribute analysis,” in Conference on fault and Top seals. Palermo, Italy.
Bour, O., and Davy, P. (1997). Connectivity of random fault networks following a power law fault length distribution. Water Resour. Res. 33, 1567–1583. doi:10.1029/96wr00433
Braathen, A., Tveranger, J., Fossen, H., Skar, T., Cardozo, N., Semshaug, S. E., et al. (2009). Fault facies and its application to sandstone reservoirs. AAPG Bull. 93, 891–917. doi:10.1306/03230908116
Brogi, A. (2008). Fault zone architecture and permeability features in siliceous sedimentary rocks: insights from the Rapolano geothermal area (Northern Apennines, Italy). J. Struct. Geol. 30, 237–256. doi:10.1016/j.jsg.2007.10.004
Caine, J., Evans, J., and Forster, C. (1996). Fault zone architecture and permeability structure. Geology 24, 1025–1028. doi:10.1130/0091-7613(1996)024<1025:fzaaps>2.3.co;2
Celestino, M. A. L., Miranda, T. S. D., Mariano, G., Alencar, M. D. L., Carvalho, B. R. B. M., Falcão, T. D. C., et al. (2020). Fault damage zones width: implications for the tectonic evolution of the northern border of the Araripe Basin, Brazil, NE Brazil. J. Struct. Geol. 138, 104116. doi:10.1016/j.jsg.2020.104116
Choi, J., Edwards, P., Ko, K., and Kim, Y. (2016). Definition and classification of fault damage zones: a review and a new methodological approach. Earth-Science Rev. 152, 70–87. doi:10.1016/j.earscirev.2015.11.006
Cui, Z., Chen, Q., Liu, G., Ma, X., and Que, X. (2021). Multiple-point geostatistical simulation based on conditional conduction probability. Stoch. Environ. Res. Risk Assess. 35, 1355–1368. doi:10.1007/s00477-020-01944-4
De Dreuzy, J., Davy, P., and Bour, O. (2001). Hydraulic properties of two-dimensional random fracture networks following a power law length distribution: 1. Effective connectivity. Water Resour. Res. 37, 2065–2078. doi:10.1029/2001wr900011
Deng, S., Zhao, R., Kong, Q., Li, Y., and Li, B. (2022). Two distinct strike-slip fault networks in the Shunbei area and its surroundings, Tarim Basin: hydrocarbon accumulation, distribution, and controlling factors. AAPG Bull. 106, 77–102. doi:10.1306/07202119113
Deutsch, C. V., and Journel, A. G. (1992). “Geostatistical software library and user's guide,”, 2. Oxford University Press, 1–352.
Dong, S., Zeng, L., Liu, J., Gao, A., Lyu, W., Du, X., et al. (2020a). Fracture identification in tight reservoirs by multiple kernel Fisher discriminant analysis using conventional logs. Interpretation 8, SP215–SP225. doi:10.1190/int-2020-0048.1
Dong, S., Zeng, L., Lyu, W., Xu, C., Liu, J., Mao, Z., et al. (2020b). Fracture identification by semi-supervised learning using conventional logs in tight sandstones of Ordos Basin, China. J. Nat. Gas Sci. Eng. 76, 103131. doi:10.1016/j.jngse.2019.103131
Evans, J. P., Forster, C. B., and Goddard, J. V. (1997). Permeability of fault-related rocks, and implications for hydraulic structure of fault zones. J. Struct. Geol. 19, 1393–1404. doi:10.1016/s0191-8141(97)00057-6
Farmer, C. L. (1988). The generation of stochastic fields of reservoir parameters with specified geostatistical distributions: mathematics in oil production. Oxford: Clarendon Press, 235–252.
Faulkner, D. R., Jackson, C. A. L., Lunn, R. J., Schlische, R. W., Shipton, Z. K., Wibberley, C. A. J., et al. (2010). A review of recent developments concerning the structure, mechanics and fluid flow properties of fault zones. J. Struct. Geol. 32, 1557–1575. doi:10.1016/j.jsg.2010.06.009
Finkbeiner, T., Barton, C. A., and Zoback, M. D. (1997). Relationships among in-situ stress, fractures and faults, and fluid flow; Monterey Formation, Santa Maria Basin, California. AAPG Bull. 81, 1975–1999. doi:10.1306/3B05C6FE-172A-11D7-8645000102C1865D
Fossen, H., Soliva, R., Ballas, G., Trzaskos, B., Cavalcante, C., and Schultz, R. A. (2018). “A review of deformation bands in reservoir sandstones: geometries, mechanisms and distribution,” in Subseismic-scale reservoir deformation. Editors M. Ashton, S. J. Dee, and O. P. Wennberg (London: The Geological Society of London). doi:10.1144/SP459.4
Goodfellow, I., Pouget-Abadie, J., Mirza, M., Xu, B., Warde-Farley, D., Ozair, S., et al. (2014). Generative adversarial nets. Adv. Neural Inf. Process. Syst. 27. doi:10.48550/arXiv.1406.2661
Grieser, B., and Bray, J. (2007). “Identification of production potential in unconventional reservoirs,” in Production and operations symposium. doi:10.2118/106623-MS
Guo, Z., Liu, L., Liu, Z., Shen, X., and Lei, L. (2025). Experimental and numerical challenges in multiscale study on geomechanical and hydrological systems. Adv. Geo-Energy Res. 15 (2), 95–98. doi:10.46690/ager.2025.02.02
Hanks, C. L., Lorenz, J., Teufel, L., and Krumhardt, A. P. (1997). AAPG bulletin. AAPG Bull. 81, 1700–1720. doi:10.1306/3B05C424-172A-11D7-8645000102C1865D
He, F., Liang, C., Lu, C., Yuan, C., and Li, X. (2020). Identification and description of fault-fracture bodies in tight and low permeability reservoirs in transitional zone at the south margin of Ordos Basin: oil and gas geology, v. 41, p. 710–718. doi:10.11743/ogg20200405
He, J., Wang, X., Sun, J., Sun, X., Shi, J., Cao, D., et al. (2019). Characteristics and main controlling factors of natural fractures in the Lower-to-Middle Ordovician carbonate reservoirs in Tahe area. North. Tarim Basin Oil and Gas Geol. 40, 1022–1030. doi:10.11743/ogg20190507
Hillier, M., Wellmann, F., de Kemp, E. A., Brodaric, B., Schetselaar, E., and Bédard, K. (2023). GeoINR 1.0: an implicit neural network approach to three-dimensional geological modelling. Geosci. Model Dev. 16, 6987–7012. doi:10.5194/gmd-16-6987-2023
Hu, X., Song, S., Hou, J., Yin, Y., Hou, M., and Azevedo, L. (2024). Stochastic modeling of thin mud drapes inside point bar reservoirs with ALLUVSIM-GANSim. Water Resour. Res. 60, e2023WR035989. doi:10.1029/2023wr035989
Journel, A. G. (2002). Combining knowledge from diverse sources: an alternative to traditional data independence hypotheses. Math. Geol. 34, 573–596. doi:10.1023/a:1016047012594
Kang, Q., Hou, J., Liu, L., Hou, M., and Liu, Y. (2023). Quantitative prediction of braided sandbodies based on probability fusion and multi-point geostatistics. Energies 16, 2796. doi:10.3390/en16062796
Li, W., Liu, Z., Hu, Z., Jin, W., Li, P., Liu, J., et al. (2021). Characteristics of and main factors controlling the tight sandstone reservoir fractures in the 2 nd member of Xujiahe Formation in Xinchang area. West. Sichuan Depress. Sichuan Basin Oil and Gas Geol. 42, 884–897,1010. doi:10.11743/ogg20210410
Li, Y., Deng, X., Ning, C., Wang, Q., Cui, S., Zhang, Q., et al. (2022). “Second quantitative characterization” and its application in fractured-vuggy carbonate reservoirs. Petroleum Explor. Dev. 49, 797–809. doi:10.1016/s1876-3804(22)60311-2
Li, Y., Sun, J., Wei, H., and Song, S. (2019). Architectural features of fault-controlled karst reservoirs in the Tahe oilfield. J. Petroleum Sci. Eng. 181, 106208. doi:10.1016/j.petrol.2019.106208
Liu, J., Liu, Z., Liu, Z., Liu, Y., Shen, B., Xiao, K., et al. (2023). Geological characteristics and models of fault-fold-fracture body in deep tight sandstone of the second member of Upper Triassic Xujiahe Formation in Xinchang structural belt of Sichuan Basin,SW China. Petroleum Explor. Dev. 50, 603–614. doi:10.1016/s1876-3804(23)60413-6
Liu, Y., Hou, J., Li, Y., Dong, Y., Ma, X., and Wang, X. (2018). Characterization of architectural elements of ordovician fractured-cavernous carbonate reservoirs, tahe oilfield, China. J. Geol. Soc. India 91, 315–322. doi:10.1007/s12594-018-0856-3
Liu, Y., Sun, S., Dou, L., and Hou, J. (2020). An improved probability combination scheme based on principal component analysis and permanence of ratios model - an application to a fractured reservoir modeling, Ordos Basin. J. Petroleum Sci. Eng. 190, 107123. doi:10.1016/j.petrol.2020.107123
Liu, Z., Liu, Z., Guo, Y., Ji, Y., Li, W., Lin, T., et al. (2021). Concept and geological model of fault-fracture reservoir and their application in seismic fracture prediction: a case study on the Xu 2 Member tight sandstone gas pool in Xinchang area. West. Sichuan Depress. Sichuan Basin Oil and Gas Geol. 42, 973–980. doi:10.11743/ogg20210417
Lyu, W., Zeng, L., Liu, Z., Liu, G., and Zu, K. (2016). Fracture responses of conventional logs in tight-oil sandstones: a case study of the Upper Triassic Yanchang Formation in southwest Ordos Basin, China. AAPG Bull. 100, 1399–1417. doi:10.1306/04041615129
Lyu, W., Zeng, L., Zhou, S., Du, X., Xia, D., Liu, G., et al. (2019). Natural fractures in tight-oil sandstones: a case study of the upper triassic Yanchang Formation in the southwestern Ordos Basin, China. AAPG Bull. 103, 2343–2367. doi:10.1306/0130191608617115
Mariéthoz, G., and Caers, J. K. (2014). Multiple-point geostatistics: stochastic modeling with training images. doi:10.1002/9781118662953
Mariethoz, G., Renard, P., and Straubhaar, J. (2010). The Direct Sampling method to perform multiple-point geostatistical simulations. Introd. Macroecon. 46. doi:10.1029/2008wr007621
Meng, Y., Chen, H., Zhao, Y., Lo, Y., He, F., Wang, G., et al. (2023). Characterization of architecture of intraplate strike-slip faults in Yanchang Formation of jinghe oilfield in southern Ordos Basin. Earth Sci. 48, 2281–2293. doi:10.3799/dqkx.2023.007
Narr, W. (1991). Fracture density in the deep subsurface; techniques with application to Point Arguello oil field. AAPG Bull. 75, 1300–1323. doi:10.1306/0c9b2939-1710-11d7-8645000102c1865d
Qiao, Z., Shen, A., Zhang, S., Hu, A., Liang, F., Luo, X., et al. (2023). Origin of giant Ordovician cavern reservoirs in the Halahatang oil field in the Tarim Basin, northwestern China. AAPG Bull. 7, 1105–1135. doi:10.1306/11152219193
Qu, D., and Tveranger, J. (2016). Incorporation of deformation band fault damage zones in reservoir models. AAPG Bull. 100, 423–443. doi:10.1306/12111514166
Rezende, D. J., and Mohamed, S. (2016). Variational inference with normalizing flows, preprint (arXiv:1505.05770).
Silva, M. E., Nogueira, F. C. C., Pérez, Y. A. R., Vasconcelos, D. L., Stohler, R. C., Sanglard, J. C. D., et al. (2022). Permeability modeling of a basin-bounding fault damage zone in the Rio do Peixe Basin, Brazil. Mar. Petroleum Geol. 135, 105409. doi:10.1016/j.marpetgeo.2021.105409
Sondergeld, C. H., Newsham, K. E., Comisky, J. T., and Rice, M. C. (2007). “Petrophysical considerations in evaluating and producing shale gas resources,” in SPE Unconventional Gas Conference. Society of Petroleum Engineers (SPE). doi:10.2118/131768-MS
Song, S., Mukerji, T., and Hou, J. (2022a). Bridging the gap between geophysics and geology with generative adversarial networks. IEEE Trans. Geoscience Remote Sens. 60, 5902411–11. doi:10.1109/tgrs.2021.3066975
Song, S., Mukerji, T., Hou, J., Zhang, D., and Lyu, X. (2022b). GANSim-3D for conditional geomodeling: theory and field application. Water Resour. Res. 58. doi:10.1029/2021wr031865
Strebelle, S. (2002). Conditional simulation of complex geological structures using multiple-point statistics. Math. Geol. 34, 1–21. doi:10.1023/a:1014009426274
Sun, S., Zhao, S., Hou, J., Zhou, Y., Song, S., and H, Y. (2019). Hierarchical modeling of multi-scale fractures in tight sandstones: a case study of the eighth member of the Yanchang formation in wellblock 92 of the Honghe oilfield. Petroleum Sci. Bull. 4, 11–26. doi:10.3969/j.issn.2096-1693.2019.01.002
Tahmasebi, P. (2018). “Multiple point statistics: a review,” in Handbook of mathematical geosciences: fifty years of IAMG. Editors B. S. Daya Sagar, Q. Cheng, and F. Agterberg (Cham: Springer International Publishing), 613–643.
Tahmasebi, P., Hezarkhani, A., and Sahimi, M. (2012). Multiple-point geostatistical modeling based on the cross-correlation functions. Comput. Geosci. 16, 779–797. doi:10.1007/s10596-012-9287-1
Tokhmechi, B., Memarian, H., Noubari, H. A., and Moshiri, B. (2009). A novel approach proposed for fractured zone detection using petrophysical logs. J. Geophys. Eng. 6, 365–373. doi:10.1088/1742-2132/6/4/004
Torabi, A., Johannessen, M. U., and Ellingsen, T. S. S. (2019). Fault core thickness: insights from siliciclastic and carbonate rocks. Geofluids 2019, 1–24. doi:10.1155/2019/2918673
Wang, R., Ding, W., Gong, D., Zeng, W., Wang, X., Zhou, X., et al. (2016). Development characteristics and major controlling factors of shale fractures in the Lower Cambrian Niutitang Formation south eastern Chongqing northern Guizhou are. Acta Pet. Sin. 37, 832–845+877. doi:10.7623/syxb201607002
Wang, X., Hou, J., Li, S., Dou, L., Song, S., Kang, Q., et al. (2019). Insight into the nanoscale pore structure of organic-rich shales in the Bakken Formation, USA. J. Petroleum Sci. and Eng. 176, 312–320. doi:10.1016/j.petrol.2020.107182
Wang, X., Yu, S., Li, S., and Zhang, N. (2022b). Two parameter optimization methods of multi-point geostatistics. J. Petroleum Sci-ence and Eng. 208, 109724. doi:10.1016/j.petrol.2021.109724
Wang, X., Zhang, F., Li, S., Dou, L., Liu, Y., Ren, X., et al. (2021). The architectural surfaces characteristics of sandy braided river reservoirs, case study in gudong oil field, China. Geofluids 2021, 1–12. doi:10.1155/2021/8821711
Wang, X., Zhou, X., Li, S., Zhang, N., Ji, L., and Lu, H. (2022). Mechanism study of hydrocarbon differential distribution controlled by the activity of growing faults in faulted basins: case study of paleogene in the Wang guantun area. China: Bohai Bay Basin. doi:10.2113/2022/7115985
Wang, Y., Liu, Y., Zou, Z., Bao, Q., Zhang, F., and Zong, Z. (2023). Recent advances in theory and technology of oil and gas geophysics. Adv. Geo-Energy Res. 9 (1), 1–4. doi:10.46690/ager.2023.07.01
Yang, L., Hou, W., Cui, C., and Cui, J. (2016). GOSIM: a multi-scale iterative multiple-point statistics algorithm with global optimization. Comput. and Geosciences 89, 57–70. doi:10.1016/j.cageo.2015.12.020
Yin, Y., Hu, X., Huang, J., Wenjie, F., Wang, L., Duan, T., et al. (2020). A three-dimensional model of deep-water turbidity channel in Plutonio oilfield, Angola: from training image generation, optimization to multi-point geostatistical modelling. J. petroleum Sci. and Eng. 195, 107650. doi:10.1016/j.petrol.2020.107650
Zeng, L., and Li, X. (2009). Fractures in sandstone reservoirs with ultra-low permeability: a case study of the upper triassic Yanchang Formation in the Ordos Basin, China. AAPG Bull. 93, 461–477. doi:10.1306/09240808047
Zeng, W., Ding, W., Zhang, J., Li, Y., Lin, T., Wang, R., et al. (2016). Research on the fracture effectiveness of the Lower Cambrian Niutitang shale in the southeastern Chongqing and northern Guizhou areas. Earth Sci. Front. 23, 96–106. doi:10.13745/j.esf.2016.01.009
Zhang, T., Ji, X., and Zhang, A. (2021). Reconstruction of fluvial reservoirs using multiple-stage concurrent generative adversarial networks. Comput. Geosci. 25, 1983–2004. doi:10.1007/s10596-021-10086-7
Zhang, T., Switzer, P., and Journel, A. (2006). Filter-based classification of training image patterns for spatial simulation. Math. Geol. 38, 63–80. doi:10.1007/s11004-005-9004-x
Zhang, W., Duan, T., Li, M., Zhao, H., Shuang, X., and Wang, Y. (2021). Architecture characterization of Ordovician fault-controlled paleokarst carbonate reservoirs in Tuoputai, Tahe oilfield, Tarim Basin, NW China. Petroleum Explor. Dev. 48, 367–380. doi:10.1016/s1876-3804(21)60029-0
Keywords: fault-controlled tight sandstone reservoir, geological modeling, Permanence of ratios Probabilistic fusion, multiple-point geostatistics, fracture
Citation: Zhang H, Hou J, Long Q, Liang Z and Chen Q (2025) Multiple-point geostatistical modeling for fault-controlled tight sandstone reservoirs based on probability fusion of permanence of ratios: a tight sandstone oil reservoir in the southern margin of the ordos basin. Front. Earth Sci. 13:1552058. doi: 10.3389/feart.2025.1552058
Received: 27 December 2024; Accepted: 13 February 2025;
Published: 11 March 2025.
Edited by:
Yin Yanshu, Yangtze University, ChinaReviewed by:
Xixin Wang, Yangtze University, ChinaCopyright © 2025 Zhang, Hou, Long, Liang and Chen. This is an open-access article distributed under the terms of the Creative Commons Attribution License (CC BY). The use, distribution or reproduction in other forums is permitted, provided the original author(s) and the copyright owner(s) are credited and that the original publication in this journal is cited, in accordance with accepted academic practice. No use, distribution or reproduction is permitted which does not comply with these terms.
*Correspondence: Jiagen Hou, ODU3NzEwNTIwQHFxLmNvbQ==
Disclaimer: All claims expressed in this article are solely those of the authors and do not necessarily represent those of their affiliated organizations, or those of the publisher, the editors and the reviewers. Any product that may be evaluated in this article or claim that may be made by its manufacturer is not guaranteed or endorsed by the publisher.
Research integrity at Frontiers

Learn more about the work of our research integrity team to safeguard the quality of each article we publish.