 S. Hammoudeh
 K. Goergen
 A. Belleflamme
 J. A. Giles
 S. Trömel3,4
 S. Kollet
95% of researchers rate our articles as excellent or good
Learn more about the work of our research integrity team to safeguard the quality of each article we publish.
Find out more
ORIGINAL RESEARCH article
Front. Earth Sci. , 01 April 2025
Sec. Hydrosphere
Volume 13 - 2025 | https://doi.org/10.3389/feart.2025.1548557
Accurate precipitation data are crucial for many sectors and applications, like managing water resources, for agriculture, or assessing the risks of hydrometeorological extreme events like floods and droughts, which are expected to further increase with climate change. This study compares the spatial and temporal characteristics of ten state-of-the-art, commonly used precipitation datasets, with each other and against reference in situ precipitation gauge observations from the European Climate Assessment & Dataset (ECA&D) over Germany. The objectives are to evaluate whether bias adjustment is needed for the European Centre for Medium-Range Weather Forecasts (ECMWF) High Resolution (HRES) meteorological forecasting dataset, which is used in near real-time water resources modeling with the ParFlow integrated hydrologic model, and if so, to assess whether any of the observation-based comparison datasets might be suitable for this bias adjustment. Results show that HRES and Reanalysis v5 (ERA5) capture spatial patterns well, albeit with deficits in reproducing extremes, and over- and underestimation at low and high altitudes, respectively. COSMO-REAnalysis (COSMO-REA6) captures the spatial precipitation patterns less effectively but outperforms HRES and ERA5 in reproducing extreme events. HYRAS-DE-PRE (HYRAS), Radar Online Adjustment (RADOLAN), and Radarklimatologie (RADKLIM) perform very well, showing strong spatial accuracy and potential for bias adjustment, though their limited spatial coverage potentially restricts their use across all river catchments affecting Germany. The Operational Program of the Exchange of Weather Radar Information (OPERA) tends to underestimate mean precipitation quantities and extreme events. Integrated Multi-satellite Retrievals for Global Precipitation Measurement (IMERG) Final shows an improvement over IMERG-Late. EUropean RADar CLIMatology (EURADCLIM) outperforms OPERA due to gauge adjustments. The methodology and findings from this study may also be applicable to similar evaluations in other regions, and may help in the selection of precipitation datasets, e.g., for hydrological model forcing or for bias adjustments.
As a primary component of the Earth’s hydrological cycle, precipitation plays a central role in many environmental processes and human activities. Access to accurate precipitation data is vital for many sectors and uses, including water resources management, agriculture (Araghi et al., 2021), or the analysis of extreme events, such as floods and droughts (Zhong et al., 2019; Hinge et al., 2022), to name a few. Under an intensifying hydrological cycle, climate change is projected to increase both the likelihood and the severity of such extreme events (Huntington, 2006; Caretta et al., 2022). However, the significant spatial and temporal variability of precipitation challenges the development of accurate datasets at the required resolution.
In recent decades, the demand for regional climate information in Europe has increased (Strandberg and Lind, 2021). This demand led to the development of national and regional atmospheric models like Germany’s COnsortium for Small-Scale MOdelling (COSMO) (Baldauf et al., 2011) and ICON (Zängl et al., 2015; Pham et al., 2021), the United Kingdom’s Unified Model (Davies et al., 2005), AROME-France (Seity et al., 2011), or HARMONIE–AROME (widely used in Denmark, Finland, Iceland, Ireland, Lithuania, and Sweden) (Bengtsson et al., 2017). These models are critical for numerical weather prediction (NWP) and regional climate scenarios and also provide information on the terrestrial water cycle. Hydrological models have also advanced into highly versatile tools, supporting water resource management and river discharge forecasting (Keller et al., 2023). Examples include the Global Flood Awareness System for long-term flood forecasting (Alfieri et al., 2013), or Deltares’ Global River Flood and Drought Forecast Service providing 16-day forecasts (Werner et al., 2013). Specifically for drought monitoring, systems have been deployed such as the German Drought Monitor (Zink et al., 2016) or the Czech and Swiss drought monitors (Trnka et al., 2020; Zappa et al., 2014).
Another hydrological simulation experiment of particular interest in this study involves high-resolution hindcasts and experimental water resources forecasts using the integrated physics-based ParFlow hydrological model including the Common Land Model (Belleflamme et al., 2023; Kuffour et al., 2020; Kollet and Maxwell, 2006; Maxwell et al., 2016) by the authors. The model domain covers part of central Europe, centered on Germany, at 611 m spatial resolution (see Figure 1, hereafter identified as “DE06”). These forecasts are run daily at an hourly time step with a 10-day lead time. The ParFlow/CLM, DE06 setup is extensively described in Belleflamme et al. (2023). Within the DE06 forecast ensemble, the deterministic ParFlow runs, that provide the initial conditions for the subsequent forecast cycle, are driven by the European Centre for Medium-Range Weather Forecasts (ECMWF) High Resolution (HRES) NWP gridded near surface atmospheric fields. While the difference between precipitation and evapotranspiration (P-ET) is the main source-sink term of hydrological models, precipitation plays a particularly crucial role as the primary driver. It is therefore of great interest to evaluate the quality of the precipitation forcing data used in the DE06 ParFlow simulations driven by HRES, and to assess whether there are suitable datasets for bias adjustment. This is the main motivation for this study.
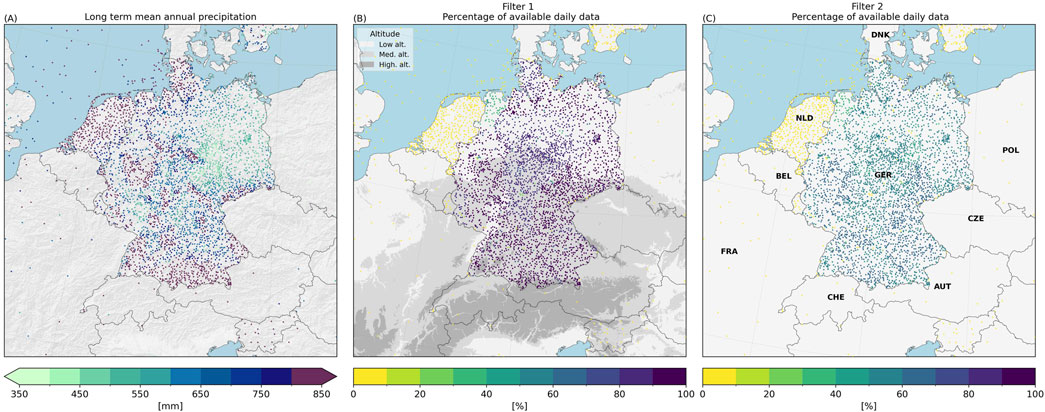
Figure 1. Spatial distribution of available ECA&D stations and data availability within the ParFlow hydrological model DE06 domain. (A) Spatial distribution of stations with available data showing the long-term mean annual precipitation sums (2014–2022); (B) percentage of available daily data after applying Filter 1, which preserves as much valid data as possible, with altitude grouped into three ranges: Low Alt (<200 m AMSL), Med. Alt. (200m–800 m AMSL), and High Alt (>800 m AMSL). These ranges are represented by three distinct gray colors; (C) percentage of available daily data after applying the more strict Filter 2 (see Section 2.2.1).
Readily available gridded precipitation products include spatially interpolated in situ observations, radar- and satellite-based remote sensing products (Alfieri et al., 2022; Huang et al., 2019; Sokol et al., 2021), NWPs or reanalyses that assimilate observations (Bandhauer et al., 2022). Despite great effort and progress in the accuracy of NWPs, the simulation and derivation of precipitation is still a challenge due to its high spatial and temporal variability (Bauer et al., 2015). Precipitation data from these models are often bias adjusted in hydrological modeling chains (Maraun, 2016). Two main methods for bias adjustment are commonly employed. The first method relies on average adjustments derived from an extended historical period, eliminating the need for near real-time data. The second method adjusts precipitation based on observations from recent days, aligning outputs more closely with current conditions and requiring real-time data to achieve precision (Patakchi Yousefi et al., 2024). To implement these adjustments, various techniques have been applied, including quantile mapping, delta method, logistic regression, Bayesian model averaging, and more recently, machine learning methods such as artificial neural networks and convolutional neural networks, albeit these techniques require reliable reference datasets (Cane et al., 2013; Fuentes-Barrios and Sierra-Lorenzo, 2021; Jabbari and Bae, 2018; Kumar et al., 2021; Li et al., 2023; Patakchi Yousefi and Kollet, 2023; Pourmokhtarian et al., 2016; Roulin and Vannitsem, 2012). Integrating these adjustments into hydrological modeling contributes to a more credible representation of the subsurface water budget, establishing a robust initial state from which forecasts can be launched (Chevuturi et al., 2023).
Over the past decade, various precipitation products have been evaluated for their suitability in hydrological modeling. For example, 22 precipitation products were evaluated globally by Beck et al. (2017), 17 were evaluated over West Africa by Dembélé et al. (2020) and nine were assessed in the Iowa-Cedar River Basin by Wu et al. (2017). In Europe also, various precipitation datasets have been evaluated. Lockhoff et al. (2019) analyzed a mix of different types of datasets, including gauge-based (e.g., E-OBS), satellite (e.g., CMORPH), and reanalysis (e.g., COSMO-REAnalysis referred to as HERZ in their study), against high-density rain gauge observations in western and central Europe. Their findings indicate that the quality of these datasets depends on the region, season, and specific precipitation characteristics examined. Similarly, Kidd et al. (2012) compared different satellite datasets (e.g., CMORPH; PERSIANN) alongside precipitation from NWP of ECMWF in northwest Europe. Ramsauer et al. (2018) found that gridded Integrated Multi-satellite Retrievals for Global Precipitation Measurement (IMERG) Final V05 data product overestimates precipitation compared to the Radar Online Adjustment (RADOLAN) RW data product over Germany, especially in winter, and that there are shortcomings to correctly represent precipitation in areas of complex topography. Bogerd et al. (2021) compared the IMERG Late Run V06B data product over the Netherlands against a gauge-adjusted radar precipitation product and found similar biases as those described by Ramsauer et al. (2018). Notably, Europe has the second fewest IMERG validation studies among all continents (Pradhan et al., 2022). Kreklow et al. (2020) compared the meteorological radar RADOLAN RW and its climatological product, the Radarklimatologie (RADKLIM), against precipitation gauge data over Germany during 2006–2017 and found that both products tend to underestimate total precipitation sums in general and especially high intensity rainfall. While RADOLAN exhibits range-dependent attenuation, resulting in lower values with increasing distance from the radar, RADKLIM demonstrates improvements in correcting radar artifacts, winter precipitation, and orographic effects, showing no range dependency. Despite these efforts, RADKLIM underestimates mean annual precipitation more than RADOLAN for the years before 2017 (Kreklow et al. (2020). However, both datasets reduce their biases to similar values by the end of the analyzed period. To our knowledge, a comprehensive intercomparison study of recent precipitation products over central Europe is still lacking.
This study therefore evaluates the spatial and temporal characteristics of ten state-of-the-art, commonly used precipitation datasets from distinct data sources and based on a range of methodologies. These datasets are compared with each other and benchmarked to reference in situ precipitation gauge observations from the European Climate Assessment & Dataset (ECA&D) over Germany. Besides this evaluation, the objectives are to (i) assess whether the ECMWF HRES meteorological forecasting dataset, in use with the DE06 ParFlow near real-time water resources forecasts (Belleflamme et al., 2023), requires a bias adjustment, and (ii) in light of the precipitation dataset’s characteristics, determine their suitability for this purpose, considering their near real-time availability with respect to DE06 ParFlow’s forecasting cycle.
Section 2 gives a brief overview of the data products assessed in this study and the preprocessing steps. A benchmarking of each dataset against in situ reference observations is presented in Section 3.1. An assessment of HRES precipitation, its fidelity, and the suitability of the comparison datasets for bias adjustment is presented in Section 3.2. Limitations and constraints of the study are found in Section 3.3. Section 4 includes a summary and conclusion.
Categorized by data type, this section provides an introduction to the ten datasets considered in our evaluation, see the Supplementary Table S1 for a condensed dataset overview, including data sources. The precipitation dataset selection criteria resulted in a diverse set of commonly used datasets. With respect to availability and usability, data has to be readily available and provided as free products. As geometric properties, we include point-based station observations as well as gridded data of different resolutions. The gridded data are of different types: interpolated in situ, radar, and satellite-based observations, or from NWP models and reanalysis. For temporal availability, we distinguish between near real-time and non-real-time. The resulting dataset range ensures a comprehensive evaluation that may inform on datasets applicability in various contexts. The 24 h total precipitation (including snowfall) is the only variable analyzed in this study.
The European Climate Assessment and Dataset (ECA&D), a database of daily meteorological station observations (Klein Tank et al., 2003), serves as the reference dataset in this study. The station-based dataset is specifically chosen due to the high density of monitoring stations in Germany, within the DE06 domain. Given the importance of accurate spatial representation, we avoid using gridded in situ datasets as reference. While such datasets would provide valuable information, its interpolation method might introduce inaccuracies, especially in regions with sparse or uneven station coverage. By selecting the ECA&D dataset, we ensure that the reference data reflects the most reliable and precise ground-based observations, offering a more accurate basis for evaluating the other datasets in this study. ECA&D is provided by the Royal Netherlands Meteorological Institute (KNMI) and contains daily values of up to 12 observed meteorological variables for a total of 26,440 stations across 65 countries in Europe and the Mediterranean, some dating back to before 1900 (Van den Besselaar et al., 2015). The ECA&D data has been extensively pre-processed and quality controlled (Royal Netherlands Meterological Institute, 2021). The spatial distribution of ECA&D stations with available data within the DE06 model domain is shown in Figure 1A. Over Germany, the ECA&D data is based on the rain gauge network of the German Weather Service (DWD). Notably, the data underwent post-processing (Filter 1, Filter 2), explained in detail in Section 2.2.1. The mean annual precipitation sum from 2014 to 2022 over all ECA&D stations in Germany is 764 mm/year. Precipitation in Germany varies both spatially and seasonally, with higher amounts in the central and southern mountainous regions due to prevailing westerly and southwesterly winds of oceanic origin with orographic precipitation along the mid mountain ranges. The eastern parts receive less rainfall under a more continental climate (UBA, 2019). While summers in Germany are usually wetter than winters, they also show higher evaporation rates. Consequently, rivers often experience lower runoff in summer compared to winter (Kahlenborn et al., 2021).
The ECMWF atmospheric model high-resolution 10-day forecast (HRES) from the Integrated Forecasting System (IFS) at about 9 km horizontal resolution (Owens and Hewson, 2018) serves as the baseline atmospheric forcing data at hourly intervals for the ParFlow DE06 hydrological forecasts. In this study, total hourly precipitation for the first 24 h from daily HRES 12 UTC forecast runs, concatenated into a time series, is evaluated.
The Reanalysis v5 (ERA5) atmospheric global reanalysis dataset, produced by ECMWF using the IFS model with data assimilation (Hersbach et al., 2020), is widely utilized across various applications. It serves, e.g., both as a driving and validation dataset for regional climate models (e.g., Varga and Breuer, 2020) and as input for global hydrological models (e.g., Müller Schmied et al., 2021). Consequently, we include in our evaluation ERA5’s total hourly precipitation at a 31 km horizontal resolution, obtained from the Copernicus Climate Data Store. ERA5 is continuously updated with preliminary data available within 5 days.
Since higher resolution atmospheric models have added value in reproducing precipitation amounts, intensities, diurnal cycles and spatial patterns (e.g., Loken et al., 2017; Ban et al., 2021), hourly precipitation from the COSMO-REAnalysis dataset for Europe at a resolution of 6 km (Bollmeyer et al., 2015) is considered in this study as well. COSMO-REA6 is based on the COSMO limited-area model (LAM) (Schättler et al., 2021), the former operational NWP system of the DWD, and run over the European model domain.
The HYRAS-DE-PRE v3.0 (Rauthe et al., 2013) is a high-resolution dataset and processing methodology, providing daily precipitation at 1 km resolution for Germany and overlapping major river basins. It has been developed for hydrological and hydrometeorological applications by DWD and the Federal Institute of Hydrology. HYRAS is based on a sophisticated spatial interpolation of extensively pre-processed precipitation gauge observations (Rauthe et al., 2013), i.e., it shares many of the observations with ECA&D. HYRAS has served as the modeling basis for the climate impact assessment of Germany (Kahlenborn et al., 2021).
Radar data are usually available at high temporal and spatial resolutions in near real-time. RADOLAN RW is a gauge-adjusted fully pre-processed precipitation dataset provided by DWD at 1 km spatial and 1 h temporal resolution based on a network of 17 operational C-band weather radars covering entire Germany. RADOLAN is used by German water management authorities for flood risk management and other hydrometeorological applications (Weigl, 2017).
The RADKLIM data product, a climatological version of the RADOLAN dataset, features gauge-adjusted data that have undergone offline climatological corrections to address issues such as spokes and clutter (Auerswald et al., 2019). The dataset starts in 2001 and shows improvements in capturing short-lived extreme precipitation. It provides a reference for climate model evaluation, specifies damage potential to infrastructure and supports adaptation measures and civil protection (Winterrath et al., 2017).
Since the DE06 model domain includes Germany and adjacent river catchments (Figure 1), the spatial coverage provided by RADOLAN and RADKLIM is not sufficient. Therefore, the European radar composites produced by the Operational Program of the Exchange of Weather Radar Information (OPERA) are additionally included in this evaluation study. OPERA nowadays includes 150 radars across 30 member countries (Park et al., 2019) in a unified data product. The composite provides a 2 km spatial and hourly accumulation, updated every 15 min (Saltikoff et al., 2019).
Similar to RADKLIM, the EUropean RADar CLIMatology (EURADCLIM) is a climatological, gauge-adjusted version of OPERA. EURADCLIM applies additional algorithms to homogenize the data, including statistical clutter filters, cloud-type product integration to exclude non-precipitating areas, and annual clutter masks to replace erroneous radar accumulations with interpolated values (Overeem et al., 2023). It maintains a similar resolution to OPERA and includes a dataset with 24 h precipitation accumulations (Overeem et al., 2023).
Satellite data products provide essential coverage by filling the gaps left by ground-based measurements (Liu et al., 2007). IMERG V07 is a global, half-hourly dataset with a spatial resolution of 10 km. This product integrates precipitation-relevant passive microwave satellite retrievals together with microwave-calibrated infrared satellite estimates and precipitation gauge analyses to create a comprehensive merged dataset (Huffman et al., 2020).
IMERG provides three datasets: The near real-time IMERG-Early (IMERG-E), available 4 hours after the observation, the near real-time IMERG-Late (IMERG-L), available 14 h after the observation, and the IMERG-Final (IMERG-F), updated approximately 3 months after the observation. The primary difference between IMERG-E and IMERG-L is that IMERG-E relies solely on extrapolation, whereas IMERG-L incorporates both extrapolation and interpolation. In all three datasets, gauge analysis plays a key role in determining final values for areas with reliable gauge coverage (Huffman et al., 2023). In this study, IMERG-L and IMERG-F are evaluated. IMERG is particularly valuable in regions with limited ground-based data. IMERG precipitation data is, e.g., integrated into the Drought Severity Evaluation Tool used for drought management in the Navajo Nation in the United States (McCullum et al., 2021).
Because of data availability, our study encompasses a 9-year time span from 2014 to 2022. The datasets are considered as readily available precipitation data products, which are used without any additional processing or quality control, except adjustments for the different temporal resolutions of the datasets and the filtering process, which are explained below.
Our analysis is performed on a per-station basis and without regridding to a common reference grid. Instead, for each ECA&D station location within the ParFlow DE06 model domain, the temporally aggregated (to daily sums) time series from each gridded dataset are extracted from the nearest neighbor grid point in order to set up our DE06 domain data collective.
As mentioned above, the ECA&D reference dataset has a daily resolution. For the stations included in the study (see Figure 1B), a day is defined from 6 UTC to 6 UTC of the following day. Despite the fact that ParFlow DE06 is run with an hourly atmospheric forcing, the daily resolution of ECA&D determines the temporal scale of this study’s evaluation. After downloading all datasets from their respective sources, the first step is to align each dataset with the 6 UTC-6 UTC day definition of ECA&D within the DE06 domain to ensure consistency. Defining a day from 6 UTC to 6 UTC is possible as, aside from daily HYRAS data (also from 6 UTC to 6 UTC), HRES, ERA5, COSMO-REA6, RADOLAN, RADKLIM, and EURADCLIM have hourly resolutions, while IMERG-F and IMERG-L even have half-hourly resolutions. Finally, OPERA is available at quarter-hourly resolution. All datasets are read and stored in one single matrix, more precisely a NumPy array, for further processing.
For the HRES forecast dataset, the 12 UTC hourly forecast is selected for this evaluation because it is also used as the atmospheric boundary condition in the DE06 simulations. So, to create temporally consistent 24 h HRES precipitation sums, the first 6 hours of a given day (i.e., 6–12 UTC) are extracted from the previous day’s 12 UTC forecast, while the following 18 h (i.e., 12–6 UTC) are extracted from the same day’s forecast.
All datasets are aggregated to 24 h precipitation sums in mm, so they are consistent with the temporal resolution and day definition of the ECA&D reference. On a per-dataset basis, a day is flagged as missing, if any time step within the 24 h is missing.
To overcome the typical overestimation of very low precipitation amounts of atmospheric models, commonly referred to as the drizzle bias (Dai, 2006), a threshold of 0.1 mm/h is applied to HRES, ERA5, and COSMO-REA6 as suggested by Dai et al. (2007). Consequently, precipitation amounts less than 0.1 mm/h per grid cell are set to zero precipitation before calculating the daily sums of these datasets. This adjustment helps prevent the artificial inflation of precipitation sums, particularly for low-intensity events, thereby improving the accuracy of monthly, seasonal, and annual precipitation totals. Over the whole period, this correction reduces the precipitation by a mean of 0 mm/year for HRES (where the drizzle effect is not visible at any station), ERA5 73 mm/year, and 28 mm/year for COSMO-REA6. In addition, we consider a day as missing when any dataset exceeds a precipitation value of 400 mm/day. This threshold is set based on the observed highest daily precipitation sum of 312 mm/day in the historical rain gauge records of DWD for Germany (DWD, 2016), ensuring that extreme erroneous values do not distort overall precipitation sums and leading to more reliable estimates across all time scales. Following this criteria, we removed a total of 846 days from the OPERA dataset spread over 305 stations.
The datasets vary in spatial and temporal coverage. To ensure a fair and statistically sound intercomparison, we apply a selective filtering of the data method. If only those days with a valid precipitation value in all datasets are considered (this is the initial criteria), it would result in excessive reduction of data for the comparison (see Supplementary Figure S1). Additionally, inconsistencies in data availability can affect the reliability of the comparison.
To address this, a filter referred to as “Filter 1” is implemented. This approach systematically checks each day for valid data in each dataset and removes any day that lacks valid data from all datasets to maintain consistency across all datasets. It excludes however: (i) COSMO-REA6, in the timespan from 2019 to 2022 as it does not cover it at all, (ii) OPERA from 2014 to 2018, and EURADCLIM from 2014 to 2018 and in 2020, where they have numerous missing days (due to radar coverage limitations), and (iii) RADKLIM throughout the whole time span as for some extracted station time series are subjected to many missing days due to frequent sub-daily gaps. So, to overcome this issue for RADKLIM, if more than 10% of the days of a given year are missing for a specific station, the whole year is excluded for that station. However, if there are missing days in other datasets (e.g., ECA&D, RADOLAN), those days are then also removed from these four datasets (COSMO-REA6, OPERA, EURADCLIM, RADKLIM), as illustrated in Figure 2A. Since HYRAS, RADOLAN, and RADKLIM cover only Germany, stations outside Germany are automatically excluded from the analysis when applying the aforementioned criteria. The results from “Filter 1” are illustrated in Figure 1B. For the ECA&D stations outside of Germany, the resulting temporal data coverage after filtering is consequently 0%, within Germany it is mostly close to 100%. Because of the overall high data availability, no additional temporal coverage threshold per time interval is needed. For more details on missing days for each dataset, see Supplementary Figure S1. The application of this filtering leads to a total of 3524 ECA&D station locations within Germany usable for our analysis from 2014 to 2022.
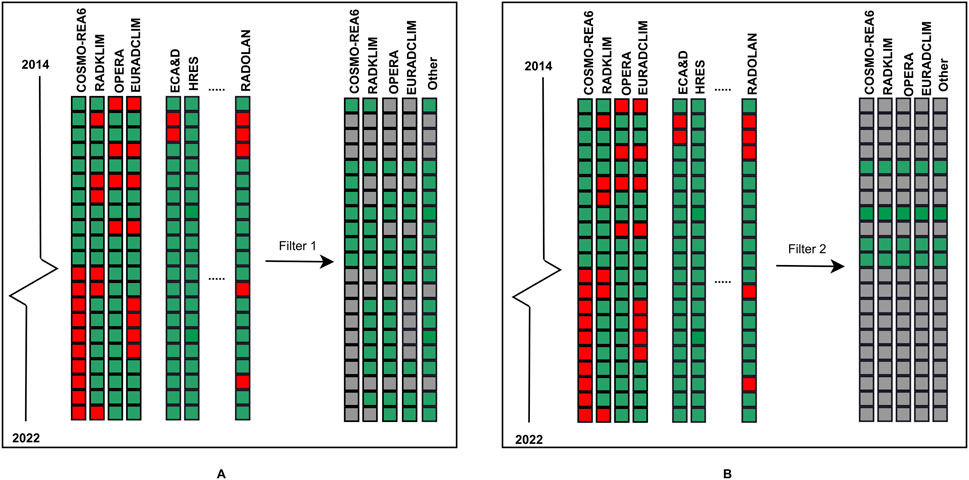
Figure 2. Schematic representation of the data filtering workflow applied to the datasets for one selected station, illustrating a temporal subset of the period 2014 to 2022. For each dataset, data availability is marked in green (available) and gaps in red (missing). (A) “Filter 1” is applied to minimize data loss when using the initial criteria but not taking into account the big gaps in datasets COSMO-REA6, RADKLIM, OPERA, and EURADCLIM (B) “Filter 2” is applied to retain only days that meet the initial criteria in all datasets, resulting in a much reduced dataset represented by more gray boxes (excluded days).
To analyze the impact of the dataset length on the evaluation of extreme precipitation in Section 3.1, we also evaluate the alternative method of considering only days with a valid precipitation value in all datasets, mentioned above and referred to as “Filter 2” (see Figure 2B). If any dataset for any day at any station location has missing data, this day will be set to “missing” in all datasets for the respective station, which reduces the temporal coverage (Figure 1C). This more severe filter therefore represents a smaller sample size, resulting in a database covering only up to 60% of the total time span but ensuring the exact temporal alignment of all datasets.
In order to characterize relevant precipitation properties such as amount, frequency, spatial distribution, and intensity, the evaluation is split into three parts.
In the first step, the seasonal (DJF, MAM, JJA, SON) and annual relative spatial biases are calculated. They are defined as the average relative differences expressed as (((dataset_i-ECA&D_i)/ECA&D_i)*100) between the total precipitation sums of the time series of a dataset and the ECA&D reference time series, calculated for each season and year across the ten evaluation datasets. In addition, the ECA&D sites are grouped into three altitude ranges: below 200 m Above Mean Sea Level (AMSL) (low altitude), between 200m and 800 m AMSL (medium altitude), and above 800 m AMSL (high altitude). Of the 3524 used ECA&D station sites under consideration, 1519, 1901 and 104 are in the low-, medium-, and high-altitude class, respectively (see Figure 1B for the altitude classification). For each comparison, the Kolmogorov-Smirnov (K-S) non-parametric statistical test is applied to evaluate whether the empirical distributions from the evaluation datasets and the ECA&D reference are derived from the same underlying distribution. The test is conducted at a specified significance level of α = 0.05, where the rejection of the null hypothesis implies that the distributions differ significantly. The distributions are based on the daily time series for each ECA&D station, grouped by altitude range and meteorological season. If the K-S test shows a disagreement for more than 10% of the stations, we assume a statistically significant disagreement for the respective comparison, which may be considered a strict threshold.
In the second step, the spatial and temporal variability is assessed with Taylor diagrams (Taylor, 2001). These diagrams provide information on (i) the variability, measured as the relative standard deviations (STD dataset/STD ECA&D), (ii) the correlation between each dataset and ECA&D, and (iii) the centered, i.e., normalized, root mean squared error (CRMSE), which represents the RMSE after removing the differences in the dataset means. For the spatial Taylor diagrams, multi-year seasonal mean precipitation for all stations is used, while for the whole period, it considers precipitation data for all stations without seasonal aggregation. In contrast, the temporal Taylor diagram for the whole period use monthly precipitation sums averaged over the domain.
In the third step, the datasets are evaluated with respect to widely used descriptive precipitation indices from the CLIVAR/CCl/JCOMM Joint Expert Team on Climate Change Detection and Indices (ETCCDI) (Peterson, 2005). Using the commonly used definition of wet day as precipitation ≥1 mm/day, the following indices are considered: (A) Wet days frequency, defined as the percentage of wet days, (B) the highest number of Consecutive Wet Days (CWD) per year, (C) the Simple Daily Intensity Index (SDII), which is the average precipitation at wet days, (D) R10mm, the percentage of days with heavy precipitation (precipitation ≥10 mm/day), (E) R20mm, the percentage of days with very heavy precipitation (precipitation ≥20 mm/day), and (F) Rx1day, the maximum amount of precipitation in 1 day. As mentioned earlier, a day in our analysis is defined as the 24 h time span from 6 UTC to 6 UTC on the following day. The indices are represented as violin plots of the empirical distributions for all stations (no altitudinal ranges) and datasets. The distributions are constructed from the 3524 indices, each calculated per ECA&D station location from the respective time series from 2014 to 2022. According to the filtering applied, each time series has a unique sample size.
In this section, we present a comprehensive evaluation of the datasets for the period 2014 to 2022. The analysis includes spatial relative biases, an assessment of their seasonal spatial/temporal variability through the use of Taylor diagrams, and the evaluation of some common precipitation indices (see Sec. 2.2.2).
HRES and ERA5, which are both produced by different versions of the IFS model using different data in the assimilation, show comparable biases. However, ERA5 has slightly higher bias percentages, whether positive or negative (Figure 3). Both datasets tend to overestimate precipitation at low and medium altitudes for all seasons, with a systematically larger overestimation in spring. An underestimation is prevalent at higher altitudes. For HRES, the mean relative bias of the annual sums in all cases falls within the range of −10%–10%. The overestimation of ERA5 agrees with the findings by Bandhauer et al. (2022), who evaluated ERA5 against regional precipitation gauge datasets. Significant differences (K-S test) between ECA&D, HRES, and ERA5 (“X” in Figure 3), respectively, are found mostly in spring and for most summers. In contrast, COSMO-REA6 shows a different bias pattern with a tendency towards wetter winters and springs at medium to high altitudes, an underestimation at low altitudes, as well as an underestimation during summer precipitation at higher altitudes. Unlike HRES and ERA5, COSMO-REA6 shows no significant differences compared to ECA&D.

Figure 3. Spatial mean of seasonal (DJF, MAM, JJA, SON) and annual relative precipitation biases [%] per dataset, year, and altitudinal range (low, medium, high, see Figure 1B). Each cell represents the spatial mean of the relative bias of the total seasonal or annual precipitation sum between an evaluation dataset and the ECA&D reference for all ECA&D sites within each altitudinal range within Germany. Gray cells: Excluded due to insufficient data availability for a given year or season. The X markers indicate that more than 10% of the sites show a statistically significant different distribution of daily precipitation amounts compared to ECA&D according to the K-S test with an alpha level of α = 0.05; annual precipitation is excluded from this test.
The Taylor diagrams in Figures 4A–D, show that the spatial variability is underestimated in HRES and ERA5, especially in winter and autumn, while their performance improves in spring and summer. COSMO-REA6 shows a similar behavior of underestimation in all seasons except for spring. In terms of spatial correlation, the three datasets achieve values above 0.5, with the highest performance seen in spring and summer, where all datasets exceed a correlation coefficient of 0.8. Compared to HRES and ERA5, COSMO-REA6 underperforms in all seasons. When investigating the spatial variability of the whole period, it appears that the three datasets underestimate the variability, with a spatial correlation between 0.7 and 0.8 (Figure 4E). The three datasets have good performance in terms of temporal variability (Figure 4F); the temporal correlation exceeds 0.9 with relatively low CRMSE.
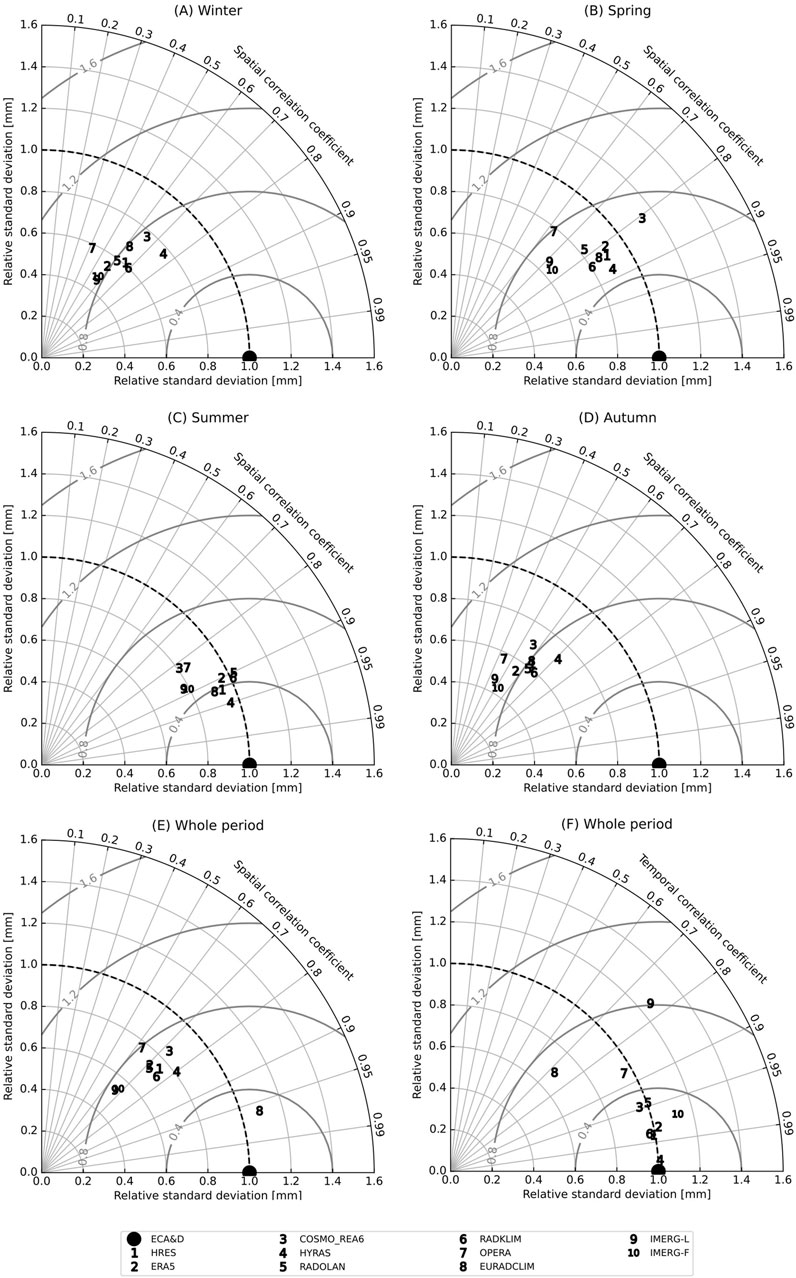
Figure 4. Taylor diagrams summarizing each dataset’s performance in comparison to ECA&D, in respect of spatial variability (relative standard deviation), spatial correlation coefficient, and spatial CRMSE of multi-year seasonal precipitation for all 3524 stations in (A) winter, (B) spring, (C) summer, and (D) autumn from 2014 to 2022; (E) the spatial variability (relative standard deviation), spatial correlation coefficient, and spatial CRMSE of monthly precipitation sums averaged across Germany; and (F) the temporal variability (relative standard deviation), temporal correlation coefficient and temporal CRMSE of monthly precipitation sums averaged across Germany.
Figure 5A illustrates the percentage of wet days, showing the distribution of ECA&D stations based on the proportion of wet days they experience. HRES and ERA5 have an 8% higher median compared to ECA&D, indicating an overestimated frequency of wet days, with the highest density of stations having about 38% wet days. This also explains the positive bias that is observed in Figure 3 and is consistent with the results of previous studies by Rodwell et al. (2011) and Lavers et al. (2022). They attribute the positive bias in HRES and ERA5 to an overestimation of precipitation on typically dry days. In contrast, COSMO-REA6 shows results that are more similar to ECA&D. Its median closely matches ECA&D, indicating a comparable representation of wet days. However, its distribution is narrower, indicating less spatial variability compared to ECA&D. Notably, COSMO-REA6 provides a better representation of wet day frequencies when compared to ERA5, which has a coarser spatial resolution. This is consistent with Wahl et al. (2017) and aligns with findings in the precipitation representation in convection permitting RCMs, such as, in Ban et al. (2021). CWD in Figure 5B illustrates how well the datasets capture the duration of wet periods. Here, HRES and ERA5 show an overestimation as indicated by their higher medians and the presence of multiple secondary maxima further supporting the overestimation. Consistent with Figure 5A and the general overestimation as seen in Figure 3; Supplementary Figure S2, there is more widespread precipitation. This results in a higher number of ECA&D sites where HRES and ERA5 show long-lasting precipitation. COSMO-REA6 shows a similar distribution to ECA&D, but tends to slightly overestimate CWD. With respect to precipitation intensity in Figure 5C, HRES and ERA5 tend to slightly underestimate SDII overall. When considering their performance in terms of percentage of wet days (Figure 5A), HRES and ERA5 tend to overestimate low-intensity precipitation events compared to high-intensity ones. This is a well-known behavior of convection-parametrized atmospheric models (Vergara-Temprado et al., 2020), which is improved with the COSMO-REA6 dataset. For R10mm in Figure 5D, HRES, ERA5, and COSMO-REA6 show spatial distributions that closely match ECA&D. For R20mm (Figure 5E), only COSMO-REA6 shows similar patterns to ECA&D, while HRES and ERA5 fail to capture days with very high precipitation. This issue has also been highlighted by Forbes et al. (2015), who assessed the improvements in IFS forecasts, and by Schauwecker et al. (2021) evaluating the representation of heavy precipitation events in IFS forecasts for Switzerland. This can explain the underestimation of precipitation in complex, heterogeneous, mountainous terrain (Figure 3; Supplementary Figures S2, 3). The comparison of maximum daily precipitation (Figure 5F) shows that COSMO-REA6 manages to capture extreme events. In contrast, HRES and ERA5 generally underestimate maximum daily precipitation, a pattern also observed by Lavers et al. (2022) for ERA5. When observing the two sides of the violin plots, it is clear that the length of the analyzed time series (“Filter 1” vs. “Filter 2”) has minimal impact on the empirical distribution, as shown by the similar spread of values on both sides.
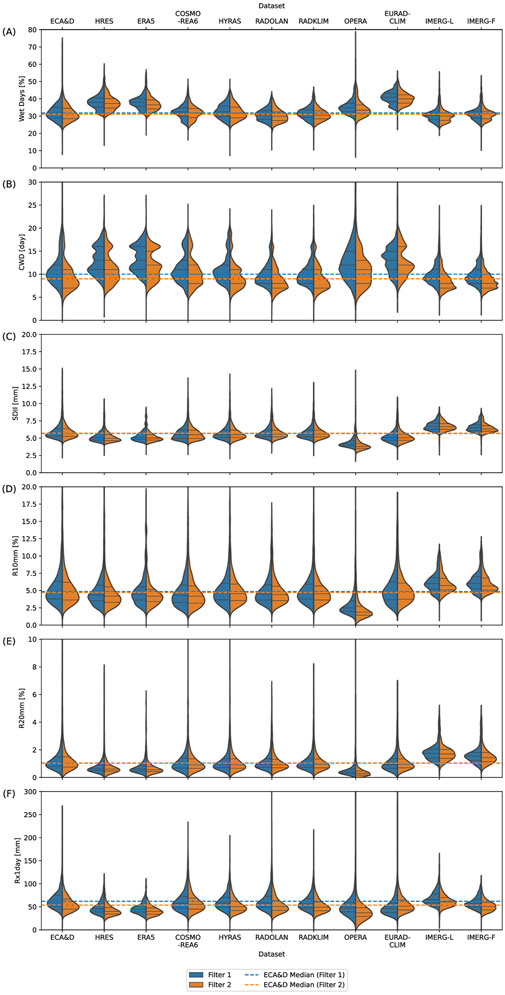
Figure 5. Violin plots of the distribution of six ETCCDI precipitation indices over ECA&D stations in Germany for the period from 2014 to 2022: (A) Percentage of wet days; (B) maximum number of consecutive wet days (CWD); (C) simple daily intensity index (SDII); (D) percentage of heavy precipitation days (>10mm/day) (R10mm); (E) percentage of very heavy precipitation days (>20 mm/day) (R20mm); (F) highest 1-day precipitation amount (Rx1day). The two sides of each plot represent the two data filtering methods; left/blue: distribution after applying “Filter 1” (Figure 1B; Figure 2A); right/orange: distribution after applying “Filter 2”, considering a consistent overlap of all datasets, resulting in a smaller sample size (Figure 1C; Figure 2B). Horizontal dashed lines: ECA&D reference data median from the two data samples. Horizontal black solid lines per distribution: Lower and upper quartile, and median.
The choice between HRES, ERA5, and COSMO-REA6 depends on the application. HRES, as an operational high-resolution forecast dataset, is best suited for near real-time hydrological forecasting and short-term decision-making like the aforementioned ParFlow DE06. ERA5 with its long historical record is considered a valuable dataset for long-term hydrological modeling, where capturing climatic trends and long-term variability is essential. Given that COSMO-REA6 exhibits better agreement with ECA&D in wet day frequency and heavy precipitation representation, it may be a more suitable dataset for applications related to extreme events.
HYRAS has consistently small biases, typically between −10% and 10% across all altitudes and years (Figure 3). This low relative bias is expected as HYRAS is based on the same precipitation gauge network that makes up the ECA&D dataset over Germany. However, the precipitation gauges used for HYRAS undergo a different pre-processing and quality control procedure at DWD (Rauthe et al., 2013). This includes examining time series for outliers at each station using the interquartile-adjusted method (Eischeid et al., 1995).
Similar to the atmospheric model datasets, the spatial variability for HYRAS is underestimated in winter, spring, and autumn (Figures 4A, B, D), while it shows close variability to ECA&D in summer (Figure 4C). HYRAS shows high spatial correlation with ECA&D scoring at least 0.7, while scoring the highest in summer. The CRMSE varies between 0 and approximately 0.4, indicating relatively low errors in spatial variability. For the spatial variability for the whole period, it shows an underestimation (Figure 4E). As for the temporal variability (Figure 4F), it shows good performance in terms of the three statistics measures. HYRAS demonstrates good performance in terms of the six extreme precipitation indices, as illustrated in Figure 5.
HYRAS, with its consistently strong agreement with ECA&D, is particularly well-suited for non near real-time hydrological applications that require high resolutions for small-scale studies in Germany.
As observed in Figure 3 and despite gauge-adjustment, RADOLAN RW shows biases of up to −25% for the seasonal and annual sums. This aligns with a general precipitation underestimation, that is especially pronounced at high altitudes during winter. Only during summer there is a tendency towards a slight overestimation, mostly below 10%. The general features characteristic of RADOLAN are retained in the RADKLIM radar climatology, but the more extensive processing of RADKLIM results in biases reduced by 5%–10%. Our findings align with Kreklow et al. (2020) by confirming a persistent underestimation in RADOLAN RW, particularly in winter, while also highlighting the improvements in RADKLIM. Significant differences (“X” in Figure 3) between the two datasets, and ECA&D mainly occur during winter. OPERA mainly underestimates precipitation in winter and overestimates it in summer, and it is more variable in spring and autumn. Over Germany, this dataset is based on the same radar observations as RADOLAN, but with a different processing (Saltikoff et al., 2019). This is further supported by findings from Overeem et al. (2024), which indicate that OPERA underestimates daily precipitation. The underestimation is largely attributed to beam overshooting, where the radar beam misses the lower portions of lower atmospheric layers, resulting in incomplete observation, particularly during winter (Saltikoff et al., 2019). In contrast, EURADCLIM generally overestimates precipitation, but with a slight tendency to underestimate at higher altitudes. Compared to OPERA, EURADCLIM seems to be wetter but with lower relative bias values due to the gauge adjustment. Overeem et al. (2023) further confirm that EURADCLIM consistently records higher precipitation amounts than OPERA. The OPERA and EURADCLIM data products have the advantage of covering a large portion of Europe, which makes them potentially usable with the DE06 ParFlow model domain. All OPERA and EURADCLIM comparisons show significant differences at more than 10% of the ECA&D sites. The years 2014–2018, and for EURADCLIM also 2020, are not considered, as they exhibit many missing data (see Supplementary Figure S1). Significant differences between RADOLAN and RADKLIM compared to ECA&D are primarily observed during winter. In contrast, comparisons involving OPERA and EURADCLIM show significant differences at more than 10% of the ECA&D sites in all seasons.
From Figures 4A–D, RADOLAN, RADKLIM, and EURADCLIM perform well in capturing spatial patterns, especially in spring and summer. As for the spatial correlation, RADOLAN, RADKLIM, and EURADCLIM achieve values above 0.6. They score highest in summer, with values above 0.9, followed by spring, with values above 0.7. On the other hand, OPERA shows less spatial variability in all seasons. Figure 4E represents spatial variability for the whole period; RADOLAN and RADKLIM have a correlation between 0.7 and 0.8, while OPERA has a correlation of 0.6. All three datasets underestimate variability with CRMSE from 0.6 to 0.8. On the other hand, EURADCLIM shows a higher correlation with around 0.95, with overestimation in the variability and with CRMSE less than 0.4. As for the temporal variability (Figure 4F), the correlation for RADOLAN and RADKLIM lies between 0.95 and 0.99, with variability similar to ECA&D. OPERA and EURADCLIM show lower correlation between 0.7 and 0.9 with underestimation of the variability and higher CRMSE in comparison to RADOLAN and RADKLIM.
RADOLAN and RADKLIM generally perform well compared to ECA&D, with regards to the percentage of wet days (Figure 5A). Their median is within the interquartile range of ECA&D. OPERA has a slightly broader distribution compared to ECA&D, with more pronounced tails, indicating greater spatial variability and a higher frequency of extreme values, i.e., stations where OPERA has a very high number of wet days. Also, the median is slightly higher than ECA&D, indicating that it tends to have more wet days. EURADCLIM tends to overestimate the frequency of wet days more than OPERA, with all its values higher than the ECA&D median. Figure 5B shows that RADOLAN and RADKLIM generally agree with ECA&D, with all having similar medians. However, RADOLAN and RADKLIM tend to slightly underestimate higher CWD values. In contrast, OPERA overestimates CWD, with a higher density indicating less variability compared to ECA&D, while EURADCLIM shows an even greater overestimation. Similar to CWD, RADOLAN and RADKLIM show a distribution of SDII (Figure 5C) similar to ECA&D, indicating a consistent representation of precipitation intensity. OPERA tends to underestimate SDII, with almost all stations lying below the ECA&D median. EURADCLIM shows an improvement over OPERA, but still underestimates SDII. Results for R10mm and R20mm in Figures 5D, E respectively, indicate that RADOLAN, RADKLIM, and EURADCLIM show spatial distributions that closely match ECA&D. EURADCLIM’s results are also confirmed by Overeem et al. (2023). In contrast, OPERA tends to underestimate in most cases, despite indicating a high frequency of wet days. RADOLAN and RADKLIM manage to capture extreme events (Figure 5F). In contrast, OPERA consistently underestimates Rx1day, while EURADCLIM shows results closer to ECA&D, although it still shows underestimation with Filter 1.
Given its relatively low biases and strong agreement with ECA&D, RADOLAN is well-suited for near real-time hydrological forecasting in Germany. Its high spatial resolution and frequent updates make it valuable for applications requiring timely precipitation input. RADKLIM, while not a real-time dataset, provides a high-quality long-term radar-based precipitation climatology, making it more suitable for historical hydrological analyses, trend assessments, and model validation. On the other hand, OPERA and EURADCLIM, with their broader European coverage, present an advantage for transboundary hydrological studies.
IMERG-L generally tends to underestimate precipitation in winter and spring and overestimate it in summer and autumn for most years (Figure 3). The underestimation is more pronounced at higher elevations in all seasons. As expected, the IMERG-F product shows a similar bias pattern as IMERG-L but with smaller magnitudes due to the time interpolation, gauge adjustment, and climatological adjustment (Foelsche et al., 2017). The systematic underestimation of precipitation in mountainous regions such as the Alps, and secondary mountains like the Harz, the Thuringian forest, and the Black Forest is due to the inability of the satellites to detect orographic and light precipitation. Ramsauer et al. (2018) highlight that satellite-based precipitation estimates often struggle in complex terrain, leading to underestimations. Similarly, Navarro et al. (2019) report that IMERG-F underestimates precipitation in mountainous areas, including the Alps and Scandinavian mountains. As a result, significantly differing time series (“X” in Figure 3) occur in all seasons but mainly in winter and autumn.
Figures 4A–D illustrates that both IMERG products consistently underestimate spatial variability across all seasons. While IMERG-F shows a modest improvement over IMERG-L, their spatial patterns remain largely similar. Spatial correlation ranges from 0.4 to 0.9, with the lowest values observed in autumn. As it appears in Figure 4F, both products overestimate the temporal variability. IMERG-F demonstrates improvement in terms of correlation and CRMSE compared to IMERG-L.
For the percentage of wet days (Figure 5A), both IMERG-L and IMERG-F generally underestimate the frequency, showing fewer wet days than ECA&D. This underestimation is also seen for consecutive wet days (CWD) in Figure 5B, where values are mainly concentrated around the median, reflecting a tendency to underestimate the duration of wet periods. In terms of precipitation intensity (SDII) in Figure 5C, IMERG-L, despite underestimating the frequency of wet days, tends to overestimate precipitation intensity, with values typically above the ECA&D median. IMERG-F mirrors IMERG-L’s pattern here, also showing an overestimation of SDII. For the R10mm index (Figure 5D), IMERG-L and IMERG-F both tend to overestimate the number of days with precipitation amounts above 10mm. Similarly, when examining R20mm (Figure 5E), IMERG-L and -F both show an overestimation, but to a lesser extent for IMERG-F, which is consistent with SDII (Figure 5C). They have a tendency for shorter, less widespread, more heavy precipitation events. Finally, in the assessment of maximum daily precipitation (Figure 5F), IMERG-L tends to overestimate extreme values, while IMERG-F shows a slight improvement.
Given their global coverage and satellite-based nature, IMERG-L and IMERG-F are particularly valuable for hydrological applications in data-scarce regions or for large-scale modeling efforts.
After having analyzed the performance of each dataset, in this section we will discuss the suitability of HRES for hydrological forcing (3.2.1) and whether bias adjustment using the other datasets from the DE06 domain data collective is possible (3.2.2).
As mentioned in the introduction, an objective of this evaluation is to assess how well the daily HRES precipitation compares to in situ observations. Although hourly HRES forecasts are the atmospheric drivers of experimental ParFlow integrated hydrological model forecasts (Belleflamme et al., 2023), the daily comparison is justified. The DE06 forecasts have a water resources focus, where short-term sub-daily precipitation events are less critical than in high-resolution flood forecasting. It is important to note that this study deliberately refrains from investigating the HRES forecast skill beyond the first 24 h, this is beyond the scope of this study. The first 24 h determine the evolution of the terrestrial water cycle in the ParFlow DE06 forecast runs until the initialization of the next 10-day forecast cycle after 24 h.
Our analysis reveals that HRES performs as well as, or even better than reanalyses and gridded observational datasets that rely on in situ, radar, or satellite data. These results confirm our confidence in using HRES as a forcing dataset for our hydrological monitoring and forecasting system. HRES proves to be a suitable atmospheric forcing dataset for ParFlow DE06 long-term simulations, meeting the requirements of a central European spatial coverage, near real-time availability, and sub-daily temporal resolution (though this aspect is not assessed here). However, while HRES appears adequate for water resource simulations without bias adjustment, we consider the dataset less suitable for studies focusing on the impacts of extreme precipitation events.
The ERA5 reanalysis shows evaluation results very similar to the HRES forecast. Both datasets are produced by the same model, albeit by very different model versions (Cycle 47r3 with HRES vs. Cycle 41r2 with ERA5), using different assimilation schemes, and spatial resolutions (9 km vs. 31 km). Despite its comparable performance to HRES, ERA5 is not available in near real-time, making it unsuitable for near real-time bias adjustment. COSMO-REA6 underperforms in capturing spatial patterns (Figure 4) and in terms of temporal variability (Figure 4E). However, compared to HRES, COSMO-REA6 demonstrates a better ability to capture extreme events (Figures 5D, E). It is also important to note that COSMO-REA6 has been discontinued due to the termination of ERA-Interim that is used as boundary conditions (DWD, 2020). It will be replaced by the new COSMO-REG2 product.
The HYRAS and ECA&D datasets show strong similarity, as both are based on the same DWD precipitation gauge network, with minor differences due to quality control and interpolation methods. Similarly, the RADOLAN and RADKLIM datasets align well with ECA&D, though RADOLAN tends to underestimate precipitation in autumn and winter. RADKLIM improves upon RADOLAN, reducing differences. However, HYRAS, RADOLAN, and RADKLIM are all limited to a Germany-only coverage, with HYRAS and RADKLIM further constrained by later data availability.
On the other hand, OPERA and EURADCLIM’s coverage includes the whole DE06 domain, with the major river catchments relevant for Germany. However, OPERA shows a general underestimation. While EURADCLIM, as a gauge adjusted OPERA variant, shows improvement in capturing the spatial patterns and extreme events with respect to ECA&D, it shows a large overestimation of weak precipitation events. Although EURADCLIM provides valuable Europe-wide coverage, it does not match the precision of national gauge-adjusted datasets like RADKLIM (as also noted by its developers, Overeem et al., 2023) and is not available in near real-time. These factors limit the suitability for bias adjustment in hydrological forecasting.
The IMERG-L dataset exhibits large over- and underestimations in the annual and seasonal precipitation amounts. The spatial pattern improves during summer for both IMERG-L and IMERG-F, while a weakness remains in the mountainous regions (Figure 3). In general, IMERG-L and -F seem to be producing too intense heavy, and short-lived precipitation events, which may explain the overestimation of temporal variability compared to ECA&D. IMERG-F shows clear improvements over IMERG-L, especially for low and medium altitudes. The developers recommend using IMERG-F for analysis (Huffman et al., 2023), and in this study IMERG-L is also examined as it is a near real-time dataset. However, due to their precipitation biases, neither IMERG-L nor IMERG-F is suitable for the bias adjustment.
In summary, as the comparison datasets are either (i) not available in near real-time, or (ii) show worse comparison results than HRES, or (iii) have a too limited spatial extent, none of these datasets seems to be suitable for bias adjustment within the ParFlow DE06 forecasting cycle.
One of the main limitations of this study is its geographical focus on Germany only. While the DE06 domain extends beyond Germany to include neighboring countries and entire river catchments (see Figure 1), the reference dataset (ECA&D) has sparse station coverage within the domain, with limited data availability of stations outside of Germany, except for the Netherlands. In addition, datasets like HYRAS, RADOLAN, and RADKLIM are restricted to Germany, further limiting the scope of the study. Nevertheless, even the evaluation of the datasets only within Germany contributes to the understanding of the overall performance of the datasets.
Another limitation is the temporal resolution of the analysis. This study primarily focuses on the daily characteristics of the datasets, without including sub-daily data. While sub-daily data could provide more detailed insights into precipitation patterns and season-dependent diurnal cycles, the reference dataset (ECA&D) is available only at a daily resolution. Moreover, the HYRAS dataset is also restricted to daily resolution. This limitation prevents a thorough assessment of the datasets' ability to replicate short-term precipitation events or capture diurnal cycles, which could impact the understanding of extreme weather events and higher-resolution variability across the DE06 domain.
Furthermore, this study does not evaluate the selected datasets within hydrological models, which limits conclusions about their direct applicability for hydrological simulations and forecasting. Additionally, the datasets were not used for bias adjustment, meaning their potential role in correcting biases in other applications remains unexplored.
Lastly, the evaluation could be expanded by incorporating additional precipitation datasets. Including more datasets from different sources and with different resolutions could provide a more comprehensive assessment of precipitation variability across data products.
Accurate precipitation data is crucial for hydrological simulations, including water resource management purposes. In this study, we evaluate the characteristics of different, widely used precipitation data products over Germany with a dense precipitation gauge network. We also examine the performance of HRES precipitation as the first order atmospheric driver of experimental ParFlow integrated hydrological model monitoring system (Belleflamme et al., 2023). Finally, we evaluate the suitability of the DE06 data collective datasets for bias adjustment of HRES. It is important to note that we do not provide further explanations for each dataset’s characteristics as this is beyond the scope of the study and reasons may be manifold, such as parameterization schemes and setup of the atmospheric models, retrieval algorithms with the radar and satellite data, etc. The goal is to assess existing datasets as such. Also, the data quality of the ECA&D reference dataset may need to be considered, as the precipitation data from ECA&D is not undergoing a wind correction, hence there might be a typical undercatch of up to 20% precipitation (Richter, 1995; Sevruk, 1985).
Based on the results and as shown in the summary table (Table 1), we conclude first of all that HRES is an appropriate atmospheric forcing dataset for our ParFlow DE06 monitoring system, given the requirements of a central European spatial coverage, near real-time availability, and sub-daily temporal resolution. Without bias adjustment; it seems suitable for water resource simulation, but less suitable for studies focusing on the impacts of extreme precipitation events.
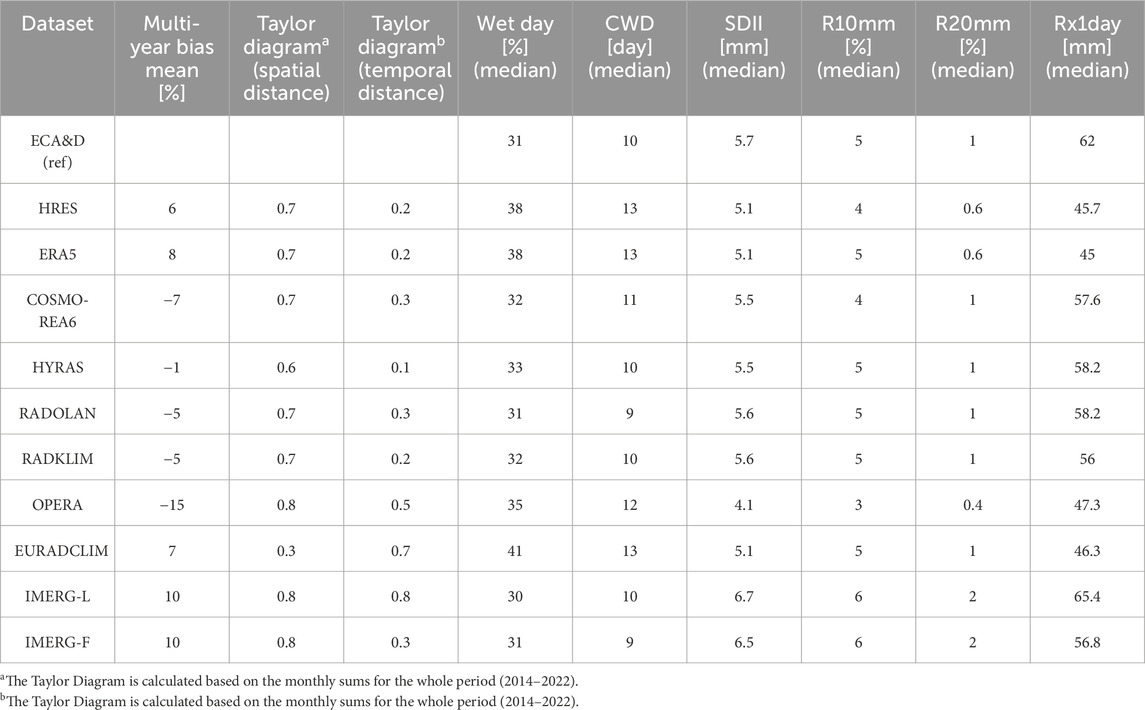
Table 1. Summary table of the evaluation of HRES and the other datasets for the period 2014 to 2022, including the spatial and temporal performance of the datasets and the precipitation indices.
IMERG-L and OPERA would also fulfill the aforementioned requirements and might be combined in a hindcast atmospheric forcing dataset, albeit the biases with respect to ECA&D are considered too large. If a bias adjustment is to be derived without the need for a real-time capability, then COSMO-REA6 (and potentially its successor) would be a promising choice. IMERG-F and EURADCLIM may also be used, but do not clearly outperform HRES yet. However, upcoming updates are expected to further improve data fidelity.
For a model domain strictly limited to Germany, RADOLAN presents a viable option for near real-time applications, while HYRAS (if sub-daily resolution is not required) and RADKLIM seem at this point in time very suitable choices for non-real-time cases. Therefore, in a follow-up study, we plan to use one of them with the machine-learning-based bias adjustment method of Patakchi Yousefi and Kollet (2023) to derive a correction over Germany. The adjustment learned by the method over Germany could be propagated to the neighboring regions to reach a full coverage of DE06 for the bias adjustment.
Overall, the results of this study emphasize the critical importance of selecting the most appropriate precipitation datasets, whether as a primary driver or for bias adjustment of the first-order precipitation input in hydrological models, in this case ParFlow DE06. Given that no single dataset outperforms all others in every aspect, the findings provide guidance for choosing the best datasets tailored to specific applications. Additionally, our study highlights the need for further collaboration on improving precipitation datasets and their integration into real-time water resource management systems. By leveraging high-quality datasets and the latest bias adjustment methods, the accuracy of hydrological forecasts could be improved, empowering potential stakeholders such as water managers to make more informed decisions. This, in turn, supports better water management and the development of sustainable water use practices, especially in the face of changing climatic conditions with water safety and security concerns.
The data analyzed in this study is subject to the following licenses/restrictions: The raw data supporting the conclusions of this article will be made available by the authors, without undue reservation. Requests to access these datasets should be directed to cy5oYW1tb3VkZWhAZnotanVlbGljaC5kZQ==.
SH: Conceptualization, Data curation, Formal Analysis, Methodology, Visualization, Writing–original draft, Writing–review & editing, Software. KG: Conceptualization, Data curation, Formal Analysis, Funding acquisition, Methodology, Visualization, Writing–review & editing, Project administration, Supervision. AB: Conceptualization, Data curation, Formal Analysis, Methodology, Visualization, Writing–review & editing, Software. JG: Writing–review & editing, Methodology. ST: Writing–review & editing, Methodology. SK: Writing–review & editing, Methodology.
The author(s) declare that financial support was received for the research and/or publication of this article. We acknowledge funding from BMBF BioökonomieREVIER funding scheme with its “BioRevierPlus” project (funding ID: 031B1137D/031B1137DX). Additionally, this study was supported by funds of the Impulse and Networking Fund of the Helmholtz Association of German Research Centres for the project ADAPTER (funding reference: WT-0104), and by funds from the Deutsche Forschungsgemeinschaft (DFG, German Research Foundation) – SFB 1502/1–2022 - Projektnummer: 450058266. Furthermore, we gratefully acknowledge the Earth System Modelling Project (ESM) for supporting this study by providing computing time on the ESM partition of the supercomputer JUWELS at Jülich Supercomputing Centre (JSC).
We thank the ECMWF for providing access to their weather forecast data we use to drive the ParFlow DE06 simulation experiment. The authors would also like to gratefully acknowledge the datasets provided by their respective institutions, as listed in Supplementary Table S1.
The authors declare that the research was conducted in the absence of any commercial or financial relationships that could be construed as a potential conflict of interest.
The author(s) declare that Generative AI was used in the creation of this manuscript. We acknowledge the use of OpenAI's ChatGPT versions 4 as an assistive language tool in the review of the final manuscript.
All claims expressed in this article are solely those of the authors and do not necessarily represent those of their affiliated organizations, or those of the publisher, the editors and the reviewers. Any product that may be evaluated in this article, or claim that may be made by its manufacturer, is not guaranteed or endorsed by the publisher.
The Supplementary Material for this article can be found online at: https://www.frontiersin.org/articles/10.3389/feart.2025.1548557/full#supplementary-material
AMSL, Above Mean Sea Level; COSMO, Consortium for Small-Scale Modelling; CRMSE, Centered Root Mean Squared Error; CWD, Consecutive Wet Days; DWD, German Weather Service; ECA&D, European Climate Assessment and Dataset; ECMWF, European Centre for Medium-Range Weather Forecasts; ETCCDI, Joint Expert Team on Climate Change Detection and Indices; EURADCLIM, European RADar CLIMatology; HRES, High Resolution; IFS, Integrated Forecasting System; IMERG, Integrated Multi-satellite Retrievals for Global Precipitation Measurement; IMERG-F, IMERG FINAL; IMERG-L, IMERG LATE; K-S, Kolmogorov-Smirnov; KNMI, Royal Netherlands Meteorological Institute; NWP, Numerical Weather Prediction Model; OPERA, Operational Program for the Exchange of Weather Radar Information; RADKLIM, Radarklimatologie; RADOLAN, Radar Online Adjustment; SDII, Simple Daily Intensity Index; Reanalysis v5, ERA5; STD, Standard Deviation.
Alfieri, L., Avanzi, F., Delogu, F., Gabellani, S., Bruno, G., Campo, L., et al. (2022). High resolution satellite products improve hydrological modeling in northern Italy. Hydrol. Earth Syst. Sci. Discuss. 26, 3921–3939. doi:10.5194/hess-26-3921-2022
Alfieri, L., Burek, P., Dutra, E., Krzeminski, B., Muraro, D., Thielen, J., et al. (2013). GloFAS–global ensemble streamflow forecasting and flood early warning. Hydrol. Earth Syst. Sci. 17 (3), 1161–1175. doi:10.5194/hess-17-1161-2013
Araghi, A., Jaghargh, M. R., Maghrebi, M., Martinez, C. J., Fraisse, C. W., Olesen, J. E., et al. (2021). Investigation of satellite-related precipitation products for modeling of rainfed wheat production systems. Agric. Water Manag. 258, 107222. doi:10.1016/j.agwat.2021.107222
Auerswald, K., Fischer, F. K., Winterrath, T., and Brandhuber, R. (2019). Rain erosivity map for Germany derived from contiguous radar rain data. Hydrol. Earth Syst. Sci. 23 (4), 1819–1832. doi:10.5194/hess-23-1819-2019
Baldauf, M., Seifert, A., Förstner, J., Majewski, D., Raschendorfer, M., and Reinhardt, T. (2011). Operational convective-scale numerical weather prediction with the COSMO model: description and sensitivities. Mon. Weather Rev. 139 (12), 3887–3905. doi:10.1175/MWR-D-10-05013.1
Ban, N., Caillaud, C., Coppola, E., Pichelli, E., Sobolowski, S., Adinolfi, M., et al. (2021). The first multi-model ensemble of regional climate simulations at kilometer-scale resolution, part I: evaluation of precipitation. Clim. Dyn. 57, 275–302. doi:10.1007/s00382-021-05708-w
Bandhauer, M., Isotta, F., Lakatos, M., Lussana, C., Båserud, L., Izsák, B., et al. (2022). Evaluation of daily precipitation analyses in E-OBS (v19. 0e) and ERA5 by comparison to regional high-resolution datasets in European regions. Int. J. Climatol. 42 (2), 727–747. doi:10.1002/joc.7269
Bauer, P., Thorpe, A., and Brunet, G. (2015). The quiet revolution of numerical weather prediction. Nat 525 (7567), 47–55. doi:10.1038/nature14956
Beck, H. E., Vergopolan, N., Pan, M., Levizzani, V., Van Dijk, A. I., Weedon, G. P., et al. (2017). Global-scale evaluation of 22 precipitation datasets using gauge observations and hydrological modeling. Hydrol. Earth Syst. Sci. 21 (12), 6201–6217. doi:10.5194/hess-21-6201-2017
Belleflamme, A., Goergen, K., Wagner, N., Kollet, S., Bathiany, S., El Zohbi, J., et al. (2023). Hydrological forecasting at impact scale: the integrated ParFlow hydrological model at 0.6 km for climate resilient water resource management over Germany. Front. Water 5, 1183642. doi:10.3389/frwa.2023.1183642
Bengtsson, L., Andrae, U., Aspelien, T., Batrak, Y., Calvo, J., de Rooy, W., et al. (2017). The HARMONIE–AROME model configuration in the ALADIN–HIRLAM NWP system. Mon. Weather Rev. 145 (5), 1919–1935. doi:10.1175/MWR-D-16-0417.1
Bogerd, L., Overeem, A., Leijnse, H., and Uijlenhoet, R. (2021). A comprehensive five-year evaluation of IMERG late run precipitation estimates over The Netherlands. J. Hydrometeorol. 22 (7), 1855–1868. doi:10.1175/JHM-D-21-0002.1
Bollmeyer, C., Keller, J. D., Ohlwein, C., Wahl, S., Crewell, S., Friederichs, P., et al. (2015). Towards a high-resolution regional reanalysis for the European CORDEX domain. Q. J. R. Meteorol. Soc. 141 (686), 1–15. doi:10.1002/qj.2486
Cane, D., Ghigo, S., Rabuffetti, D., and Milelli, M. (2013). Real-time flood forecasting coupling different postprocessing techniques of precipitation forecast ensembles with a distributed hydrological model. The case study of may 2008 flood in western Piemonte, Italy. Nat. Hazards Earth Syst. Sci. Discuss. 13 (2), 211–220. doi:10.5194/nhess-13-211-2013
Caretta, M., Mukherji, A., Arfanuzzaman, M., Betts, A., Gelfan, A., Hirabayashi, Y., et al. (2022). “Water,” in Climate change 2022: impacts, adaptation, and Vulnerability. Contribution of working Group II to the Sixth assessment report of the Intergovernmental Panel on climate change. doi:10.1017/9781009325844.006
Chevuturi, A., Tanguy, M., Facer-Childs, K., Martínez-de la Torre, A., Sarkar, S., Thober, S., et al. (2023). Improving global hydrological simulations through bias-correction and multi-model blending. J. Hydrol. 621, 129607. doi:10.1016/j.jhydrol.2023.129607
Dai, A. (2006). Precipitation characteristics in eighteen coupled climate models. J. Clim. 19 (18), 4605–4630. doi:10.1175/JCLI3884.1
Dai, A., Lin, X., and Hsu, K. L. (2007). The frequency, intensity, and diurnal cycle of precipitation in surface and satellite observations over low-and mid-latitudes. Clim. Dyn. 29, 727–744. doi:10.1007/s00382-007-0260-y
Davies, T., Cullen, M. J., Malcolm, A. J., Mawson, M. H., Staniforth, A., White, A. A., et al. (2005). A new dynamical core for the Met Office's global and regional modelling of the atmosphere. Q. J. R. Meteorol. 131 (608), 1759–1782. doi:10.1256/qj.04.101
Dembélé, M., Schaefli, B., Van De Giesen, N., and Mariéthoz, G. (2020). Suitability of 17 rainfall and temperature gridded datasets for largescale hydrological modelling in West Africa. Hydrol. Earth Syst. Sci. Discuss., 1–39. doi:10.5194/hess-24-5379-2020
Deutsche Wetterdienst (DWD) (2016). Starkniederschläge in Deutschland. Deutschland: Offenbach am Main. Available online at: https://www.dwd.de/DE/leistungen/klimareports/download_einleger_report_2016.pdf?__blob=publicationFile&v=1 (Accessed September 18, 2024).
Deutsche Wetterdienst (DWD) (2020). Climate data center Newsletter, issue 11. Available online at: https://www.dwd.de/DE/klimaumwelt/cdc/newsletter_archiv/cdc_newsletter_11.pdf?__blob=publicationFile&v=4 (Accessed August 03, 2024).
Eischeid, K., Bruce Baker, C., Karl, R., and Diaz, F. (1995). The quality control of long-term climatological data using objective data analysis. J. Appl. Meteoro. Clim. 34 (12), 2787–2795. doi:10.1175/1520-0450(1995)034<2787:TQCOLT>2.0.CO;2
Foelsche, U., Kirchengast, G., Fuchsberger, J., Tan, J., and Petersen, W. (2017). Evaluation of GPM IMERG Early, Late, and Final rainfall estimates using WegenerNet gauge data in southeastern Austria. Hydrol. Earth Syst. Sci. 21 (12), 6559–6572. doi:10.5194/hess-21-6559-2017
Forbes, R., Haiden, T., and Magnusson, L. (2015). Improvements in IFS forecasts of heavy precipitation. ECMWF Newsl. 144, 21–26. doi:10.21957/jxtonky0
Fuentes-Barrios, A., and Sierra-Lorenzo, M. (2021). Bias correction method based on artificial neural networks for quantitative precipitation forecast. Environ. Sci. Proc. 8 (1), 38. doi:10.3390/ecas2021-10356
Hersbach, H., Bell, B., Berrisford, P., Hirahara, S., Horányi, A., Muñoz-Sabater, J., et al. (2020). The ERA5 global reanalysis. Q. J. R. Meteorol. Soc. 146 (730), 1999–2049. doi:10.1002/qj.3803
Hinge, G., Hamouda, M. A., Long, D., and Mohamed, M. M. (2022). Hydrologic utility of satellite precipitation products in flood prediction: a meta-data analysis and lessons learnt. J. Hydrol. 612, 128103. doi:10.1016/j.jhydrol.2022.128103
Huang, Y., Bárdossy, A., and Zhang, K. (2019). Sensitivity of hydrological models to temporal and spatial resolutions of rainfall data. Hydrol. Earth Syst. Sci. 23 (6), 2647–2663. doi:10.5194/hess-23-2647-2019
Huffman, G. J., Bolvin, D. T., Braithwaite, D., Hsu, K. L., Joyce, R. J., Kidd, C., et al. (2020). Integrated multi-satellite retrievals for the global precipitation measurement (GPM) mission (IMERG). Adv. Clim. Change Res. 67, 343–353. doi:10.1007/978-3-030-24568-9_19
Huffman, G. J., Bolvin, D. T., Joyce, R., Kelley, O. A., Nelkin, E. J., Tan, J., et al. (2023). Integrated multi-satellitE retrievals for GPM (IMERG) Technical Documentation. Available online at: https://gpm.nasa.gov/sites/default/files/2023-07/IMERG_TechnicalDocumentation_final_230713.pdf (Accessed September 17, 2024).
Huntington, T. G. (2006). Evidence for intensification of the global water cycle: review and synthesis. J. Hydrol. 319 (1-4), 83–95. doi:10.1016/j.jhydrol.2005.07.003
Jabbari, A., and Bae, D. H. (2018). Application of Artificial Neural Networks for accuracy enhancements of real-time flood forecasting in the Imjin basin. Water 10 (11), 1626. doi:10.3390/w10111626
Kahlenborn, W., Porst, L., Voss, M., Fritsch, U., Renner, K., Zebisch, M., et al. (2021). “Climate impact and risk assessment 2021 for Germany. Summary,”. Umweltbundesamt, Dessau-Roßlau: No. UBA-FB--000574/KURZ, ENG. Available online at: https://www.umweltbundesamt.de/sites/default/files/medien/479/publikationen/cc_27-2021_climate_impact_and_risk_assessment_2021_for_germany_english_summary_bf.pdf (Accessed September 15, 2024).
Keller, A. A., Garner, K., Rao, N., Knipping, E., and Thomas, J. (2023). Hydrological models for climate-based assessments at the watershed scale: a critical review of existing hydrologic and water quality models. Sci. Total Environ. 867, 161209. doi:10.1016/j.scitotenv.2022.161209
Kidd, C., Bauer, P., Turk, J., Huffman, G. J., Joyce, R., Hsu, K. L., et al. (2012). Intercomparison of high-resolution precipitation products over northwest Europe. J. Hydrometeorol. 13 (1), 67–83. doi:10.1175/JHM-D-11-042.1
Klein Tank, A. M., Wijngaard, J. B., and Können, G. P. (2003). Daily dataset of 20th-century surface air temperature and precipitation series for the European Climate Assessment. Int. J. Climatol. 22 (12), 1441–1453. doi:10.1002/joc.773
Kollet, S. J., and Maxwell, R. M. (2006). Integrated surface-groundwater flow modeling: a free-surface overland flow boundary condition in a parallel groundwater flow model. Adv. Water Resour. 29 (7), 945–958. doi:10.1016/j.advwatres.2005.08.006
Kreklow, J., Tetzlaff, B., Burkhard, B., and Kuhnt, G. (2020). Radar-based precipitation climatology in Germany—developments, uncertainties and potentials. Atmos 11 (2), 217. doi:10.3390/atmos11020217
Kuffour, B. N. O., Engdahl, N. B., Woodward, C. S., Condon, L. E., Kollet, S., and Maxwell, R. M. (2020). Simulating coupled surface-subsurface flows with ParFlow v3.5.0: capabilities, applications, and ongoing development of an open-source, massively parallel, integrated hydrologic model. Geosci. Model Dev. 13, 1373–1397. doi:10.5194/gmd-13-1373-2020
Kumar, B., Chattopadhyay, R., Singh, M., Chaudhari, N., Kodari, K., and Barve, A. (2021). Deep learning–based downscaling of summer monsoon rainfall data over Indian region. Theor. Appl. Climatol. 143, 1145–1156. doi:10.1007/s00704-020-03489-6
Lavers, D. A., Simmons, A., Vamborg, F., and Rodwell, M. J. (2022). An evaluation of ERA5 precipitation for climate monitoring. Q. J. R. Meteorol. Soc. 148 (748), 3152–3165. doi:10.1002/qj.4351
Li, X., Wu, H., Nanding, N., Chen, S., Hu, Y., and Li, L. (2023). Statistical bias correction of precipitation forecasts based on quantile mapping on the sub-seasonal to seasonal scale. Remote Sens. 15 (7), 1743. doi:10.3390/rs15071743
Liu, Z., Rui, H., Teng, W. L., Chiu, L. S., Leptoukh, G., and Vicente, G. A. (2007). “Online visualization and analysis: a new Avenue to use satellite data for weather, climate, and Interdisciplinary research and applications,” in Measuring precipitation from Space. Advances in global change research. Editors V. Levizzani, P. Bauer, and F. J. Turk (Dordrecht: Springer), 28, 549–558. doi:10.1007/978-1-4020-5835-6_43
Lockhoff, M., Zolina, O., Simmer, C., and Schulz, J. (2019). Representation of precipitation characteristics and extremes in regional reanalyses and satellite-and gauge-based estimates over western and central Europe. J. Hydrometeorol. 20 (6), 1123–1145. doi:10.1175/JHM-D-18-0200.1
Loken, E. D., Clark, A. J., Xue, M., and Kong, F. (2017). Comparison of next-day probabilistic severe weather forecasts from coarse-and fine-resolution CAMs and a convection-allowing ensemble. Weather Forecast 32 (4), 1403–1421. doi:10.1175/WAF-D-16-0200.1
Maraun, D. (2016). Bias correcting climate change simulations - a critical review. Curr. Clim. Change Rep. 2, 211–220. doi:10.1007/s40641-016-0050-x
Maxwell, R. M., Kollet, S. J., Smith, S. G., Woodward, C. S., Falgout, R. D., and Ferguson, I. M. (2016). ParFlow User’s manual. Integrated ground water modeling center report GWMI. Available online at: https://parflow.readthedocs.io/en/latest/(Accessed September 18, 2024).
McCullum, A. J. K., McClellan, C., Dauert, B., J. Huntington, J., Green, R., Ly, V., et al. (2021). Satellite-based drought reporting on the Navajo nation. J. Am. Water Resour. Assoc., 1–17. doi:10.1111/1752-1688.12909
Müller Schmied, H., Cáceres, D., Eisner, S., Flörke, M., Herbert, C., Niemann, C., et al. (2021). The global water resources and use model WaterGAP v2.2d: model description and evaluation. Geosci. Model Dev. 14 (2), 1037–1079. doi:10.5194/gmd-14-1037-2021
Navarro, A., García-Ortega, E., Merino, A., Sánchez, J. L., Kummerow, C., and Tapiador, F. J. (2019). Assessment of IMERG precipitation estimates over Europe. Remote Sens. 11, 2470. doi:10.3390/rs11212470
Overeem, A., Leijnse, H., van der Schrier, G., van den Besselaar, E., Garcia-Marti, I., and de Vos, L. W. (2024). Merging with crowdsourced rain gauge data improves pan-European radar precipitation estimates. Hydrol. Earth Syst. Sci. 28 (3), 649–668. doi:10.5194/hess-28-649-2024
Overeem, A., van den Besselaar, E., van der Schrier, G., Meirink, J. F., van der Plas, E., and Leijnse, H. (2023). EURADCLIM: the European climatological high-resolution gauge-adjusted radar precipitation dataset. Earth Syst. Sci. Data 15 (3), 1441–1464. doi:10.5194/essd-15-1441-2023
Park, S., Berenguer, M., and Sempere-Torres, D. (2019). Long-term analysis of gauge-adjusted radar rainfall accumulations at European scale. J. Hydrol. 573, 768–777. doi:10.1016/j.jhydrol.2019.03.093
Patakchi Yousefi, K., Belleflamme, A., Goergen, K., and Kollet, S. (2024). Impact of deep learning-driven precipitation corrected data using near real-time satellite-based observations and model forecast in an integrated hydrological model. Front. Water 6, 1439906. doi:10.3389/frwa.2024.1439906
Patakchi Yousefi, K., and Kollet, S. (2023). Deep learning of model-and reanalysis-based precipitation and pressure mismatches over Europe. Front. Water 5, 1178114. doi:10.3389/frwa.2023.1178114
Peterson, T. C. (2005). Climate change indices. World Meteorol. Organ. Bull. 54 (2), 83. Available online at: https://library.wmo.int/idurl/4/58605 (Accessed September 14, 2024).
Pham, T. V., Steger, C., Rockel, B., Keuler, K., Kirchner, I., Mertens, M., et al. (2021). ICON in Climate Limited-area Mode (ICON release version 2.6. 1): a new regional climate model. Geosci. Model Dev. 14 (2), 985–1005. doi:10.5194/gmd-14-985-2021
Pourmokhtarian, A., Driscoll, C. T., Campbell, J. L., Hayhoe, K., and Stoner, A. M. K. (2016). The effects of climate downscaling technique and observational data set on modeled ecological responses. Ecol. Appl. 26, 1321–1337. doi:10.1890/15-0745
Pradhan, R. K., Markonis, Y., Vargas Godoy, M. R., Villalba-Pradas, A., Andreadis, K. M., Nikolopoulos, E. I., et al. (2022). Review of GPM IMERG performance: a global perspective. Remote Sens. Environ. 268, 112754. doi:10.1016/j.rse.2021.112754
Ramsauer, T., Weiß, T., and Marzahn, P. (2018). Comparison of the GPM IMERG final precipitation product to RADOLAN weather radar data over the topographically and climatically diverse Germany. Remote Sens. 10 (12), 2029. doi:10.3390/rs10122029
Rauthe, M., Steiner, H., Riediger, U., Mazurkiewicz, A., and Gratzki, A. (2013). A Central European precipitation climatology–Part I: Generation and validation of a high-resolution gridded daily data set (HYRAS). Meteorol. Z 22 (3), 235–256. doi:10.1127/0941-2948/2013/0436
Richter, D. (1995). Ergebnisse methodischer Untersuchungen zur Korrektur des systematischen Messfehlers des Hellmann-Niederschlagsmessers, in Bericht des Deutschen Wetterdienstes. Dtsch. Wetterd. 194. Available online at: https://dwdbib.dwd.de/retrosammlung/content/titleinfo/38928 (Accessed September 17, 2024).
Rodwell, M. J., Haiden, T., and Richardson, D. S. (2011). Developments in precipitation verification. ECMWF Newsl. 128, 12–16. doi:10.21957/x49qpn1o
Roulin, E., and Vannitsem, S. (2012). Postprocessing of ensemble precipitation predictions with extended logistic regression based on hindcasts. Mon. Weather Rev. 140 (3), 874–888. doi:10.1175/MWR-D-11-00062.1
Royal Netherlands Meteorological Institute (KNMI) (2021). Algorithm theoretical basis document version 7 (ATBD). Available online at: https://knmi-ecad-assets-prd.s3.amazonaws.com/documents/atbd.pdf (Accessed March 13, 2024).
Saltikoff, E., Haase, G., Delobbe, L., Gaussiat, N., Martet, M., Idziorek, D., et al. (2019). OPERA the radar project. Atmosphere 10 (6), 320. doi:10.3390/atmos10060320
Schättler, U., Doms, G., and Schraff, C. (2021). A description of the nonhydrostatic regional COSMO-Model. Part VII user’s guide. doi:10.5676/DWD_pub/nwv/cosmo-doc_6.00_VII
Schauwecker, S., Schwarb, M., Rohrer, M., and Stoffel, M. (2021). Heavy precipitation forecasts over Switzerland–an evaluation of bias-corrected ECMWF predictions. Weather Clim. Extrem. 34, 100372. doi:10.1016/j.wace.2021.100372
Seity, Y., Brousseau, P., Malardel, S., Hello, G., Bénard, P., Bouttier, F., et al. (2011). The AROME-France convective-scale operational model. Mon. Weather Rev. 139 (3), 976–991. doi:10.1175/2010MWR3425.1
Sevruk, B. (1985). Systematischer Niederschlagsmessfehler in der Schweiz, in: Der Niederschlag in der Schweiz. Bericht der Arbeitsgruppe «Niederschlag» der Hydrologischen Kommission der Schweizerischen Naturforschenden Gesellschaft (SNG). Bundesamt für Wasser Geol. Bern, Switzerl. 31, 65–75. Available online at: https://geo.scnat.ch/en/publications/uuid/i/80543902-2bfd-5095-8ea4-5fed7750d1dc-Der_Niederschlag_in_der_Schweiz (Accessed September 17, 2024).
Sokol, Z., Szturc, J., Orellana-Alvear, J., Popova, J., Jurczyk, A., and Célleri, R. (2021). The role of weather radar in rainfall estimation and its application in meteorological and hydrological modelling—a review. A Rev. Remote Sens. 13 (3), 351. doi:10.3390/rs13030351
Strandberg, G., and Lind, P. (2021). The importance of horizontal model resolution on simulated precipitation in Europe–from global to regional models. Weather Clim. Dyn. 2 (1), 181–204. doi:10.5194/wcd-2-181-2021
Taylor, K. E. (2001). Summarizing multiple aspects of model performance in a single diagram. J. Geophys. Res. Atmos. 106 (D7), 7183–7192. doi:10.1029/2000JD900719
Tian, Y., Peters-Lidard, C. D., and Eylander, J. B. (2010). Real-time bias reduction for satellite-based precipitation estimates. J. Hydrometeorol. 11 (6), 1275–1285. doi:10.1175/2010JHM1246.1
Trnka, M., Hlavinka, P., Mozny, M., Semeradova, D., Stepanek, P., Balek, J., et al. (2020). Czech Drought Monitor System for monitoring and forecasting of agricultural drought and drought impacts. Int. J. Climatol. 40, 5941–5958. doi:10.1002/joc.6557
Umweltbundesamt (UBA) (2019). Monitoring report 2019: Ton the German Strategy for adaptation to climate change. Available online at: https://www.umweltbundesamt.de/sites/default/files/medien/421/publikationen/das_2019_monitoring_report_bf.pdf (Accessed September 14, 2024).
Van Den Besselaar, E. J., Tank, A. M. K., Van Der Schrier, G., Abass, M. S., Baddour, O., Van Engelen, A. F., et al. (2015). International climate assessmentanddataset: climate services across borders. Bull. Am. Meteorol. Soc. 96 (1), 16–21. doi:10.1175/BAMS-D-13-00249.1
Varga, Á. J., and Breuer, H. (2020). Sensitivity of simulated temperature, precipitation, and global radiation to different WRF configurations over the Carpathian Basin for regional climate applications. Clim. Dyn. 55 (9), 2849–2866. doi:10.1007/s00382-020-05416-x
Vergara-Temprado, J., Ban, N., Panosetti, D., Schlemmer, L., and Schär, C. (2020). Climate models permit convection at much coarser resolutions than previously considered. J. Clim. 33 (5), 1915–1933. doi:10.1175/JCLI-D-19-0286.1
Wahl, S., Bollmeyer, C., Crewell, S., Figura, C., Friederichs, P., Hense, A., et al. (2017). A novel convective-scale regional reanalysis COSMO-REA2: improving the representation of precipitation. Meteorol. Z 26 (4), 345–361. doi:10.1127/metz/2017/0824
Weigl, E. (2017). RADOLAN: radar Online Adjustment, Radar based quantitative precipitation estimation products. Available online at: https://www.dwd.de/DE/leistungen/radolan/radolan_info/radolan_poster_201711_en_pdf.pdf?__blob=publicationFile&v=2 (Accessed March 13, 2024).
Werner, M., Schellekens, J., Gijsbers, P., van Dijk, M., van den Akker, O., and Heynert, K. (2013). The Delft-FEWS flow forecasting system. Environ. Model. Softw. 40, 65–77. doi:10.1016/j.envsoft.2012.07.010
Winterrath, T., Brendel, C., Hafer, M., Junghänel, T., Klameth, A., Walawender, E., et al. (2017). Erstellung einer radargestützten Niederschlagsklimatologie, Berichte des Deutschen Wetterdienstes 251, Deutscher Wetterdienst, Offenbach am Main. Available online at: https://opendata.dwd.de/climate_environment/GPCC/radarklimatologie/Dokumente/Endbericht_Radarklimatologie_final.pdf (Accessed March 13, 2024).
Wu, H., Adler, R. F., Tian, Y., Gu, G., and Huffman, G. J. (2017). Evaluation of quantitative precipitation estimations through hydrological modeling in IFloodS river basins. J. Hydrometeorol. 18 (2), 529–553. doi:10.1175/JHM-D-15-0149.1
Zängl, G., Reinert, D., Rípodas, P., and Baldauf, M. (2015). The ICON (ICOsahedral Non-hydrostatic) modelling framework of DWD and MPI-M: description of the non-hydrostatic dynamical core. Q. J. R. Meteorol. Soc. 141 (687), 563–579. doi:10.1002/qj.2378
Zappa, M., Bernhard, L., Spirig, C., Pfaundler, M., Stahl, K., Kruse, S., et al. (2014). A prototype platform for water resources monitoring and early recognition of critical droughts in Switzerland. Proc. Int. Assoc. Hydrol. Sci. 364, 492–498. doi:10.5194/piahs-364-492-2014
Zhong, R., Chen, X., Lai, C., Wang, Z., Lian, Y., Yu, H., et al. (2019). Drought monitoring utility of satellite-based precipitation products across mainland China. J. Hydrol. 568, 343–359. doi:10.1016/j.jhydrol.2018.10.072
Keywords: precipitation dataset evaluation, bias adjustment, Germany, daily temporal resolution, extreme precipitation, hydrological modeling and forecasting
Citation: Hammoudeh S, Goergen K, Belleflamme A, Giles JA, Trömel S and Kollet S (2025) Evaluating precipitation products for water resources hydrologic modeling over Germany. Front. Earth Sci. 13:1548557. doi: 10.3389/feart.2025.1548557
Received: 19 December 2024; Accepted: 19 March 2025;
Published: 01 April 2025.
Edited by:
Shailesh Kumar Singh, National Institute of Water and Atmospheric Research (NIWA), New ZealandReviewed by:
Guy Jean-Pierre Schumann, University of Bristol, United KingdomCopyright © 2025 Hammoudeh, Goergen, Belleflamme, Giles, Trömel and Kollet. This is an open-access article distributed under the terms of the Creative Commons Attribution License (CC BY). The use, distribution or reproduction in other forums is permitted, provided the original author(s) and the copyright owner(s) are credited and that the original publication in this journal is cited, in accordance with accepted academic practice. No use, distribution or reproduction is permitted which does not comply with these terms.
*Correspondence: S. Hammoudeh, cy5oYW1tb3VkZWhAZnotanVlbGljaC5kZQ==
Disclaimer: All claims expressed in this article are solely those of the authors and do not necessarily represent those of their affiliated organizations, or those of the publisher, the editors and the reviewers. Any product that may be evaluated in this article or claim that may be made by its manufacturer is not guaranteed or endorsed by the publisher.
Research integrity at Frontiers
Learn more about the work of our research integrity team to safeguard the quality of each article we publish.