 Ying Kang1
 Jingjing Liu
 Qin Liu
94% of researchers rate our articles as excellent or good
Learn more about the work of our research integrity team to safeguard the quality of each article we publish.
Find out more
ORIGINAL RESEARCH article
Front. Earth Sci., 31 March 2025
Sec. Geoinformatics
Volume 13 - 2025 | https://doi.org/10.3389/feart.2025.1542985
Urbanisation has led to drastic changes in urban landscape patterns, which, in turn, have altered urban hydrological processes and surface runoff, causing urban waterlogging and significantly affecting water supply. Thus, identifying the characteristics of urban landscape patterns and re-vealing how they impact surface runoff can provide a scientific basis for landscape optimisation and regulation, promoting urban ecological security and sustainable development. This study constructs a Source-Sink Runoff Landscape Index (SSRLI), and it utilises the Storm Water Management Model (SWMM) to simulate the spatial distribution characteristics of surface runoff in the central urban area of Chengdu under different rainfall scenarios, exploring the relationship between landscape patterns and surface runoff. The results indicate: ① In 2022, the landscape types in the central urban area of Chengdu were mainly farmland, forestland, and impervious surfaces, accounting for 83.27% of the total study area. ② As rainfall intensity increased, the average rainfall-runoff conversion rate increased from 0.263 to 0.599. The impact of urban green spaces on surface runoff exhibited nonlinear characteristics. When the proportion of green spaces reached 32.5%, their effectiveness in reducing surface runoff improved significantly. ③ When the proportion of urban green spaces was less than 20%, it positively correlated with runoff depth; above 20%, the correlation became negative, especially after 40%, where rainfall had a lesser impact. When the proportions of farmland and forestland were low, their effectiveness in reducing runoff decreased with increasing rainfall intensity. Similarly, the impact of impervious surfaces also diminished with increasing rainfall intensity. ④ The SSRLI demonstrated good applicability in predicting changes in surface runoff, showing a significant positive correlation with runoff depth. This correlation gradually weakened as rainfall intensity increased. In summary, this study provides insights into the intricate relationship between urban landscape patterns and surface runoff, emphasizing the importance of green spaces in mitigating urban flooding and promoting sustainable urban development.
Global warming has accelerated evaporation on ocean and land surfaces, intensifying the water cycle and increasing the frequency of extreme precipitation events (IPCC, 2013; Alexander et al., 2010). At the same time, the rapidity of urbanization has intensified the changes in urban landscapes. In particular, significant occupation of high-permeability surfaces such as lakes, green spaces, and farmlands has led to a notable decline in the water conservation function of ecosystems and surface permeability, causing a sharp increase in surface runoff during heavy rainfalls and thereby contributing to the increased frequency and scale of urban waterlogging (Bautista et al., 2007; Christopher et al., 2018). Over the past two decades, global urban waterlogging incidents have increased by approximately 2.4 times, affecting approximately 1.65 million people annually with losses of life or property, posing significant challenges to urban health and sustainable development (Meng et al., 2025; Ahmed et al., 2018). In this context, how to regulate surface runoff by optimizing urban landscape patterns has become a key issue in sustainable urban management.
Urban surface runoff is closely related to waterlogging. Currently, models such as SWAT (Soil and Water Assessment Tool), SWMM (Storm Water Management Model), MIKE SHE (Systeme Hydrologique Européen), and InfoWorks are commonly used for simulating and analyzing surface runoff. For example, SWMM, with its high spatial resolution, open-source flexibility, and detailed characterization of urban drainage systems, is widely used for dynamic simulation of runoff at the urban and community scales (Gu et al., 2022; Gironás et al., 2010; Jang et al., 2007). Randall et al. applied the SWMM model to planning and managing sponge cities (Randall et al., 2019). Chen et al. combined the SWAT model with remote sensing detection of vegetation phenology to improve the process of eco-hydrological modelling (Chen et al., 2023). Ramteke et al. used the MIKE SHE model to assess the impact of climate change on watershed hydrology (Ramteke et al., 2020). Wang et al. applied the InfoWorks ICM (integrated catchment modelling) to analyse the spatial variability of multi-scale urban waterlogging disasters (Wang et al., 2022). However, most existing studies focus on the calibration of individual model parameters or the evaluation of the effectiveness of engineering measures, and the analysis of the coupling mechanisms between landscape patterns and hydrological processes is still insufficient. Although traditional models can depict the impact of the physical properties of the underlying surface (such as permeability and slope), they struggle to quantify the nonlinear effects of landscape spatial configuration (such as patch connectivity and source-sink relationships) on runoff. This leads to limited simulation accuracy under different rainfall scenarios and restricts the specificity of landscape optimization strategies (Hernández-Sosa et al., 2025; Kang and Yue, 2016).
In the practice of runoff control, permeable pavement and bioretention cells, which are types of low-impact development (LID) facilities, have been proven to be effective in intercepting rainwater (Burns et al., 2012; Ahiablame and Shakya, 2016). However, recent studies have found that the effectiveness of LID facilities is limited by their discrete layout and limited storage capacity, and they are prone to functional saturation during extreme rainfall events (Dadrasajirlou et al., 2023; Chen et al., 2021). Therefore, scholars have begun to focus on the overall optimization of landscape patterns. Yu et al. believe that constructing a ‘high-low-high’ impervious surface connectivity layout can reduce the impact of urban development on surface runoff (Yu H. et al., 2019). Zhang et al. and Yang et al. found a significant correlation between the green space landscape pat-tern and surface runoff and that the clustering pattern of green spaces reduces runoff (Zhang et al., 2015; Yang et al., 2023). Despite this, existing landscape indices (such as aggregation and fragmentation) are primarily designed from an ecological perspective, lacking a spatially explicit representation of hydrolofical source-sink processes, making it difficult to reveal the mechanisms of water exchange between landscape units (Chen et al., 2006; Wang L. et al., 2023). Furthermore, most studies focus only on specific return period rainfall events and have not systematically assessed the differences in runoff responses of landscape patterns under varying rainfall intensities, which limits the climate adaptability of control strategies.
To address the aforementioned research gaps, this study initially constructs the Source-Sink Runoff Landscape Index (SSRLI) based on the source-sink landscape theory. By integrating spatial weight factors and runoff surface processes, it overcomes the shortcomings of traditional indices in characterizing the spatial heterogeneity of runoff processes. Subsequently, the SSRLI is coupled with the SWMM model to conduct multi-scenario rainfall simulations in the central urban area of Chengdu, quantitatively analyzing the dynamic impact mechanism of landscape pattern changes on surface runoff. This research aims to enhance the understanding of landscape pattern characteristics and their effects, with the expectation of providing a scientific basis for urban landscape planning and water resource management and regulation.
The study site lies in the central urban area of Chengdu (30°25′—31°00′N, 103°30′—104°30′E), with a total urban area of 3639.81 km2 (including a built-up area of 1063.7 km2), accounting for 25.39% of the total area of Chengdu City. It encompasses 12 administrative districts and 2 economic functional zones (Figure 1). The area has an elevation ranging from 434 to 1048 m, with a slight tilt from northwest to southeast. It belongs to the subtropical humid climate sub-region, with an annual average temperature of approximately 17.3°C and an annual average precipitation of 1124.6 mm, mainly concentrated from June to September. The study area boasts diverse soil types (primarily paddy soil and purple soil), densely covered with a river network and numerous water systems, with a total water resource volume of approximately 9 billion m3.
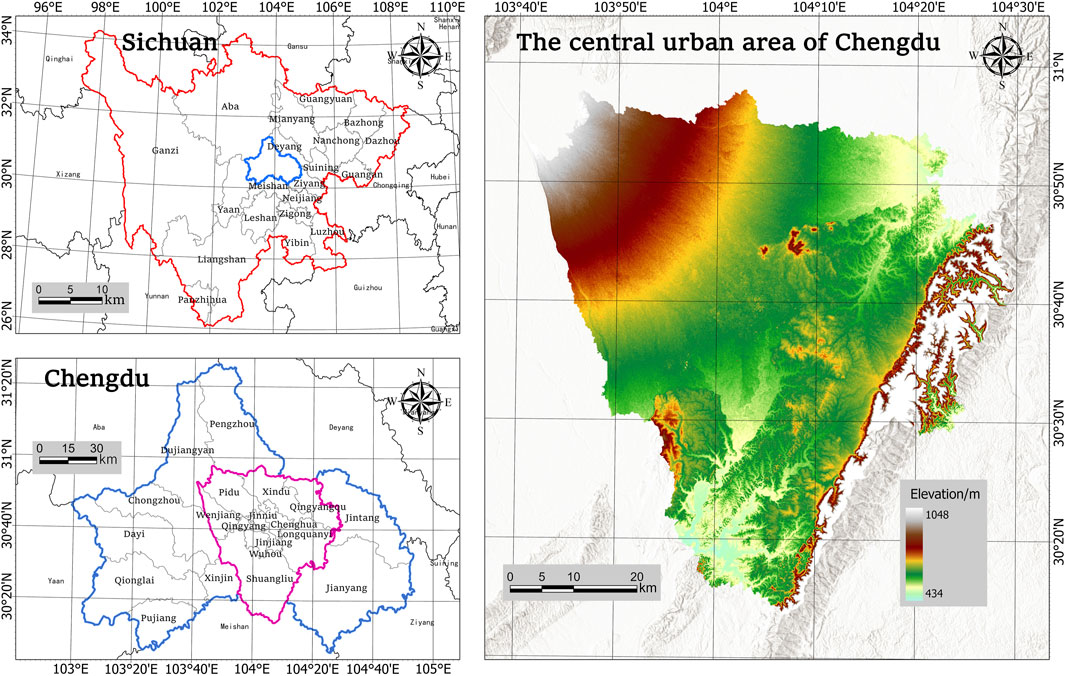
Figure 1. Location map of the study area.
The elevation data originate from the Geospatial Data Cloud (https://www.gscloud.cn/). The spatial resolution is 30 m. The slope of the study area was extracted using spatial analysis tools, and the surface roughness was calculated.
SPOT-5 (Satellite pour L’Observation de la Terre) high-resolution remote sensing images from 2022 were used to extract landscape types, mainly panchromatic band (0.49–0.69 μm, 2.5 m), green band (0.49–0.6 μm, 10 m), red band (0.61–0.68 μm, 10 m), near-infrared band (0.78–0.89 μm, 10 m), and shortwave infrared band (1.58–1.78 μm, 20 m). After preprocessing the images, a deep learning method was adopted to interpret the images and extract six landscape types: urban green space, cultivated land, forest land, impervious surface, bare land, and water area. The accuracy of the interpretation results was verified to be 86.28%, which meets the requirements of this study (Ma et al., 2016; Zhu et al., 2017).
The soil data was sourced from the Harmonized World Soil Database (HWSD) and downloaded from the National Tibetan Plateau Data Centre (http://data.tpdc.ac.cn/). The resolution of the data was 1000 m. Based on soil texture, the soil infiltration capacity in the central urban area of Chengdu was analyzed, and the soil permeability was classified into five categories: strong permeability, relatively strong permeability, medium permeability, slightly permeable, and impermeable.
The NDVI data were calculated using Landsat imagery based on the Google Earth Engine platform, with a resolution of 30 m.
The SWMM is a stormwater and flood management model developed by the United States Environmental Protection Agency. As a dynamic rainfall-runoff simulation model, it is used primarily to simulate urban rainfall events (Li et al., 2023; Liao et al., 2023). This paper utilized the SWMM to simulate the hydrological processes in the central urban area of Chengdu. The simulation was achieved based on sub-catchment areas and primarily involved the runoff generation on the surface. The runoff generation in the sub-catchment area of the SWMM included the runoff from permeable areas, impermeable areas with depression storage, and impermeable areas without depression storage (Zhang et al., 2023).
The sub-catchment area is the smallest hydrological response unit in the model. Based on the distribution of rivers and major drainage networks, the entire study area was divided into 1,160 sub-catchment areas, with 762 generalized pipe sections and 700 catchment nodes. Based on DEM (Digital Elevation Model) and land use information, deterministic parameters (such as sub-catchment area, characteristic width, average slope, and imperviousness ratio) were calculated. Uncertain parameters (such as depression storage for impervious and pervious surfaces) were determined through the SWMM User Manual, existing research, and the actual conditions of the study area (Zhang et al., 2022). The Horton in-filtration method was adopted for calculating rainwater infiltration, and the dynamic wave was selected as the routing model due to its ability to handle complex network configurations and various flow conditions (Chen et al., 2022). For details, see Supplementary Appendix S1.
The revised rainfall intensity formula for the central urban area of Chengdu, provided by the Chengdu Municipal Engineering Design and Research Institute and the Chengdu Meteorological Observatory, was adopted (Equation 1):
where: i is the design rainfall intensity, unit: millimetre per minute (mm/min); P is the return period, unit: year (a); t is the rainfall duration, unit: minute (min).
According to the classification standard of rainfall intensity issued by the China Meteorological Administration (total precipitation in 12 h), five levels of rainfall intensity were selected: moderate rain (5.0–14.9 mm), heavy rain (15.0–29.9 mm), rainstorm (30.0–69.9 mm), torrential rain (70–139.9 mm), and catastrophic rainstorm (≥140 mm). Based on the above criteria, the rainfall duration was set to 720 min, with a time step of 5 min for the rainfall sequence. The peak rainfall coefficient (r) was chosen as 0.4, and the return period was adjusted to ensure the total rainfall reached each designated level. (Considering the rainfall that triggers waterlogging, this paper selected rainfall scenarios starting from moderate rain) Figure 2 shows the rainfall hyetographs for the different scenarios.
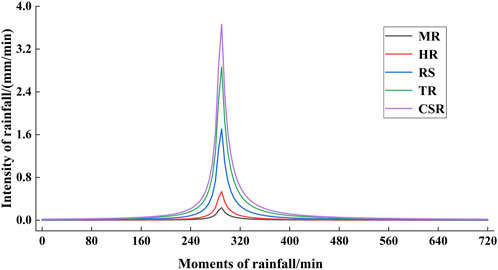
Figure 2. Rainfall process lines of different situations. Notes: MR—Moderate Rain; HR—Heavy Rain; RS—Rainstorm; TR—Torrential Rain; CSR—Catastrophic Rainstorm.
In studying urban hydrological cycle and management, identifying and understanding the functions of ‘source-sink’ landscapes is extremely important for regulating surface runoff. ‘Source’ landscapes, such as impervious surfaces, facilitate the transformation of rainwater into surface runoff; ‘sink’ landscapes, including urban green spaces and woodlands, can obstruct or slow down runoff (Wang and Cheng, 2019). Furthermore, the impact of ecological processes should be incorporated into the stormwater runoff process to assess the influence of ecological environmental factors on runoff dynamics and surface resistance. Based on this, runoff landscape indices for source-sink areas were further proposed, with specific methods as follows.
The sources of initial runoff were typically in areas with high elevation, sparse vegetation, and poor soil permeability, where rainfall could quickly and substantially reach the ground. To study the initial runoff from different landscape units in the central urban area, the elevation, vegetation cover, and soil type were resampled to a 30 m resolution and assigned values based on five grades: 1, 3, 5, 7, and 9. The weights of these three factors were determined using the Analytic Hierarchy Process (AHP) (Table 1), resulting in a spatial distribution map of initial runoff (Figure 3).
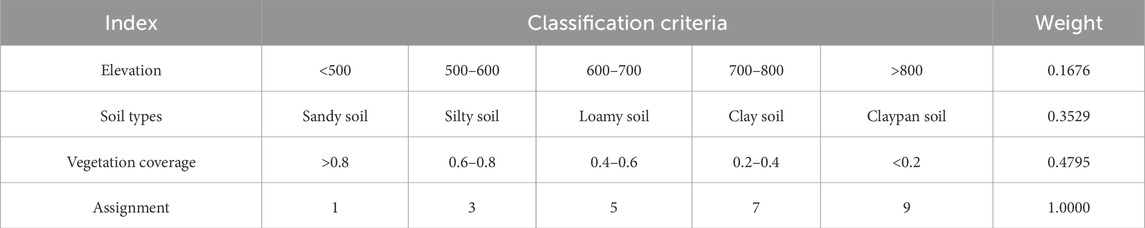
Table 1. Index and assignment of initial runoff factor.
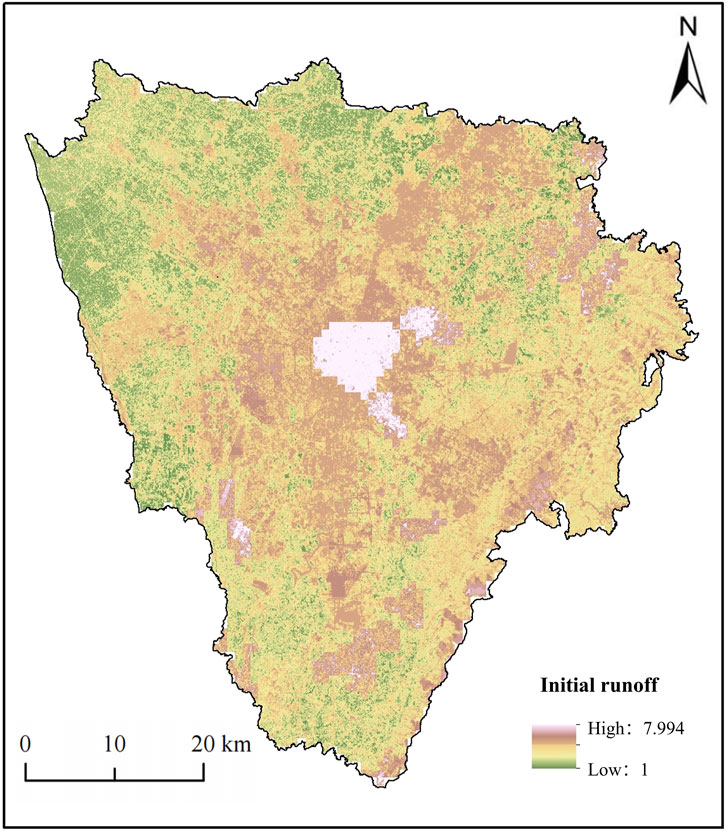
Figure 3. Initial runoff spatial distribution.
Surface runoff is typically influenced by relative elevation, slope, surface roughness, soil erodibility, land use, and vegetation coverage (Wu et al., 2021; Zhao et al., 2022). Among these factors, relative elevation and slope act as negative factors of the resistance surface, facilitating runoff–i.e., source effects. Surface roughness, vegetation coverage, and soil erodibility function as positive factors of the resistance surface, delaying surface runoff–i.e., sink effects. In this study, these factors were discretised into grids and assigned resistance coefficients. The minimum resistance coefficient was set to 1 and the maximum to 100. The AHP was used to determine each factor’s resistance coefficients and weights (Table 2), resulting in spatial distributions of positive and negative resistance surfaces for surface runoff (Figure 4).
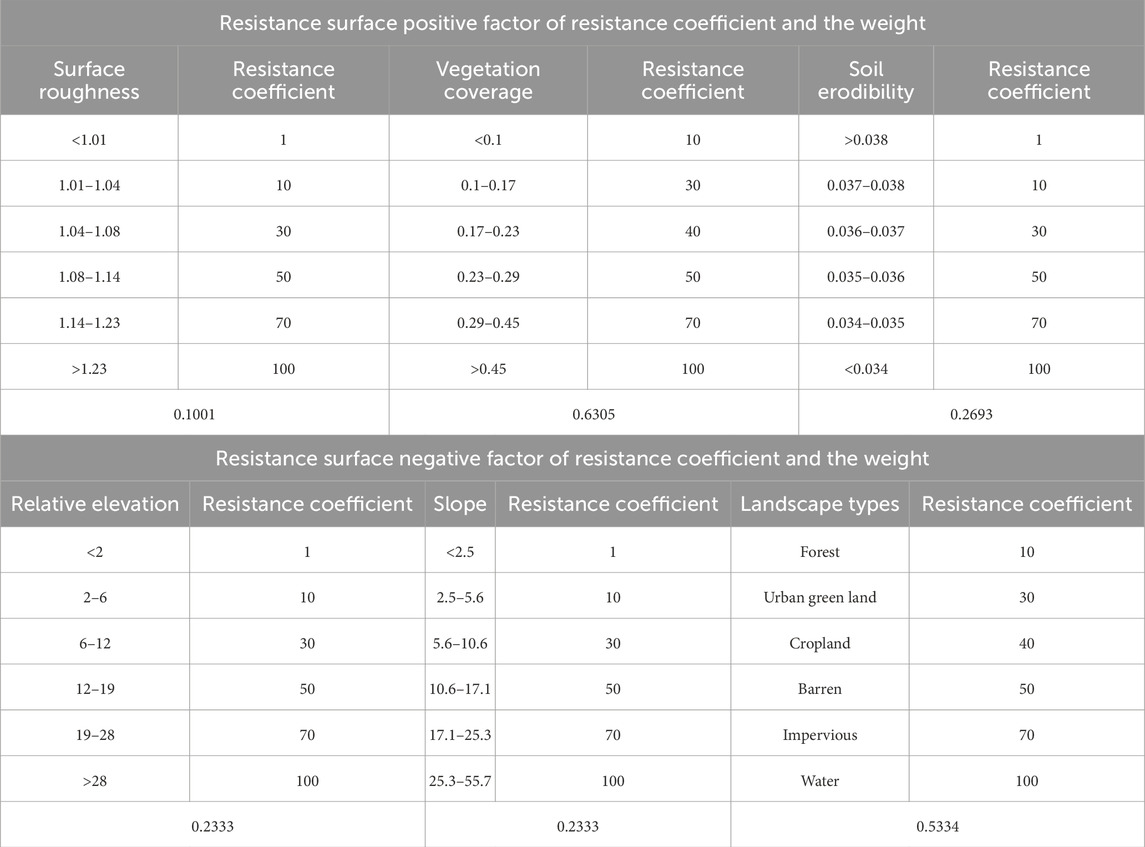
Table 2. Resistance coefficient and weight of each factor.
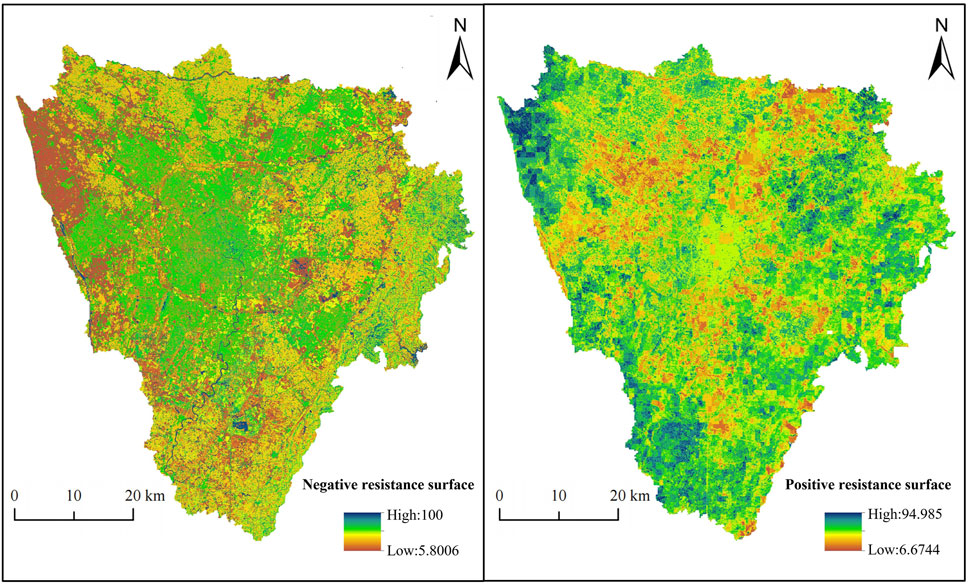
Figure 4. Spatial distribution of resistance surface.
The Minimum Cumulative Resistance (MCR) model, which represents the cost required for an object to move from a source to a destination (Zeng et al., 2023), is widely applied in the study of natural ecology (Wang, et al., 2024) and socio-humanistic processes (Zhou et al., 2023). The MCR model calculates the path from a source to a sink by minimising the cumulative resistance attributable to landscape features such as terrain, soil type, and vegetation cover. The formula for calculating MCR is as follows (Equation 2):
In the formula, MCR represents the minimum cumulative resistance value, n denotes the number of landscape elements along the path, and Ri represents the resistance value of the ith element.
The study used the MCR model to obtain source and sink values for surface runoff. A ‘source’ value represents the strength of stormwater runoff dynamics, while a ‘sink’ value represents the magnitude of surface landscape resistance. The difference between the two was used to determine whether a landscape unit was a ‘source’ landscape or a ‘sink’ landscape (Figure 5). If the difference was greater than 0, the mobility of rainwater would be greater than the surface landscape resistance—thus, the landscape unit would belong to a ‘source’ landscape. This suggests the converse would be true: if the difference was less than 0, the mobility of rainwater would be less than the surface landscape resistance—thus, the landscape unit would belong to a ‘sink’ landscape.
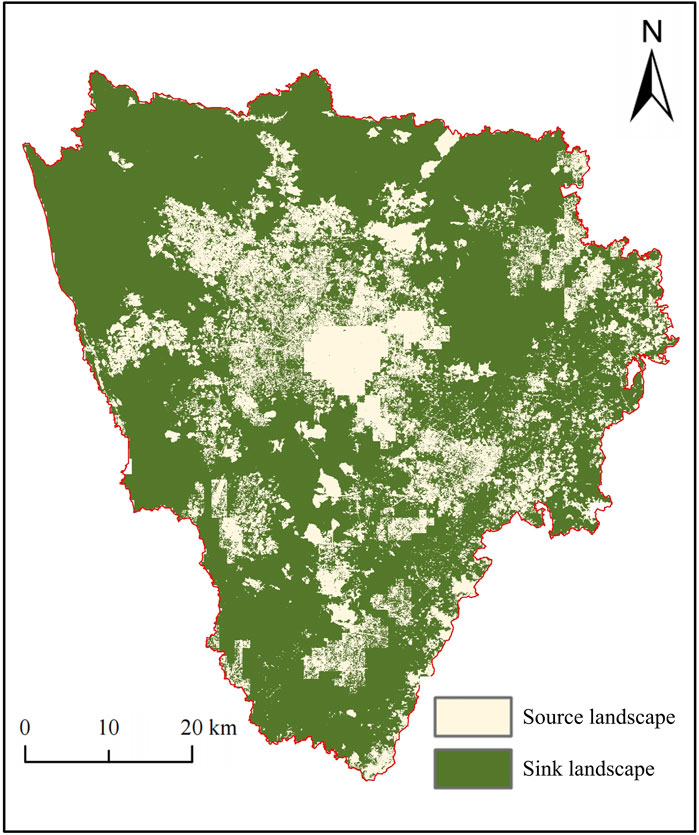
Figure 5. Considering the spatial distribution of the source and sink landscape of the rainfall-flood process.
In further steps, the SSRLI was constructed, and the corresponding calculation formula was derived. By considering both the traditional source-sink landscape types (such as cultivated land and forestland) and the source-sink landscapes during rainfall-flood processes (Figure 5), for each sub-watershed within the study area, the contribution of source-sink landscapes was calculated separately (using the product of the proportion of source-sink landscapes during rainfall-flood processes and the area of traditional source-sink landscapes). Then, the source-sink landscape contributions were divided and subjected to logarithmic operations to obtain the following formula (Equations 3–5):
where the SSRLI represents the Surface Runoff Landscape Index, M and N represent the contributions of source and sink landscapes, respectively; Psource_i and Psink_i represent the proportions of source and sink landscapes, respectively, in the ith sub-watershed during rainfall-flood processes; and Ssource_i and Ssink_i represent the proportions of source and sink landscapes, respectively, in the ith sub-watershed in the traditional sense. Theoretically, a higher SSRLI value indicates a higher proportion of source landscapes within the sub-watershed, resulting in more surface runoff and vice versa.
This study took each sub-watershed as a sample, and the runoff volume of the sub-watershed simulated by the SWMM was used as the dependent variable. The area proportions of various landscape types and the SSRLI value in the sub-watershed were used as independent variables. Pearson correlation coefficient analysis was employed to study the relationship between landscape patterns and surface runoff (Equation 6).
where Pearson r represents the Pearson correlation coefficient, with a value range from −1 to 1; n represents the number of sub-watersheds;
In 2022, the main landscape types in the central urban area of Chengdu were impervious surfaces, forestland, and cultivated land (Figure 6a), with areas of 1159.08 km2, 1052.61 km2, and 908.94 km2, respectively, accounting for 83.27% of the total area of the study region. Urban green spaces, water bodies, and bare land accounted for relatively small proportions, occupying 9.59%, 4.39%, and 2.74% of the total area of the study region, respectively. Spatially, the SSRLI values were higher in the central region and gradually decreased towards the periphery (Equation 6b).
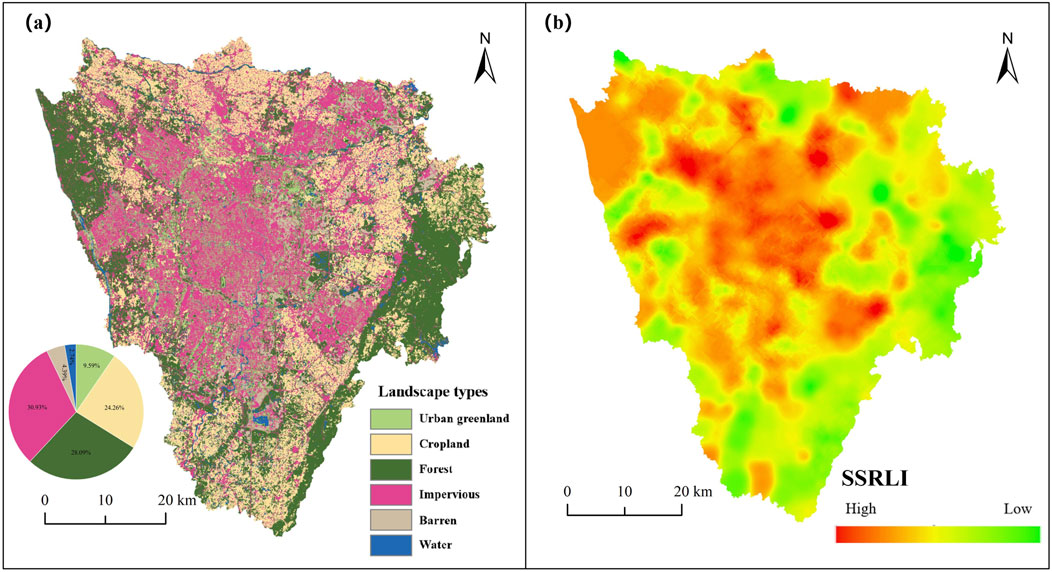
Figure 6. Spatial distribution of landscape types (a) and pattern (b) in Chengdu Downtown area in 2022.
Overall, as the rainfall intensity increased, the area of surface runoff depth zones gradually expanded, showing a trend of spreading from the central region to the periphery in space (Figure 7). The rainfall amounts for moderate rain to extremely heavy rainstorms were 8.98, 20.48, 61.63, 111.47, and 145.43 mm, respectively, with corresponding surface runoff depths of 1.25, 3.99, 18.53, 43.79, and 63.25 mm. The average rainfall-runoff conversion rate increased from 0.263 to 0.599, and the median value increased from 0.245 to 0.629 (Figure 8). Notably, under the scenarios of heavy rainstorms and extremely heavy rainstorms, the median conversion rate was higher than the average.
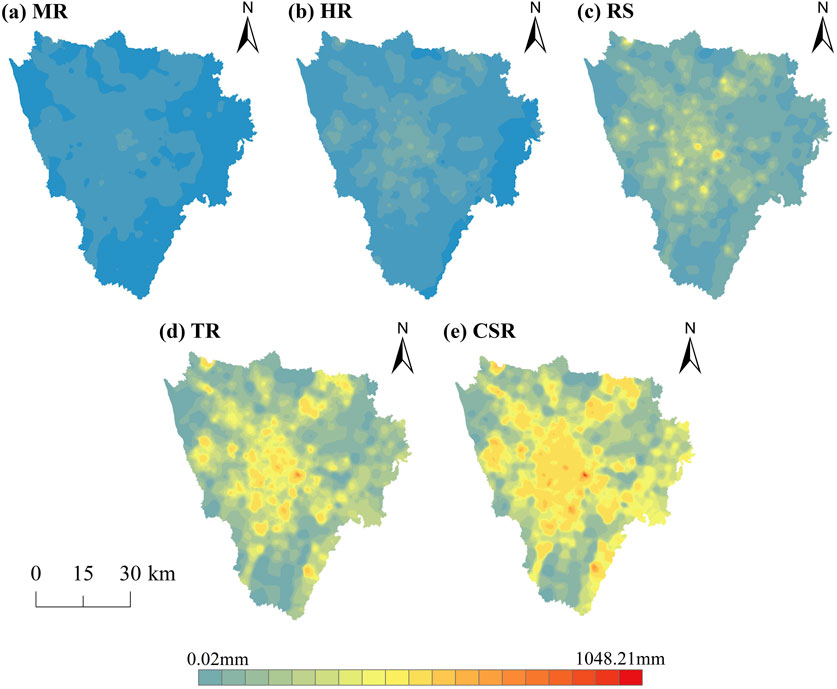
Figure 7. Runoff depth distribution map under different rainfall scenarios in Chengdu downtown area. (a) MR; (b) HR; (c) RS; (d) TR; (e) CSR. Notes: MR—Moderate Rain; HR—Heavy Rain; RS—Rainstorm; TR—Torrential Rain; CSR—Catastrophic Rainstorm.
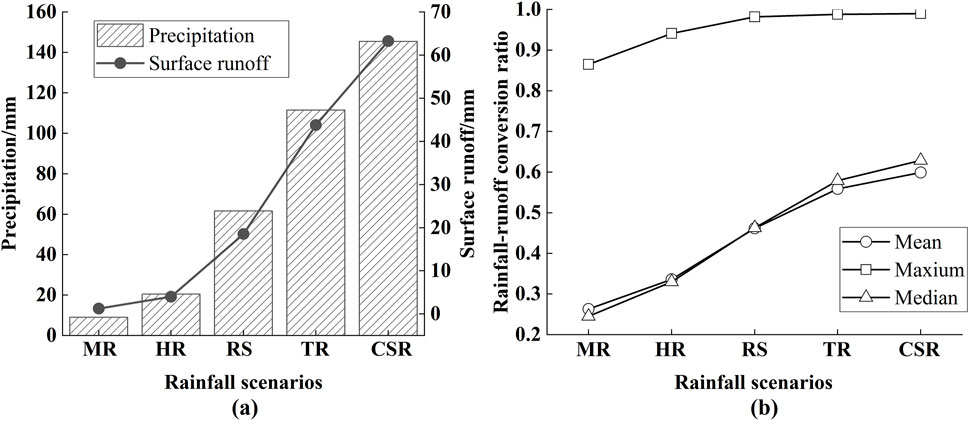
Figure 8. Runoff depth (a) and rain-runoff conversion rate (b) in different rainfall scenarios. Notes: MR—Moderate Rain; HR—Heavy Rain; RS—Rainstorm; TR—Torrential Rain; CSR—Catastrophic Rainstorm.
The correlation analysis between landscape types and surface runoff (Figure 9) found that the proportions of cultivated land and forest area showed a significant negative correlation with runoff depth; the proportion of urban green space area initially showed a positive correlation with runoff depth, followed by a negative correlation, with an inflection point value of 32.5%; the proportion of impervious surface area showed a strong positive correlation with runoff depth; while bare land and water areas did not show significant correlation with runoff depth.
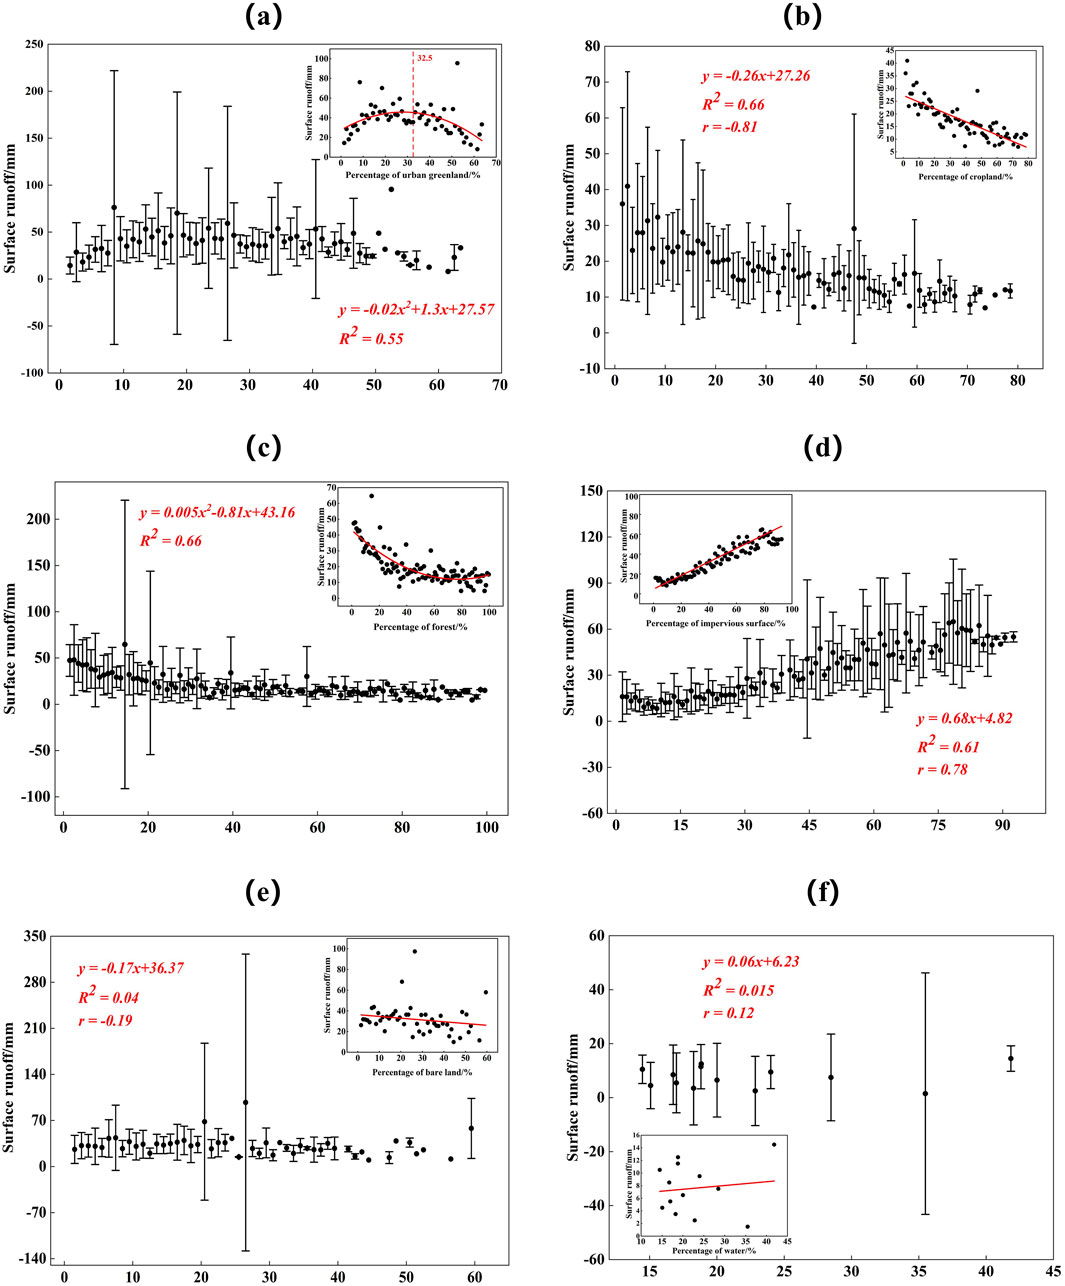
Figure 9. Correlation between landscape types and surface runoff under rainstorm scenarios. (a) Urban greenland; (b) Cultivated land; (c)Forest; (d) Impervious surface; (e) Bare land; (f) Water.
Further analysis revealed differences in the correlation between the proportion of landscape types (<20%, 20%–40%, 40%–60%, 60%–80%, >80%) and runoff depth under different rainfall scenarios. When the proportion of urban green space was less than 20%, it had a positive correlation with runoff depth, and the correlation coefficient decreased with increasing rainfall intensity (from 0.36 to 0.274). When the proportion was between 20% and 40%, the correlation with runoff depth was not significant. When the proportion exceeded 40%, there was a significant negative correlation with runoff depth under moderate rain scenarios (correlation coefficient of −0.413). Under rainstorm scenarios, there was a negative correlation (correlation coefficient of −0.246), but the correlation was not significant as rainfall intensity increased (Figure 10a). For cultivated land, when the proportion was less than 20%, the impact of cultivated land on runoff depth decreased with increasing rainfall intensity, and the correlation coefficient increased from −0.274 to −0.164. When the proportion exceeded 20%, its impact on runoff depth was not significant (Figure 10b). The proportion of impervious surfaces had a negative correlation with runoff depth, and the correlation gradually decreased with increasing rainfall intensity (Figure 10c). When the proportion of forestland was less than 20%, its impact on runoff depth decreased with increasing rainfall intensity, and the correlation coefficient increased from −0.445 to −0.085. When the proportion exceeded 80%, the correlation coefficient slightly decreased from −0.701 to −0.694 under moderate to heavy rain scenarios, while other impacts were not significant (Figure 10d).
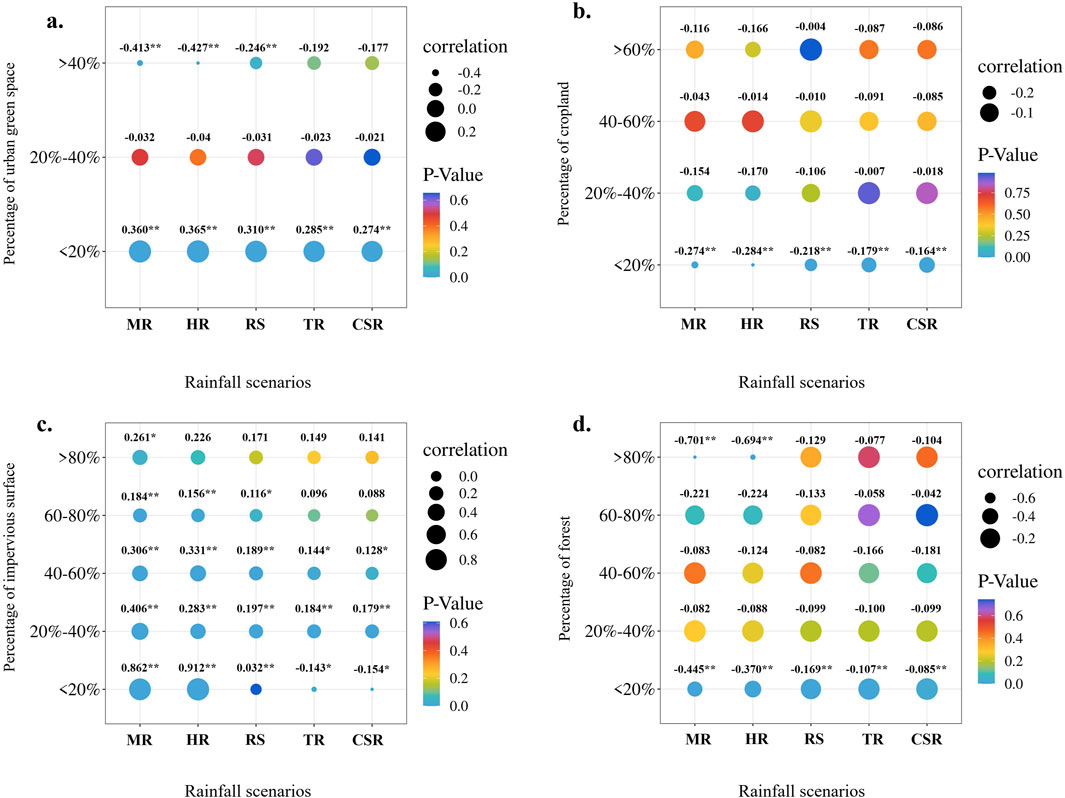
Figure 10. Correlation coefficient between the proportion of different landscape types and surface runoff. (a) Urban greenland; (b) Cultivated land; (c) Impervious surface; (d) Forest. Notes: MR—Moderate Rain; HR—Heavy Rain; RS—Rainstorm; TR—Torrential Rain; CSR—Catastrophic Rainstorm.
The constructed SSRLI was validated by selecting 70% of the sub-catchment areas for regression fitting (Figure 11) and using the remaining 30% for validation. The linear relationship derived from the regression fitting was used to extrapolate the surface runoff of the validation sub-catchment areas. Finally, the differences between the two sets of surface runoff were compared, and the root mean square error (RMSE) measure was used to evaluate the validation performance. The RMSEs obtained under different rainfall scenarios ranging from moderate rain to extremely heavy rainstorms were 0.58, 0.547, 0.436, 0.375, and 0.36, respectively. This indicates that the SSRLI can accurately reflect the changes in surface runoff, and RMSEs decrease with increasing rainfall intensity, suggesting that the index becomes more accurate under higher rainfall intensities.
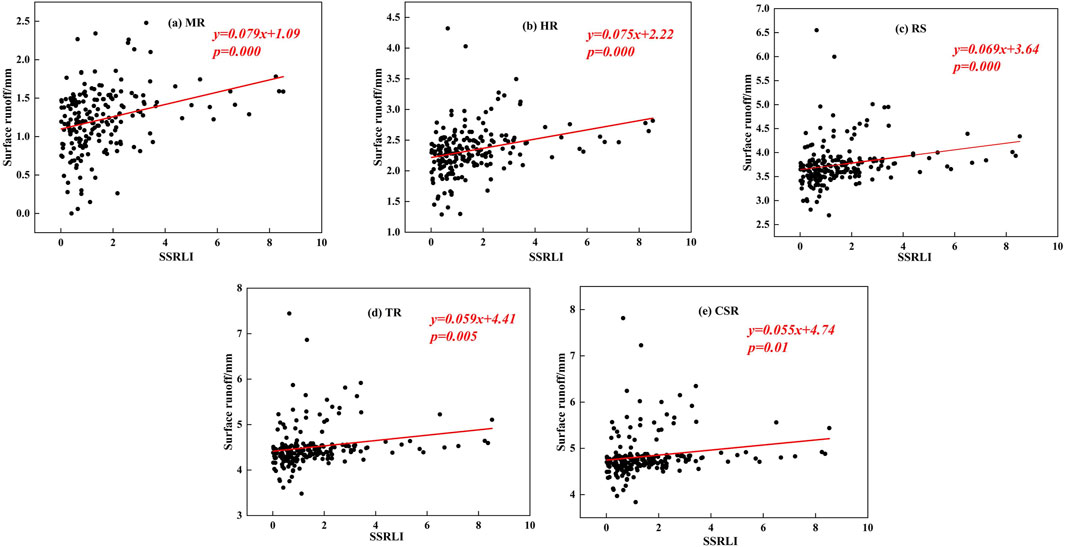
Figure 11. Scatterplot of correlation between the SSRLI and surface runoff under different rainfall scenarios. (a) MR; (b) HR; (c) RS; (d) TR; (e)CSR Notes: MR—Moderate Rain; HR—Heavy Rain; RS—Rainstorm; TR—Torrential Rain; CSR—Catastrophic Rainstorm.
Table 3 presents the results of the Pearson correlation coefficient analysis of the relationship between the SSRLI and runoff depth. Under different rainfall scenarios, the SSRLI shows a significant positive correlation with runoff depth. From moderate rain to extremely heavy rainstorms, the correlation coefficients were 0.653, 0.644, 0.605, 0.496, and 0.456, respectively, indicating a continuous decrease in correlation. Among them, the change in correlation was most pronounced when rainfall intensity increased from rainstorm to heavy rainstorm levels.
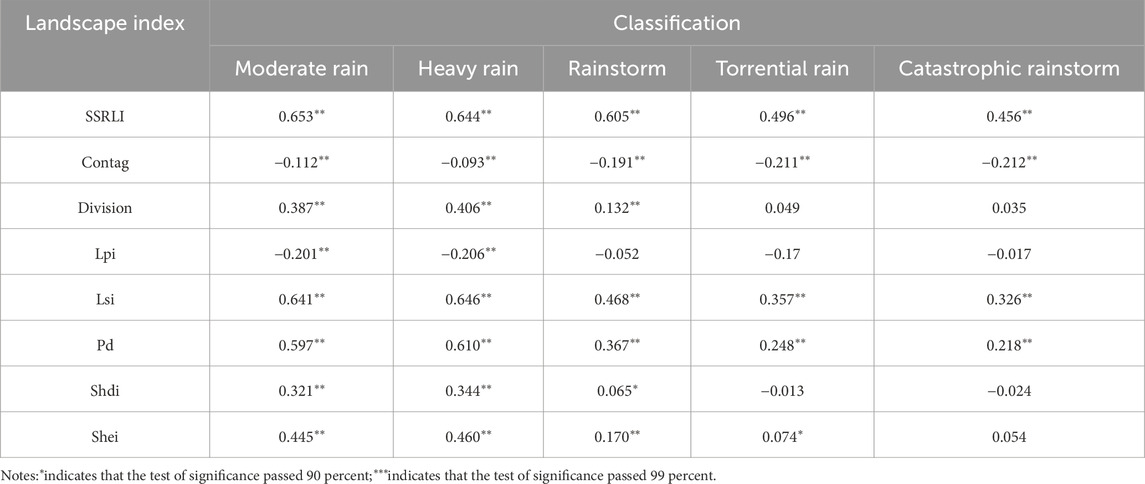
Table 3. Correlation coefficient between landscape index and runoff depth.
Different types of landscapes have varying impacts on surface runoff due to differences in their physical characteristics and spatial configurations (Chen et al., 2024). This paper delves into the influence of landscape types such as cultivated land, impervious surfaces, urban green spaces, and woodlands on the depth of surface runoff under various rainfall scenarios. Consistent with previous research findings (Francisco et al., 2011; Wang L. Y. et al., 2023; Yu H. F. et al., 2019), the proportion of cultivated land and woodlands in this study exhibited a strong negative correlation with runoff depth. However, as rainfall intensity increased, the negative correlation weakened, indicating that even high proportions of cultivated land and woodlands may struggle to fully absorb and retain all rainfall under more intense rainfall scenarios, contributing to increased surface runoff. The proportion of urban green spaces showed a nonlinear trend of initially increasing and then decreasing in its correlation with runoff depth. This may be attributed to the fact that at low proportions, the initial increase in urban green spaces is insufficient to alter the surface cover conditions significantly. However, when the proportion reaches a certain threshold, it begins to impact surface runoff. Therefore, maintaining or increasing a certain proportion of urban green spaces in urban planning is crucial for controlling runoff and mitigating the risk of waterlogging.
Under natural conditions, bare land usually lacks vegetation cover, with the soil directly exposed to the atmosphere. When rainfall occurs, the rainwater cannot be intercepted, absorbed, and slowly released by plants as it does in vegetated areas, but instead falls directly on the ground surface. If the soil has poor permeability, the rainwater will quickly converge into surface runoff in a short time, thereby increasing the runoff depth. However, if the soil of the bare land has good permeability, the rainwater can rapidly infiltrate into the soil during rainfall, reducing the generation of surface runoff and thus decreasing the runoff depth (Fang et al., 2024; Lu et al., 2024). The central urban area of Chengdu, as the core area of the city, has long been under high - intensity development pressure. A large amount of land has been used for the construction of high - rise buildings, commercial facilities, roads, and other infrastructure. These construction activities have occupied the vast majority of land area, resulting in a relatively small area of bare land. Due to the limited area of bare land, the number of bare land samples available for our research has also decreased accordingly. The insufficient number of samples has, to some extent, limited our in - depth analysis of the relationship between bare land and runoff depth. Through careful study and data analysis of the existing samples, we found that bare land did not have a significant impact on runoff depth.
Existing studies generally believe that in small rainfall events, the control effect of impervious surfaces on surface runoff is more significant. The results of this study show that as rainfall intensity increases, the correlation between impervious surfaces and surface runoff weakens. The study indicates that when the rainfall amount is less than 26.9 mm, the effective impervious surface rate plays a dominant role in explaining the runoff process (Liang et al., 2017). In small rainfall events, the mechanism of runoff generation due to exceeding infiltration capacity is the main one, and at this time, surface runoff generation is mainly directly controlled by the proportion of impervious surfaces (especially the effective impervious surface rate). Effective impervious surfaces (such as roofs, paved roads, and other areas directly connected to the drainage system) can quickly convert rainwater into surface runoff, and their spatial distribution has a significant impact on parameters such as the response time and peak of runoff formation (Yao et al., 2024; Jiang et al., 2020). With the increase of rainfall intensity, the mechanism of runoff generation due to full storage gradually takes the dominant position. At this time, the surface soil or permeable areas reach a saturated state, and the total impervious surface rate (rather than its connectivity) becomes the core factor determining the total amount of runoff. In addition, high-intensity rainfall may exceed the carrying capacity of the drainage system, leading to surface water accumulation and pipeline overflow, further weakening the direct control of the spatial layout of impervious surfaces on the runoff process. From the perspective of hydrodynamic conditions, under high-intensity rainfall, the flow velocity of surface runoff increases, which may trigger the scouring effect of particulate pollutants (such as suspended solids, total phosphorus). At this time, the output of runoff pollution is more driven by rainfall intensity and flow velocity, rather than the static characteristics of the layout of impervious surfaces (Jiang et al., 2020).
Landscape indices serve as quantitative tools that can reveal the compositional and spatial distribution characteristics of landscape structures (Fu et al., 2025). However, traditional landscape indices often rely solely on single scale analyses, limiting their ability to reflect the details of landscape patterns comprehensively and their relationships with ecological processes across continuous scales, both macro and micro. Furthermore, when studying surface runoff, a typical ecological process, traditional landscape indices may fail to fully capture certain crucial ecological dynamics, potentially obscuring important aspects of the ecological process (Zhang et al., 2008). Given these limitations, this study builds upon previous research to develop a SSRLI aimed at more accurately assessing the impact of landscape patterns on surface runoff. Through comparative analysis with traditional landscape indices, it was found that the SSRLI exhibits higher correlation and stronger explanatory power in revealing the relationship between runoff depth and landscape characteristics compared to traditional methods. Figure 4 showcases the performance comparison be-tween the SSRLI and traditional landscape indices in predicting surface runoff, further confirming the practicality and superiority of the SSRLI. For details, see Supplementary Appendix S2.
This study constructs the source-sink runoff landscape index based on the source-sink landscape theory, providing a new perspective and methodology for regulating surface runoff. By identifying the initial runoff source, defining the runoff driving and resistance surfaces, and calculating the source-sink runoff landscape index using the minimum cumulative resistance model, it can effectively distinguish the “source” and “sink” characteristics of landscape units. This is of great significance for understanding the relationship between urban landscape patterns and hydrological processes. However, this study also has certain limitations.
(1) In this study, the 1160 delineated sub - watersheds were used as the statistical sample size. There may be spatial dependence between sub - sub - watersheds. Traditional correlation analysis assumes sample independence, which may underestimate the significance level.
(2) Although we used high - resolution remote sensing images for remote sensing data classification, and the overall accuracy of land - use classification was 86%, the small amount of mixing still may cause slight deviations in the calculation of landscape indices. In addition, surface runoff depth is greatly affected by the intensity of human activities, which may indirectly affect runoff depth by regulating the infiltration rate. Therefore, there may be potential biases in the process of data collection and processing.
(3) In the process of constructing the source-sink landscape index, the impact of runoff loss factors such as rainwater infrastructure and evaporation was not considered. Rainwater infrastructure (such as stormwater pipes, rain gardens, etc.) plays a key role in urban stormwater management. They can change the path, speed, and volume of runoff, thereby affecting the function of the source-sink landscape. Future research should further improve the construction method of the source-sink landscape index based on the existing work, and incorporate the runoff loss factors into consideration. By collecting and analyzing data on rainwater infrastructure, such as the distribution, capacity, and drainage efficiency of pipes, and studying the evaporation characteristics of different landscape units, a more comprehensive and accurate source-sink landscape index model can be established. This will help to more accurately assess the regulatory effect of urban landscapes on surface runoff, provide a more scientific and reliable basis for urban hydrological cycle research and stormwater management, and thus better guide urban planning and construction, and improve the city’s stormwater response capacity and ecological resilience.
Taking the central urban area of Chengdu as the research region, this paper simulated hydrological processes through the SWMM, analyzed the spatial distribution characteristics of surface runoff under different rainfall scenarios, and constructed a SSRLI to further explore the correlation between different landscape types and surface runoff. The main conclusions are as follows.
(1) In 2022, the main landscape types in the central urban area of Chengdu were cultivated land, woodlands, and impervious surfaces, accounting for 83.27% of the total area of the study region. From moderate rain to extremely heavy rainstorms, the rainfall increased from 8.98 mm to 145.43 mm, and the corresponding surface runoff depth increased from 1.25 mm to 63.25 mm. The average conversion rate of rainfall to runoff increased from 0.263 to 0.599.
(2) The proportion of cultivated land showed a strong negative correlation with runoff depth (correlation coefficient of −0.81), while the proportion of impervious surfaces showed a strong positive correlation with runoff depth (correlation coefficient of 0.78). When the proportion of urban green spaces increased to 32.5%, the increase in urban green spaces effectively reduced surface runoff. An increase in the proportion of woodlands could also reduce runoff depth, but the trend of reduction gradually slowed down. The impacts of bare land and water areas on surface runoff were not significant.
(3) When the proportion of urban green spaces was less than 20%, it showed a positive correlation with runoff depth, and after exceeding 20%, it showed a negative correlation. When the proportion was greater than 40%, there was a significant negative correlation under moderate rainfall scenarios. When the proportions of cultivated land and woodlands were less than 20%, their impacts on surface runoff weakened as rainfall intensity increased; the negative correlation between the proportion of impervious surfaces and runoff depth decreased as rainfall intensity increased.
(4) The SSRLI proved effective in predicting changes in surface runoff, especially under heavy rainfall conditions, where its predictive performance was more accurate. From moderate rain to extremely heavy rainstorm scenarios, the correlation coefficients between the SSRLI and surface runoff were 0.653, 0.644, 0.605, 0.496, and 0.456, respectively, showing a continuous decrease in correlation.
The original contributions presented in the study are included in the article/Supplementary Material, further inquiries can be directed to the corresponding authors.
YK: Conceptualization, Investigation, Project administration, Writing–original draft. JL: Formal Analysis, Investigation, Methodology, Writing–original draft. QL: Validation, Writing–review and editing. WZ: Project administration, Writing–review and editing. YG: Funding acquisition, Writing–review and editing.
The author(s) declare that financial support was received for the research, authorship, and/or publication of this article. This research was supported by the National Key Research and Development Program of China (2022YFF1301104), the Youth Innovation Promotion Association of the Chinese Academy of Sciences (No. 2021375), and the Sichuan Science and Technology Program (2024YFNH0015).
We are extremely grateful to Chengdu Municipal Bureau of Planning and Natural Resources for sharing their valuable dataset. The authors were grateful for any constructive comments from the editor and reviewers.
Authors YK, WZ, and YG were employed by Chengdu Tianfu Greenway Construction Investment Group Co., Ltd.
The remaining authors declare that the research was conducted in the absence of any commercial or financial relationships that could be construed as a potential conflict of interest.
The author(s) declare that no Generative AI was used in the creation of this manuscript.
All claims expressed in this article are solely those of the authors and do not necessarily represent those of their affiliated organizations, or those of the publisher, the editors and the reviewers. Any product that may be evaluated in this article, or claim that may be made by its manufacturer, is not guaranteed or endorsed by the publisher.
The Supplementary Material for this article can be found online at: https://www.frontiersin.org/articles/10.3389/feart.2025.1542985/full#supplementary-material
Ahiablame, L., and Shakya, R. (2016). Modeling flood reduction effects of low impact development at a watershed scale. J. Environ. Manag. 171, 81–91. doi:10.1016/j.jenvman.2016.01.036
Ahmed, F., Moors, E., Khan, M. S. A., Warner, J., and Van Scheltinga, C. T. (2018). Tipping points in adaptation to urban flooding under climate change and urban growth: the case of the Dhaka megacity. Land Use Policy 79, 496–506. doi:10.1016/j.landusepol.2018.05.051
Alexander, B., Wu, J. G., and Corinna, G. (2010). Multiscale analysis of the urbanization pattern of the Phoenix metropolitan landscape of USA:Time,space and thematic resolution. Elsevier Bv 94 (3-4), 206–217. doi:10.1016/j.landurbplan.2009.10.005
Bautista, S., Mayor, Á. G., Bourakhouadar, J., and Bellot, J. (2007). Plant spatial pattern predicts hillslope runoff and erosion in a semiarid Mediterranean landscape. Ecosystems 10 (6), 987–998. doi:10.1007/s10021-007-9074-3
Burns, M. J., Fletcher, T. D., Walsh, C. J., Ladson, A. R., and Hatt, B. E. (2012). Hydrologic shortcomings of conventional urban stormwater management and opportunities for reform. Landsc. Urban Plan. 105 (3), 230–240. doi:10.1016/j.landurbplan.2011.12.012
Chen, L., Sun, R., and Lu, Y. (2019). A conceptual model for a process-oriented landscape pattern analysis. Sci. China Earth Sci. 62, 2050–2057. doi:10.1007/s11430-019-9427-2
Chen, L. D., Liu, Y., Lv, Y. H., Xiaoming, F., and Bojie, F. (2008). Pattern analysis in landscape ecology: progress, challenges and outlook. Acta Ecol. sin. 28 (11), 5521–5531. doi:10.1016/s1872-2032(09)60011-1
Chen, S., Fu, Y. H., Wu, Z., Hao, F., Hao, Z., Guo, Y., et al. (2023). Informing the SWAT model with remote sensing detected vegetation phenology for improved modeling of ecohydrological processes. J. Hydrology 616, 128817. doi:10.1016/j.jhydrol.2022.128817
Chen, S., Stark, S. C., Nobre, A. D., Cuartas, L. A., de Jesus Amore, D., Restrepo-Coupe, N., et al. (2024). Amazon forest biogeography predicts resilience and vulnerability to drought. Nature, 631 (8019), 111–117. doi:10.1038/s41586-024-07568-w
Chen, Y., Fan, J. j., Pan, Y. Z., Zhang, Y. Z., Wang, L. Y., Pan, j., et al. (2022). Study on the influence of different sub-catchment zoning on the overflow simulation results under measured rainstorm scenarioStudy on the influence of different sub-catchment zoning on the overflow simulation results under measured rainstorm scenario. China Flood and Drought Manag. 32 (8), 53–60. doi:10.16867/j.issn.1673-9264.2021264
Chen, Y., Xia, R., Wang, L., Sun, M. D., Zhang, L. J., Ma, S. Q., et al. (2021). Effects assessment of water environment treatment projects based on SWMM-EFDC coupling simulation in Xinfeng River Basin. J. Environ. Eng. Technol. 11 (4), 777–788. doi:10.12153/j.issn.1674-991X.20200283
Christopher, F., Michail, F., Danelle, L., Liao, H., Lohse, K. A., and Lybecker, D. (2018). A comparative study of urban fragmentation patterns in small and mid-sized cities of Idaho. Springer Sci. Bus. Media Llc 21 (5), 805–816. doi:10.1007/s11252-018-0770-x
Dadrasajirlou, Y., Karami, H., and Mirjalili, S. (2023). Using AHP-PROMOTHEE for selection of best low-impact development designs for urban flood mitigation. Water Resour. Manag. 37 (1), 375–402. doi:10.1007/s11269-022-03378-9
Fang, Q., Zi, R., Zhao, L., Fan, C., Fang, F., and Qian, X. (2024). Effect of bedrock permeability on runoff and soil loss in soil-mantled karst slopes under successive rainfall conditions. Catena 247, 108524. doi:10.1016/j.catena.2024.108524
Francisco, G., José, J., Montero, L., De Vicente, V., and Valcuende, M. (2011). Green areas, the most significant indicator of the sustainability of cities: research on their utility for urban planning. J. Urban Plan. Dev. 137 (3), 311–328. doi:10.1061/(asce)up.1943-5444.0000060
Fu, B. J., Liu, Y. S., Zhao, W. W., and Wu, J. G. (2025). The emerging “pattern-process-service-sustainability” paradigm in landscape ecology. Landsc Ecol. 40, 311. doi:10.1007/s10980-025-02063-7
Gironás, J., Roesner, L. A., Rossman, L. A., and Davis, J. (2010). A new applications manual for the Storm water management model(SWMM). Environ. Model. and Softw. 25 (6), 813–814. doi:10.1016/j.envsoft.2009.11.009
Gu, Y., Peng, D., Deng, C., Zhao, K., Pang, B., and Zuo, D. (2022). Atmospheric–hydrological modeling for Beijing's sub-center based on WRF and SWMM. Urban Clim. 41, 101066. doi:10.1016/j.uclim.2021.101066
Hernández-Sosa, M., Aguayo, M., Hurtado, J., and Llompart, O. (2025). The Response of the Water Cycle to landscape configuration and composition in two Chilean Basins. Contribution of Working, 43,(22),866. doi:10.1016/j.indic.2025.100629
Intergovernmental Panel on Climate Change (IPCC). (2013). Climate Change 2013: The Physical Science Basis. Contribution Work. 43 (22), 866–871. doi:10.1007/BF00524943
Jang, S., Cho, M., Yoon, J., Yoon, Y., Kim, S., Kim, G., et al. (2007). Using SWMM as a tool for hydrologic impact assessment. Desalination 212 (1-3), 344–356. doi:10.1016/j.desal.2007.05.005
Jiang, Z. H., Liao, Y. J., Xie, W. X., Li, J., Fang, Z. D., Zhao, H. T., et al. (2020). Influenceof pervious/impervious pattern on runoff and pollution in parcel-based catchment. Environ. Sci. 41 (10), 4599–4606. doi:10.13227/j.hjkx.202003221
Kang, S. L., and Yue, B. R. (2016). The method of landscape spatial pattern optimization based on coupling mechanism of patterns and processes. Chin. Landsc. Archit. 33 (03), 50–55. doi:10.3969/j.issn.1000-6664.2017.03.010
Li, M., Bo, P., Hong, X. Z., Liu, S., Ren, H.C., Wang, H. Y., et al. (2023). Research and application of nested urban rainstorm modeling based on two modeling approaches. J. China Inst. Water Resour.Hydropower Res. 21 (5), 412–421. doi:10.13244/j.cnki.jiwhr.20230094
Liang, Z. C., Zhao, Y. L., and Fu, Y. C. (2017). Optimization of spatial pattern of urban imperviousness based on the integration of SCS-CN hydrological model and the ant colony algorithm. J. Geo-information Sci. 19 (10), 1315–1326. doi:10.3724/SP.J.1047.2017.01315
Liao, Y., Wang, Z., Chen, X., and Lai, C. (2023). Fast simulation and prediction of urban pluvial floods using a deep convolutional neural network model. J. Hydrology 624, 129945. doi:10.1016/j.jhydrol.2023.129945
Lu, Z., Zhang, J., Li, C., Dong, Z., Lei, G., and Yu, Z. (2024). Effects of land use change on runoff depth in the Songnen Plain, China. Sci. Rep. 14 (1), 24464. doi:10.1038/s41598-024-75469-z
Ma, J. Z., Sun, Q., Xiao, Q., and Wen, B. W. (2016). Accuracy Assessment and Comparative Analysis of GlobeLand30 Dataset in Henan Province. J. Geo-information Sci. 18 (11), 1563–1572. doi:10.3724/SP.J.1047.2016.01563
Meng, D., Zhang, Z., and Yang, L. (2025). A knowledge-enhanced framework for urban waterlogging prediction based on informed similarity transfer and hybrid spatio-temporal model. Int. J. Disaster Risk Reduct. 117, 105177. doi:10.1016/j.ijdrr.2025.105177
Ramteke, G., Singh, R., and Chatterjee, C. (2020). Assessing impacts of conservation measures on watershed hydrology using MIKE SHE model in the face of climate change. Water Resour. Manag. 34 (13), 4233–4252. doi:10.1007/s11269-020-02669-3
Randall, M., Sun, F., Zhang, Y., and Jensen, M. B. (2019). Evaluating Sponge City volume capture ratio at the catchment scale using SWMM. J. Environ. Manag. 246, 745–757. doi:10.1016/j.jenvman.2019.05.134
Wang, L., Li, Y., Hou, H., Chen, Y., Fan, J., Wang, P., et al. (2022). Analyzing spatial variance of urban waterlogging disaster at multiple scales based on a hydrological and hydrodynamic model. Nat. Hazards 114 (2), 1915–1938. doi:10.1007/s11069-022-05453-1
Wang, Q., Yang, C., Wang, J., and Tan, L. (2024). Tourism in historic urban areas: construction of cultural heritage corridor based on mini-mum cumulative resistance and gravity model—a case study of tianjin, China. Buildings 14, 2144. doi:10.3390/buildings14072144
Wang, Z. F., and Cheng, K. X. (2019). Spatial and temporal changes of 'source-sink' landscapes during stromwater processes in the North Canal Basin, China. Acta Ecol. Sin. 39 (16), 5922–5931. doi:10.5846/stxb201903070435
Wang L., L., Wu, T., Zheng, H., Li, R., Hu, X., and Ouyang, Z. (2023). A comprehensive framework for quantifying ecosystem service flow focusing on social-ecological processes. Trans. Earth, Environ. Sustain. 1 (1), 20–34. doi:10.1177/2754124x231164797
Wang L. Y., L. Y., Hao, H., Yao, L., Pan, J., Wang, P., Wang, B., et al. (2023). Investigating relationships between landscape patterns and surface runoff from a spatial distribution and intensity perspective. J. Environ. Manag. 325, 116631. doi:10.1016/j.jenvman.2022.116631
Wu, B. C., Qi, S., Guo, Z. X., Liu, Z., and Chen, T. (2021). Effects of forestland spatial pattern and micro-topography on surface runoff in a mountainous area of southwestern China. China.Trans. Chin. Soc. Agric. Eng. Trans. CSAE 37 (8), 108–116. doi:10.11975/j.issn.1002-6819.2021.08.012
Yang, J., Duan, C., Wang, H., and Chen, B. (2023). Spatial supply-demand balance of green space in the context of urban waterlogging hazards and population agglomeration. Resour. Conservation Recycl. 188, 106662. doi:10.1016/j.resconrec.2022.106662
Yao, C., Zhang, H., Zhang, S., Dang, C., Mu, D., Zhang, Y., et al. (2024). A categorical quantification of the effects of vegetation restorations on streamflow variations in the Loess Plateau, China[J]. J. Hydrology, 638: 130577.doi:10.1016/j.jhydrol.2023.130577
Yu, H., Zhao, Y., and Fu, Y. (2019). Optimization of impervious surface space layout for prevention of urban rainstorm waterlogging: a case study of Guangzhou, China. Int. J. Environ. Res. Public Health 16 (19), 3613. doi:10.3390/ijerph16193613
Yu, H. F., Zhao, Y. L., and Fu, Y. C. (2019). Optimization of impervious surface space layout for prevention of urban rainstorm waterlogging: a case study of guangzhou, China. Int. J. Environ. Res. Public Health 16 (19), 3613. doi:10.3390/ijerph16193613
Zeng, W., Tang, H., Liang, X., Hu, Z., Yang, Z., and Guan, Q. (2023). Using ecological security pattern to identify priority protected areas: a case study in the Wuhan Metropolitan Area, China. Ecol. Indic. 148, 110121. doi:10.1016/j.ecolind.2023.110121
Zhang, B., Li, N., and Wang, S. (2015). Effect of urban green space changes on the role of rainwater runoff reduction in Beijing, China. Land-scape Urban Plan. 140, 8–16. doi:10.1016/j.landurbplan.2015.03.014
Zhang, J. P., Zhang, H. R., and Fang, H. Y. (2022). Urban waterlogging simulation and rainwater pipe network system evaluation based on SWMM and SCS methods. South-to-North Water Transfers and Water Science & Technology 20 (1), 110–121. doi:10.13476/j.cnki.nsbdqk.2022.0013
Zhang, L. Y., Xia, J. S., and Ye, W. H. (2008). Overview on choosing Landscape Indices in Landscape Pattern Analysis. YunNan geogr. Environ. Re. 20 (5), 6. doi:10.3969/j.issn.1001-7852.2008.05.008
Zhang, X. Y., Chen, L., Guo, C. X., Jia, H., and Shen, Z. (2023). Two-scale optimal management of urban runoff by linking LIDs and landscape configuration. J. Hydrology 620, 129332. doi:10.1016/j.jhydrol.2023.129332
Zhao, J. L., Wang, Z. G., Dong, Y. F., Yang, Z., and Govers, G. (2022). How soil erosion and runoff are related to land use, topography and annual precipitation: insights from a meta-analysis of erosion plots in China. Sci. Total Environ. 802, 149665. doi:10.1016/j.scitotenv.2021.149665
Zhou, X., Tang, Y., and Su, J. (2023). Heritage corridor routing method from historic urban landscape and digital footprint perspectives—the case of historical urban area in Nanjing, China. Landsc. Archit. Front. 11 (3), 11–37. doi:10.15302/j-laf-1-020080
Keywords: landscape patterns, surface runoff, Chengdu city centre, urban waterlogging, SWMM model
Citation: Kang Y, Liu J, Liu Q, Zhao W and Guo Y (2025) The impact of landscape patterns on surface runoff in the central urban area of Chengdu. Front. Earth Sci. 13:1542985. doi: 10.3389/feart.2025.1542985
Received: 10 December 2024; Accepted: 25 February 2025;
Published: 31 March 2025.
Edited by:
Shruti Kanga, Central University of Punjab, IndiaReviewed by:
Lisa Krimsky, University of Florida, United StatesCopyright © 2025 Kang, Liu, Liu, Zhao and Guo. This is an open-access article distributed under the terms of the Creative Commons Attribution License (CC BY). The use, distribution or reproduction in other forums is permitted, provided the original author(s) and the copyright owner(s) are credited and that the original publication in this journal is cited, in accordance with accepted academic practice. No use, distribution or reproduction is permitted which does not comply with these terms.
*Correspondence: Jingjing Liu, bGl1amluZ2ppbmcyQHN0dS5jZHV0LmVkdS5jbg==; Qin Liu, bGl1cWluQGltZGUuYWMuY24=
Disclaimer: All claims expressed in this article are solely those of the authors and do not necessarily represent those of their affiliated organizations, or those of the publisher, the editors and the reviewers. Any product that may be evaluated in this article or claim that may be made by its manufacturer is not guaranteed or endorsed by the publisher.
Research integrity at Frontiers
Learn more about the work of our research integrity team to safeguard the quality of each article we publish.