
94% of researchers rate our articles as excellent or good
Learn more about the work of our research integrity team to safeguard the quality of each article we publish.
Find out more
ORIGINAL RESEARCH article
Front. Earth Sci., 28 February 2025
Sec. Geoscience and Society
Volume 13 - 2025 | https://doi.org/10.3389/feart.2025.1542291
 Mahmood Ahmad1,2*
 Mohammad Al Zubi3
 Hamad Almujibah4
 Mohanad Muayad Sabri Sabri5
 Jawad Bashir Mustafvi6
 Shay Haq7
 Tariq Ouahbi8Abdullah Alzlfawi9
The soil’s shear strength is an important parameter that is used frequently throughout the design phase of construction. The conventional method of calculating shear strength in a laboratory is more expensive and time-consuming. This study presents an attempt to develop models for predicting soil shear strength with improved accuracy, particularly Extreme Gradient Boosting (XGBoost), Gradient Boosting (GB), Adaptive Boosting (AdaBoost), and Categorical Boosting (CatBoost). The Coefficient of determination (R2), Root Mean Squared Error (RMSE), Mean Absolute Error (MAE), Mean Absolute Percentage Error (MAPE), and Mean Absolute Deviation (MAD) indices were used to validate each of the developed models. The analysis of the results demonstrates that the AdaBoost model achieved a better prediction performance with R2 = 0.99794 and lowest values of RMSE = 0.00400, MAE = 0.00080, MAPE = 0.24390 and MAD = 0.00080 followed by the CatBoost model with R2 = 0.99651, RMSE = 0.00521, MAE = 0.00429. MAPE = 1.33450 and MAD = 0.00429 in the training phase when compared to previous models such as multivariate adaptive regression splines and support vector regression published in the literature. In addition, SHapley Additive Explanations analysis elucidates that the liquidity index has the greatest influence on soil shear strength, followed by wet density.
The shear strength of the soil is a significant attribute which is employed most frequently throughout the design phase of construction projects. Collapse of building and ground failure are often associated with the shear strength of the soil (Das, 2021). When evaluating the stability of constructions, such as high-rise building foundations, retaining walls, embankments, and airfield pavements, geotechnical engineers take the soil’s shear strength into account (Vanapalli and Fredlund, 2000; Zhang et al., 2023). As a result, in many geotechnical designs, estimating the shear strength of soil accurately is a crucial task (Gao et al., 2020; Li et al., 2019; Eid and Rabie, 2017; Yu et al., 2021; Zou et al., 2024). Traditional calculations of shear strength rely on the cohesion (c) and internal friction angle (φ) parameters. These parameters of interest (c, φ) can be determined in the lab using the vane shear test equipment or any indirect technique of soil testing; in the field, they can be measured using the tri-axial test, the unconfined compressive strength test, or the direct shear test (Murthy, 2009; Pham et al., 2018; Xu et al., 2021).
The soil shear strength is affected by specific gravity, void ratio, water content, plastic limit, liquid limit, stress history, and relative density (Pham et al., 2020). Over the past few years, there has been rapid development in the field of artificial intelligence techniques. This development has led to the emergence of machine learning (ML) algorithms that have been proposed and are now widely used in various fields. ML applications have transformed the way how complex problems can be tackled using new and innovative solutions. Due to their learning ability, ML algorithms became a desirable tool for revealing relationships between many soil parameters. Therefore, the growing interest in studying the potential applications of ML algorithms on geotechnical issues has been witnessed in the past decades (Ahmad et al., 2021; Ahmad et al., 2022a; Ahmad F. et al., 2022; Ahmad F. et al., 2023; Ahmad M. et al., 2023; Barkhordari et al., 2023; Asteris et al., 2022a; Li et al., 2022; Armaghani et al., 2014; Armaghani et al., 2017) including shear strength of soil (Pham et al., 2018; Nguyen et al., 2021; Tien Bui et al., 2019). Furthermore, several researchers have also utilized ML algorithms to solve some other specific problems (Fan et al., 2024; Zhou et al., 2022; Lü et al., 2024; Zi et al., 2024; Noman et al., 2024). The parameters for civil works design are frequently tested by using empirical correlations, which are produced by fitting equations for regression to a pre-existing database, as opposed to direct measurements in the lab and field (Hua et al., 2024; Shu et al., 2024; Wang et al., 2024; Shan et al., 2025). Garven and Vanapalli (2006) looked into nineteen distinct empirical techniques for predicting soil shear strength in unsaturated conditions. With the approach used, a number of possible soil parameters were assessed for association with soil shear strength.
Soft computing techniques are known for their proficiency in non-linear modeling, and there is evidence in the literature from a number of technical and scientific fields that these techniques can establish correlations between desired outcomes and a variety of influencing parameters, whether those parameters have direct or indirect impacts (Fan et al., 2024; Zhou et al., 2022; Lü et al., 2024; Asteris et al., 2022b; Koopialipoor et al., 2019). Taking into account the effects of influencing parameters, experimental data can be used to design a high performance soft computing-based paradigm. However, choosing a suitable soft computing model is challenging for the reasons listed below: (a) Inadequate modeling and validation; (b) models in use not being able to identify the precise global optimum; (c) problems with overfitting, etc. XGBoost, GB, AdaBoost, and CatBoost are all powerful machine learning algorithms, often chosen for their strengths in solving a variety of classification and regression problems (Abdullah et al., 2024; Ahmad et al., 2022c; Ahmad et al., 2022d; Ahmad et al., 2022e; Islam and Amin, 2020; Prokhorenkova et al., 2018; Dorogush et al., 2018; Chen and Guestrin, 2016). These algorithms have proven to be versatile and adaptable to a wide variety of domains, as evidenced by their frequent use in research across fields but the applications in geotechnical engineering are limited based on literature surveys. Therefore, these four well-known machine learning algorithms—XGBoost, GB, AdaBoost, and CatBoost—have been chosen for modeling in this study. Furthermore, selected a research topic “the prediction of soil shear strength” which is an important geotechnical engineering task (Pham et al., 2018; Nguyen et al., 2021; Tien Bui et al., 2019). Therefore, this paper tries to address the following issues: (1) providing an accurate and efficient ML model for predicting the soil shear strength; (2) Examining the prediction accuracy of the best ML model against that of existing models in literature; and (3) using the Shapley Additive exPlanations (SHAP) approach to describe the importance and participation of input variables that influence the soil shear strength.
The paper is organized as follows: Section 2 presents the data collection and correlation analysis. Section 3 explains the theory of Extreme Gradient Boosting (XGBoost), Gradient Boosting (GB), Adaptive Boosting (AdaBoost), and Categorical Boosting (CatBoost); Section 4 describes the performance measurement used; Section 5 presents the results and a discussion of them; and at last, findings derived from the achieved results are given.
A total of 249 soil samples (see supplementary data, Supplementary Table S1) from 65 boreholes were collected from the geotechnical investigation phase of the Le Trong Tan Geleximco Project, located in the west of Hanoi, Vietnam (see Figure 1) reported by Cao et al. (2022). The depth of the collected soil samples ranges from 1.20 to 39.5 m. The boreholes are drilled by means of slurry (a mixture of bentonite and water), and thin-walled metal tubes to ward off soil collapses. The soil samples with a diameter of 91 mm are gathered by the method of piston samplers. The sample collection process complies with the Vietnamese national standards of the TCXDVN-194-2006 (High Rise Building—Guide for Geotechnical Investigation), the TCN-259-2000 (the procedure for soil sampling by boring methods). Further details can be found in Cao et al. (2022) research paper.
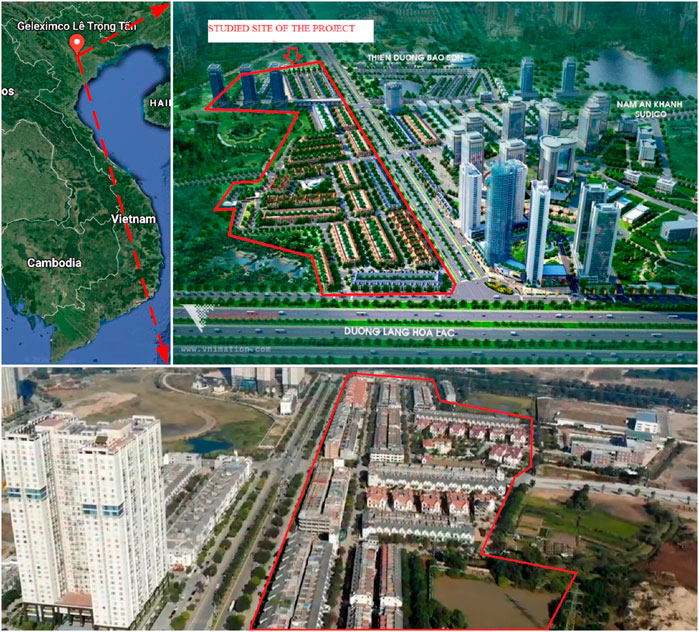
Figure 1. Site location—Le Trong Tan Geleximco, Hanoi, Vietnam.
The factors measured from soil samples are depth of sample (X1, m), sand percentage (X2), loam percentage (X3), clay percentage (X4), moisture content (X5, %), wet density (X6, g/cm3), dry density (X7, g/cm3), void ratio (X8), liquid limit (X9, %), plastic limit (X10, %), plastic index (X11), and liquidity index (X12). These 12 factors are employed as conditioning variables to estimate the shear strength of the soil (Y, kg/cm2). The descriptive statistics of the dataset are presented in Table 1. As can be inferred from the table, the sample variances (scattered in the range of 0.00539–131.891) indicate a wide range of input parameters. The variance for the output parameter is 0.00769. The values of standard error are also scattered in a wide range from 0.00465 to 0.72779 and thus confirm the credibility of the dataset. The heat map of the Pearson correlation coefficient (r) between each parameter is shown in Figure 2. The Pearson correlation coefficient (r) shown in Figure 2 presents that liquidity index (X12) and shear strength of soil (Y) has a strong positive correlation, i.e., (r = 0.83). In statistical modeling, it is well known that the existence of strongly correlated variables can significantly influence the efficiency of the model. This belief stems from the assumption that these variables, due to their strong correlation, may cause redundancy and unnecessary complexity in the model. Moreover, Kutner et al. (2005) also argued that these correlated variables do not typically affect inferences about mean responses in the data. Correlation only captures linear relationships. Since the relationship between variables is non-linear, the correlation coefficient value is low, so it is worthwhile to explore the relationship through non-linear models. This suggests that even if variables share a strong correlation, each can still provide unique and valuable insights about the average responses in the dataset, thereby making them essential components of the model. Whereas correlation coefficient between sand percentage (X2) and shear strength of soil (Y) exhibited a notably weak negative correlation (r = −0.02) for the dataset which indicates that the relationship between the variables is not linear.
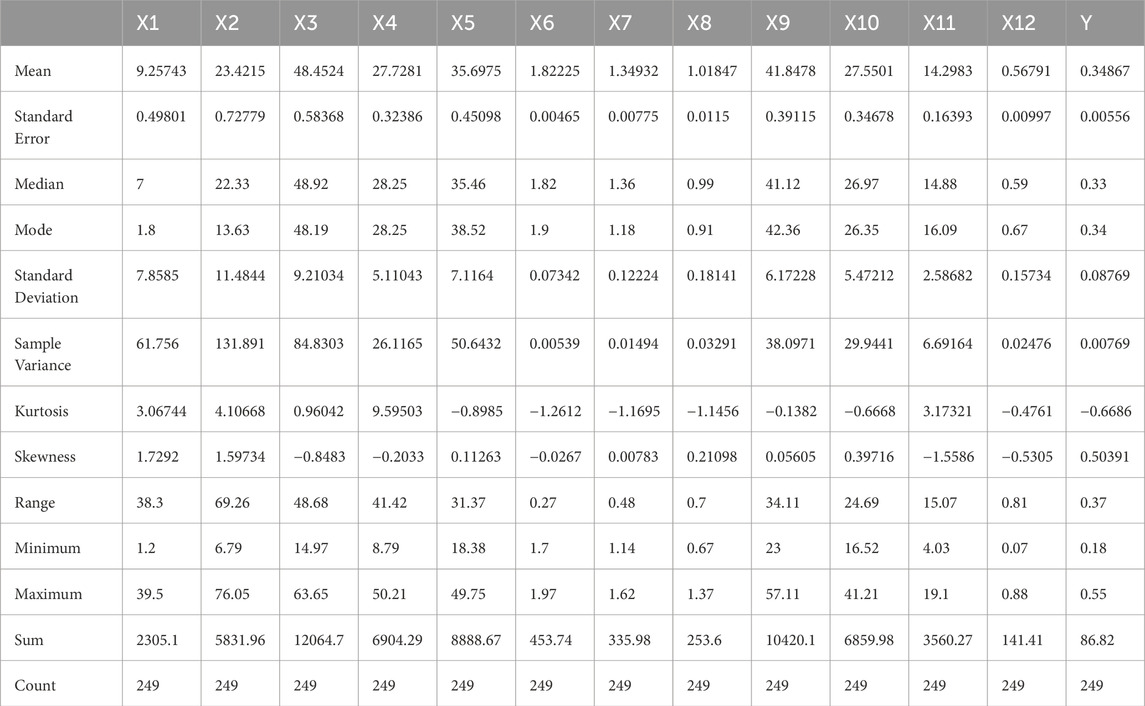
Table 1. Descriptive statistics of the dataset.
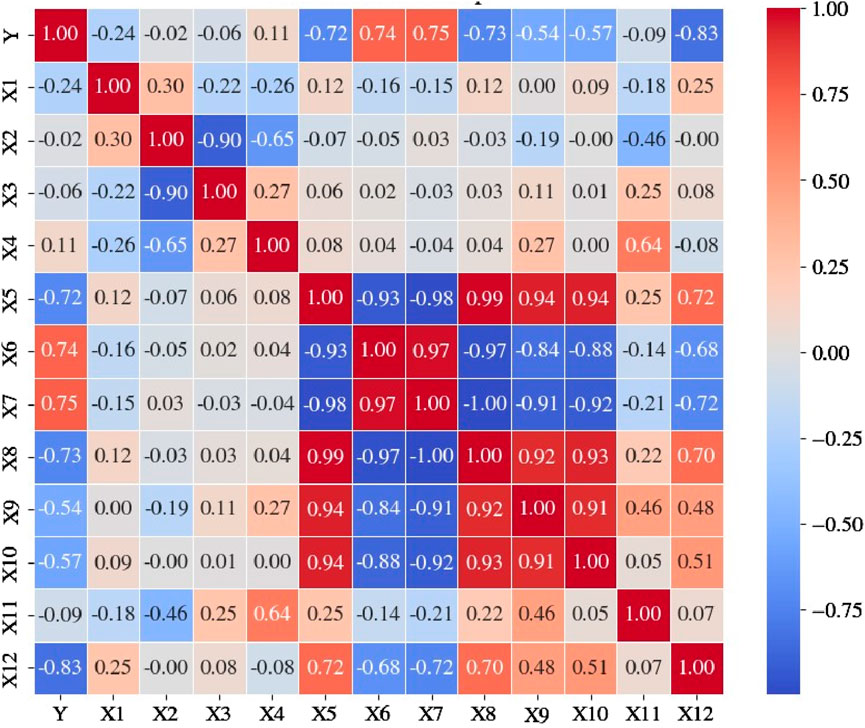
Figure 2. Correlation heat map.
Adaptive Boosting (AdaBoost), an ensemble of several weak learner decision trees, outperforms random guessing by a modest margin. To minimize the error of the previous tree, the adaptive feature of the AdaBoost technique transmits gradient information from previous trees to subsequent trees. As a result, the continuous process of learning trees at every stage promotes the growth of an efficient learner. The weighted average of the predictions produced by each tree is used to establish the final extension. The weight distribution of every sample in the dataset must be changed throughout the training of every distinct tree model. In each iteration, it assigns higher weights to misclassified data points in an attempt to lower the overall classification error. The training outcomes show fluctuation in line with the variation of the training data, and the total of all the outcomes is the result of this process (Schapire, 2013). AdaBoost’s significant adaptability improves its robustness against outliers and irrelevant data. Moreover, the approach is specifically tailored to function in a way that feeds the information gathered by prior trees to subsequent trees. This allows them to concentrate solely on training data that present prediction challenges (Freund and Schapire, 1997).
A single decision tree is called a weak learner because of its limited capabilities. Researchers are considering if it is possible to create a strong learner by combining many weak learners together. In 1990, the conjecture was verified, providing the basic ideas behind the boosting algorithm, which combines multiple weak learners in a sequential fashion (Schapire, 1990).
Gradient boosting (GB) is an ensemble technique that builds several weak models and then combines them to enhance performance as a whole. The GB minimizes the loss function associated with a given model by applying the gradient descent methodology. There is an iterative process involved in adding weak learners to the model. The total input of all weak learners establishes the final prediction, which is subsequently decided by a gradient optimization process aiming at minimizing the strong learner’s overall error (Islam and Amin, 2020; Aurélien, 2019). The method by which GB fits the model to the residuals (the difference between the actual and predicted values) of the preceding iteration is to optimize a user-specified loss function. These loss functions include, for example, the log loss for classification and the mean squared error for regression. There are three main mechanisms involved in the GB. Optimizing a loss function is the first thing that needs to be done. It is required that the loss function be differentiable. A loss function is used to quantify the degree of concordance between a machine learning model and observed data relevant to various phenomena. Depending on the specific issue at hand, different loss functions may be chosen. The use of the weak learner is implemented in the following stage. In gradient boosters, the decision tree is used as the weak learner. Regression trees are a unique technique for handling residuals in previous iteration forecasts by integrating the output of successive models; they produce precise values for divisions and enable for output aggregation. While classification and regression problems use different approaches, they share a common approach to data classification. Regression analysis is an approach that makes use of decision trees. The gathering of multiple poor performers is what the third phase involves. The analysis gradually incorporates successive decision trees. A gradient descent technique is applied during the tree-incorporation process in order to minimize loss. Gradient boosters require the gradient component as a necessary component. The gradient descent optimization technique is applied to the model’s output in place of using the parameters of the weaker models. By altering both the gradient and the loss function, the gradient boosting strategy, which is an enhanced variant of the gradient descent method, permits generalization (Ngo et al., 2023).
Extreme Gradient Boosting, or XGBoost, is a method developed by Chen based on gradient boosting (Chen and Guestrin, 2016). In this method, the decision trees classifier is usually used as a weak model (Zounemat-Kermani et al., 2021). The projections are based on a sequence of weak learners that consistently improve the output of their predecessors. To address the overfitting problem, XGBoost adds a regularization component to the objective function given in Equation 1.
where O is objective function, R(fk) denotes the regularization term at the k iteration time, and C is a constant. To prevent overfitting, XGBoost offers regularization settings. The regularization term is expressed in Equation 2 as:
where α denotes complexity of leaves, H represents the number of leaves, η denotes the penalty parameter, and wj is the output of each leaf node. The trees are split either level-wise or according to depth by the XGBoost algorithm. Each tree in the decision-making process analyzes the feature and the threshold that corresponds with it, as well as identifying the branch impact that has the best possible outcome. Consecutive splits are used to extend the tree topologies.
Categorical Boosting (CatBoost) is a permutation-based approach that differs from conventional algorithms. It is a distinctive method for processing categorical data in data processing (Prokhorenkova et al., 2018; Dorogush et al., 2018). The proposed method includes two new concepts: ordered target statistics and ordered boosting. Hancock and Khoshgoftaar (Hancock and Khoshgoftaar, 2020) provided a thorough analysis of this method, looking at how well it works in a variety of domains for classification and regression problems. In order to manage category features, CatBoost uses target statistics as additional numerical features. This is a highly successful strategy that minimizes information loss (Prokhorenkova et al., 2018). CatBoost uses Ordered Boosting, a type of gradient-based regularization that prevents overfitting by limiting model complexity. The dataset is arranged in a random order by the algorithm, and then the mean label value for the training samples that fall into the same category inside the arrangement is calculated. Following Prokhorenkova et al. (Prokhorenkova et al., 2018), if σ = (σ1, σ2, . . ., σn) is a permutation, the category
where P is a prior value; a is the weight of the prior; Yσj is a label value; [·] denotes the Iverson bracket, namely, [xσj,k xσp,k] equals 1 if xσj,k = xσp,k, and otherwise, it is equal to 0. For further details regarding CatBoost, interested readers are referred to the publications of Prokhorenkova et al. (Prokhorenkova et al., 2018) and Dorogush et al. (Dorogush et al., 2018).
The evaluation stage involves the computation of diverse assessment metrics, encompassing, Coefficient of determination (R2), Root Mean Squared Error (RMSE), Mean Absolute Error (MAE), Mean Absolute Percentage Error (MAPE), and Mean Absolute Deviation (MAD). These metrics serve to gauge the efficacy of the model’s performance, shedding light on the extent to which the model’s predictions correlate with the actual target values. The formulations used to calculate these performance metrics are expressed in Equations 4–8.
where
Figure 3 presents the schematic view of steps of the methodology.
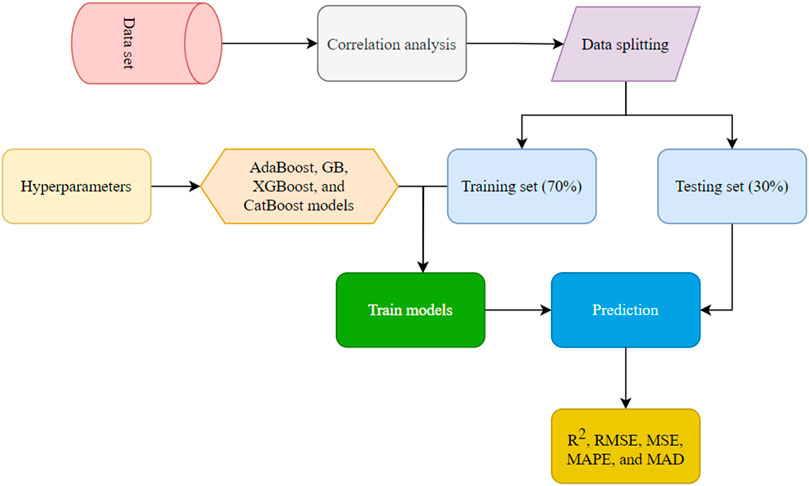
Figure 3. The methodology applied during the model development and performance evaluation.
The models for predicting the soil shear strength were developed using Orange, a popular open-source machine learning technology platform for statistical computation and data mining (Demšar et al., 2013). Orange software (version 3.32.0), developed in collaboration with the open source community at the Bioinformatics Laboratory, Faculty of Computer and Information Science, University of Ljubljana, was used to analyze the data in this work. Orange software incorporates a comprehensive range of ML algorithms that are widely utilized in research and practice. In this study, depth of sample (X1, m), sand percentage (X2), loam percentage (X3), clay percentage (X4), moisture content (X5, %), wet density (X6, g/cm3), dry density (X7, g/cm3), void ratio (X8), liquid limit (X9, %), plastic limit (X10, %), plastic index (X11), and liquidity index (X12) were the predictor variables, and shear strength of soil (Y, kg/m3) was the target variable. Every modelling stage necessitates the selection of an appropriate size of training and testing datasets. Thus, 175 data points, or 70% of the total data, were used to develop models, and 74 data points, or 30% of the data, were utilized to evaluate the models in this study. The proposed models were tweaked using trial and error to obtain optimal hyperparameter values based on accurate soil shear strength prediction. Tuning hyperparameters appropriately leads to more efficient training, better performance, and a generalizable model. This research finds the best values for some important model parameters and clarifies the definitions of these hyperparameters. During the trials, the models’ tuning parameters were chosen, and they were adjusted until the best values shown in Table 2 were achieved.
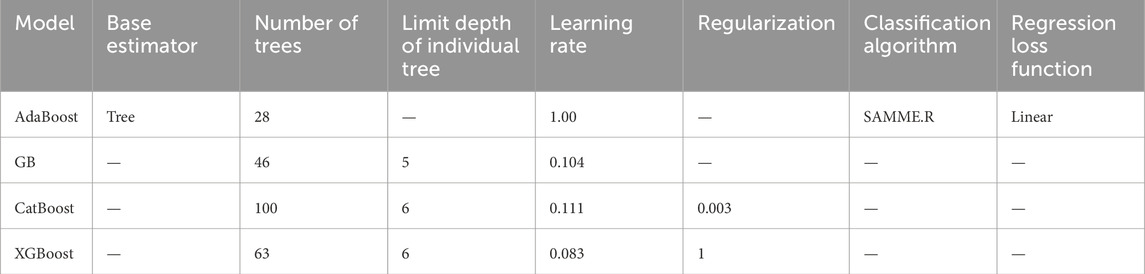
Table 2. Hyperparameter optimization results.
The efficacy of the models that were developed was assessed using a number of performance metrics, including the coefficient of determination (R2), mean absolute error (MAE), mean absolute percent error (MAPE), root mean square error (RMSE), and mean absolute deviation (MAD). Table 3 and Figures 4, 5 provide a summary of the developed models’ performance during the training and testing stages. Based on the findings, the proposed AdaBoost model achieved the highest coefficient of determination value R2 = 0.99794 and lowest values of RMSE = 0.00400, MAE = 0.00080, MAPE = 0.24390 and MAD = 0.00080 followed by the CatBoost model (R2 = 0.99651, RMSE = 0.00521, MAE = 0.00429. MAPE = 1.33450 and MAD = 0.00429) in the training phase. However, in the testing phase, the XGBoost model achieves R2 = 0.86359, RMSE = 0.03158; MAE = 0.02454, MAPE = 7.53478, and MAD = 0.02454 followed by the AdaBoost (R2 = 0.85689, RMSE = 0.03234, MAE = 0.02405, MAPE = 7.36267, and MAD = 0.02405) found slightly lower. Along the line (x = y), the scatter plot displays the predicted and actual soil shear strengths. A point on the line (x = y) represents an error-free prediction of the model’s performance; a prediction that is closer to the line (x = y) denotes a more accurate model.
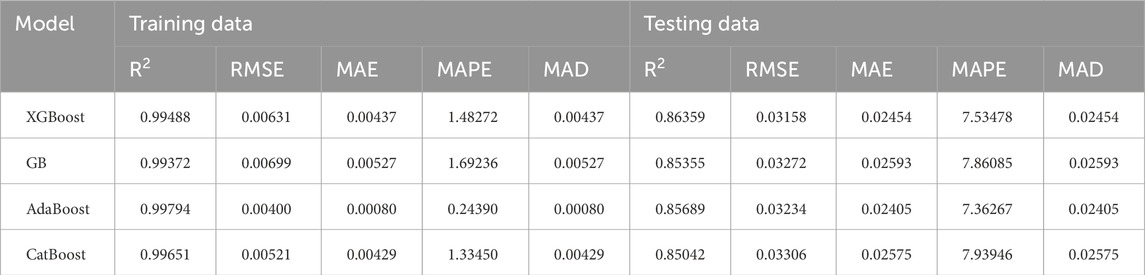
Table 3. Model performance in training and testing phases.
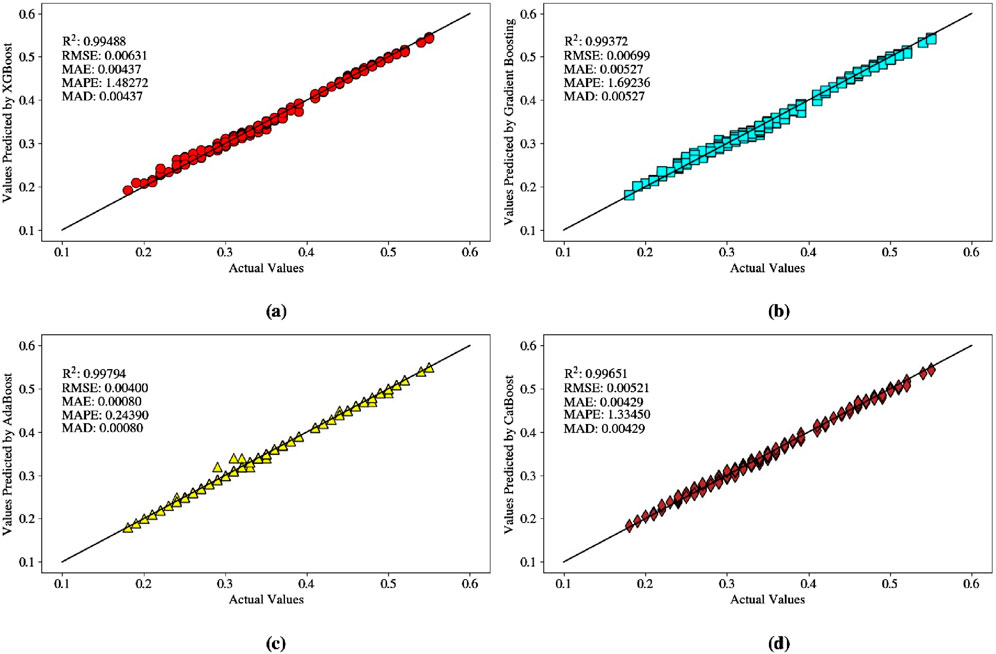
Figure 4. The predicted versus actual soil shear strength: (A) XGBoost, (B) GB, (C) AdaBoost, and (D) CatBoost models based on the training dataset.
Figure 5. The predicted versus actual soil shear strength: (A) XGBoost, (B) GB, (C) AdaBoost, and (D) CatBoost models based on the testing dataset.
The accuracy of all developed models at predicting soil shear strength values is depicted in Figures 6A–D for the training dataset and Figures 7A–D for the testing dataset. The AdaBoost model (see Figure 6C) provided the most reliable prediction, as their predicted results are sufficiently consistent with the actual shear strength values and less error values shown in this graph whereas in testing dataset XGBoost model (see Figure 7A) showed reliable prediction. It is generally visible by the larger aggregation of results around the y-axis (y = 0) by the AdaBoost model in training and testing datasets, with the exception of a few noise points. The comparative findings show that AdaBoost can predict accurately the soil shear strength values as compare to the other models (i.e., XGBoost, GB, and CatBoost) because their predicted results are sufficiently consistent with the actual shear strength values.

Figure 6. Comparison of the proposed models results in the training dataset (A) XGBoost, (B) GB, (C) AdaBoost, and (D) CatBoost in predicting soil shear strength values.
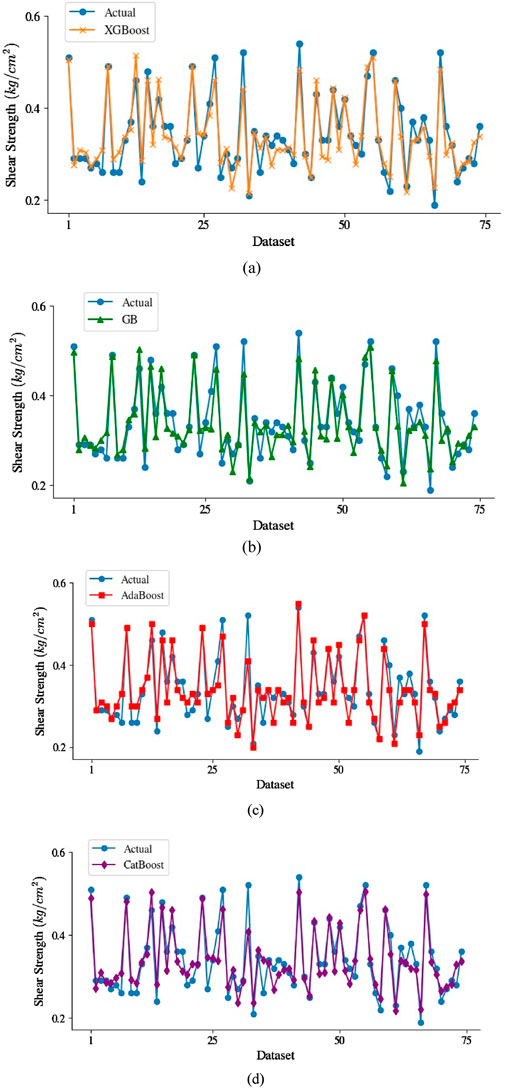
Figure 7. Comparison of the proposed models results in the testing dataset (A) XGBoost, (B) GB, (C) AdaBoost, and (D) CatBoost in predicting soil shear strength values.
Taylor diagram, a straightforward graphical representation of the relationship between predicted and actual data, is used to evaluate the effectiveness of various simulation models. It presents standard deviations, correlation coefficients, and root-mean-square (RMS) differences on a two-dimensional graph to illustrate a statistical comparison of multiple models. The radial distance from the origin is used to express the standard deviation. The difference in standard deviation units between the actual and anticipated fields determines the RMS error. The azimuthal angle is a representation of the correlation coefficient. Figure 8 shows the Taylor diagrams for testing and training datasets. It’s evident from Figure 8 that all the developed models, i.e., CatBoost, XGBoost, AdaBoost, and GB are performing better in both the testing and training phases. The dots for CatBoost and XGBoost are almost coinciding, and their performance is equally good; however, AdaBoost seems slightly better in both the training and testing phases.
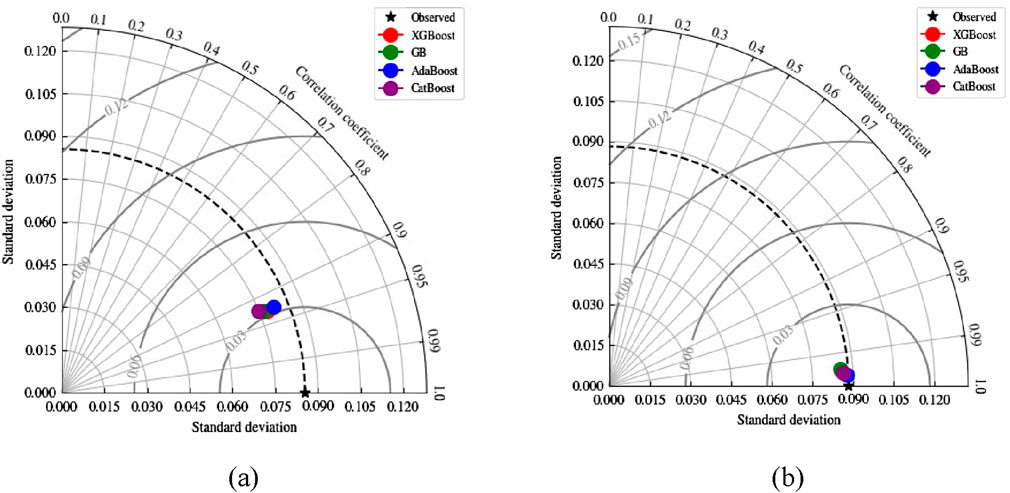
Figure 8. Taylor diagram of proposed models for (A) Training, and (B) Testing phases.
The results of the current research were also validated against literature reports on the implementation of models over the train and test modeling phases. Weights and biases are utilized as factors in order to organize the computational connection that exists among the many components of an ANN by Rabbani et al. (2023). It was determined through a procedure of trial and error how many hidden processing would be optimal for the system. In the course of this inquiry, 500 iterations were carried out to ensure that the simulations have a suitable level of reliability. The optimal hyperparamters for the various models presented in Table 4 such as SVM, BPNN, etc., readers may consult Cao et al. (2022) research paper. It is worthwhile to mention here that the data and input parameters in this study were kept the same as that of Rabbani et al. (2023) and Cao et al. (2022) owing to make a fair comparison. Table 4 represents the comparative performance of soft computing models that were studied to evaluate the suitability of soil shear strength prediction. According to the results, AdaBoost model was demonstrated as being comparatively best model with R2 = 0.8569 and RMSE = 0.0323 whereas the model BPNN developed by Cao et al. (2022) showed worse performance with R2 = 0.659 and RMSE = 0.047 in testing data. The comparative analysis results revealed that the AdaBoost model can be implemented in the future applications.
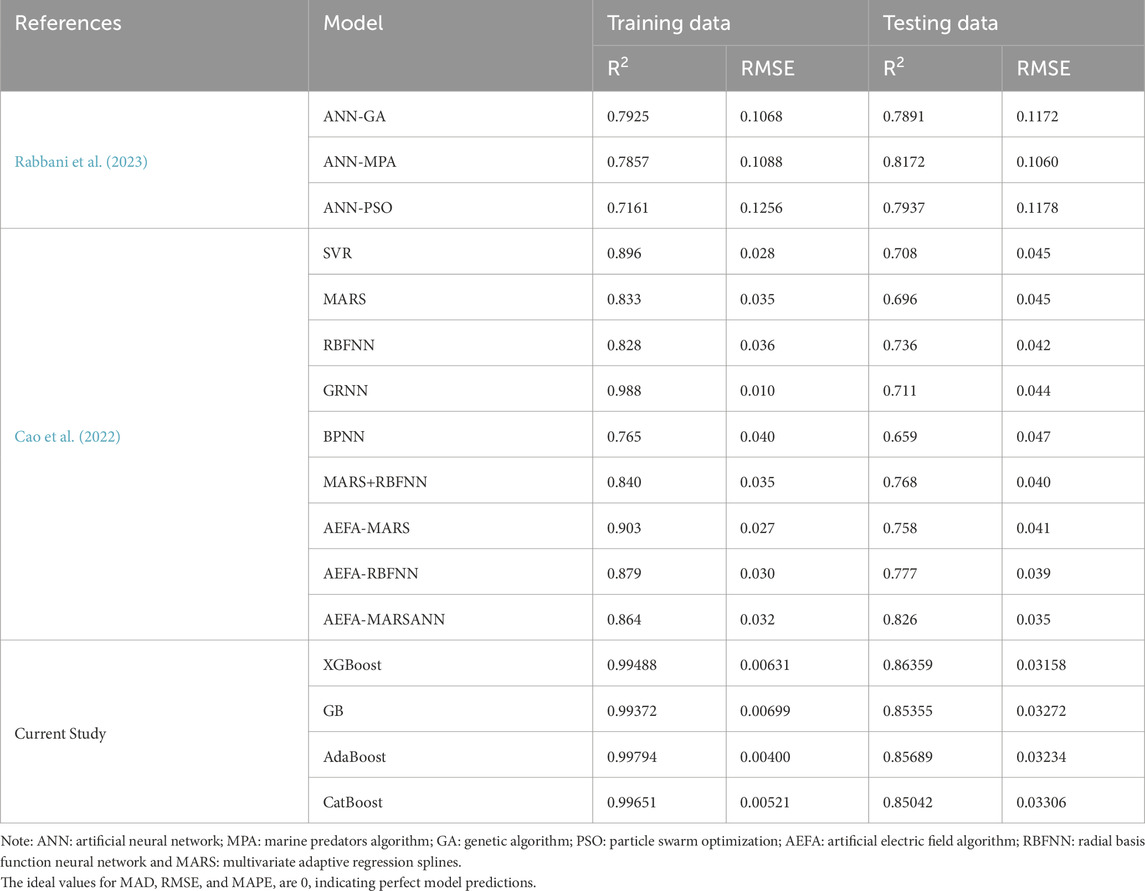
Table 4. Comparison of the developed models with available models in literature.
After calculating all the performance indices for the testing and training phase, models are ranked consequently. The ranking scores for two distinct models that produce identical results could be the equal. Ideal value of performance parameters for R2 is considered as 1, whereas for RMSE, MAE, MAPE, and MAD it is 0. On the basis of calculation for performance measures, the rank analysis of all the developed models were computed and shown in the tabular form (Table 5) to pick the best model (Xue et al., 2023). AdaBoost model overall score in both training and test phases together is 38, considerably higher than XGBoost (29), CatBoost (20), and GB (13) as in Table 5. This gives an in-depth evaluation of the model’s predictive ability and presentation (Mustafa et al., 2022). As a result, the AdBoost model outperforms the other developed models in predicting shear strength of soil. The top model received a maximum of four points (as four models were used in this study), while the worst model received one point. Following that, all of the rankings are summed together to provide a total rank, which is as well calculated in this learning process (Mustafa et al., 2022).
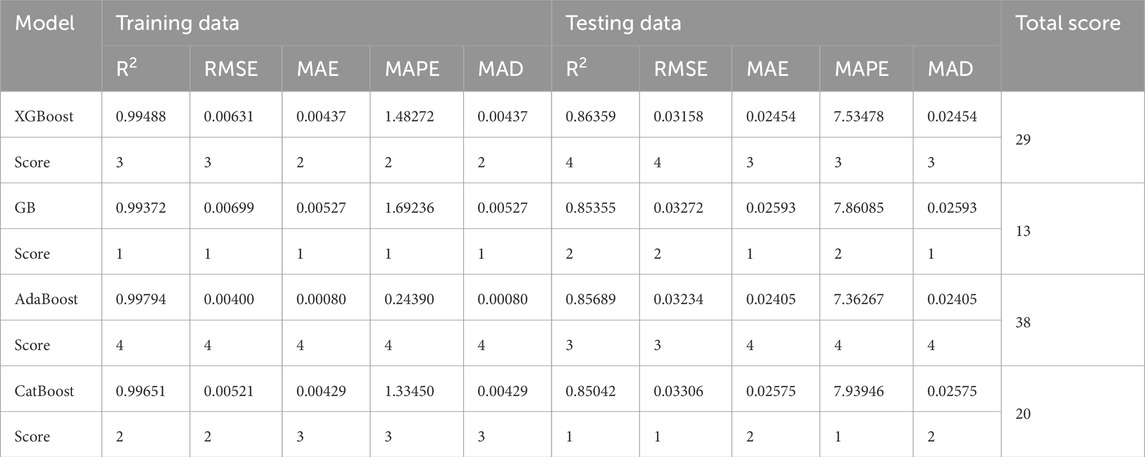
Table 5. Rank analysis of developed models.
Lundberg and Lee’s SHapley Additive ExPlanations (SHAP) technique explains how to predict instance x by examining the relative value of each characteristic in the prediction process. The basic concept behind the plot is that features having higher SHAP values hold more importance. The dots indicate the Shapely explanatory values calculated for each instance in the dataset such that red denotes greater values while blue denotes lower values. The SHAP summary chart takes into account the importance and impact of each feature. In the summary graphic, the Shapley value of each feature and occurrence is represented by a dot. A coordinate system’s horizontal axis is determined by the Shapley value, whereas its vertical axis is determined by a particular attribute. A chromatic gradient that goes from the least intense to the most intense hue indicates the relative value of a feature. The attributes listed are arranged according to relative importance in a hierarchical format. The impact’s polarity—positive or negative—is indicated by the horizontal axis. Red and blue are used as chromatic markers to indicate feature values; greater feature values are indicated by red, and lower feature values are indicated by blue. The inputs having high importance are present on the top and their importance decreases going from top to bottom. The result of Shapley analysis based on the AdaBoost model in the form of summary plot is given in Figure 9. Notice that most of the red points are located at the negative side of Shap values in front of liquidity index (X12). Since red colour indicates higher values, it means that an increase in liquidity index (X12) will have a negative Shap value and consequently a negative impact on the output (shear strength in this case). Higher values of liquidity index (X12) increase the shear strength significantly, while lower values of wet density (X6) and loam percentage (X3) decreases the shear strength of soil significantly. After liquidity index (X12), wet density (X6) is the next most important variable having both red and blue points in a continuous manner within a range lesser than liquidity index (X12). Furthermore, the void ratio (X8) variable does not have a significant impact on the prediction of shear strength of soil. It is important to mention here that very low impact polarity values on the horizontal axis of a Shapley values might be very low due to limited data variety. Since, the data was collected from an actual building job, it became much clearer that the soil in the region that was the subject of the study has distinctive qualities. This led to a lower value for critical elements, which in turn led to the shear strength of soil having a lower value. Small datasets present unique challenges that can affect the Shapley values, which are calculated based on the contribution of each feature to the model’s prediction.
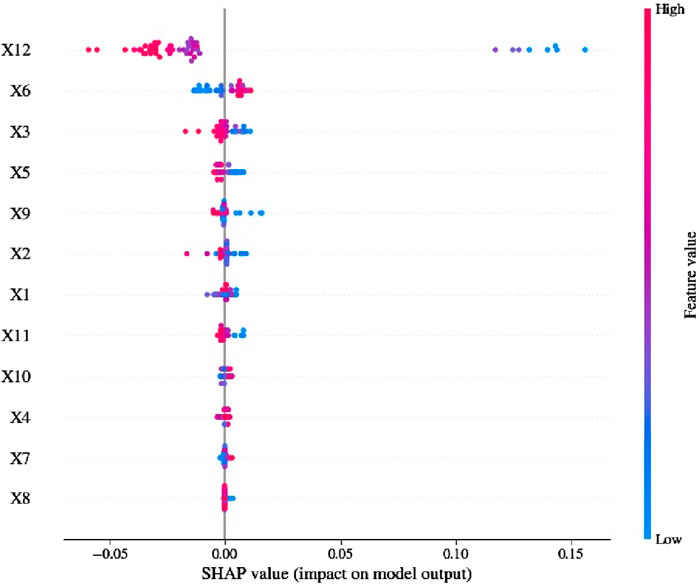
Figure 9. SHAP diagram for the AdaBoost model.
In this research study, the ML algorithms such as XGBoost, GB, AdaBoost, and CatBoost were used to predict the soil shear strength. The performance of the developed models was evaluated using statistical metrics such as R2, RMSE, MAE, MAPE, and MAD and compared to the available soft computing models developed recently in the literature. The following are the main findings based on the results.
(1) The rank analysis of AdaBoost model in training and test phases together is 38, considerably higher than XGBoost (29), CatBoost (20), and GB (13). As a result, the AdaBoost outperforms the other developed models in predicting shear strength of soil.
(2) The new proposed models i.e., XGBoost, GB, AdaBoost, and CatBoost have the highest performance capability as compare to available models developed recently in literature with less variation in the actual and predicted values in terms of errors in the training and test sets. The coefficient of determination value in the training phase is highest for AdaBoost (0.9979). In the testing phase, XGBoost (0.86359) have a slight lead over AdaBoost (0.8569).
(3) The validation of developed models was done using a variety of error metrics such as RMSE, MAE, MAPE, MAD, and the findings showed that developed models fulfilled the standards that the literature suggested being accepted.
(4) The Shapley analysis results show that feature liquidity index (X12) is the variable that has the greatest influence on soil shear strength, followed by wet density (X6). Higher value of liquidity index (X12) increase the soil shear strength significantly, while lower values of plastic index (X11) and loam percentage (X3) decreases the soil shear strength significantly. The void ratio (X8) variable does not have a significant impact on the prediction of soil shear strength.
The accuracy and reliability of predictions provided by the presented models improve when interpolation is employed, as opposed to extrapolation, owing to the use of input values. Therefore, the models should not be applied to input parameter values outside of the range specified by the study. It should be noted that the accuracy and reliability of machine learning algorithms are affected by the dataset, such as the number and kind of samples. Therefore, additional samples should be collected and more effective models should be suggested in the future.
The original contributions presented in the study are included in the article/Supplementary Material, further inquiries can be directed to the corresponding author.
MA: Conceptualization, Formal Analysis, Investigation, Methodology, Software, Visualization, Writing–original draft, Writing–review and editing. MAZ: Data curation, Funding acquisition, Resources, Software, Validation, Writing–review and editing. HA: Data curation, Formal Analysis, Project administration, Supervision, Writing–review and editing. MS: Funding acquisition, Investigation, Methodology, Resources, Software, Supervision, Validation, Writing–review and editing. JM: Data curation, Formal Analysis, Investigation, Resources, Writing–review and editing. SH: Investigation, Software, Validation, Writing–review and editing. TO: Formal Analysis, Funding acquisition, Methodology, Project administration, Writing–review and editing. AA: Data curation, Formal Analysis, Validation, Visualization, Writing–review and editing.
The author(s) declare that financial support was received for the research, authorship, and/or publication of this article. This research was funded by Taif University, Saudi Arabia, Project No. (TU-DSPP-2024-33). Furthermore, the research is partially funded by the Ministry of Science and Higher Education of the Russian Federation as part of the World-Class Research Center program: Advanced Digital Technologies (contract No. 075-15-2022-311 dated 20.04.2022).
The authors extend their appreciation to Taif University, Saudi Arabia, for supporting this work through project number (TU-DSPP-2024-33).
The authors declare that the research was conducted in the absence of any commercial or financial relationships that could be construed as a potential conflict of interest.
The author(s) declare that no Generative AI was used in the creation of this manuscript.
All claims expressed in this article are solely those of the authors and do not necessarily represent those of their affiliated organizations, or those of the publisher, the editors and the reviewers. Any product that may be evaluated in this article, or claim that may be made by its manufacturer, is not guaranteed or endorsed by the publisher.
The Supplementary Material for this article can be found online at: https://www.frontiersin.org/articles/10.3389/feart.2025.1542291/full#supplementary-material
Abdullah, G. M. S., Ahmad, M., Babur, M., Badshah, M. U., Al-Mansob, R. A., Gamil, Y., et al. (2024). Boosting-based ensemble machine learning models for predicting unconfined compressive strength of geopolymer stabilized clayey soil. Sci. Rep. 14 (1), 2323. doi:10.1038/s41598-024-52825-7
Ahmad, F., Tang, X. W., Ahmad, M., González-Lezcano, R. A., Majdi, A., and Arbili, M. M. (2023a). Stability risk assessment of slopes using logistic model tree based on updated case histories. Math. Biosci. Eng. 20 (12), 21229–21245. doi:10.3934/mbe.2023939
Ahmad, F., Tang, X. W., Qiu, J. N., Wróblewski, P., Ahmad, M., and Jamil, I. (2022b). Prediction of slope stability using Tree Augmented Naive-Bayes classifier: modeling and performance evaluation. Math. Biosci. Eng. 19 (5), 4526–4546. doi:10.3934/mbe.2022209
Ahmad, M., Al-Mansob, R. A., Kashyzadeh, K. R., Keawsawasvong, S., Sabri Sabri, M. M., Jamil, I., et al. (2022d). Extreme gradient boosting algorithm for predicting shear strengths of rockfill materials. Complexity 2022 (1), 9415863. doi:10.1155/2022/9415863
Ahmad, M., Al-Mansob, R. A., Ramli, A. B. B., Ahmad, F., and Khan, B. J. (2023b). Unconfined compressive strength prediction of stabilized expansive clay soil using machine learning techniques. Multiscale Multidiscip. Model. Exp. Des. 7, 217–231. doi:10.1007/s41939-023-00203-7
Ahmad, M., Amjad, M., Al-Mansob, R., Kamiński, P., Olczak, P., Khan, B., et al. (2022a). Prediction of liquefaction-induced lateral displacements using Gaussian process regression. Appl. Sci. (Basel). 12 (4), 1977. doi:10.3390/app12041977
Ahmad, M., Al-Mansob, R. A., Kashyzadeh, K. R., Keawsawasvong, S., Sabri Sabri, M. M., Jamil, I., et al. (2022c). Research article Extreme gradient boosting algorithm for predicting shear strengths of rockfill materials. Complexity. 1 9415863. doi:10.1155/2022/9415863
Ahmad, M., Katman, H. Y., Al-Mansob, R. A., Ahmad, F., Safdar, M., and Alguno, A. C. (2022e). Prediction of rockburst intensity grade in deep underground excavation using adaptive boosting classifier. Complexity 2022 (1), 6156210. doi:10.1155/2022/6156210
Ahmad, M., Tang, X. W., Qiu, J. N., Ahmad, F., and Gu, W. J. (2021). Application of machine learning algorithms for the evaluation of seismic soil liquefaction potential. Front. Struct. Civ. Eng. 15, 490–505. doi:10.1007/s11709-020-0669-5
Armaghani, D. J., Hajihassani, M., Mohamad, E. T., Marto, A., and Noorani, S. A. (2014). Blasting-induced flyrock and ground vibration prediction through an expert artificial neural network based on particle swarm optimization. Arab. J. Geosci. 7, 5383–5396. doi:10.1007/s12517-013-1174-0
Armaghani, D. J., Mohamad, E. T., Narayanasamy, M. S., Narita, N., and Yagiz, S. (2017). Development of hybrid intelligent models for predicting TBM penetration rate in hard rock condition. Tunn. Undergr. Space Technol. 63, 29–43. doi:10.1016/j.tust.2016.12.009
Asteris, P. G., Lourenço, P. B., Roussis, P. C., Elpida Adami, C., Armaghani, D. J., Cavaleri, L., et al. (2022b). Revealing the nature of metakaolin-based concrete materials using artificial intelligence techniques. Constr. Build. Mater. 322, 126500. doi:10.1016/j.conbuildmat.2022.126500
Asteris, P. G., Rizal, F. I. M., Koopialipoor, M., Roussis, P. C., Ferentinou, M., Armaghani, D. J., et al. (2022a). Slope stability classification under seismic conditions using several tree-based intelligent techniques. Appl. Sci. (Basel). 12 (3), 1753. doi:10.3390/app12031753
Aurélien, G. (2019). Hands-on machine learning with Scikit-Learn, Keras, and TensorFlow: concepts, tools, and techniques to build intelligent systems. Farnham, United Kingdom: O'Reilly UK Ltd.
Barkhordari, M. S., Barkhordari, M. M., Armaghani, D. J., and Mohamad, E. T. (2023). Straightforward slope stability prediction under seismic conditions using machine learning algorithms. [Preprint]. doi:10.21203/rs.3.rs-3575223/v1
Cao, M.-T., Hoang, N. D., Nhu, V. H., and Bui, D. T. (2022). An advanced meta-learner based on artificial electric field algorithm optimized stacking ensemble techniques for enhancing prediction accuracy of soil shear strength. Eng. Comput. 38 (3), 2185–2207. doi:10.1007/s00366-020-01116-6
Chen, T., and Guestrin, C. (2016). Xgboost: a scalable tree boosting system. Proc. 22nd acm sigkdd Int. Conf. Knowl. Discov. data Min., 785–794. doi:10.1145/2939672.2939785
Demšar, J., Curk, T., Erjavec, A., Gorup, Č., Hočevar, T., Milutinovič, M., et al. (2013). Orange: data mining toolbox in Python. J. Mach. Learn. Res. 14 (1), 2349–2353. doi:10.5555/2567709.2567736
Dorogush, A. V., Ershov, V., and Gulin, A. J. (2018). CatBoost: gradient boosting with categorical features support. arXiv. doi:10.48550/arXiv.1810.11363
Eid, H. T., and Rabie, K. H. (2017). Fully softened shear strength for soil slope stability analyses. Int. J. Geomechanics 17 (1), 04016023. doi:10.1061/(asce)gm.1943-5622.0000651
Fan, S., He, T., Li, W., Zeng, C., Chen, P., Chen, L., et al. (2024). Machine learning-based classification of quality grades for concrete vibration behaviour. Autom. Constr. 167, 105694. doi:10.1016/j.autcon.2024.105694
Freund, Y., and Schapire, R. E. (1997). A decision-theoretic generalization of on-line learning and an application to boosting. J. Comput. Syst. Sci. 55 (1), 119–139. doi:10.1006/jcss.1997.1504
Gao, Y., Sun, D., Zhou, A., and Li, J. (2020). Predicting shear strength of unsaturated soils over wide suction range. Int. J. Geomechanics 20 (2), 04019175. doi:10.1061/(asce)gm.1943-5622.0001555
Garven, E., and Vanapalli, S. (2006). Evaluation of empirical procedures for predicting the shear strength of unsaturated soils. Unsaturated soils 2006, 2570–2592. doi:10.1061/40802(189)219
Hancock, J. T., and Khoshgoftaar, T. M. J. J. O.B.D. (2020). CatBoost for big data: an interdisciplinary review. J. Big Data 7 (1), 94–45. doi:10.1186/s40537-020-00369-8
Hua, L., Tian, Y., Gui, Y., Liu, W., and Wu, W. (2024). Semi-analytical study of pile–soil interaction on a permeable pipe pile subjected to rheological consolidation of clayey soils. Int. J. Numer. Anal. Methods Geomechanics 49 (39). doi:10.1002/nag.3915
Islam, S., and Amin, S. H. (2020). Prediction of probable backorder scenarios in the supply chain using Distributed Random Forest and Gradient Boosting Machine learning techniques. J. Big Data 7, 65–22. doi:10.1186/s40537-020-00345-2
Koopialipoor, M., Tootoonchi, H., Jahed Armaghani, D., Tonnizam Mohamad, E., and Hedayat, A. (2019). Application of deep neural networks in predicting the penetration rate of tunnel boring machines. Bull. Eng. Geol. Environ. 78, 6347–6360. doi:10.1007/s10064-019-01538-7
Kutner, M. H., Nachtsheim, C. J., Neter, J., and Li, W. (2005). Applied linear statistical models. Boston, United States: McGraw-Hill.
Li, D., Liu, Z., Armaghani, D. J., Xiao, P., and Zhou, J. (2022). Novel ensemble tree solution for rockburst prediction using deep forest. Math. (Basel). 10 (5), 787. doi:10.3390/math10050787
Li, X., Zhang, L., Xiao, T., Zhang, S., and Chen, C. (2019). Learning failure modes of soil slopes using monitoring data. Probabilistic Eng. Mech. 56, 50–57. doi:10.1016/j.probengmech.2019.04.002
Lü, Q., Liu, S. H., Mao, W. Z., Yu, Y., and Long, X. (2024). A numerical simulation-based ANN method to determine the shear strength parameters of rock minerals in nanoscale. Comput. Geotech. 169, 106175. doi:10.1016/j.compgeo.2024.106175
Murthy, V. (2009). Geotechnical engineering: principles and practices of soil mechanics. CRC. doi:10.1201/9781482275858
Mustafa, R., Samui, P., and Kumari, S. J. I. (2022). Reliability analysis of gravity retaining wall using hybrid ANFIS. Infrastructures (Basel). 7 (9), 121. doi:10.3390/infrastructures7090121
Ngo, A. Q., Nguyen, L. Q., and Tran, V. Q. (2023). Developing interpretable machine learning-Shapley additive explanations model for unconfined compressive strength of cohesive soils stabilized with geopolymer. Plos one 18 (6), e0286950. doi:10.1371/journal.pone.0286950
Nguyen, Q. H., Ly, H. B., Ho, L. S., Al-Ansari, N., Le, H. V., Tran, V. Q., et al. (2021). Influence of data splitting on performance of machine learning models in prediction of shear strength of soil. Math. Probl. Eng. 2021, 1–15. doi:10.1155/2021/4832864
Noman, M., Khattak, A., Alam, Z., Yaqub, M., and Noroozinejad Farsangi, E. (2024). Predicting the residual compressive strength of concrete exposed to elevated temperatures using interpretable machine learning. Pract. Period. Struct. Des. Constr. 29 (4), 04024055. doi:10.1061/ppscfx.sceng-1536
Pham, B. T., Qi, C., Ho, L. S., Nguyen-Thoi, T., Al-Ansari, N., Nguyen, M. D., et al. (2020). A novel hybrid soft computing model using random forest and particle swarm optimization for estimation of undrained shear strength of soil. Sustainability 12 (6), 2218. doi:10.3390/su12062218
Pham, B. T., Son, L. H., Hoang, T. A., Nguyen, D. M., and Tien Bui, D. (2018). Prediction of shear strength of soft soil using machine learning methods. Catena 166, 181–191. doi:10.1016/j.catena.2018.04.004
Prokhorenkova, L., Gusev, G., Vorobev, A., Dorogush, A. V., and Gulin, A. (2018). CatBoost: unbiased boosting with categorical features. arXiv 31. doi:10.48550/arXiv.1706.09516
Rabbani, A., Samui, P., and Kumari, S. J. A. J. O.C. E. (2023). Optimized ANN-based approach for estimation of shear strength of soil. Asian J. Civ. Eng. 24, 3627–3640. doi:10.1007/s42107-023-00739-6
Schapire, R. E. (1990). The strength of weak learnability. Mach. Learn. 5, 197–227. doi:10.1007/bf00116037
Schapire, R. E. (2013). “Explaining adaboost,” in Empirical inference: festschrift in honor of vladimir N. Vapnik (Springer), 37–52.
Shan, Y., Tan, S., Cui, J., Yuan, J., Li, Y., and Huang, Z. (2025). Effect of plastic fine particles on shear strength at the critical state of sand-clay mixture. Can. Geotechnical J 62, 1–21. doi:10.1139/cgj-2023-0618
Shu, J., Zhang, X., Li, W., Zeng, Z., Zhang, H., and Duan, Y. (2024). Point cloud and machine learning-based automated recognition and measurement of corrugated pipes and rebars for large precast concrete beams. Autom. Constr. 165, 105493. doi:10.1016/j.autcon.2024.105493
Tien Bui, D., Hoang, N.-D., and Nhu, V.-H. J. E. W.C. (2019). A swarm intelligence-based machine learning approach for predicting soil shear strength for road construction: a case study at Trung Luong National Expressway Project (Vietnam). Eng. Comput. 35 (3), 955–965. doi:10.1007/s00366-018-0643-1
Vanapalli, S., and Fredlund, D. (2000). Comparison of different procedures to predict unsaturated soil shear strength. Adv. unsaturated geotechnics, 195–209. doi:10.1061/40510(287)13
Wang, J., Lin, S. Q., Tan, D. Y., Yin, J. H., Zhu, H. H., and Kuok, S. C. (2024). A novel method for integrity assessment of soil-nailing works with actively heated fiber-optic sensors. J. Geotech. Geoenviron. Eng. 150 (8), 04024063. doi:10.1061/jggefk.gteng-11790
Xu, D.-S., Yan, J.-M., and Liu, Q. J. G. I. (2021). Behavior of discrete fiber-reinforced sandy soil in large-scale simple shear tests. Geosynth. Int. 28 (6), 598–608. doi:10.1680/jgein.21.00007
Xue, X., Makota, C., Khalaf, O. I., Jayabalan, J., Samui, P., and Abdulsahib, G. M. (2023). Machine learning approach for prediction of lateral confinement coefficient of CFRP-wrapped RC columns. Symmetry (Basel). 15 (2), 545. doi:10.3390/sym15020545
Yu, J., Zhu, Y., Yao, W., Liu, X., Ren, C., Cai, Y., et al. (2021). Stress relaxation behaviour of marble under cyclic weak disturbance and confining pressures. Measurement 182, 109777. doi:10.1016/j.measurement.2021.109777
Zhang, J., Zhang, C. J. S. D., and Engineering, E. (2023). Using viscoelastic materials to mitigate earthquake-induced pounding between adjacent frames with unequal height considering soil-structure interactions. Soil Dyn. Earthq. Eng. 172, 107988. doi:10.1016/j.soildyn.2023.107988
Zhou, G., Wang, Z., and Li, Q. J. R. S. (2022). Spatial negative co-location pattern directional mining algorithm with join-based prevalence. Remote Sens. (Basel). 14 (9), 2103. doi:10.3390/rs14092103
Zi, J., Liu, T., Zhang, W., Pan, X., Ji, H., and Zhu, H. (2024). Quantitatively characterizing sandy soil structure altered by MICP using multi-level thresholding segmentation algorithm. J. Rock Mech. Geotechnical Eng. 16, 4285–4299. doi:10.1016/j.jrmge.2023.11.025
Zou, B., Yin, J., Liu, Z., and Long, X. (2024). Transient rock breaking characteristics by successive impact of shield disc cutters under confining pressure conditions. Tunn. Undergr. Space Technol. 150, 105861. doi:10.1016/j.tust.2024.105861
Keywords: shear strength, XGBoost, Adaboost, gradient boosting, CatBoost, SHapley additive exPlanations analysis
Citation: Ahmad M, Al Zubi M, Almujibah H, Sabri Sabri MM, Mustafvi JB, Haq S, Ouahbi T and Alzlfawi A (2025) Improved prediction of soil shear strength using machine learning algorithms: interpretability analysis using SHapley Additive exPlanations. Front. Earth Sci. 13:1542291. doi: 10.3389/feart.2025.1542291
Received: 09 December 2024; Accepted: 28 January 2025;
Published: 28 February 2025.
Edited by:
Marcelo Cohen, Federal University of Pará, BrazilReviewed by:
Muhammad Noman, International Islamic University, PakistanCopyright © 2025 Ahmad, Al Zubi, Almujibah, Sabri Sabri, Mustafvi, Haq, Ouahbi and Alzlfawi. This is an open-access article distributed under the terms of the Creative Commons Attribution License (CC BY). The use, distribution or reproduction in other forums is permitted, provided the original author(s) and the copyright owner(s) are credited and that the original publication in this journal is cited, in accordance with accepted academic practice. No use, distribution or reproduction is permitted which does not comply with these terms.
*Correspondence: Mahmood Ahmad, YWhtYWRtQHVldHBlc2hhd2FyLmVkdS5waw==
Disclaimer: All claims expressed in this article are solely those of the authors and do not necessarily represent those of their affiliated organizations, or those of the publisher, the editors and the reviewers. Any product that may be evaluated in this article or claim that may be made by its manufacturer is not guaranteed or endorsed by the publisher.
Research integrity at Frontiers
Learn more about the work of our research integrity team to safeguard the quality of each article we publish.