 Di Wu1
 Taiming Liang
 Yanxin Yang
 Yang Yi
94% of researchers rate our articles as excellent or good
Learn more about the work of our research integrity team to safeguard the quality of each article we publish.
Find out more
ORIGINAL RESEARCH article
Front. Earth Sci. , 17 March 2025
Sec. Geohazards and Georisks
Volume 13 - 2025 | https://doi.org/10.3389/feart.2025.1541217
This article is part of the Research Topic Prevention, Mitigation, and Relief of Compound and Chained Natural Hazards Volume II View all 14 articles
Introduction: The monitoring of soil displacement during highway slope instability currently faces challenges such as poor stability, low accuracy, and high costs. In this study, a Micro-Electro-Mechanical System (MEMS) sensor is proposed for measuring internal soil displacement during slope movement. A method for converting MEMS-based acceleration signals into displacement data is also developed.
Methods: To evaluate the applicability of MEMS technology for deep displacement monitoring, an indoor model test was conducted using a highway slope composed of gravelly soil from Jiangxi Province as a case study. Three slope models with varying gravel contents (20%, 40%, and 60%) were designed to simulate displacement caused by slope instability. Displacement data obtained from the MEMS sensors were analyzed and compared with Particle Image Velocimetry (PIV) data.
Results and Discussion: The results showed that the average relative errors of vertical displacement for the MEMS sensor compared to PIV at three measurement points in the sliding area were 5.79%, 5.54%, and 5.89% for slopes with 20%, 40%, and 60% gravel content, respectively. Similarly, the average relative errors of horizontal displacement were 6.11%, 5.21%, and 4.73%. These findings indicate that the trends in soil movement within the sliding area correspond to changes in gravel content. Furthermore, the relatively small average relative errors of the MEMS sensor demonstrate its feasibility and potential for deep soil displacement monitoring in slope stability studies.
Among the various types of road hazards (Li et al., 2016; Wen and Jiang, 2017; Liao et al., 2018), the destabilization of highway cut slopes poses a particularly significant risk (Ren et al., 2021; Zhang et al., 2022; Zhou et al., 2023; Ren et al., 2024; Guthrie et al., 2009). In practical engineering scenarios, highway slopes are often composed predominantly of gravelly soils, characterized by the presence of lumps and gravels with inter-particle disorder. Key external factors contributing to slope destabilization include rainfall, seismic activity, blasting operations, and excavation at the slope base. Among these, gravel content plays a critical role in influencing the stability of gravelly soil slopes, significantly impacting their physical and mechanical properties as well as their deformation characteristics.
In studies on the influence of gravel on slope stability, Fang (Fang et al., 2024; Fang et al., 2023a) used particle image velocimetry (PIV) to conduct physical model tests, the analysis revealed that soil arches expand and elongate during excavation. The inverse velocity method proved effective for predicting slope failure time. Li and Hu (Li et al., 2024) using the Zaharnur open-pit coal mine in China as a prototype, investigated the arching effect unique to soft rocks. Based on the deformation characteristics of the slope, they proposed that the optimal ratio ranges of slope excavation width to the height and width of the outermost crack are 0.36–0.49 and 0.72–1.00, respectively. Bai and Wang (Wang et al., 2024a) investigated confluence flow generation on slopes with varying gradients and gravel cover conditions. Their results showed that gravel cover effectively reduces runoff under low rainfall intensities. Additionally, the lattice Boltzmann model accurately simulated soil flow formation. Bian and Wang (Bian et al., 2024) conducted consolidated undrained triaxial shear tests on modified gravel soil specimens and observed that gravel soil exhibits greater compactness and higher load-bearing capacity compared to homogeneous soil of equivalent volume. Numerical simulations further revealed that a threshold gravel content of 30% significantly influences the mechanical properties and deformation characteristics of the soil. In model test studies on slope displacement monitoring, Park and Lim (Park et al., 2019) integrated sensors with an Internet of Things (IoT) system to monitor slope damage using modeled slope cutting tests. Their proposed instrumentation standard relies on cumulative and inverse displacement trends. Wang and Peng (Wang et al., 2024b) developed a multi-degree-of-freedom method for monitoring slope displacement and conducted experiments to evaluate its accuracy and stability. Experimental results demonstrated that the measurement error was less than 1 mm for distances under 40 m and less than 5 mm for a distance of 90 m. Numerous studies (Liu et al., 2018; Wang et al., 2022a; Sheng et al., 2024; Wang et al., 2022b) have highlighted the significant impact of gravel content on the shear strength of gravelly soil slopes, which directly influences slope displacement during instability. Understanding the internal deformation characteristics of slopes is therefore critical for analyzing highway cut slope instability. Current methods for monitoring deep slope displacements include optical fiber sensing, ground-penetrating radar (GPR), and time domain reflectometry (TDR). Optical fiber sensors (Wu et al., 2019) measure surface deformation by detecting strain within embedded fibers, offering high accuracy but limited effectiveness in detecting large deformations in deep soils. GPR (Liu et al., 2024; Pajewski and Benedetto, 2012) provides high-precision subsurface imaging using electromagnetic radiation but is cost-prohibitive for widespread adoption. TDR (Guan et al., 2013; Ho et al., 2019), which relies on electrical pulse signals to detect deformation, offers convenience but lacks the ability to accurately determine displacement depth and is prone to measurement errors. These limitations indicate the need for a novel, reliable technique for monitoring deep slope displacements.
In recent years, advancements in MEMS technology have inspired novel applications proposed by researchers (Algamili et al., 2021; Gutierrez et al., 2023; Ge et al., 2024; Victor, 2023; Barzegar et al., 2022). The core principle of MEMS accelerometers is to capture acceleration signals from soil bodies. By applying dynamic solution algorithms combined with Kalman filtering for dynamic estimation, displacement information can be accurately derived from acceleration data, enabling precise soil movement monitoring. Li and Song (Li et al., 2023) introduced a method for real-time monitoring of reservoir bank slope deformation using MEMS inertial sensors. Their approach extended traditional displacement measurement by incorporating rotational angle analysis. Using inertial navigation principles, linear acceleration and angular velocity were converted into motion velocity and displacement at observation points, facilitating early slope failure detection. Tao and Yang (Tao et al., 2021) developed a novel dam stability sensing system utilizing a dual MEMS sensor structure embedded within the dam. This system converted spatial deflection and torsion angle outputs into endpoint coordinates of the sensor array, which were then used to calculate dam settlement displacement values. Additionally, numerous researchers (Freddi et al., 2023; Shentu et al., 2020; Ge et al., 2021; Abraham et al., 2022; Najafabadi et al., 2024; Jiao et al., 2023) have designed a variety of MEMS-based deep displacement sensing devices for flexible geotechnical structures. These devices have been successfully applied in engineering projects, including slopes and excavation pits. In summary, MEMS inertial sensors demonstrate exceptional performance in monitoring various geotechnical structures, offering significant potential for practical applications.
This study investigates the feasibility of using MEMS technology for monitoring displacement data under highway slope instability. Based on a real gravelly soil slope project, three slope instability tests were designed with varying gravel contents (20%, 40%, 60%) (Zhang et al., 2023). The displacement data captured by MEMS sensors were compared with those obtained through Particle Image Velocimetry (PIV). Additionally, the study evaluates the effectiveness of MEMS in slope displacement monitoring and explores the influence of gravel content variations on slope displacement during failure events.
The processing of deep soil displacement signals primarily focuses on the precise acquisition of linear acceleration from the moving soil. Before further analysis, the acceleration signal from the sensor must undergo several preprocessing steps. The first step involves eliminating zero-bias and random errors. To correct for zero-bias error in the acceleration signal, the de-mean method is applied (Zhang et al., 2020). Consider the X-axis as an example. After embedding the sensor module in the soil and initiating accelerometer calibration via the host computer’s software, the sensor’s default navigation coordinate system is transformed into the carrier coordinate system, aligned with the target measurement point. In this setup, the coordinate system is centered at the sensor measurement point, and the X-axis ideally outputs 0 m/s2, though occasional zero-bias errors may occur. To address these errors, the sensor is left stationary for a duration of t minutes, during which n acceleration data points are collected and averaged. The average of the sampled acceleration data and individual sampled acceleration values as shown in Equations 1, 2.
To eliminate random errors, a wavelet threshold denoising function (Hu et al., 2023) was applied to remove the noise component from the signal. Additionally, a least squares method was employed to correct for baseline drift during sensor displacement.
The acquired acceleration values are adjusted by subtracting the components of gravitational acceleration (gx, gy, gz) along each axis of the carrier coordinate system, thereby filtering out the gravity component. Taking the X-axis linear acceleration as an example, it is expressed by the following equation, with similar expressions for the Y-axis and Z-axis. The sampled linear acceleration as shown in Equation 3.
Following the preprocessing of the acceleration signal, the three-axis linear acceleration can be derived. This linear acceleration is then numerically integrated to obtain the sensor’s linear velocity, and a second integration provides the three-axis linear displacement of the sensor. In this study, Simpson’s rule is employed for the integration of both linear acceleration and velocity. This method has been shown to offer superior stability compared to the Newton-Cotes formula and greater precision than the trapezoidal rule. The velocity and displacement are obtained from Equations 4, 5.
t = 0,1,2, N-1,
The objective of this study is to validate the effectiveness of the time-domain integration algorithm in processing the original acceleration signal and assess the accuracy of the resulting displacement signal. To achieve this, a sliding rail test is designed for verification. The test setup consists of a linear track, 1 m in length, with a slider attached. Before initiating the test, the sensor is securely bonded to the slider to ensure that the sensor’s motion is synchronized with that of the slider. The entire test process is documented via video. A schematic diagram of the fixed-distance sliding rail test is provided in Figure 1.
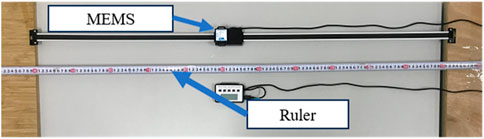
Figure 1. Fixed-distance sliding rail test.
The experimental design consisted of ten distinct groups. The aggregate results from these ten sets of fixed-distance sliding rail tests are summarized in Table 1 To further assess the distribution of the algorithmic displacement values, the Quantile-Quantile (Q-Q) and error bar plot were examined. As shown in Figures 2, 3, the algorithmic displacement values are predominantly clustered around the reference line, thereby supporting the hypothesis that the fixed-distance sliding rail test results obtained from the algorithm are normally distributed.
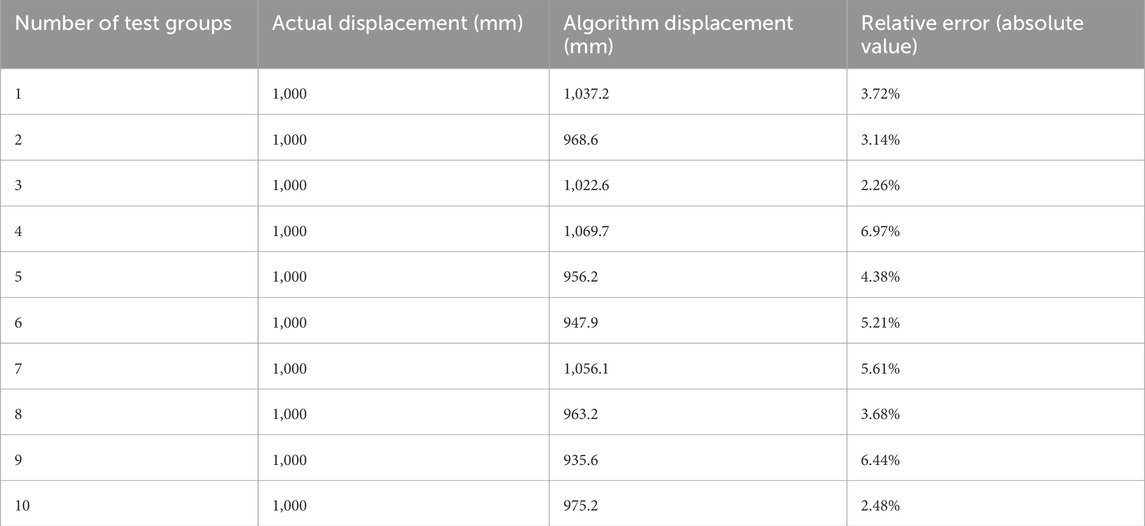
Table 1. Fixed-distance sliding rail test results reference table.

Figure 2. Quantile-Quantile plot of the fixed-distance sliding rail test.
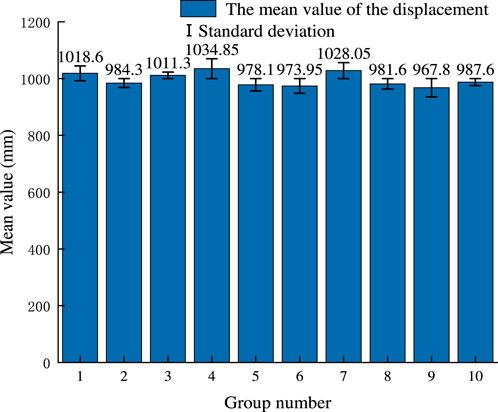
Figure 3. Error bar of the fixed-distance sliding rail test.
Given the limited sample size, the displacement values from the ten groups were subjected to a normality test. The Shapiro-Wilk (S-W) test was applied, yielding a p-value of 0.179 (p > 0.05), indicating that the data follow a normal distribution. The fixed-distance sliding rail test algorithm displacement values were found to follow a normal distribution. Therefore, a T-test was conducted to evaluate whether any significant systematic errors were present in the data. The formula for the T-test is as shown in Equation 6.
Using a two-sided T-test, the obtained p-value is 0.665 < t0.025 = 2.262. This finding indicates the absence of significant systematic error in the 10 sets of fixed-distance sliding rail test displacement data. Thus, the accuracy and feasibility of the method proposed in this study for converting MEMS acceleration signals into displacement signals are confirmed.
The actual slope with gravelly soil is shown in Figure 4. The model slopes featured a gradient of 45° and a 1:1 slope ratio, primarily composed of weathered sandstone and gravelly soils. A model box was used to form the slope, inducing an unstable, sliding configuration. MEMS sensors were strategically placed in both the unstable and slip-prone areas to monitor slope displacement. The displacement data recorded by the MEMS sensors were then compared to those obtained via Particle Image Velocimetry (PIV). Furthermore, as the test is based on an actual gravelly soil slope, gravel content was varied as a parameter. To investigate the impact of gravel content on slope displacement during instability, three groups of MEMS-based slope monitoring tests were conducted, each with different gravel contents.
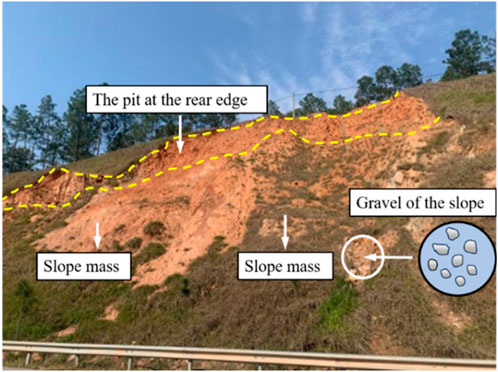
Figure 4. Photograph of slope destabilization on a highway in Jiangxi Province.
In accordance with the principles outlined in the Buckingham π-theorem, the design of the gravel-soil slope model test was conducted to ensure the accurate determination of the similarity index. The key parameters considered in the soil-gravel mixture slope model test include, slope angle (θ), gravel content (ω), soil unit weight (γ), elastic modulus of the gravel-soil mixture (E), Poisson’s ratio (μ), cohesion (c), and the angle of internal friction (φ). The similarity ratio was determined using the magnitude analysis method, resulting in a geometric similarity constant of n = 31.25. Based on this, the prototype slope was found to be 25,000 mm in height, while the model slope was scaled to a height of 800 mm.
The model box dimensions are 1,500 mm in length, 600 mm in width, and 1,500 mm in height. To observe lateral movement of the fill material, a 25 mm thick glass surface was used at the front of the model box. The physical and schematic diagrams of the model box are shown in Figure 5. The lower part of the model box is designed with a movable base plate, which can be manually lowered to allow the bottom plate to shift downward by 50 mm. The sliding device facilitates soil movement within the designated sliding and unstable areas, simulating slope destabilization. This process mimics the scenario where upper soil layers lose support from underlying soils, either through excavation at the slope toe or sliding of the lower layers. The sliding base plate has a width of 300 mm, with the upper area designated as the sliding-causing area, and the unstable area situated 600 mm above it.
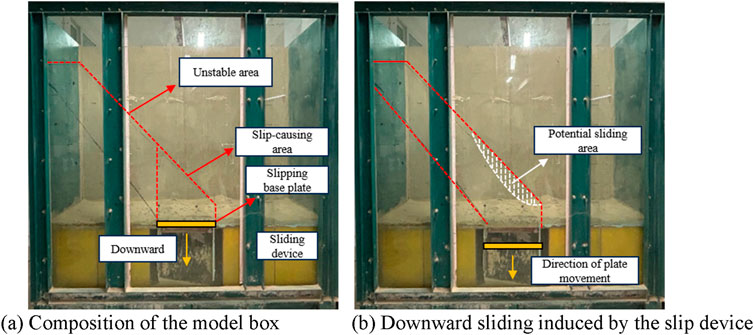
Figure 5. Indoor model test device for slope. (A) Composition of the model box (B) Downward sliding induced by the slip device.
The surface roughness of the test model box is a primary source of friction, which can significantly affect the results. To mitigate this, the lateral boundaries of the model box are smoothed to reduce frictional effects. To further minimize the influence of boundary conditions on the test outcomes, pre-testing and model calibration are conducted. These steps ensure the necessity of any further adjustments to the boundary conditions, thereby enhancing the reliability of the test results. Additionally, the model box is reinforced with steel bars along its perimeter to reduce lateral deformation and maintain structural integrity during testing.
The sand and gravel used in the experimental setup were sourced from the Lijiang River in Guilin. In accordance with the definition of gravelly soil from relevant studies (Design of building foundation, 2013), particles larger than 2 mm must constitute more than 50% of the total weight. During preparation, gravel sieved in the ranges of 10–19 mm and 5–10 mm was uniformly mixed in a 1:1 mass ratio, while particles sieved in the range of 2–5 mm were blended with soil at a 1:1 mass ratio. This mixing procedure ensures that particles larger than 2 mm make up more than 50% of the total mass. The resulting soil-gravel mixture was then used to prepare the necessary amount of raw materials for the model slopes. The slope model was constructed with three gravel content levels (20%, 40%, and 60%) for the first layer, utilizing a combination of soil, river sand, and gravelly soil. The second layer of the model slope was composed solely of gravel.
A vibrating sieve machine with a 4-mesh screen was used to obtain sufficient soil and gravel materials. A series of large-scale comprehensive direct shear tests were conducted to determine the physical properties of soils with varying gravel contents. The physical parameters obtained from these tests are presented in Table 2.
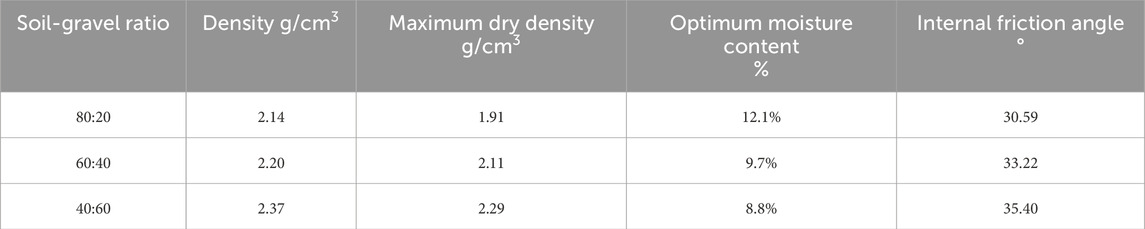
Table 2. Physical properties of gravelly soil.
The MEMS sensor utilized in this experimental evaluation is the HWT901B nine-axis sensor, manufactured by a Chinese company, as shown in Figure 6. This sensor offers a data output frequency of up to 200 Hz, with an attitude angle measurement accuracy of 0.05°, a precision of 0.05° for the X and Y-axes, and 1° for the Z-axis. In the experimental setup of this study, considering the prolonged duration of the test, the sensor’s sampling frequency was configured to 1 Hz.

Figure 6. MEMS sensor.
The Particle Image Velocimetry (PIV) diagram used in the test is presented in Figure 7. PIV enables the determination of point displacements within the observation area by analyzing time intervals and displacement rates derived from successive images. Once the commissioning of the PIV equipment is completed, the lifting and sliding screw in the sliding area is rotated to induce a uniform downward movement of the slope’s foot. Simultaneously, the CCD camera begins capturing sequential images of the slope, while the PIV host system receives and processes the image data in real time.
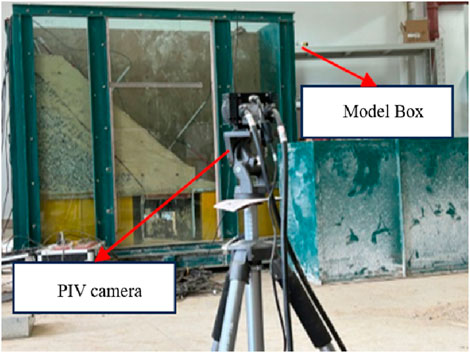
Figure 7. Diagram of slope with gravelly soil in PIV system.
To effectively collect displacement data from the deep soil layer during soil movement in the slip-inducing area of the slope, MEMS sensors in this experiment were strategically deployed in accordance with the slope’s layered construction. Initially, sensors were placed at designated points A5, A1, and A2 on the second layer. Subsequently, as the gravel soil slope was modeled, additional sensors were positioned at points A3, A4, A6, A7, A8, and A9. Sufficient slack was provided in the connecting wires to allow the MEMS sensors adequate displacement space, ensuring minimal interference from the wires. The tests were categorized based on gravel content, 20% gravel content was designated as Test A, 40% as Test B, and 60% as Test C. Each test category was conducted twice, resulting in a total of six tests. The sensor configuration for Test A is illustrated in Figures 8A–C, while the configurations for Tests B and C are identical to that of Test A. The test number of different gravel content as shown in Table 3.
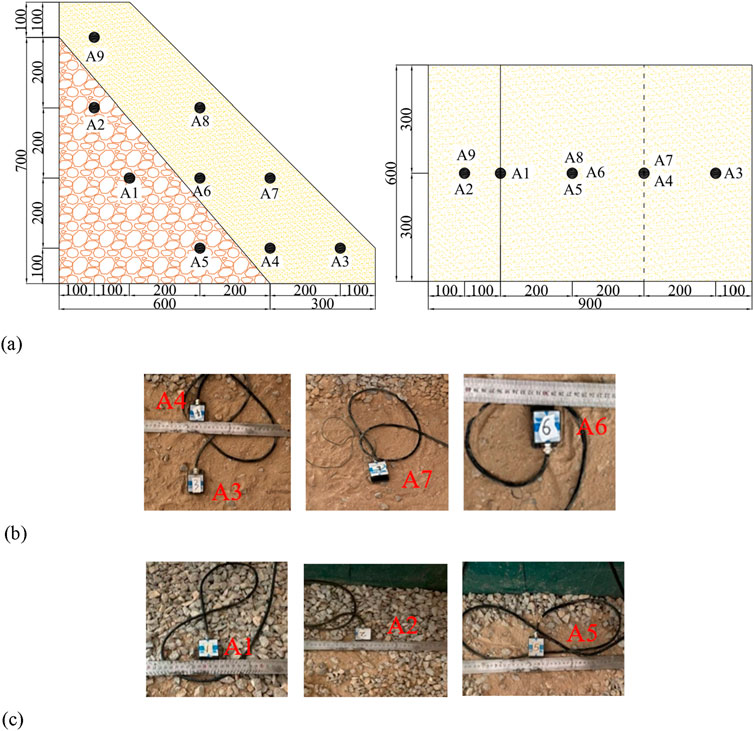
Figure 8. The layout of sensor for Test A 4. (A) Schematic diagram of sensor layout for Test A (unit: mm, schematic diagram of sensor layout for Test B and Test C is identical to that of Test A. (B) Layout of sensors on the first layer of Test A. (C) Layout of sensors on the second layer of Test A.
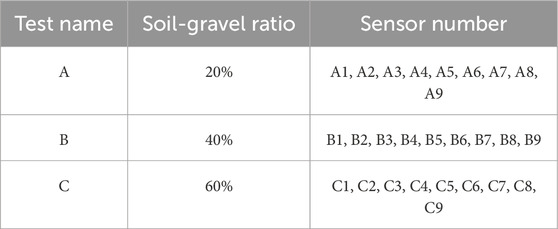
Table 3. Test number of different gravel content.
The sliding device of the model box was operated to ensure a uniform descent of the sliding base plate. During this operation, the upper computer systems for the MEMS sensors and the PIV system simultaneously received data in parallel. Once the sliding base plate reached its maximum displacement of 50 mm, the operation of the settling device was terminated, marking the conclusion of the test. After the test, the gravel soil and gravel were separately extracted, and the MEMS sensors embedded in the slope mass were carefully removed. Following the complete excavation of the gravel soil and gravel, a subsequent series of sub-tests was conducted in accordance with the predefined experimental procedures.
The modeled slopes with varying gravel contents, both before and after testing, are shown in Figure 9. It was observed that the destabilized area of the slope decreases as the gravel content increases. During the test, the front of the slope exhibited sliding behavior caused by destabilization, with the rate of displacement growth positively correlated with the distance from the source of destabilization. The sensors at A3, A4, and A7 recorded the most significant vertical displacements, whereas A6 and A8 showed relatively minor vertical displacements. The data indicate that the impact of slope failure on the unstable area diminishes gradually with increasing height. This is attributed to the descent of the movable plate, which induces a downward displacement of the soil in the slip-causing area. As a result, the soil in the unstable area partially fills the upper part of the slip-causing area. Consequently, as the vertical displacement in the slip-causing area decreases, the soil in the unstable area becomes increasingly stable. Additionally, the slopes with 40% and 60% gravel content showed reduced vertical displacement due to the higher gravel content, further enhancing slope stability.
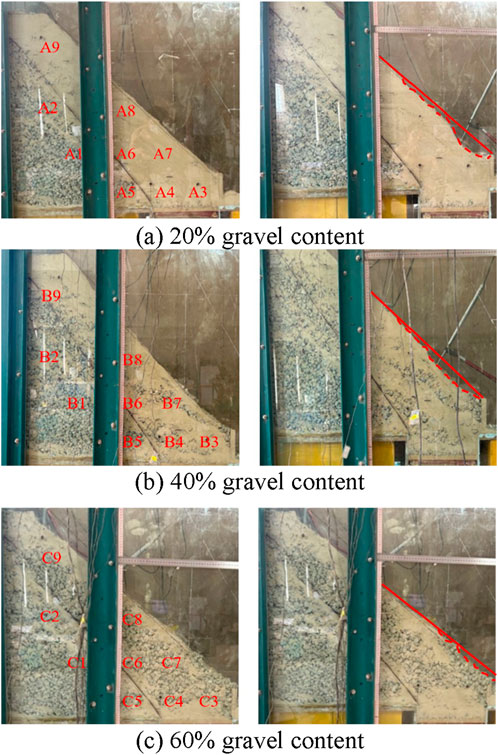
Figure 9. Comparison diagram of slope before and after the test. (A) 20% gravel content. (B) 40% gravel content. (C) 60% gravel content.
Figure 10A illustrates the displacement data from slope sensors for the 20% gravel content test. Points A1, A2, and A5 recorded no displacement (0 mm), while the maximum displacement was observed at point A3, reaching 47.97 mm. Notably, point A3 exhibited a significant displacement at the beginning of the test. This behavior can be attributed to the minimal gravitational influence at the slope’s summit, which had little effect on displacement. In contrast, the gravitational forces at the slope’s base were substantial, leading to displacement influenced by the pressure and thrust of the overlying soil mass. As a result, the maximum vertical displacement occurred at A3. During the initial 10 s of the test, notable displacement reductions were observed at points A7, A6, and A8. After this period, the displacement curves at these points began to stabilize and decrease gradually. This behavior is explained by the gravel soil at A3 sliding first, creating a void that was subsequently filled by the soil from points A7, A6, and A8. As the slope continued to slide, the frictional forces increased, causing a progressive smoothing of the displacement curves at these locations.
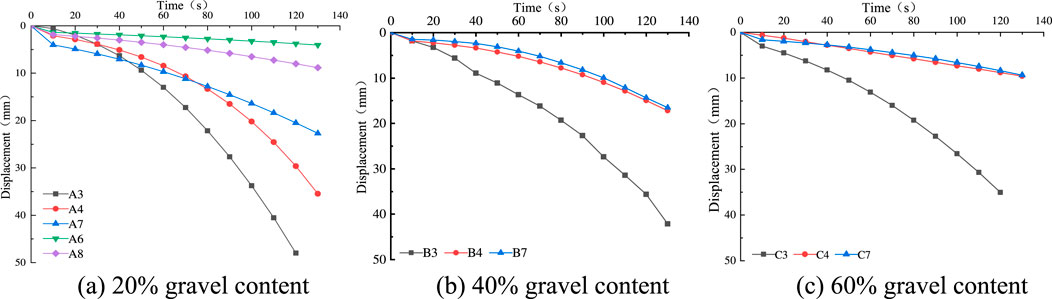
Figure 10. Vertical displacement analysis of measurement points at different locations with the same gravel content. (A) 20% gravel content (B) 40% gravel content (C) 60% gravel content.
Figures 10B, C illustrate the slope sensor displacements for 40% and 60% gravel content. Significant displacements were detected at sensors B3, B4, and B7, concentrated in the slip-causing area. The maximum vertical displacement occurred at B3 (42.15 mm), comparable to A3 in the 20% gravel test. However, the overall displacements at 40% and 60% gravel content were notably smaller, attributed to increased gravel content, which enhanced friction and shear strength, reducing slope instability. At 60% gravel content, the maximum displacement at C3 was 37.03 mm, slightly lower than at 40% gravel content. The greater gravel content further improved particle interlocking and solidification, enhancing the structural integrity of the gravel skeleton. As the mechanical properties approached those of a rock mass, vertical displacement in deeper soil layers exhibited a significant decline, stabilizing the slope further during sliding.
The study aims to evaluate the influence of varying gravel contents on slope displacement, as well as the displacement characteristics at different locations. Additionally, it seeks to validate the effectiveness of MEMS sensors in monitoring slope displacement by comparing displacement data obtained from PIV and MEMS systems. To achieve this, five measurement points were selected from the PIV system as reference points for vertical displacement in the slope with 20% gravel content. These PIV-derived vertical displacement values served as the true reference values, while the displacement data recorded by MEMS sensors during the model tests were considered the test values. A comparison of the vertical displacement data from MEMS sensors and PIV measurements is presented in Figure 11. Furthermore, the mean relative error between MEMS and PIV vertical displacement data was calculated using the formula as shown in Equation 8.

Figure 11. Comparison of vertical displacement test and PIV. (A) 20% gravel content (B) 40% gravel content (C) 60% gravel content.
The parameter δ represents the mean relative error, where SMEMS denotes the vertical displacement endpoint value measured by the MEMS sensor, SPIV represents the vertical displacement endpoint value measured by the PIV system, and N is the total number of sensors used for data acquisition. Table 4 summarizes the vertical displacement values obtained from both the MEMS and PIV systems. In the primary displacement zones of slopes with gravel contents of 20%, 40%, and 60%, the calculated mean relative errors between the MEMS and PIV vertical displacement data are 5.79%, 5.54%, and 5.89%, respectively.
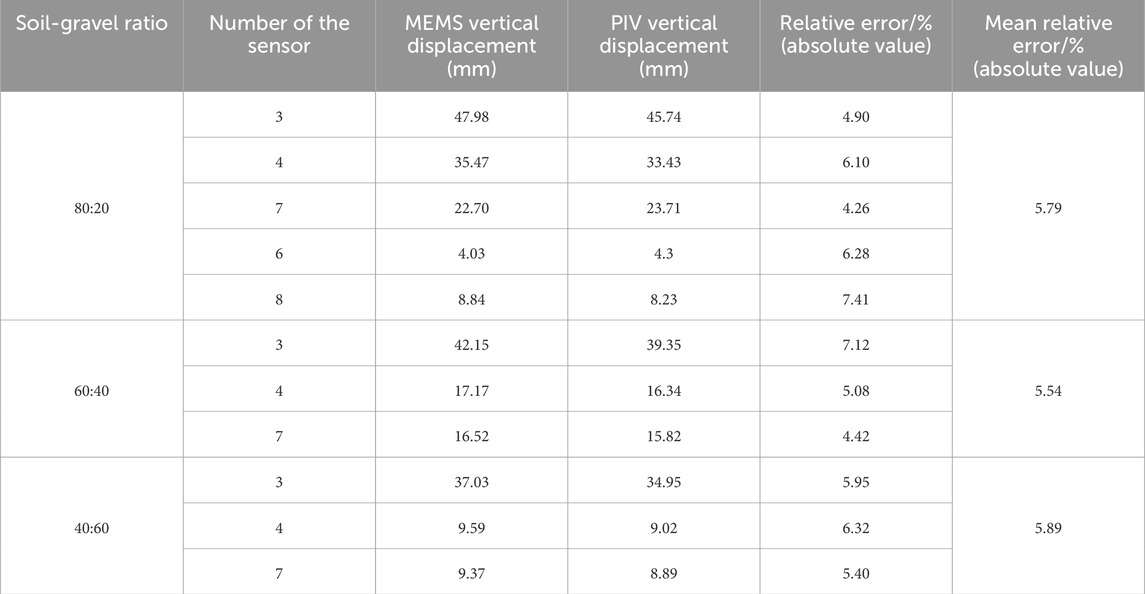
Table 4. PIV and MEMS sensor vertical displacement relative error analysis table.
During the test, in the slip-causing area, the horizontal displacements of A3 and A4, both buried at a depth of 100 mm, were the largest within the first 90 s, exhibiting similar movement trends. In contrast, the horizontal displacement of A7, buried at a depth of 300 mm, was smaller than that of A3 and A4 prior to 90 s but increased rapidly thereafter. Sensors A6 and A8, located in the unstable area, experienced displacement due to insufficient support from the underlying soil, which was mobilized by movement in the slip-causing area. Sensors A4 and A7 were positioned at the same horizontal location (L = 600 mm), as were A6 and A8 (L = 400 mm). A comparative analysis of horizontal displacement data from sensors at the same horizontal positions but different burial depths revealed that sensors at shallower depths (A7 and A8) recorded larger horizontal displacements than those at deeper depths (A4 and A6). This indicates that during the descent of the sliding device, the horizontal displacement in the unstable area predominantly affects the shallow soil layer rather than the deeper soil mass. Additionally, the horizontal displacements at A6 and A8 were greater than at A9, confirming that the bottom of the unstable area exhibited the largest horizontal displacement over time. This finding aligns with the hypothesis that sliding of the lower soil layers in highway slopes triggers subsequent movement of the overlying upper soil layers.
Figure 12A illustrates the slope sensor displacements for 20% gravel content, with the maximum horizontal displacement recorded at point A7 (35.12 mm). During the first 90 s, A7 exhibited smaller displacement compared to A3 and A4. However, after 90 s, A7’s displacement increased significantly. This behavior reflects typical traction slope instability, where the lower soil mass slides first, triggering movement in the upper layers. Sensors A6 and A8 in the stabilization area recorded displacements of 5.94 mm and 18.58 mm, respectively. Their movement resulted from a lack of support caused by soil displacement in the slip-causing area. Comparing displacement data at the same horizontal position but varying burial depths, A7 and A8 (shallow sensors) exhibited greater horizontal displacement than A4 and A6 (deeper sensors), indicating that the shallow soil experienced more pronounced horizontal movement. Additionally, sensors at different horizontal positions but the same depth revealed higher displacements at A4 and A7 in the slip-causing and unstable junction areas compared to A8 and A6 in the upper unstable area. Displacement at A8 and A6 also exceeded that at A9 in the stabilized upper zone. These observations confirm that initial movement in the lower slope induces a pushing force, propagating displacement to the upper soil layers.
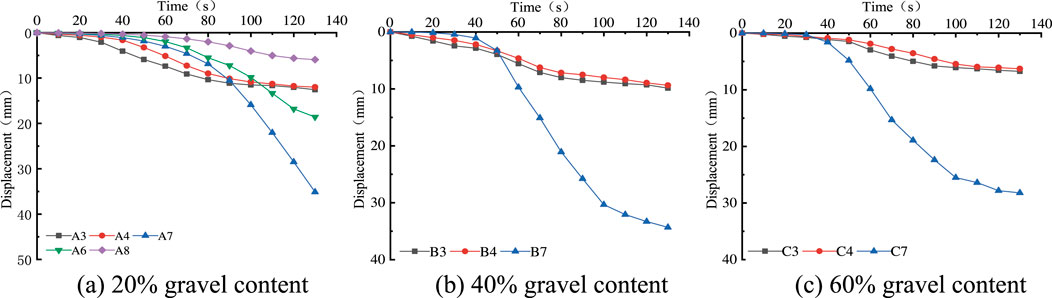
Figure 12. Horizontal displacement analysis of measuring points at different positions on slopes with the same gravel content. (A) 20% gravel content (B) 40% gravel content (C) 60% gravel content.
Figure 12B illustrates the horizontal displacement of slope sensors for the 40% gravel content test. Initially, the horizontal displacements at points B3 and B4 were greater than that of B7. However, after 50 s, the displacement at B7 increased significantly, reaching a maximum of 34.31 mm, while the displacements at B3 and B4 were comparatively smaller, at 9.88 mm and 9.36 mm, respectively. A similar trend was observed in the 60% gravel content test, as shown in Figure 12C. At the outset, the horizontal displacements at C3 and C4 exceeded that of C7. After 30 s, however, the displacement at C7 escalated sharply, peaking at 28.21 mm, compared to 6.75 mm and 6.28 mm for C3 and C4, respectively. Among the three tests with varying gravel contents, point 7 consistently exhibited the highest horizontal displacement, underscoring its susceptibility to significant movement during slope destabilization.
A comparative analysis was performed on the horizontal displacement of points A4, B4, and C4 versus A7, B7, and C7 in slopes with 20%, 40%, and 60% gravel content, respectively. As shown in Figure 12, at equivalent horizontal positions but different vertical depths, the horizontal displacement at point 7 consistently exceeded that at point 4. This can be attributed to the characteristics of shallow soil, which is typically looser and more susceptible to external loads, leading to greater shear deformation and, consequently, larger horizontal displacement. The surface soil generally has a looser structure and lower shear strength, making it more susceptible to displacement under sliding forces. For the slope with 20% gravel content, a comparison between A6 and A8 reveals that A6 exhibits greater horizontal displacement than A8 at equivalent horizontal positions but varying vertical depths. This observation is consistent with the tendency of landslides to initiate destabilization in the central region, where the sliding surface is typically more gradual. The localized instability induces outward horizontal displacement of the gravel soil within this area.
The measurement points from the PIV system were selected as reference values for horizontal displacement in the slope with 20%, 40% and 60% gravel content, based on sensor deployment locations. These reference values were compared with the horizontal displacement data obtained from MEMS sensors during the model test. Figures 13A–C presents the comparison between the horizontal displacement values measured by the MEMS sensors and those recorded by the PIV system. In the primary displacement areas of slopes with gravel contents of 20%, 40%, and 60%, the mean relative errors between the MEMS and PIV horizontal displacement data were 6.11%, 5.21%, and 4.73%, respectively. PIV and MEMS sensor horizontal displacement relative error as shown in Table 5.
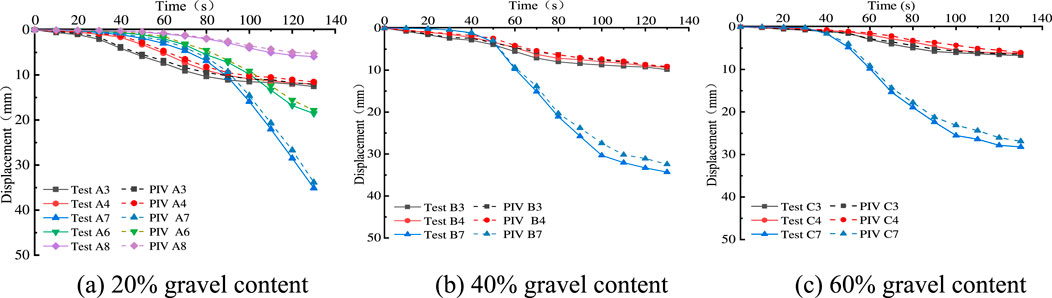
Figure 13. Comparison of horizontal displacement test and PIV. (A) 20% gravel content (B) 40% gravel content (C) 60% gravel content.
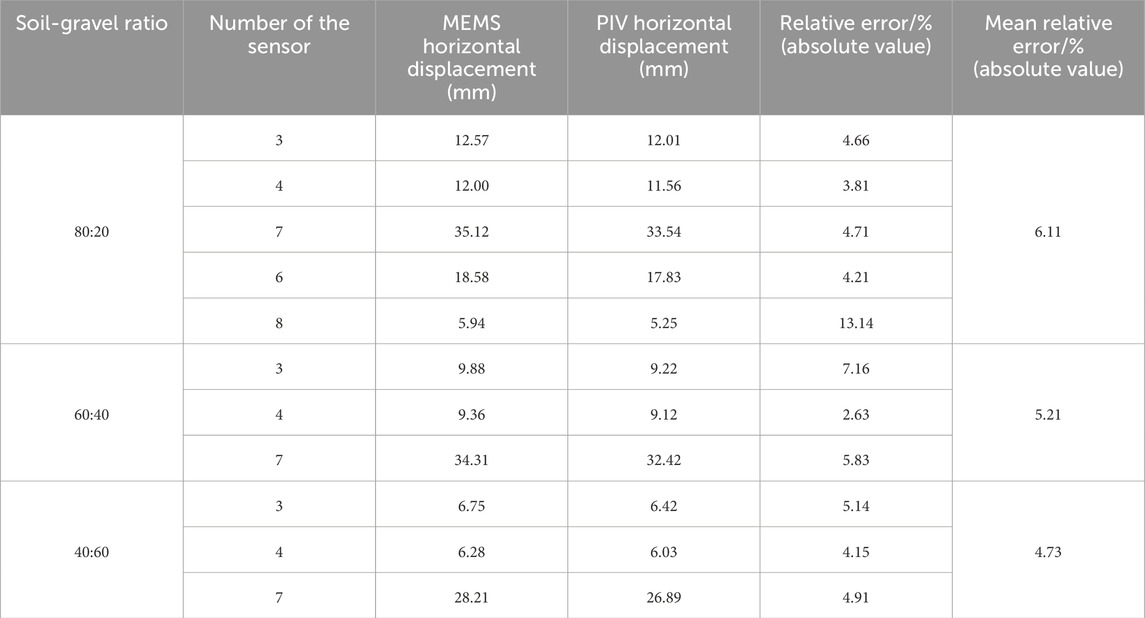
Table 5. PIV and MEMS sensor horizontal displacement relative error analysis table.
Figure 14A illustrates the vertical displacement at point 3 for slopes with varying gravel contents. The slope with 20% gravel content exhibits the highest vertical displacement, while increasing gravel content results in a gradual reduction in displacement. Compared to the A3 curve, which shows the greatest displacement, the slopes with 40% and 60% gravel content demonstrate reductions of 5.83 mm and 10.95 mm, respectively, at the same location. This indicates that higher gravel content at measurement point 3 enhances slope soil stability. Furthermore, a comparison of the time-displacement curves for B3 and C3 reveals similar trends in soil movement, suggesting that the mechanical behavior of the 40% and 60% gravel content slopes closely resembles each other and differs from the 20% gravel content slope. In the 20% gravel content slope, the soil exhibits characteristics akin to sandy soils, whereas the 40% and 60% gravel content slopes demonstrate properties more typical of gravelly soils.
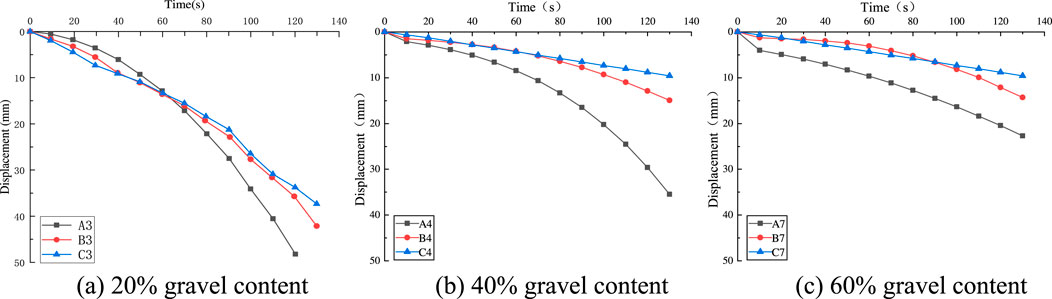
Figure 14. Vertical displacement analysis of measuring points at the same location with different gravel contents. (A) 20% gravel content (B) 40% gravel content (C) 60% gravel content.
The vertical displacement at points 4 and 7 for slopes with 40% and 60% gravel content was analyzed. After 80 s at point 4 and 90 s at point 7, the 40% gravel content slope exhibited accelerated soil movement, with displacements gradually diverging from those of the 60% gravel content slope. As shown in Figures 14B, C, the progressive descent of the sliding device resulted in greater vertical movement in the 40% gravel content slope compared to the 60% gravel content slope at both measurement points.
Compared to the A3 curve, the slopes with 40% and 60% gravel content exhibited reductions in displacement of 2.69 mm and 5.82 mm, respectively, at the same location. Further analysis reveals that the slow deformation phase at point 3 lasts approximately 30 s for the 20% gravel content slope, 40 s for the 40% gravel content slope, and 50 s for the 60% gravel content slope. This indicates that the transition from the slow deformation stage to the accelerated horizontal displacement stage in deeper soil layers occurs more gradually with higher gravel content, as shown in Figure 15A. Combined with the observed trend of decreasing horizontal displacement with increasing gravel content, these findings suggest that higher gravel content enhances slope stability at measurement point 3.
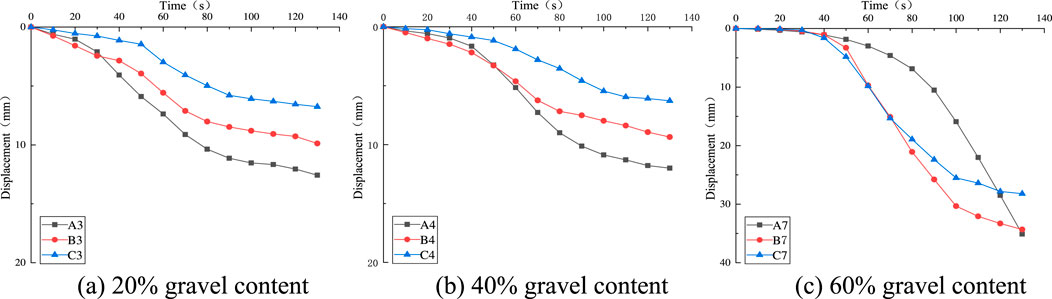
Figure 15. Horizontal displacement analysis of measuring points at the same location with different gravel contents. (A) 20% gravel content (B) 40% gravel content (C) 60% gravel content.
The time-displacement curves of A4, B4, and C4 in Figure 15B exhibit a pattern similar to that observed at measurement point 3, indicating that the soil near measurement point 4 undergoes distinct phases of slow deformation, acceleration, and gradual stabilization in horizontal movement. At measurement point 7, the horizontal displacement exceeds 20 mm, as shown in Figure 15C, marking it as the location of maximum horizontal displacement among all measurement points. Notably, this maximum displacement does not occur at the slope foot but rather at the shallow burial position at the junction of the slip-causing area and the stabilization area.
The test results demonstrate a clear correlation between slope stability and gravel content, with stability decreasing as gravel content diminishes. In slopes with 20% gravel content, the rapid expansion of the slip area is attributed to smaller soil particles and reduced cohesive forces, which significantly compromise slope stability. Conversely, slopes with 60% gravel content exhibit high stability due to the higher proportion of gravel, which enhances shear strength and soil stiffness. Slopes with 40% gravel content show moderate stability, further confirming the critical role of gravel content in determining slope stability. Higher gravel content contributes to a robust skeletal structure and increased soil density, which strengthen mechanical properties and improve slope stability. Large gravel particles inhibit the accumulation of fine-grained soils and provide enhanced support. In contrast, slopes with low gravel content exhibit alterations in pore structure, leading to an increased proportion of fine particles that weaken the soil’s mechanical properties. Furthermore, in practical applications, the fine particles in low-gravel-content soils are prone to water absorption and swelling, reducing friction and further diminishing slope stability. In conclusion, increasing gravel content enhances slope stability by improving the soil’s mechanical properties, thereby reducing vertical and horizontal displacements during slope destabilization.
In slopes with 20%, 40%, and 60% gravel content, the slip-causing area represents the primary region of vertical and horizontal displacement. This study conducts a comparative analysis of the relative errors in vertical and horizontal displacements at measuring points 3, 4, and 7 within the slip-causing area. For slopes with 20%, 40%, and 60% gravel content, the average relative errors in vertical displacement measured by MEMS sensors compared to PIV were 5.79%, 5.54%, and 5.89%, respectively. Similarly, the average relative errors in horizontal displacement for the same slopes were 6.11%, 5.21%, and 4.73%, respectively. While the trends in soil movement within the slip-causing areas of slopes with different gravel contents exhibit some variation, the mean relative errors for both vertical and horizontal displacement measurements remain below 1%. This indicates that MEMS sensors provide reliable and accurate measurements of soil movement, demonstrating their effectiveness in monitoring slope stability.
Unlike previous studies that focused on measuring surface displacement, this research investigates internal acceleration signals within the soil during slope failure. By employing MEMS sensors as monitoring tools, acceleration signals are converted into displacement data, enabling direct and intuitive measurements of internal slope displacements. In simulated gravelly soil slope experiments, MEMS sensors demonstrated good monitoring capabilities, suggesting their potential for validation in real-world highway gravelly soil slopes. However, challenges remain with this sensing method. For instance, rotational changes in the sensor’s orientation may introduce minor data deviations, and groundwater interference can affect sensor performance. Future experimental optimizations will integrate orientation calculations to achieve precise three-dimensional positioning of sensors within the soil, while also addressing issues related to ensuring the reliable operation of MEMS sensors in subterranean environments. Table 6 presents an example of a standard protocol for a physical model test (Fang et al., 2023b). In this table, a concise summary of the key information for the test is provided, highlighting the essential details rather than including every specific aspect.
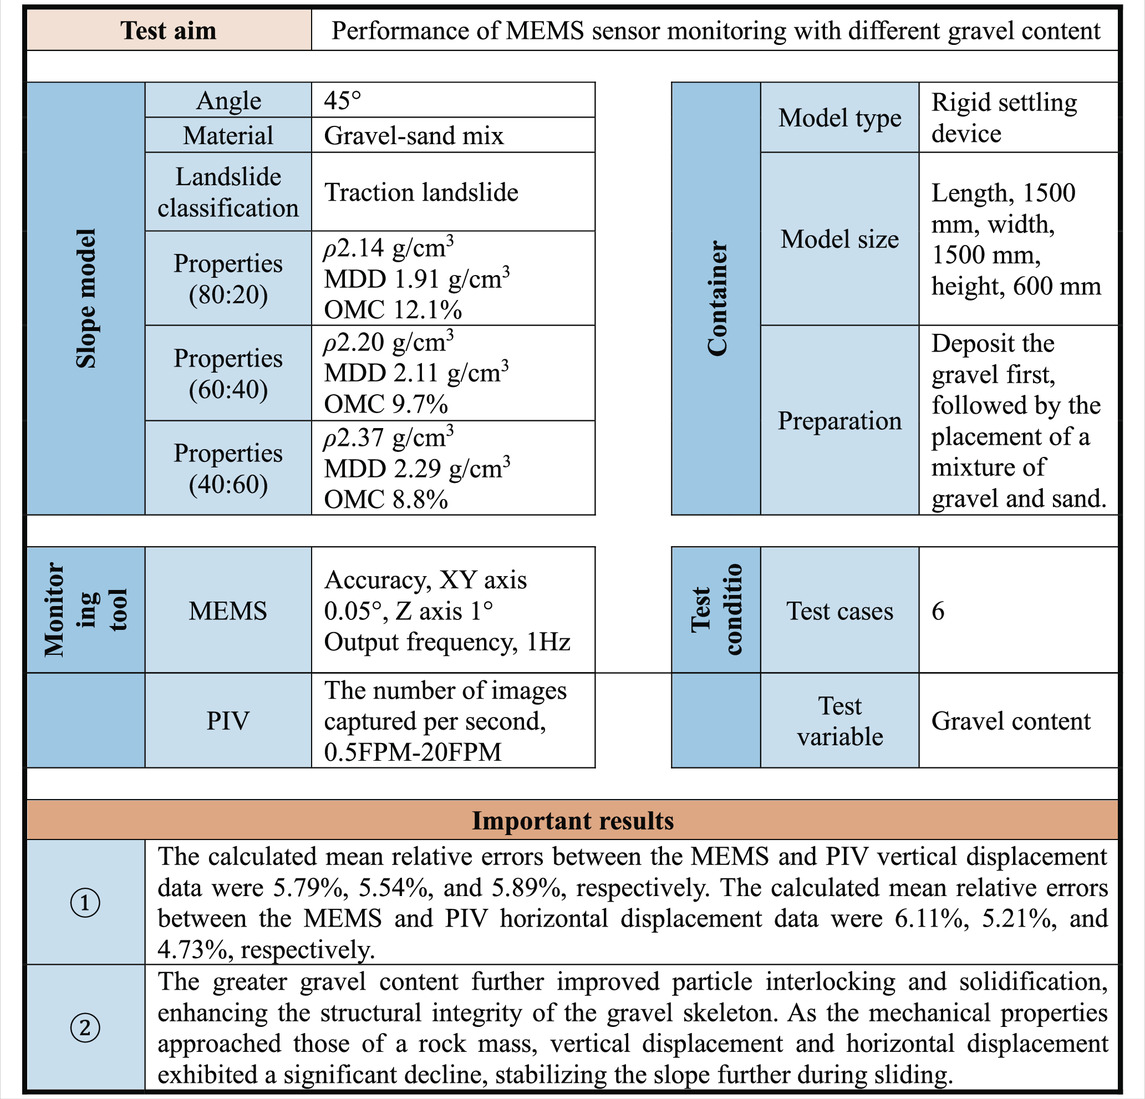
Table 6. Summarized protocol for a physical model test.
This study investigates the potential of utilizing MEMS technology to monitor displacements in slope models. Indoor model tests were conducted to collect displacement data from deep measurement points in slopes with varying gravel contents. The primary objective of this research is to analyze the influence of gravel content on the displacement characteristics of deep soil masses in slopes. The accuracy of the displacement data obtained from MEMS sensors in the model tests was validated through PIV, leading to the following key conclusions.
(1) This study demonstrates the effectiveness of MEMS sensor technology for deep displacement monitoring in slopes through a series of modeling tests. A comparison between PIV and MEMS displacement data reveals that the vertical and horizontal displacement endpoints calculated by PIV align closely with those measured by MEMS sensors at the same locations. The mean relative error of vertical and horizontal displacements at measurement points within the slip-causing area exhibited a maximum variation of only 1%. These findings validate the accuracy of the algorithmically processed MEMS signals and confirm the reliability of MEMS technology for monitoring slope displacements. However, it is important to acknowledge the limitations of the current experiments, which have not fully addressed the effects of sensor orientation changes, groundwater interference, and large slope displacements on sensor performance. These issues will be incorporated into more advanced and comprehensive future investigations.
(2) Additionally, vertical and horizontal displacement values at measurement points with varying gravel contents 20%, 40%, and 60% but identical spatial locations were analyzed. The results indicate a clear trend of decreasing displacement values with increasing gravel content, highlighting the significant influence of gravel content on enhancing slope stability.
(3) In practical engineering applications, the composition of highway slopes and the factors contributing to slope instability are often more complex. Future field tests on actual slopes can further investigate these complexities and validate the effectiveness of MEMS technology in diverse conditions. Additionally, integrating MEMS sensors with other monitoring technologies, such as fiber optic sensors and ground-penetrating radar, can form a multi-sensor fusion system. This advanced integration holds significant potential to enhance the accuracy, reliability, and robustness of slope monitoring and early-warning frameworks.
The original contributions presented in the study are included in the article/supplementary material, further inquiries can be directed to the corresponding authors.
DW: Investigation, Methodology, Project administration, Validation, Writing–review and editing. TL: Software, Writing–original draft, Writing–review and editing. YxY: Writing–review and editing. QP: Software, Writing–review and editing. YgY: Investigation, Writing–review and editing. JW: Investigation, Writing–review and editing. DL: Investigation, Writing–review and editing.
The author(s) declare that financial support was received for the research, authorship, and/or publication of this article. Financial support for this work is gratefully acknowledged from the Guangxi Science and Technology Major Program Grant No. AB23026028 and Guangxi Science and Technology Major Program Grant No. AB23075096. All the supports are greatly appreciated.
Author QP was employed by Guangxi Guiguan Electric Power Co., Ltd.
The remaining authors declare that the research was conducted in the absence of any commercial or financial relationships that could be construed as a potential conflict of interest.
The author(s) declare that no Generative AI was used in the creation of this manuscript.
All claims expressed in this article are solely those of the authors and do not necessarily represent those of their affiliated organizations, or those of the publisher, the editors and the reviewers. Any product that may be evaluated in this article, or claim that may be made by its manufacturer, is not guaranteed or endorsed by the publisher.
Abraham, M. T., Satyam, N., Pradhan, B., Segoni, S., and Alamri, A. (2022). Developing a prototype landslide early warning system for Darjeeling Himalayas using SIGMA model and real-time field monitoring. Geosciences J. 26, 289–301. doi:10.1007/s12303-021-0026-2
Algamili, A. S., Khir, M. H. M., Dennis, J. O., Ahmed, A. Y., Alabsi, S. S., Ba Hashwan, S. S., et al. (2021). A review of actuation and sensing mechanisms in MEMS-based sensor devices. Nanoscale Res. Lett. 16, 16. doi:10.1186/s11671-021-03481-7
Barzegar, M., Blanks, S., Sainsbury, B.-A., and Timms, W. (2022). MEMS technology and applications in geotechnical monitoring: a review. Meas. Sci. Technol. 33, 052001. doi:10.1088/1361-6501/ac4f00
Bian, H.-G., Wang, S., and Li, D.-Q. (2024). Influence of gravel content on the stability of filling embankment slope. Eng. Mech. 2024, 1–11. doi:10.6052/j.issn.1000-4750.2023.08.0638
Fang, K., Miao, M., Tang, H., Jia, S., Dong, A., An, P., et al. (2023a). Insights into the deformation and failure characteristic of a slope due to excavation through multi-field monitoring: a model test. Acta Geotech. 18, 1001–1024. doi:10.1007/s11440-022-01627-0
Fang, K., Tang, H., Li, C., Su, X., An, P., and Sun, S. (2023b). Centrifuge modelling of landslides and landslide hazard mitigation: a review. Geosci. Front. 14, 101493. doi:10.1016/j.gsf.2022.101493
Fang, K., Jia, S., Tang, H., Zhou, R., Kong, Z., Fu, Y., et al. (2024). Arching effect in slopes under excavation: classification and features. Eng. Geol. 337, 107563. doi:10.1016/j.enggeo.2024.107563
Freddi, F., Mingazzi, L., Pozzi, E., and Aresi, N. (2023). Laboratory assessment of an in-place inclinometer chain for structural and geotechnical monitoring. Sensors 23, 8379. doi:10.3390/s23208379
Ge, Y., Chen, J., Cao, C., He, J., Sheng, Y., and Zheng, X. (2021). Design and test of a MEMS accelerometer array for submarine landslide displacement monitoring. Mar. Technol. Soc. J. 55, 5–16. doi:10.4031/MTSJ.55.1.7
Ge, Y., Zhou, P., Zhou, Q., Ren, X., Fang, Y., Ge, H., et al. (2024). Research and application on in-situ monitoring of strata movement in submarine cold seeps area based on three-dimensional MEMS sensor network. Measurement 238, 115288. doi:10.1016/j.measurement.2024.115288
Guan, Z., Jiang, X., and Gao, M. (2013). “A calibration test of karst collapse monitoring device by optical time domain reflectometry (BOTDR) technique,” in Full proceedings of the thirteenth multidisciplinary conference on sinkholes and the engineering and environmental impacts of karst (Carlsbad, New Mexico: National Cave and Karst Research Institute), 71–77. doi:10.5038/9780979542275.1115
Guthrie, R. H., Evans, S. G., Catane, S. G., Zarco, M. A. H., and Saturay, R. M. (2009). The 17 February 2006 rock slide-debris avalanche at Guinsaugon Philippines: a synthesis. Bull. Eng. Geol. Environ. 68, 201–213. doi:10.1007/s10064-009-0205-2
Gutierrez, F., Sevil, J., Sevillano, P., Preciado-Garbayo, J., Martinez, J. J., Martin-Lopez, S., et al. (2023). The application of distributed optical fiber sensors (BOTDA) to sinkhole monitoring. Review and the case of a damaging sinkhole in the Ebro Valley evaporite karst (NE Spain). Eng. Geol. 325, 107289. doi:10.1016/j.enggeo.2023.107289
Ho, S.-C., Chen, I.-H., Lin, Y.-S., Chen, J.-Y., and Su, M.-B. (2019). Slope deformation monitoring in the Jiufenershan landslide using time domain reflectometry technology. Landslides 16, 1141–1151. doi:10.1007/s10346-019-01139-1
Hu, T., Shen, L.-Q., L, P., Zhang, B., Dong, W.-F., and Liu, M.-Y. (2023). Transmission line galloping signal processing technology based on inertial sensor. J. Vib. shock 42, 49–57+78. doi:10.13465/j.cnki.jvs.2023.19.007
Jiao, C., Diao, Y., Han, J., and Zheng, G. (2023). Experimental research on a novel soil displacement monitoring system based on measurement unit cells (MUCs). Measurement 211, 112605. doi:10.1016/j.measurement.2023.112605
Li, T., He, B., Chen, Z., Zhang, Y., Liang, C., and Wang, R. (2016). Effects of gravel on infiltration, runoff, and sediment yield in landslide deposit slope in Wenchuan earthquake area, China. Environ. Sci. Pollut. Res. 23, 12075–12084. doi:10.1007/s11356-016-6394-x
Li, C., Song, S., and Sun, J. (2023). Application and simulation research of MEMS inertial sensor in reservoir bank slope deformation monitoring. Chin. J. Rock Mech. Eng. 42, 1248–1258. doi:10.13722/j.cnki.jrme.2022.0632
Li, G., Hu, Z., Wang, D., Wang, L., Wang, Y., Zhao, L., et al. (2024). Instability mechanisms of slope in open-pit coal mines: from physical and numerical modeling. Int. J. Min. Sci. Technol. 34, 1509–1528. doi:10.1016/j.ijmst.2024.10.003
Liao, L., Yang, Y., Yang, Z., Zhu, Y., Hu, J., and Zou, D. H. S. (2018). Mechanical state of gravel soil in mobilization of rainfall-induced landslides in the Wenchuan seismic area, Sichuan province, China. Earth Surf. Dyn. 6, 637–649. doi:10.5194/esurf-6-637-2018
Liu, S., Huang, X., Zhou, A., Hu, J., and Wang, W. (2018). Soil-rock slope stability analysis by considering the nonuniformity of rocks. Math. Problems Eng. 2018, 1–15. doi:10.1155/2018/3121604
Liu, C., Du, Y., Yue, G., Li, Y., Wu, D., and Li, F. (2024). Advances in automatic identification of road subsurface distress using ground penetrating radar: state of the art and future trends. Autom. Constr. 158, 105185. doi:10.1016/j.autcon.2023.105185
Najafabadi, H. R., Goto, T. G., Martins, T. C., Tsuzuki, M. S. G., and Barari, A. (2024). Designing MEMS accelerometer for enhanced sensitivity and reduced cross-sensitivity in landslide monitoring. J. Int. Meas. Confed. 226, 114092. doi:10.1016/j.measurement.2023.114092
Pajewski, L., and Benedetto, A. (2012). Special issue: civil engineering applications of ground penetrating radar preface. Nondestruct. Test. Eval. 27, 187–188. doi:10.1080/10589759.2012.710389
Park, S., Lim, H., Tamang, B., Jin, J., Lee, S., Chang, S., et al. (2019). A study on the slope failure monitoring of a model slope by the application of a displacement sensor. J. Sensors 2019, 1–9. doi:10.1155/2019/7570517
Ren, S., Zhang, Y., Xu, N., Wu, R., Liu, X., and Du, G. (2021). Mobilized strength of gravelly sliding zone soil in reactivated landslide: a case study of a giant landslide in the north-eastern margin of Tibet Plateau. Environ. Earth Sci. 80, 434. doi:10.1007/s12665-021-09638-y
Ren, S., Zhang, Y., Li, J., Wu, R., and Hao, H. (2024). Response mechanism of the residual strength to the mesostructure of the shear surface in the gravelly slip zone of ancient landslides. J. Geophys. Research-Earth Surf. 129, e2023JF007605. doi:10.1029/2023JF007605
Sheng, Y., Zhang, B., Xu, G., Cheng, Z., Shi, Z., and Li, Y. (2024). Mobility forecast of gravel-silty clay landslide using ring shear test and discrete element method in Shaziba, southwestern Hubei Province, China. Bull. Eng. Geol. Environ. 83, 488. doi:10.1007/s10064-024-03983-5
Shentu, N., Wang, S., Li, Q., Tong, R., An, S., and Qiu, G. (2020). Research on structure optimization and measurement method of a large-range deep displacement 3D measuring sensor. Sensors Switz. 20, 1689. doi:10.3390/s20061689
Tao, T., Yang, J., Wei, W., Wozniak, M., Scherer, R., and Damasevicius, R. (2021). Design of a MEMS sensor array for dam subsidence monitoring based on dual-sensor cooperative measurements. KSII Trans. Internet Inf. Syst. 15, 3554–3570. doi:10.3837/tiis.2021.10.005
Victor, R. (2023). “How intelligent monitoring solutions can mitigate slope failure risk,” in Risk, and resilience, conference on geo-risk - advances in theory and innovation in practice (New York: Amer Soc Civil Engineers), 257–266.
Wang, J.-Y., Song, E.-X., and Zhang, Q.-L. (2022a). DEM analysis of the aggregate shape effect on mechanical properties of rockfill. Eng. Mech. 39 (03), 137–146. doi:10.6052/j.issn.1000-4750.2021.01.0061
Wang, W., Wang, P., and Zhang, Z. (2022b). Study on gravel soil strength degradation and its influence on the slope stability in reservoir bank fluctuating zone. Eng. Fail. Anal. 134, 105980. doi:10.1016/j.engfailanal.2021.105980
Wang, H., Bai, Y., and Huang, D. (2024a). Study of experimental and numerical simulation on the influence of gravel on the interflow of slope land. Environ. Sci. Pollut. Res. 31, 11716–11726. doi:10.1007/s11356-023-31808-7
Wang, W., Peng, J., Hu, W., Wang, J., Xu, X., Zaheer, Q., et al. (2024b). A multi-degree-of-freedom monitoring method for slope displacement based on stereo vision. Computer-Aided Civ. Infrastructure Eng. 39, 2010–2027. doi:10.1111/mice.13173
Wen, B.-P., and Jiang, X.-Z. (2017). Effect of gravel content on creep behavior of clayey soil at residual state: implication for its role in slow-moving landslides. Slopes 14, 559–576. doi:10.1007/s10346-016-0709-3
Wu, H., Guo, Y., Xiong, L., Liu, W., Li, G., and Zhou, X. (2019). Optical fiber-based sensing, measuring, and implementation methods for slope deformation monitoring: a review. IEEE Sensors J. 19, 2786–2800. doi:10.1109/JSEN.2019.2891734
Zhang, Y., Tan, X., and Zhao, C. (2020). UWB/INS integrated pedestrian positioning for robust indoor environments. IEEE Sensors J. 20, 14401–14409. doi:10.1109/JSEN.2020.2998815
Zhang, H., Luo, Y., Yuan, S., Zhou, Y., Zhou, Q., Zeng, F., et al. (2022). Shear characteristics of gravel soil with different fillers. Front. Mater. 9, 962372. doi:10.3389/fmats.2022.962372
Zhang, Y., Lu, J., Han, W., Xiong, Y., and Qian, J. (2023). Effects of moisture and stone content on the shear strength characteristics of soil-rock mixture. Materials 16, 567. doi:10.3390/ma16020567
Keywords: MEMS sensors, slope with gravelly soil, gravel content, model test, deep soil displacement
Citation: Wu D, Liang T, Yang Y, Pei Q, Yi Y, Wu J and Li D (2025) Experimental study on displacement monitoring of instable highway slope based on MEMS sensors. Front. Earth Sci. 13:1541217. doi: 10.3389/feart.2025.1541217
Received: 07 December 2024; Accepted: 16 January 2025;
Published: 17 March 2025.
Edited by:
Chong Xu, Ministry of Emergency Management, ChinaCopyright © 2025 Wu, Liang, Yang, Pei, Yi, Wu and Li. This is an open-access article distributed under the terms of the Creative Commons Attribution License (CC BY). The use, distribution or reproduction in other forums is permitted, provided the original author(s) and the copyright owner(s) are credited and that the original publication in this journal is cited, in accordance with accepted academic practice. No use, distribution or reproduction is permitted which does not comply with these terms.
*Correspondence: Yanxin Yang, eWFueGlueWFuZ3N3anR1QGZveG1haWwuY29t
Disclaimer: All claims expressed in this article are solely those of the authors and do not necessarily represent those of their affiliated organizations, or those of the publisher, the editors and the reviewers. Any product that may be evaluated in this article or claim that may be made by its manufacturer is not guaranteed or endorsed by the publisher.
Research integrity at Frontiers
Learn more about the work of our research integrity team to safeguard the quality of each article we publish.