 Dongchen Liu1,2,3
 Xuefeng Yang1,2Shengxian Zhao1,2Deliang Zhang1,2Shan Huang1,2Ning Zhu1,2Jianqi Rong4Bowen Shi4
 Zhiwei Wang4*
 Chao-Zhong Qin4*
- 1Shale Gas Research Institute, PetroChina Southwest Oil and Gasfield Company, Chengdu, Sichuan, China
- 2Shale Gas Evaluation and Exploitation Key Laboratory of Sichuan Province, Chengdu, Sichuan, China
- 3State Key Laboratory of Oil and Gas Reservoir Geology and Exploitation, Southwest Petroleum University, Chengdu, Sichuan, China
- 4School of Resources and Safety Engineering, Chongqing University, Chongqing, China
Organic matter (OM) serves as a crucial site for shale gas generation and occurrence. Its content and spatial connectivity significantly influence gas flow ability and gas occurrence. However, in characterizing the three-dimensional (3D) connectivity of OM, current imaging techniques such as FIB-SEM and nano-CT cannot balance field of view (FoV) and image resolution. To address this gap, in this work, we develop a novel workflow for numerical reconstruction of REV-size digital rocks of OM that integrates high-resolution information of pore structures in large-view MAPS (modular automated processing system) images. Specifically, the open source code, SliceGAN, is used in the 3D reconstruction of digital rocks of OM, while the high-resolution information of OM pore structures is integrated into the digital rocks in terms of the classification of OM in the MAPS images. The classification of OM is solely based on the surface or 2D porosity of individual OM watersheds. As a first attempt, we propose three types of OM including Type A with high porosity (>20%), Type B with medium porosity (10%∼20%), and Type C with low porosity (<10%). Based on the case studies of three in-situ shale samples with different OM contents, we show that at the REV size the three types of OM, as a whole, can form conducting pathways throughout the domains, but each type of OM is disconnected. Type A and Type B OM have poor connectivity, while Type C OM holds the best connectivity dominating gas transport at the REV scale. Moreover, the reconstructed 3D digital rocks of OM can be used in the numerical modeling of REV-size gas transport in shales.
1 Introduction
The development of unconventional oil and gas resources such as shale gas and shale oil has been a major focus in the global energy sector. In comparison with conventional oil and gas reservoirs, however, the complexity and multiscale pore structures of shale reservoirs pose significant challenges to their development. Multiscale pore structures of shale have a crucial impact on gas occurrence and flow. Pores in shale matrix can range from nano to micro scales, including nanopores (<2 nm), micropores (2–50 nm), and macropores (>50 nm) (Loucks et al., 2012; Milliken et al., 2013), which consist of organic matter (OM) pores, mineral matrix pores, and natural micro-fractures, forming a complex pore network (Xu et al., 2020; Wang et al., 2021; Gao et al., 2024; Zhang et al., 2024). Nano-scale pores provide large specific areas and serve as the main sites for gas adsorption, while micro-scale pores and fractures provide channels for free gas flow. The multiscale pore structures lead to the coexistence of various gas flow mechanisms, such as adsorption-desorption, Knudsen diffusion, slip flow, and Darcy flow. Among them, the connectivity of OM plays a key role (Curtis et al., 2014; Ma et al., 2016; Ma et al., 2017). Highly-connected organic pore networks not only increase gas occurrence capacity but also provide continuous pathways for gas flow, facilitating gas desorption and transport within shale (Guo et al., 2018; Wang et al., 2022). Therefore, in-depth understanding of the characteristics of OM connectivity and its influence on gas occurrence and flow is of great significance for optimizing shale gas development strategies and improving resource utilization efficiency.
Up to now, the analysis of multiscale pore structures of shale has been mainly dependent on fluid injection experiments such as gas adsorption and mercury intrusion porosimetry (MIP) (Sun et al., 2017; Gao et al., 2018), and various imaging techniques such as scanning electron microscopy (SEM), micro-nano computed tomography (CT), and focused ion beam scanning electron microscopy (FIB-SEM) (Tang et al., 2016; Yang et al., 2016; Garum et al., 2020; Zhao et al., 2020; Gou et al., 2021). The combination of several fluid injection methods may provide a wide range distribution of pore sizes. However, it cannot distinguish pore types (e.g., OM pores and mineral matrix pores) and their spatial connectivity. On the other hand, Curtis et al. (2014) used high-resolution, large-field scanning electron microscope stitched images to analyze the connectivity of OM in Wolfcamp and Barnett shales at the 2D representative elementary volume (REV) scale, revealing that OM is almost disconnected in the 2D images. Therefore, to evaluate the real connectivity of OM, the 3D imaging is indispensable, yet current 3D imaging experiments encounter irreconcilable conflicts between field of view (FoV) and spatial resolution. For instance, while the FIB-SEM can achieve high-resolution 3D imaging of shale, it is time-consuming and has a small FoV that cannot reach the REV size of shale matrix (100∼300 µm) (Wu et al., 2020). The micro/nano CT can identify the 3D distribution of OM, but its resolution is insufficient to capture internal pore structures of each OM element, preventing the OM classification (Yang et al., 2024). Therefore, how to integrate high-resolution pore structure information of OM into the REV-size 3D OM distribution will be a challenge, which will be addressed in this work.
There have been many studies of numerical reconstruction of digital rocks. A 3D digital rock reconstruction method based on multi-point geo-statistics (MPS) has been proposed. It extracts multi-point statistical information from training images (i.e., 2D slices), establishes search trees and templates as constraints, iteratively generates 2D images, and ultimately overlays them to form 3D digital rocks (Okabe and Blunt, 2004; Zhang et al., 2016; Liu et al., 2023). Additionally, a cross-correlation-based simulation algorithm (CCSIM) has been used to construct 3D digital rocks of shale, enabling the generation of 3D images with similar properties from 2D input images (Tahmasebi et al., 2015; Tahmasebi et al., 2016; Ji et al., 2019a). With the advancement of artificial intelligence (AI) and computational resources, deep learning has also been playing an important role in 3D digital rock core reconstruction. Generative adversarial networks (GANs) have been introduced for digital rock reconstruction, with the reconstructed rock cores evaluated using autocorrelation functions (Mosser et al., 2017; Zhang et al., 2021; Zhao et al., 2021; Cao et al., 2022; Zhang et al., 2025). Compared with traditional reconstruction methods, GAN models can rapidly generate target digital rock cores once trained. Recently, the SliceGAN model has been proposed, which is capable of generating multi-component 3D images from multi-component 2D slices (Kench and Cooper, 2021).
In this work, we mainly contribute to developing a novel workflow for numerical reconstruction of REV-size OM digital rocks, which can integrate high-resolution information of pore structures in large-view MAPS images. As a first attempt, three in-situ shale samples with different OM contents are used for illustration. Moreover, the three reconstructed REV-size OM digital rocks are analyzed to understand the multiscale connectivity of OM. The remainder of the paper is organized as follows. In Section 2, we present the details of the reconstruction of REV-size digital rocks of OM including the classification of individual OM elements or watersheds in Section 2.1, and the 2D to 3D reconstruction by the SliceGAN model in Section 2.2. Results and discussion are given in Section 3, which is followed by the main conclusions and outlook in Section 4.
2 Materials and methods
Three in-situ shale samples were collected from the Longmaxi Formation in the Luzhou Block of the Sichuan Basin. Figure 1 shows the developed workflow for the 3D reconstruction of Shale OM which can integrate high-resolution information of OM pore structures. First, a field emission scanning electron microscope (Zeiss Crossbeam 540) is used in the secondary electron imaging mode to obtain MAPS images with a spatial resolution of 16 nm through large-area stitching. The images are segmented to individual OM watersheds using the ImageJ software, followed by the classification of OM watersheds in terms of surface porosity (excluding subresolution OM pores). After classifying OM at the high resolution, the images were substantially coarsened. The coarsened 2D images associated with the classified OM watersheds are reconstructed into the 3D OM digital rocks using the SliceGAN model (Kench and Cooper, 2021; Kench et al., 2022). Finally, the connectivity between different types of OM units or watersheds will be analyzed.
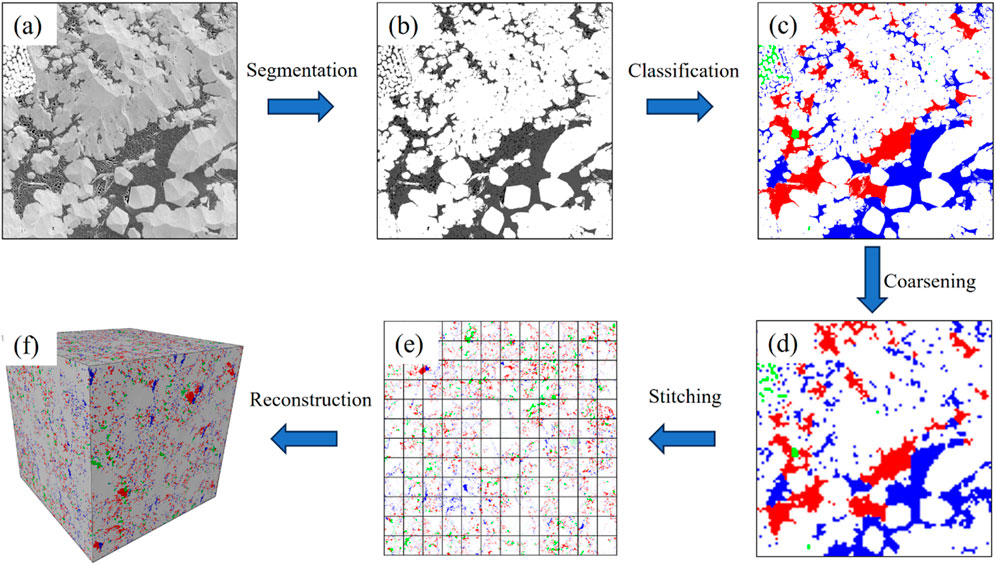
Figure 1. Workflow for the 3D reconstruction of Shale OM integrating high-resolution information by MAPS. (A) Sub-image of the original MAPS. (B) Watershed segmentation of the image using ImageJ. (C) Classification of OM watersheds based on surface or 2D porosity. (D) Coarsening of the classified image. (E) Stitching multiple images to achieve the REV-size FoV. (F) 2D-to-3D reconstruction of classified OM using the SliceGAN model.
In order to analyze the connectivity of OM in shales with varying OM content, we have selected three shale samples with different OM contents. Based on the OM content (defined by the OM area including OM pores and subresolution OM divided by the image area) and the total porosity of OM (defined by the total area of OM pores divided by the OM content), the samples may be categorized into high OM content and low porosity (HOM-LP), medium OM content and high porosity (MOM-HP), and low OM content and low porosity (LOM-LP). We notice that the OM contents are obtained by calculating area ratios from the segmented MAPS images (size of 196 × 196 μm2 and resolution of 16 nm), while the mineral compositions are determined by using quantitative evaluation of minerals by scanning electron microscopy (QEMSCAN) (size of 400 × 2,500 µm and resolution of 0.4 µm). Table 1 lists the information of OM contents and mineral compositions of the three samples. The image-based data is also in good consistence with experimental measurements.
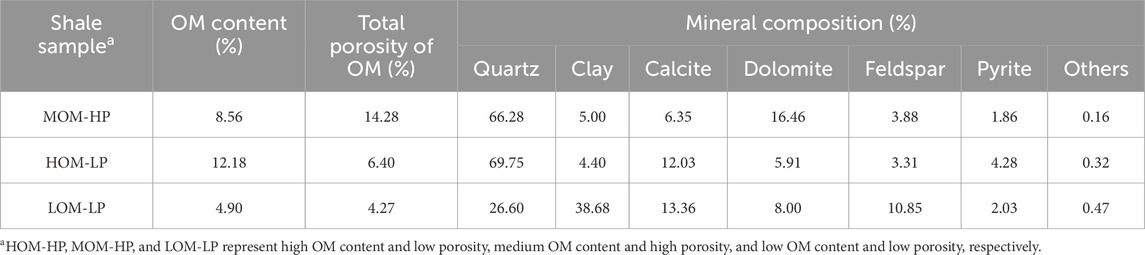
Table 1. Information on OM Contents and mineral compositions of the three shale samples used in this work. All the data is from the image analysis of MAPS images.
2.1 Classification of organic matter
2.1.1 REV analysis
The REV analysis is conducted to determine the appropriate scale at which pore structures and OM connectivity can be meaningfully characterized. The analysis involves incrementally increasing the FoV of the segmented images, until the calculated OM content and OM total porosity reach stable values, indicating that the REV size is achieved.
To analyze the spatial distribution characteristics of OM in the shale samples, we adopt the method described by Wu et al. (2020), conducting statistical analysis of minerals, OM, and OM pores in different sizes of sub-images. For each large-area stitched sample, the statistical average size is gradually increased from the minimum to the maximum as shown in Figure 2. It starts at 10 μm, and then increases with a 10 µm increment. At each average size, 10 square regions are randomly sampled in an original MAPS image. Within each sampled region, the area ratio of a target label is calculated, defined as the ratio of the number of pixels with that label to the total number of pixels in the region. The average and standard deviation of the area ratios from the 10 random samples are calculated to obtain the mean area ratio and its variability at different sizes.
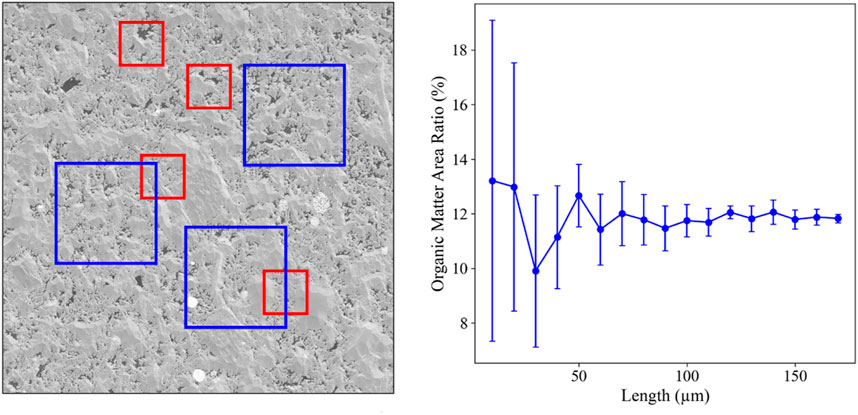
Figure 2. Method for determining the 2D REV Size of shale matrix.
This method allows us to evaluate the change in area ratio of the target label with varying observation sizes, thereby determining the REV size. Finally, for each sample, we plot the relationship between the mean area ratio and the region size, with error bars representing the standard deviation as shown in Figure 2 (right).
2.1.2 Three types of watershed of organic matter
In this work, we aim to reconstruct REV-size OM digital rocks (a few hundred microns), which integrate high-resolution information of OM pore structures. First, it is prohibitive to numerically reconstruct 3D REV-size digital rocks directly based on MAPS images, due to the massive data. Alternatively, we propose to classify OM in terms of OM watershed porosity in MAPS images, such that the classification information can be kept in substantially coarsened MAPS images. Then, we can reconstruct REV-size OM digital rocks composed of several types of OM.
Based on the morphology of OM pores, previous studies have mainly classified OM into honeycomb-shaped, sponge-shaped, and needle-shaped organic pores (Ji et al., 2019b; Yang et al., 2022). However, this sort of classification requires manual classification of each OM watershed, which is labor-intensive when processing a large number of images and cannot quantify the surface porosity of each OM watershed. A few studies have shown that the pore connectivity (excluding subresolution pores) varies significantly among OM with different surface porosities (Wei et al., 2023). Throughout FIB-SEM images, low-porosity and medium-porosity OM mostly exhibits isolated pores, while high-porosity OM shows connected pores (Borjigin et al., 2021). The permeability of OM watersheds with connected pores can be two orders of magnitude higher than that of watersheds with isolated pores (Yang et al., 2024). Additionally, gas occurrence within OM varies considerably with respect to surface porosity. Therefore, in the work, as a first attempt, we propose to classify segmented OM watersheds into three types of OM, with respect to their surface porosities, i.e., Type A (the porosity range is >20%), Type B (10∼20%), and Type C (<10%). Overall, Type A OM features connected OM pores throughout their watersheds and high porosity, while Type B and Type C OM features isolated OM pores and low porosity. As a first attempt, the critical value of 20% is qualitatively based on our FIB-SEM analysis and percolation theory.
In this work, the MAPS image of each shale sample with a resolution of 16 nm and an overall FoV of 196 × 196 μm2 is divided into 144 sub-images. The sub-images are imported into the ImageJ software, where the Trainable Weka Segmentation plugin (Schindelin et al., 2012; Arganda-Carreras et al., 2017) is used to segment the images into ternary images including three phases, i.e., OM (with subresolution pores), OM pores (resolved pores at the 16 nm resolution), and the reminder (i.e., matrix). We change OM pores into OM, then the watershed algorithm (Beucher and Lantuéjoul, 1979) is used to segment OM into individual watersheds. Moreover, compared with the ternary images, we can obtain the surface porosities of OM watersheds. Finally, according to their surface porosities, we can classify OM watersheds into Types A, B, and C.
2.2 2D to 3D reconstruction of organic matter
We utilize 2D images to reconstruct 3D shale images using the SliceGAN model (Kench and Cooper, 2021). This approach aims to address the dimensional discrepancy between 2D training images and 3D generative models. Specifically, SliceGAN employs an architecture consisting of a 3D generator and three 2D discriminators. The generator is responsible for generating 3D volume data from noise or latent space, while the discriminators process 2D slices generated along the x, y, and z directions.
During the reconstruction process, the 3D volume is sliced pixel-by-pixel along each direction, resulting in a series of 2D images. These images are then fed into the corresponding 2D discriminators for evaluation. Throughout the training process, the discriminators compare the real 2D images with the generated 2D slices, learning the differences between them. The generator is optimized to progressively improve the quality of the generated 3D volume data until the slices in each direction can pass the evaluation of the respective discriminator. The training is complete when the generated 3D model meets the discriminators’ criteria in the x, y, and z directions. Once the model is fully trained, it can generate 3D volume data that aligns with the characteristics of the 2D images (Kench and Cooper, 2021), The schematic diagram of the SliceGAN training process is shown in Figure 3. Our model’s generator contains 40,116,224 trainable parameters, while each discriminator has 2,764,800 trainable parameters. The training employs the Wasserstein GAN with Gradient Penalty (WGAN-GP) loss function, using metrics such as Wasserstein distance, gradient penalty, and discriminator scores for real and generated samples to ensure transparency and stability. The training was conducted on an Intel i9-10900K CPU with 64 GB of RAM and an NVIDIA RTX 4,000 GPU with 8 GB of VRAM. The model was trained for a total of 50 epochs, which required approximately 24 h.

Figure 3. Illustration of 3D Image Generation from 2D Shale Images, adapted from Kench and Cooper, 2020.
Currently, all 3D reconstruction techniques face a common challenge of the inability to directly reconstruct large-scale 3D digital rocks. This means that the voxel dimensions of reconstructed 3D images are limited. The maximum output of the SliceGAN model is 384 × 384 × 384 pixels. Therefore, in order to construct REV-size digital rocks of shale OM, we first determine the REV size of shale OM. Then, we substantially coarsen the classified OM at the high resolution. Because the size of an OM watershed is generally much larger than that of OM pores and the OM classification is completed before the resolution reduction, the pore structure information of OM watersheds can be retained according to its type.
3 Results and discussion
3.1 REV analysis and organic matter types
The REV analysis of different components in the three samples shows that when randomly sampled regions are smaller than 50 μm, the area ratios of the components exhibit large fluctuations, indicating unstable statistical results. As the sampling region gradually increases, the area ratios of the components (including matrix, OM with subresolution pores, and OM pores) become much more stable at the region size of 100 µm as shown in Figure 4. This may indicate that the length scale of 100 µm can be an appropriate REV size for characterizing the distribution of different components in shales. It is worth noting that the size of 100 µm may not be applicable to other shale samples or other properties such as microfractures and clays. Moreover, the 2D REV size may be relatively larger than the corresponding 3D REV size, given the fact that the 2D case holds much less information of shale components.
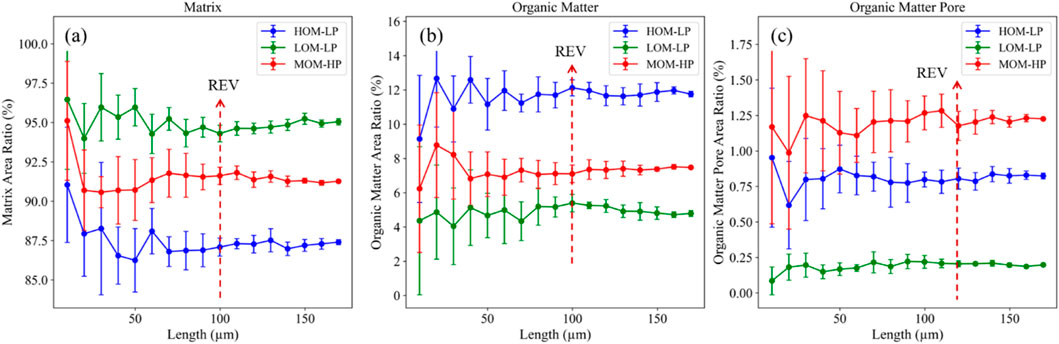
Figure 4. The Area ratios of shale components in the MAPS images at different statistical region Sizes. (A) matrix contents, (B) OM contents, and (C) contents of OM pores.
Table 2 lists the percentages of the three OM types in the three shale samples at three different image resolutions. It is seen that the image resolution has minor impact on the percentages, which can verify the reconstruction of REV-size digital rocks of OM on substantially coarsened MAPS images. HOM-LP has the OM content of 12.18%, but a low total OM porosity of 6.4%, primarily consisting of Type C OM (up to 10%). MOM-HP has the OM content of 8.56%, with a higher OM porosity of 14.28%, consisting of Type A (1.7%), Type B (4.42%), and Type C (2.44%) OM. LOM-LP has the OM content of 4.9%, with a low total OM porosity of 4.27%, primarily composed of Type C (up to 4.3%) OM. For the present shale samples, Type B and Type C OM is dominant, except for MOM-HP that is also rich in Type A OM, giving rise to a relatively high total OM porosity.
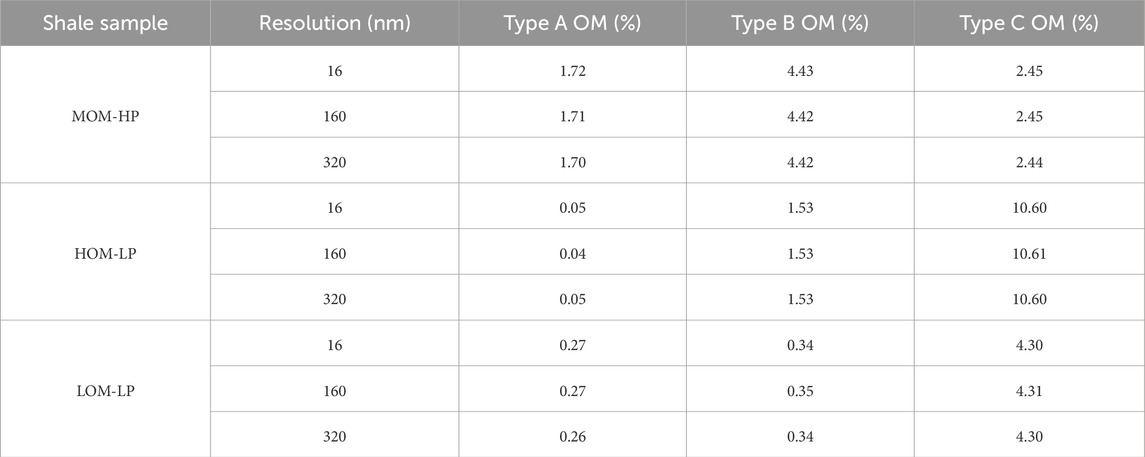
Table 2. Absolute percentages of OM types in the three shale samples at three different image resolutions.
Figure 5 shows the distributions of the classified OM including Type A in green, Type B in red, and Type C in blue. When the original resolution is reduced by 20 times, the image sizes are reduced from 12,288 × 12,288 pixels to 614 × 614 pixels. It is seen that besides the percentages, the 2D distributions of the three types of OM at the two resolutions are in good consistence. Additionally, based on our image analysis in the ImageJ, regardless of the OM content, there is no 2D connectivity of OM throughout the MAPS images, which is consistent with previous studies (Curtis et al., 2014). Therefore, the 3D reconstruction will be indispensable to analyze the connectivity of REV-size OM.
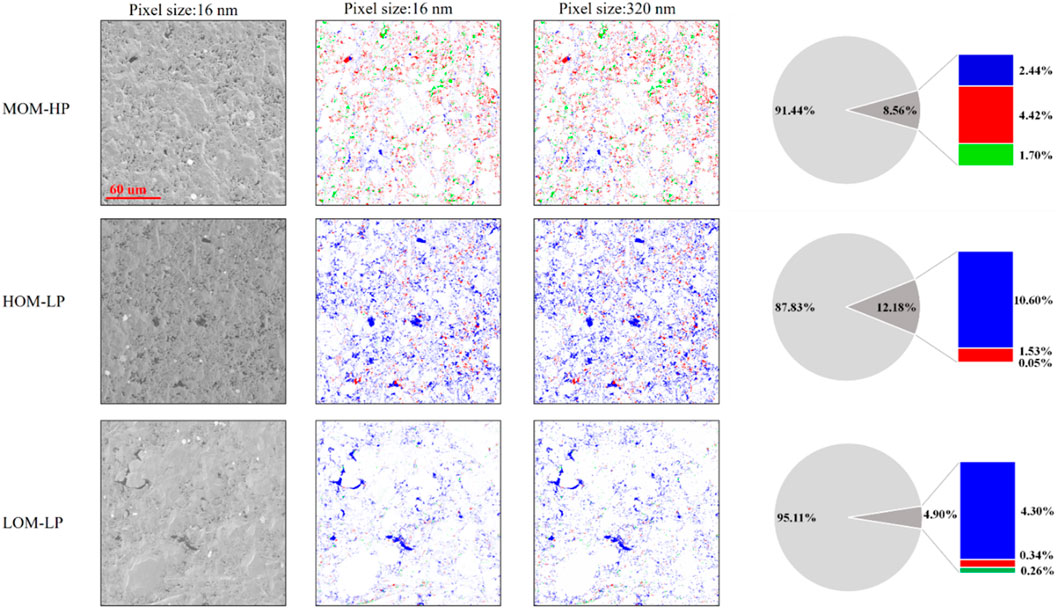
Figure 5. Distributions of the Classified OM including Type A in green, Type B in red, and Type C in blue, and their percentages in the whole MAPS images.
3.2 Connectivity of organic matter pores
To evaluate the accuracy of the SliceGAN model in reconstructing 3D shale digital cores from 2D slices, we used a FIB-SEM 2D slice to reconstruct the organic matter and organic pores of shale. The FIB-SEM image resolution is 4 nm, with dimensions of 1,600 × 1,600 × 1,000 pixels. For validation, we selected a single slice along the Z-axis and extracted a 384 × 384-pixel sub-image. This sub-image was then used as input for the SliceGAN model to reconstruct the 3D image, as shown in Figure 6. The reconstruction, conducted with AVIZO software, was compared to FIB-SEM images. The results indicated that the organic porosity derived from FIB-SEM images was 25.02%, while that reconstructed using SliceGAN was 24.66%, yielding an error of less than 5%. Additionally, the pore diameter and coordination number distributions obtained from the FIB-SEM images and SliceGAN reconstructions were in good agreement. The average coordination number for the FIB-SEM images is 3.14, with an average pore diameter of 67.82 nm, while the SliceGAN-generated 3D images show an average coordination number of 2.65 and an average pore diameter of 72.11 nm. These parameters demonstrate a good level of consistency between the two datasets, confirming that 3D images reconstructed from 2D shale slices using SliceGAN are both reliable and accurate.
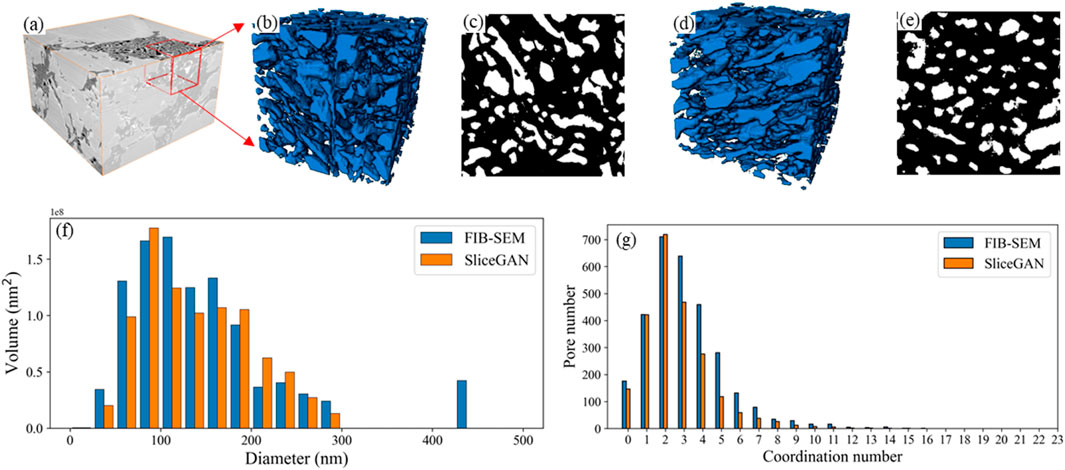
Figure 6. Comparison between FIB-SEM and SliceGAN generated images. (A) FIB-SEM 3D image. (B) 3D distribution of pores in a subregion of the FIB-SEM image. (C) The first slice of image (B), used as the 2D input for the SliceGAN model. (D) 3D pore distribution from the SliceGAN reconstruction. (E) 2D slice from the SliceGAN 3D reconstruction. (F) Comparison of pore diameter distributions between FIB-SEM and SliceGAN generated images. (G) Comparison of coordination number distributions between FIB-SEM and SliceGAN generated images.
To investigate the connectivity of resolved pores within different types of OM, instead of FIB-SEM reconstruction, three types of OM presented in the MOM-HP sample have been selected for the 3D reconstruction by the SliceGAN model, as shown in Figure 7. AVIZO (FSI, 2019) is used to conduct the connectivity analysis. It is found that resolved pores in the Type A OM (surface porosity of 28%) are well connected, while resolved pores in the Type B (surface porosity of 17%) and Type C (surface porosity of 1.8%) are disconnected with a few locally connected pores.
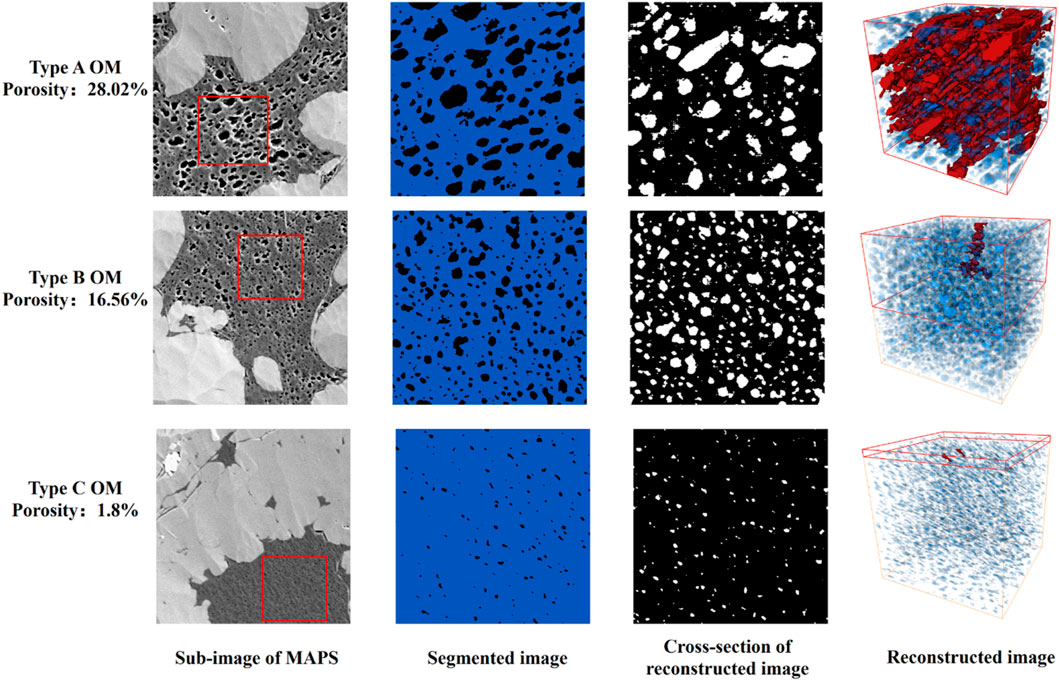
Figure 7. 3D reconstruction of each type of OM, the red color represents the pores connected along the Z-axis, while the blue color indicates all pores. The first column shows the types of OM. The second column shows the segmented 2D images. The third column shows cross-sections of 3D reconstructed OM. The fourth column shows the 3D OM pores of the reconstructed OM. Type A has connected pores while the other two types has isolated pores.
Figure 8 shows the distributions of coordination numbers and pore sizes in the three types of OM. It is seen that the Type B and Type C OM have more resolved pores than the Type A OM, but the Type A OM has the highest mean coordination number of 1.77. The equivalent pore diameters of the Type A OM are up to 200 nm with a mean value of around 100 nm. The equivalent pore diameters of the Type B OM are up to 100 nm with a mean value of around 50 nm. Moreover, as expected, the Type C OM has many much smaller resolved pores (smaller than 50 nm) as shown in the last column of Figure 8. The pore size distributions within different types of OM can reflect the different sates of gas occurrence including adsorbed and free gases. Previous studies have shown that the absolute adsorption capacity of OM decreases as the proportion of resolved pores increases, while the amount of free gas increases as the proportion of as the proportion of resolved pores increases (Ji et al., 2019a). Therefore, we may conclude the proportion of free gas is highest within the Type A OM, whereas the proportion of adsorbed gas is highest within the Type C OM.
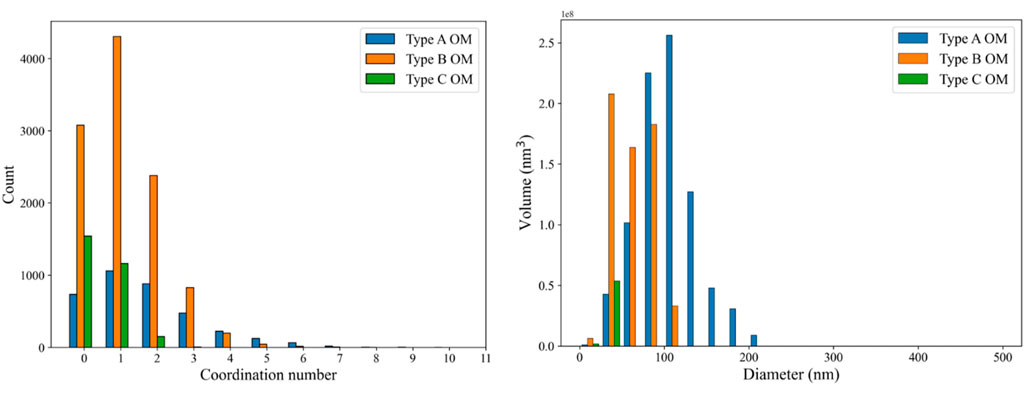
Figure 8. Distributions of coordination numbers and pore sizes in the three types of OM.
3.3 3D REV-size connectivity of organic matter
Due to the extremely low contents of Type A OM in HOM-LP and LOM-LP, in their 3D reconstruction we neglect the Type A OM. As shown in the first column of Figure 9, the 2D distributions of the three types of OM in the reconstructed digital rocks of OM are very similar to those in the training images (refer to Figure 5). Overall, the distributions of the three types of OM are relatively homogenous in the HOM-LP and MOM-HP shale samples, where the clay content is less than 5%, suggesting a limited contribution of clay to connectivity. In contrast, the distribution in the LOM-LP is much less uniform, with large OM clusters developed in some regions as shown in the second column of Figure 9. This is mainly because of its high clay content (around 40%) and low OM content (4.91%) as shown in Table 1, due to its higher clay content, the connectivity of these isolated OM elements may rely on clay minerals, which is an aspect that warrants further attention in future studies.
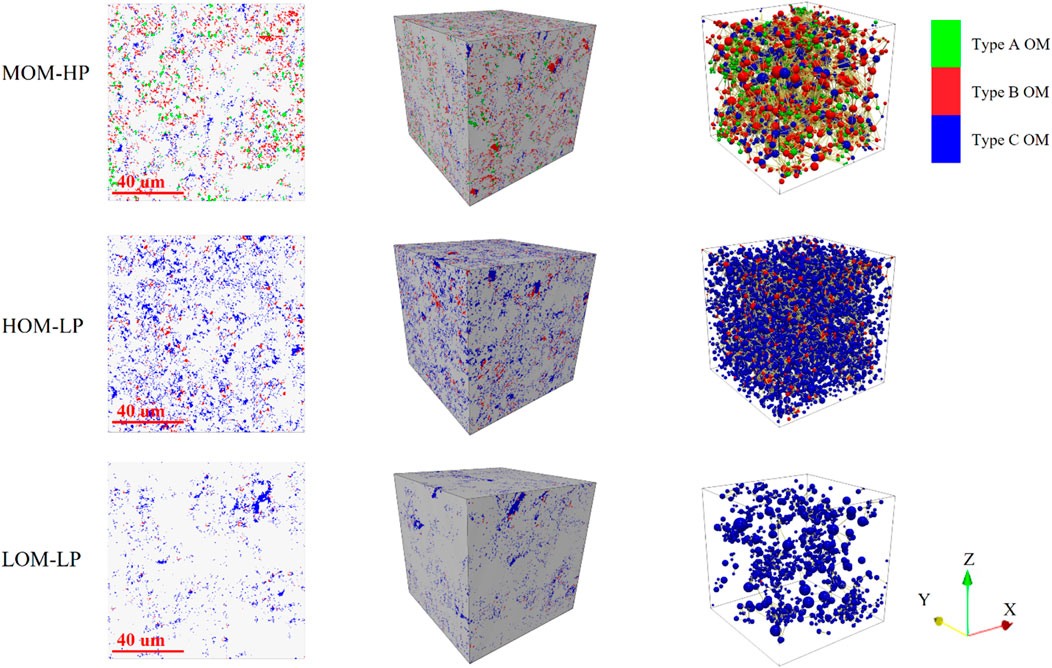
Figure 9. 3D REV-size reconstruction of the three shale samples. The first column shows the cross-sections of the reconstructed digital rocks (refer to the input 2D images in Figure 5). The second column shows the 3D reconstructed OM digital rocks. The third column shows the watersheds of the three types of OM, and their 3D connectivity.
We further use the open source code PoreSpy to extract the networks of OM composed of the three types of OM as shown in the last column of Figure 9. It is found that the average coordination number (CN) values for all the OM in HOM-LP, MOM-HP, and LOM-LP are 7.56, 4.77, and 3.01, respectively. As a whole, the three types of OM in HOM-LP and MOM-HP have good connections throughout the domains. Although LOM-LP holds a relatively high mean CN value, we see many isolated OM elements due to the nonuniform distribution. The high CN value is due to the formed well-connected OM clusters in some regions. As mentioned above, in the 2D full MAPS images, OM is not connected through the domains. However, our analysis shows that in the reconstructed 3D REV-size digital rocks of OM, OM is connected, even for the LOM-LP sample.
Given the fact that the three types of OM correspond to different capacities of gas flow and occurrence, it is of importance to understand the connectivity of each type of OM. In the HOM-LP sample, only the Type C OM forms connective pathways throughout the domain, due to its high content (10.83%) listed in Table 3. In the other two shale samples, the Type A and Type B OM do not exhibit overall connectivity, and require the Type C OM to form the overall connectivity. Although the Type A OM features high flow conductance, it needs to connect with the Type B and Type C OM of much low conductance to achieve the overall connectivity at the REV size. This indicates that at the REV scale gas flow capacity is dominated by the Type C OM in our case studies. Moreover, Connectivity statistics along the Z direction by Avizo show that the OM content in HOM-LP is 13.26%, with connected OM content of 12.66%. For MOM-HP, the OM content is 9.3%, with 7.85% connected OM. In the LOM-LP sample, the OM content is 4.25%, with least connected OM of 2.02%.
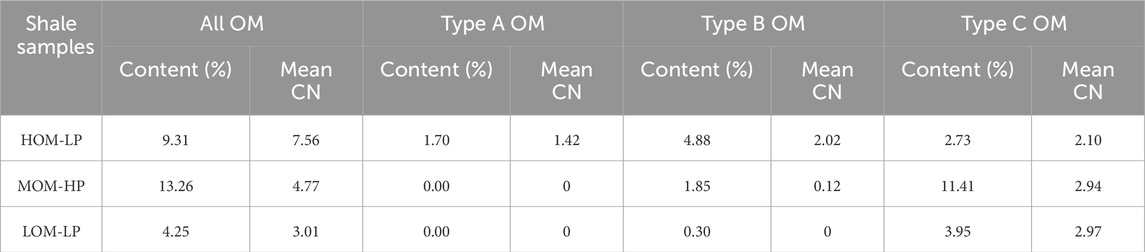
Table 3. Information of the 3D reconstructed REV-size digital rocks of OM.
4 Conclusions and outlook
OM serves as the basis for hydrocarbon generation in shale gas, and plays an important role in gas transport. Understanding the connectivity of REV-size OM is crucial to assess the potential and production capacity of shale gas. In this work, we have developed a novel workflow for numerical reconstruction of REV-size OM digital rocks, which can integrate high-resolution information of pore structures in large-view MAPS images. OM in the MAPS images is segmented, classified, and reconstructed to determine its REV size. By using the SliceGAN model, the 3D structures of different types of OM (termed as Type A with high porosity, Type B with medium porosity, and Type C with low porosity) are presented, and their connectivity at the REV size is extensively analyzed.
Three in-situ shale samples with different OM contents are used for illustration. Our results show that the REV size of OM in the 2D MAPS images is approximately 100 μm, and OM is generally disconnected throughout the domains. In the 3D reconstructed REV-size digital rocks of OM, as a whole, the three types of OM form connected pathways throughout the domains, but each type of OM is not inherently connected. The Type A and Type B OM hold poor connectivity, while the type C OM with low porosity holds the best connectivity, dominating gas transport in OM at the REV scale.
As a first attempt, this work focuses on the characterization and evaluation of REV-size OM connectivity, neglecting the influence of clay minerals. It is known that porous clays will enhance the connectivity of OM, particularly at high clay contents (e.g., the LOM-LP sample in this work). In the future studies, two research questions may be addressed: (1) how does clays contribute or impact gas transport pathways and capacity? (2) Besides the overall connectivity of different types of OM, how does the Type A OM influence REV-scale gas apparent permeability and gas occurrence?
Data availability statement
All data in this work is available upon request (Y2hhb3pob25nLnFpbkBnbWFpbC5jb20=).
Author contributions
DL: Funding acquisition, Methodology, Software, Visualization, Writing–original draft, Writing–review and editing. XY: Funding acquisition, Supervision, Writing–review and editing. SZ: Funding acquisition, Supervision, Writing–review and editing. DZ: Funding acquisition, Resources, Supervision, Writing–review and editing. SH: Funding acquisition, Supervision, Writing–review and editing. NZ: Funding acquisition, Supervision, Writing–review and editing. JR: Methodology, Software, Validation, Visualization, Writing–original draft, Writing–review and editing. BS: Methodology, Software, Writing–original draft. ZW: Methodology, Software, Visualization, Writing–original draft, Writing–review and editing, Supervision. C-ZQ: Funding acquisition, Methodology, Software, Validation, Visualization, Writing–original draft, Writing–review and editing.
Funding
The author(s) declare that financial support was received for the research, authorship, and/or publication of this article. We acknowledge the support of National Natural Science Foundation of China (No. 12072053 and No. U23A20595) and the Science and Technology Project of CNPC (No. 2023ZZ21).
Conflict of interest
Authors DL, XY, SZ, DZ, SH, and NZ were employed by PetroChina Southwest Oil and Gasfield Company.
The remaining authors declare that the research was conducted in the absence of any commercial or financial relationships that could be construed as a potential conflict of interest.
The authors declare that this study received funding from CNPC. The funder was involved in the study design, data collection, analysis, and interpretation of data.
Generative AI statement
The author(s) declare that no Generative AI was used in the creation of this manuscript.
Publisher’s note
All claims expressed in this article are solely those of the authors and do not necessarily represent those of their affiliated organizations, or those of the publisher, the editors and the reviewers. Any product that may be evaluated in this article, or claim that may be made by its manufacturer, is not guaranteed or endorsed by the publisher.
References
Arganda-Carreras, I., Kaynig, V., Rueden, C., Eliceiri, K. W., Schindelin, J., Cardona, A., et al. (2017). Trainable Weka Segmentation: a machine learning tool for microscopy pixel classification. Bioinformatics 33 (15), 2424–2426. doi:10.1093/bioinformatics/btx180
Borjigin, T., Lu, L., Yu, L., Zhang, W., Pan, A., Shen, B., et al. (2021). Formation, preservation and connectivity control of organic pores in shale. Pet. Explor. Dev. 48 (4), 798–812. doi:10.1016/S1876-3804(21)60067-8
Cao, D., Hou, Z., Liu, Q., and Fu, F. (2022). Reconstruction of three-dimension digital rock guided by prior information with a combination of InfoGAN and style-based GAN. J. Petroleum Sci. Eng. 208, 109590. doi:10.1016/j.petrol.2021.109590
Curtis, M. E., Goergen, E. T., Jernigen, J. D., Sondergeld, C. H., and Rai, C. S. (2014). “High-resolution mapping of the distribution and connectivity of organic matter in shales,” in Paper presented at the SPE annual technical conference and exhibition.
FSI (2019). Avizo software. Available at: https://www.thermofisher.com/cn/en/home/electron-microscopy/products/software-em-3d-vis/avizo-software.html.
Gao, F., Song, Y., Li, Z., Xiong, F., Chen, L., Zhang, X., et al. (2018). Quantitative characterization of pore connectivity using NMR and MIP: a case study of the Wangyinpu and Guanyintang shales in the Xiuwu basin, Southern China. Int. J. Coal Geol. 197, 53–65. doi:10.1016/j.coal.2018.07.007
Gao, Z., Bai, L., Hu, Q., Yang, Z., Jiang, Z., Wang, Z., et al. (2024). Shale oil migration across multiple scales: a review of characterization methods and different patterns. Earth Sci. Rev. 254, 104819. doi:10.1016/j.earscirev.2024.104819
Garum, M., Glover, P. W. J., Lorinczi, P., Scott, G., and Hassanpour, A. (2020). Ultrahigh-resolution 3D imaging for quantifying the pore nanostructure of shale and predicting gas transport. Energy. Fuels 35 (1), 702–717. doi:10.1021/acs.energyfuels.0c03225
Gou, Q., Xu, S., Hao, F., Yang, F., Shu, Z., and Liu, R. (2021). The effect of tectonic deformation and preservation condition on the shale pore structure using adsorption-based textural quantification and 3D image observation. Energy 219, 119579. doi:10.1016/j.energy.2020.119579
Guo, B., Ma, L., and Tchelepi, H. A. (2018). Image-based micro-continuum model for gas flow in organic-rich shale rock. Adv. Water Resour. 122, 70–84. doi:10.1016/j.advwatres.2018.10.004
Ji, L., Lin, M., Jiang, W., Cao, G., Zhou, J., and Luo, C. (2019a). Investigation into the apparent permeability and gas-bearing property in typical organic pores in shale rocks. Mar. Pet. Geol. 110, 871–885. doi:10.1016/j.marpetgeo.2019.08.030
Ji, L. L., Lin, M., Cao, G. H., and Jiang, W. B. (2019b). A core-scale reconstructing method for shale. Sci. Rep. 9, 4364. doi:10.1038/s41598-019-39442-5
Kench, S., and Cooper, S. J. (2021). Generating three-dimensional structures from a two-dimensional slice with generative adversarial network-based dimensionality expansion. Nat. Mach. Intell. 3 (4), 299–305. doi:10.1038/s42256-021-00322-1
Kench, S., Squires, I., Dahari, A., and Cooper, S. J. (2022). MicroLib: a library of 3D microstructures generated from 2D micrographs using SliceGAN. Sci. Data 9 (1), 645. doi:10.1038/s41597-022-01744-1
Liu, L., Yao, J., Imani, G., Sun, H., Zhang, L., Yang, Y. F., et al. (2023). Reconstruction of 3D multi-mineral shale digital rock from a 2D image based on multi-point statistics. Front. Earth Sci. 10. doi:10.3389/feart.2022.1104401
Loucks, R. G., Reed, R. M., Ruppel, S. C., and Hammes, U. (2012). Spectrum of pore types and networks in mudrocks and a descriptive classification for matrix-related mudrock pores. AAPG Bull. 96 (6), 1071–1098. doi:10.1306/08171111061
Ma, L., Taylor, K. G., Dowey, P. J., Courtois, L., Gholinia, A., and Lee, P. D. (2017). Multi-scale 3D characterisation of porosity and organic matter in shales with variable TOC content and thermal maturity: examples from the Lublin and Baltic Basins, Poland and Lithuania. Int. J. Coal Geol. 180, 100–112. doi:10.1016/j.coal.2017.08.002
Ma, L., Taylor, K. G., Lee, P. D., Dobson, K. J., Dowey, P. J., and Courtois, L. (2016). Novel 3D centimetre-to nano-scale quantification of an organic-rich mudstone: the carboniferous bowland shale, northern england. Mar. Pet. Geol. 72, 193–205. doi:10.1016/j.marpetgeo.2016.02.008
Milliken, K. L., Rudnicki, M., Awwiller, D. N., and Zhang, T. (2013). Organic matter-hosted pore system, marcellus formation (devonian), Pennsylvania. AAPG Bull. 97 (2), 177–200. doi:10.1306/07231212048
Mosser, L., Dubrule, O., and Blunt, M. J. (2017). Reconstruction of three-dimensional porous media using generative adversarial neural networks. Phys. Rev. E 96 (4), 043309. doi:10.1103/PhysRevE.96.043309
Okabe, H., and Blunt, M. J. (2004). Prediction of permeability for porous media reconstructed using multiple-point statistics. Phys. Rev. E 70 (6), 066135. doi:10.1103/PhysRevE.70.066135
Schindelin, J., Arganda-Carreras, I., Frise, E., Kaynig, V., Longair, M., Pietzsch, T., et al. (2012). Fiji: an open-source platform for biological-image analysis. Nat. Methods 9 (7), 676–682. doi:10.1038/nmeth.2019
Sun, M., Yu, B., Hu, Q., Yang, R., Zhang, Y., and Li, B. (2017). Pore connectivity and tracer migration of typical shales in south China. Fuel 203, 32–46. doi:10.1016/j.fuel.2017.04.086
Tahmasebi, P., Javadpour, F., and Sahimi, M. (2015). Three-dimensional stochastic characterization of shale SEM images. Transp. Porous Media 110 (3), 521–531. doi:10.1007/s11242-015-0570-1
Tahmasebi, P., Javadpour, F., and Sahimi, M. (2016). Stochastic shale permeability matching: three-dimensional characterization and modeling. Int. J. Coal Geol. 165, 231–242. doi:10.1016/j.coal.2016.08.024
Tang, X., Jiang, Z., Jiang, S., and Li, Z. (2016). Heterogeneous nanoporosity of the Silurian Longmaxi Formation shale gas reservoir in the Sichuan Basin using the QEMSCAN, FIB-SEM, and nano-CT methods. Mar. Pet. Geol. 78, 99–109. doi:10.1016/j.marpetgeo.2016.09.010
Wang, D., Yao, J., Chen, Z., Song, W., Cai, M., Tian, M., et al. (2022). Image-based model for dynamic apparent gas permeability in Organic-rich shales. Fuel 318, 123588. doi:10.1016/j.fuel.2022.123588
Wang, Q., Hu, Q., Larsen, C., Zhao, C., Sun, M., Zhang, Y., et al. (2021). Microfracture-pore structure characterization and water-rock interaction in three lithofacies of the Lower Eagle Ford Formation. Eng. Geol. 292, 106276. doi:10.1016/j.enggeo.2021.106276
Wei, J., Zhou, X., Shamil, S., Yuriy, K., Yang, E., Yang, Y., et al. (2023). Lithofacies influence characteristics on typical shale pore structure. Energy 282, 128728. doi:10.1016/j.energy.2023.128728
Wu, J., Yuan, Y., Niu, S., Wei, X., and Yang, J. (2020). Multiscale characterization of pore structure and connectivity of Wufeng-Longmaxi shale in Sichuan Basin, China. Mar. Pet. Geol. 120, 104514. doi:10.1016/j.marpetgeo.2020.104514
Xu, S., Gou, Q., Hao, F., Zhang, B., Shu, Z., Lu, Y., et al. (2020). Shale pore structure characteristics of the high and low productivity wells, Jiaoshiba shale gas field, Sichuan Basin, China: dominated by lithofacies or preservation condition? Mar. Pet. Geol. 114, 104211. doi:10.1016/j.marpetgeo.2019.104211
Yang, R., He, S., Yi, J., and Hu, Q. (2016). Nano-scale pore structure and fractal dimension of organic-rich Wufeng-Longmaxi shale from Jiaoshiba area, Sichuan Basin: investigations using FE-SEM, gas adsorption and helium pycnometry. Mar. Pet. Geol. 70, 27–45. doi:10.1016/j.marpetgeo.2015.11.019
Yang, W., Wang, Y., Du, W., Song, Y., Jiang, Z., Wang, Q., et al. (2022). Behavior of organic matter-hosted pores within shale gas reservoirs in response to differential tectonic deformation: potential mechanisms and innovative conceptual models. J. Nat. Gas. Sci. Eng. 102, 104571. doi:10.1016/j.jngse.2022.104571
Yang, X., Liu, D., Zhang, D., Huang, S., Jiang, R., Rong, J., et al. (2024). The pore-network-continuum hybrid modeling of nonlinear shale gas flow in digital rocks of organic matter. SSRN. doi:10.2139/ssrn.4943036
Zhang, T., Du, Y., Huang, T., and Li, X. (2016). Stochastic simulation of geological data using isometric mapping and multiple-point geostatistics with data incorporation. J. Appl. Geophys. 125, 14–25. doi:10.1016/j.jappgeo.2015.12.005
Zhang, T., Li, D. Y., and Lu, F. F. (2021). A pore space reconstruction method of shale based on autoencoders and generative adversarial networks. Comput. Geosci. 25 (6), 2149–2165. doi:10.1007/s10596-021-10083-w
Zhang, Y., Chang, J., Jiang, Z., Gao, Z., Zhang, C., Wang, G., et al. (2024). Visualization of dynamic micro-migration of shale oil and investigation of shale oil movability by NMRI combined oil charging/water flooding experiments: a novel approach. Mar. Pet. Geol. 165, 106907. doi:10.1016/j.marpetgeo.2024.106907
Zhang, Y.-F., Qu, M.-L., Yang, J.-P., Foroughi, S., Niu, B., Yu, Z.-T., et al. (2025). Prediction of CO2 storage efficiency and its uncertainty using deep-convolutional GANs and pore network modelling. Appl. Energy 381, 125142. doi:10.1016/j.apenergy.2024.125142
Zhao, J., Hu, Q., Liu, K., Jin, Z., Dultz, S., Kaufmann, J., et al. (2020). Pore connectivity characterization of shale using integrated wood’s metal impregnation, microscopy, tomography, tracer mapping and porosimetry. Fuel 259, 116248. doi:10.1016/j.fuel.2019.116248
Keywords: organic matter, MAPS images, REV size, connectivity, 3D reconstruction of digital rocks
Citation: Liu D, Yang X, Zhao S, Zhang D, Huang S, Zhu N, Rong J, Shi B, Wang Z and Qin C-Z (2025) Three-dimensional reconstruction and connectivity analysis of REV-size organic matter in shales. Front. Earth Sci. 13:1537217. doi: 10.3389/feart.2025.1537217
Received: 30 November 2024; Accepted: 09 January 2025;
Published: 24 January 2025.
Edited by:
Xin Sun, Sinopec Matrix Co., Ltd., ChinaReviewed by:
Xiukun Wang, China University of Petroleum, Beijing, ChinaQingqi Zhao, University of Stuttgart, Germany
Copyright © 2025 Liu, Yang, Zhao, Zhang, Huang, Zhu, Rong, Shi, Wang and Qin. This is an open-access article distributed under the terms of the Creative Commons Attribution License (CC BY). The use, distribution or reproduction in other forums is permitted, provided the original author(s) and the copyright owner(s) are credited and that the original publication in this journal is cited, in accordance with accepted academic practice. No use, distribution or reproduction is permitted which does not comply with these terms.
*Correspondence: Zhiwei Wang, MjcxNzk3NDAyM0BxcS5jb20=; Chao-Zhong Qin, Y2hhb3pob25nLnFpbkBjcXUuZWR1LmNu