 Nana Han
 Wending Miao3
 Liyuan Duan
- 1School of Civil Engineering, Universiti Sains Malaysia, Nibong Tebal, Penang, Malaysia
- 2Faculty of Architectural Engineering, Guizhou Equipment Manufacturing Polytechnic, Guiyang, Guizhou, China
- 3Guizhou Transportation Planning Survey and Design Academe Co., Ltd., Guiyang, Guizhou, China
- 4Guangxi Communications Design Group Co., Ltd., Nanning, Guangxi, China
- 5School of Physics, Universiti Sains Malaysia, Minden, Penang, Malaysia
- 6Faculty of Architectural Engineering, Guizhou Light Industry Technical College, Guiyang, Guizhou, China
- 7Yunnan Provincial Transportation Planning and Design Institute Co., Ltd., Kunming, Yunna, China
Introduction: Over the past few decades, China has vigorously advanced its strategy to build a powerful transportation network, constructing and maintaining numerous slope engineering projects. However, frequent major safety incidents caused by slope failures highlight the urgent need for automated identification of failure events during the operational phase of slopes.
Methods: This study integrates rainfall, surface displacement, and vertical displacement monitoring data, and proposes an automatic failure mode identification method based on deep convolutional autoencoder technology. The model is trained on monitoring data collected during the normal operational phase of slopes, extracting features from normal data to reconstruct the original data. The trained model is then utilized for structural anomaly detection by leveraging the characteristic that reconstruction errors for failure mode samples are significantly higher than for normal samples.
Results: A case study was conducted on a specific slope where, on 24 May 2024, the displacement development rate in some areas increased significantly, ultimately leading to collapse. The proposed model accurately identified the time and evolution of the landslide, demonstrating its capability to detect failure events effectively.
Discussion: Validation results confirm that the model can effectively distinguish previously unseen abnormal modes, offering significant practical value for identifying similar structural anomalies. This approach provides a reliable tool for slope monitoring and anomaly detection, enhancing safety in slope engineering projects.
1 Introduction
In recent years, slope safety issues have garnered widespread attention. Research has shown that the key factors influencing slope stability primarily include rainfall and groundwater levels (Zhang et al., 2011; Jiang et al., 2020; Yang and Zhang, 2024; Zhao et al., 2024). From the perspective of structural forces, the types of forces acting on slopes are relatively simple. Under normal circumstances, when the response remains within a stable range, it indicates that the slope is in a stable state. However, accidents caused by rainfall and changes in groundwater levels have become increasingly common (Arslan Kelam et al., 2024; Jing et al., 2024; Qin et al., 2024), making it imperative for managers to monitor the real-time operational status of critical slopes. Existing studies suggest that slope failure pattern identification methods can be broadly categorized into model-driven (Yuan et al., 2020; Wang et al., 2021; Liu and Wang, 2023; Chand and Koner, 2024; Garo et al., 2024; Huber et al., 2024; Shehadeh et al., 2024; Wang et al., 2024) and data-driven approaches (Bui et al., 2020; He et al., 2022; Alam et al., 2024). Model-driven techniques are limited by the specific characteristics of the studied objects, which restricts their applicability. To develop a more generalizable method for slope failure pattern recognition, health monitoring technology has been introduced. In recent years, the introduction of new monitoring technologies has significantly accelerated the rapid development of slope monitoring, such as the application of multi-field information monitoring technologies (Fang et al., 2023) and multi-smartphone photogrammetric monitoring systems (Fang et al., 2024). This technology provides an effective means of acquiring real-time data on slope environments and forces, enabling data-driven identification of slope failure patterns based on real-time monitoring data (Alam et al., 2024).
Extracting key indicators that characterize the operational status of slopes using observational data has become a focal point for researchers. For instance, mixed artificial intelligence models have been utilized to predict slope failure (Bui et al., 2020), and continuous random forests have been employed to automatically classify seismic signals related to slope instability (Wenner et al., 2020). A notable advantage of data-driven methods is their independence from specific structural forms, allowing for the exploration of the inherent features of the data based on structural characteristics, thereby yielding robust indicators with strong generalization capabilities to represent the structural operational status.
In recent years, artificial intelligence technologies have gained widespread attention in the field of data mining and have been applied in novel monitoring techniques. For example, the introduction of InSAR monitoring technology enables the acquisition of large-scale deformation data, and when combined with deep neural network techniques, it can predict the spatial and temporal trends of regional displacements (He et al., 2022; Lu et al., 2024). These monitoring techniques have also found successful applications in landslide monitoring (Anantrasirichai et al., 2020). Neural network technologies are widely used in various fields, such as object detection and natural language processing, and have achieved remarkable results in civil engineering, particularly in vision-based displacement monitoring. Drawing from these successful experiences, this study introduces deep convolutional autoencoder technology, which has been extensively used in the field of structural damage identification in civil engineering (Chen et al., 2024; Li et al., 2024; Teng et al., 2024). Compared to traditional methods that derive structural state indicators through theoretical analysis (Fan et al., 2024), deep convolutional autoencoders address the challenge of feature selection. Furthermore, this approach employs an unsupervised learning methodology, requiring only monitoring data from structures during their normal operational phase for model training. Once trained, the model can automatically identify abnormal patterns that differ from the normal operational state, effectively addressing the issue of data imbalance regarding abnormal patterns in civil engineering (Bao et al., 2019). Of course, there are many types of unsupervised learning methods, each suited to different application scenarios, such as the K-nearest neighbors algorithm (KNN) (Ramaswamy et al., 2000; Angiulli and Pizzuti, 2002), variational autoencoders (VAE) (Dong et al., 2018; Kim et al., 2018), and generative adversarial networks (GAN) (Schlegl et al., 2017). However, the deep convolutional autoencoder model (Cheng et al., 2018) employed in this study integrates both feature extraction and damage identification functionalities. With its end-to-end input-output structure, the model was selected for its compatibility with the specific characteristics of slope monitoring data and its strong modeling capabilities. The autoencoder excels at feature representation, effectively capturing both spatial and temporal patterns from multi-dimensional time series data, offering a deeper understanding of slope dynamics compared to traditional methods that may focus solely on statistical or temporal features. Its built-in denoising capability enhances the robustness of anomaly detection, enabling the model to prioritize meaningful patterns while mitigating the influence of noisy measurements commonly found in slope monitoring datasets. Furthermore, the approach is highly scalable, making it ideal for handling high-dimensional data, which is essential for complex monitoring scenarios.
Based on the aforementioned research, this paper employs deep convolutional autoencoder technology to integrate multi-source monitoring data of slopes, achieving precise identification of slope failure modes. The organization of this paper is as follows. Section 1 reviews the development history of abnormal pattern recognition in slopes and highlights the advantages of deep convolutional autoencoders. Section 2 introduces the engineering background, the characteristics of the monitoring data, the preprocessing methods used in this study, and the framework of the proposed method. Section 3 displays the results obtained from the study. Section 4 summarizes the findings of this paper.
2 Materials and methods
2.1 Data description and data preprocessing
2.1.1 Engineering overview
This study focuses on a cut slope located in a region characterized by tectonic erosion and hilly landforms. The slope has a height of approximately 15–20 m, with a natural gradient ranging from 20° to 50°. Based on borehole exploration and geological surveys, the surface layer of the slope is covered with Quaternary silty clay, with a thickness of 2–3 m and containing gravel, as shown in Figure 1. Beneath this layer, the bedrock belongs to the Cretaceous Jiangdihe Formation, consisting mainly of grayish-green silty mudstone and red mudstone, with localized intercalations of clay layers. The rock mass exhibits varying degrees of weathering, ranging from strong to moderate. It typically features relatively rough fractured textures and displays thin to medium bedding structures. The geological structure of this section is significantly influenced by tectonic activity, and the severe weathering of the rock mass results in the predominance of soil layers in the slope.
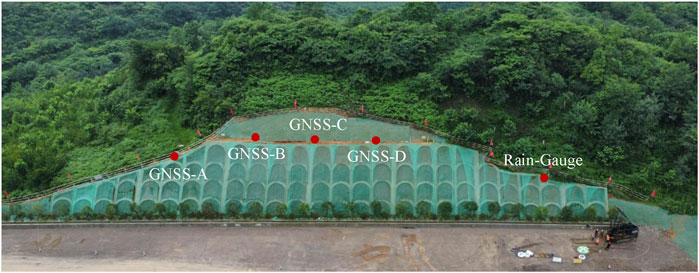
Figure 1. Slope site and sensor layout diagram.
Based on the geological conditions and stability analysis of the slope, combined with engineering analogies, the first level of the slope is supported using an arched skeleton structure. Within the skeleton, a combination of sprayed anchor mesh and grass planting is employed to provide protection, enhancing both the stability and ecological sustainability of the slope.
After the completion of the slope support structure construction, manual inspection revealed significant displacement and deformation trends at the designated measurement points. Consequently, four surface displacement monitoring points were set up. Additionally, to monitor the impact of rainfall on slope displacement development, a rain gauge was installed in an open area. To monitor the long-term stability of the slope, this study introduced GNSS monitoring and rainfall monitoring, establishing 4 GNSS measurement points and 1 rainfall measurement point, as shown in Figure 1. The sampling frequency for the GNSS measurement points is 1/1,800 Hz, while the sampling frequency for the rainfall measurement point is 1/3,600 Hz. The GNSS measurement points can monitor three-dimensional spatial displacements, and through conversion, both surface displacement (denoted as “dxy” in the following text) and vertical displacement (denoted as “dz” in the following text) at the measurement points can be obtained. This study selected monitoring data from 1 January 2022, to 31 May 2024, as the research object, with the time-series curve illustrated in Figure 2.
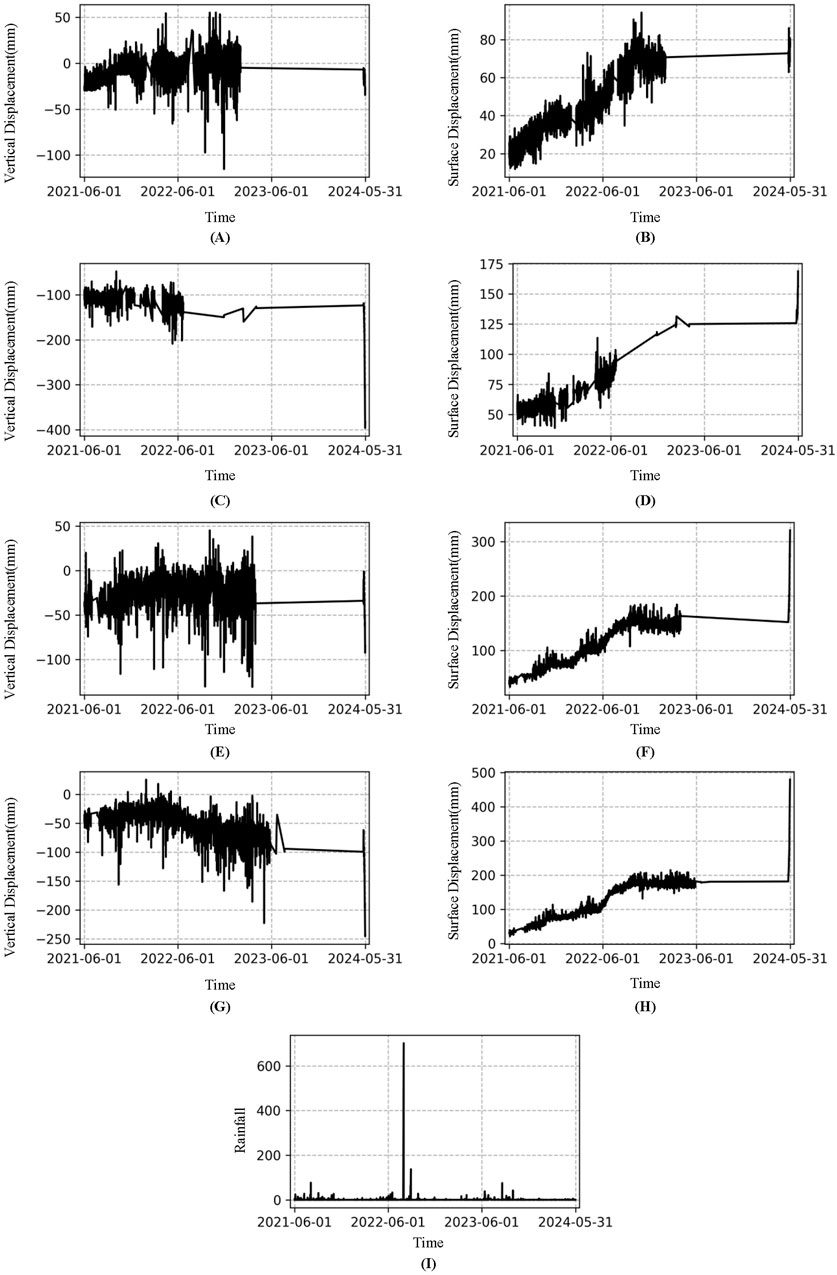
Figure 2. Time history of each sensor during the monitoring period. (A) Vertical displacement of GNSS-A. (B) Surface displacement of GNSS-A. (C) Vertical displacement of GNSS-B. (D) Surface displacement of GNSS-B. (E) Vertical displacement of GNSS-C. (F) Surface displacement of GNSS-C. (G) Vertical displacement of GNSS-D. (H) Surface displacement of GNSS-D. (I) Rain-Gauge.
2.1.2 Data preprocessing
As mentioned above, the sampling rates of the GNSS monitoring points and rainfall monitoring points are not consistent, and during the monitoring period, different sensors did not achieve synchronized data collection. To align the data from various sensors, we assume that the data between two observation points follow a linear relationship. Therefore, linear interpolation is used to estimate the data at any given time point. Based on the timestamps of the sampled data, we interpolate to obtain the hourly sample values within the selected time range, thereby completing the data alignment for all monitored variables.
For the purposes of model training and testing described later, the data is grouped into time frames of 24 h each. The timestamps of the monitoring data across 9 channels are aligned, and then the data from these 9 channels within the same time frame are taken together to form a single sample, with a sample size of 9 × 24, as shown in Figure 3. After removing missing data, a total of 710 samples were obtained over the entire monitoring period. Of these, 70% (497 samples) were used as the training set, 10% (71 samples) as the validation set, and 20% (142 samples) as the test set.
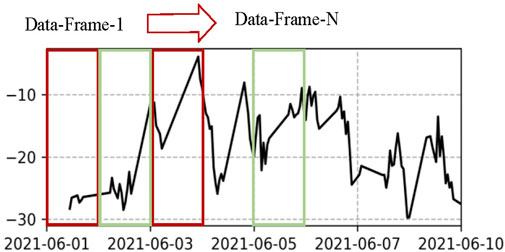
Figure 3. Data samples generated using a 24-h non-overlapping sliding window.
To visually demonstrate the differences in monitoring data before and after the landslide, this paper employs parallel coordinate visualization. In this approach, each monitoring channel is represented by a vertical axis, and the changes at each channel over time are displayed based on the magnitude of the monitored data. This allows for the identification of correlations between various monitored quantities at the same timestamp. By analyzing the results from multiple sensors, it becomes apparent that during the landslide event, significant displacement changes occurred in GNSS-B, GNSS-C, and GNSS-D, while no significant rainfall was observed during the period of large displacement changes. As shown in Figure 4, the correlation between rainfall and displacement is relatively weak, but the displacement correlation among the measurement points is relatively strong.
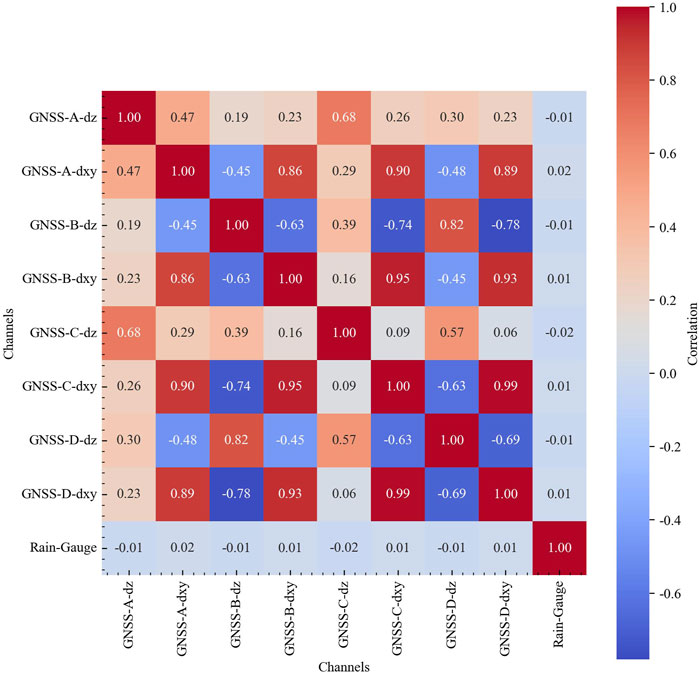
Figure 4. Correlation heatmap of slope monitoring sensors across different channels.
2.2 Methods
2.2.1 Framework of the proposed method
Based on the characteristics of the monitoring data described in the previous section, it can be observed that during the period of slope failure, the displacement of the monitored slope shifts rapidly, while the rate of displacement change remains relatively slow during normal operation. Leveraging this phenomenon, this paper proposes a slope failure mode identification method based on a deep convolutional autoencoder. The method utilizes monitoring data from the normal operation period as the training set, where the deep convolutional autoencoder extracts features corresponding to the normal operating state. Specifically, the encoder compresses high-dimensional monitoring data to capture the essential features of the slope’s normal behavior, while the decoder reconstructs the original data from these compressed features. After training, the model is applied to slope failure mode identification, where anomalies are detected by analyzing the residuals between the reconstructed data and the original data.
This approach falls under unsupervised learning algorithms, which means that the model does not require prior knowledge of any failure modes during the training process. It effectively addresses the issue of insufficient failure samples commonly encountered in civil engineering. By learning from normal operating data, the trained model can directly identify abnormal data features that deviate from the normal state, demonstrating strong generalization capabilities. The architecture of the model is shown in Figure 5.
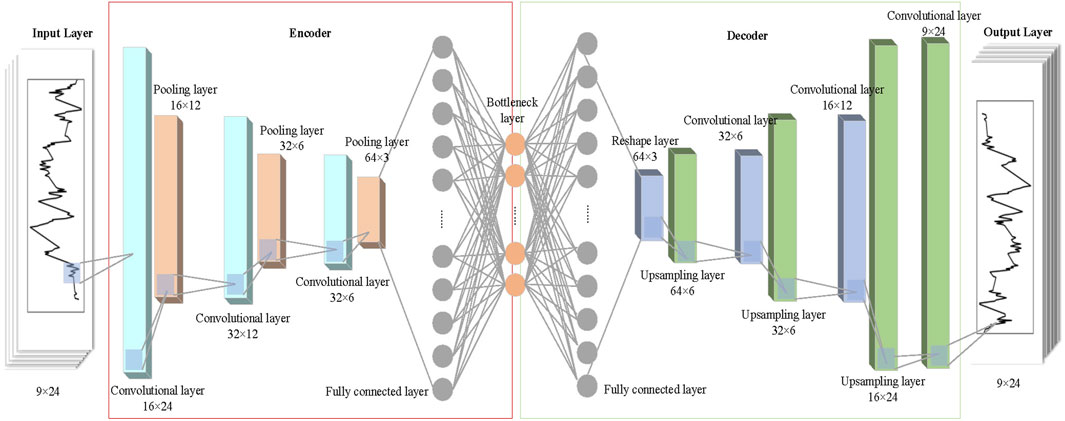
Figure 5. Model architecture diagram of the deep convolutional autoencoder.
The input to the model is a 9 × 24 matrix, where 9 represents the 9 monitoring channels: GNSS-A-dz, GNSS-A-dxy, GNSS-B-dz, GNSS-B-dxy, GNSS-C-dz, GNSS-C-dxy, GNSS-D-dz, GNSS-D-dxy, and Rain-Gauge, while 24 indicates that each data frame contains 24 sampling points. After processing through the encoder, the input reaches the bottleneck layer and is then reconstructed by the decoder. Given the relatively small input dimensions, this study employs a convolution kernel size of 3 to reduce the number of parameters while preserving local features of the data. A stride of 1 is used to retain as much data detail as possible. Various architectures with 3, 4, and 5 convolutional layers were tested. While deeper architectures slightly reduced training error, a 3-layer design was ultimately chosen to balance computational efficiency and parameter reduction. The structure of the encoder and decoder is shown in Table 1. The encoder utilizes the ReLU activation function, employs max pooling with a kernel size of 2 and a stride of 2; the upsampling layer has a scaling factor of 2, and all convolutional kernels have a size of 3 × 1, with a stride of 1 and padding of 1.
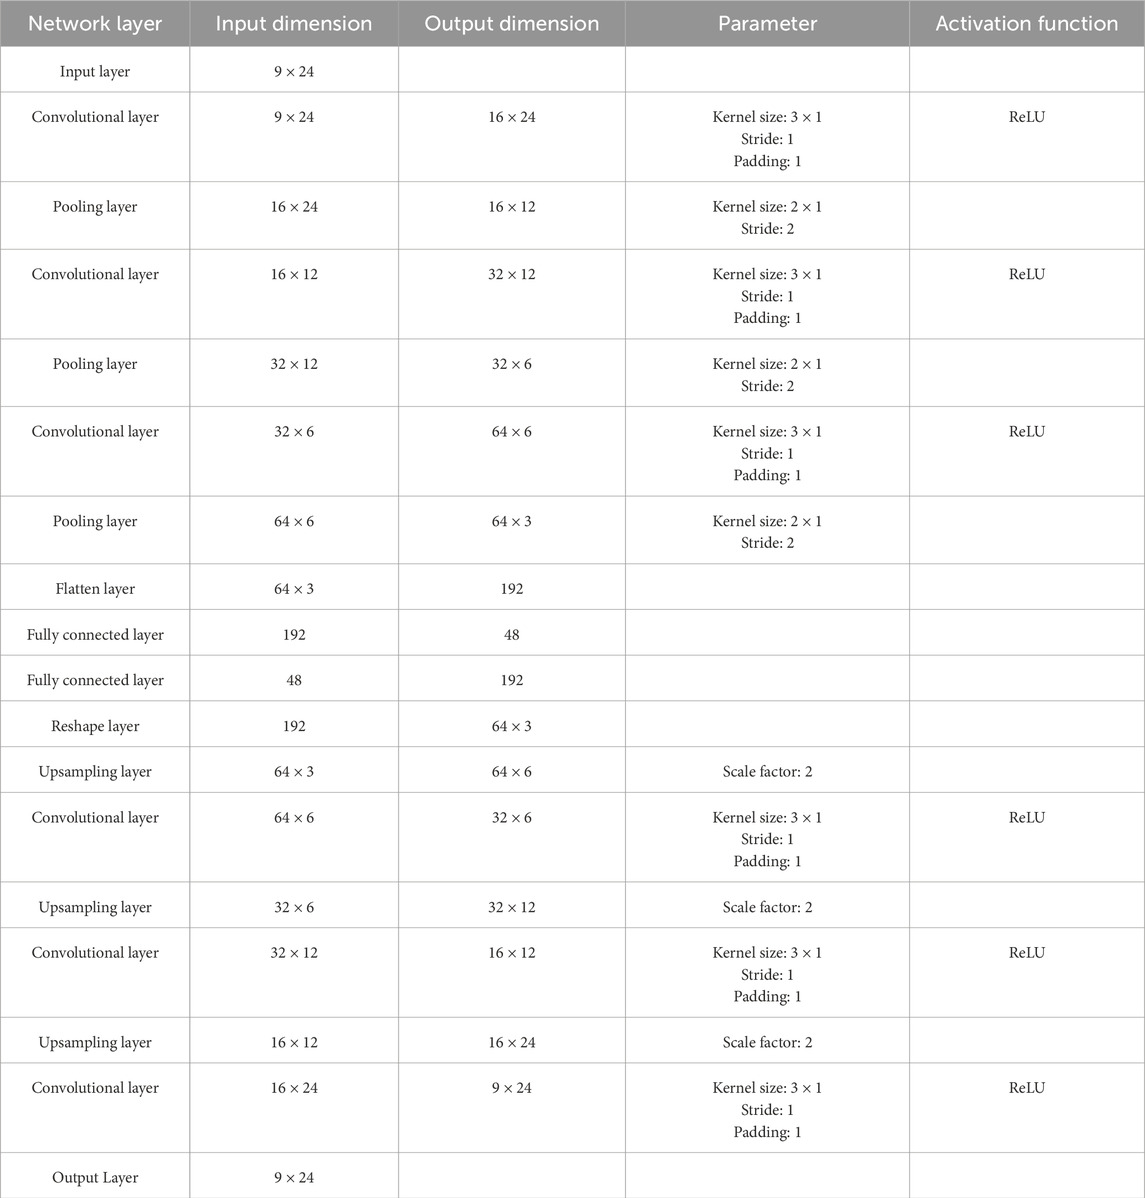
Table 1. Deep convolutional autoencoder configuration.
2.2.2 Performance evaluation
The unsupervised model used in this study for the identification of abnormal patterns in slopes can be viewed as a binary classification model, determining whether a structure is in a normal or abnormal state. Therefore, the model’s classification results can be evaluated using metrics such as accuracy, precision, recall, and F1 score. Accuracy measures the overall correctness of the model by dividing the number of correct predictions (true positives and true negatives) by the total number of predictions. Precision indicates how many of the positively predicted samples were actually correct. It focuses on the correctness of positive predictions. Recall measures how well the model can identify actual positive cases. It calculates the proportion of true positives out of all actual positives. The F1 score is the harmonic mean of precision and recall. It provides a balanced measure when you want to consider both false positives and false negatives. The calculation formulas are shown as Equations 1–4.
Where TP represents the count of samples that are genuinely positive and accurately classified as positive by the model. TN refers to the number of genuinely negative samples that the model correctly identifies as negative. FP indicates the count of samples that are truly negative but mistakenly classified as positive by the model. FN refers to the number of truly positive samples that the model incorrectly labels as negative.
2.2.3 Model training
In this study, 497 samples were used as the training set, 71 samples as the validation set, and 142 samples as the test set. The model was trained for 500 epochs with a batch size of 8. The loss function adopted was the mean squared error (MSE) loss, and the optimization algorithm used was Adam, with an initial learning rate of 1e-3 and a weight decay of 1e-5. The training loss during the process is shown in Figure 6. As observed, starting from the 100th epoch, the training loss stabilized. The final model parameters were selected based on the epoch where the sum of the training and validation losses was minimized. The model was trained on a machine equipped with a 6-core CPU, 16 GB of memory, and a GTX1650 GPU, completing the process in 5 min and 12 s. Built using PyTorch, the model can be deployed in engineering applications by creating a web-based microservice using the Flask framework. Real-time data can be processed by invoking the microservice, enabling the model to determine whether structural anomalies are present.
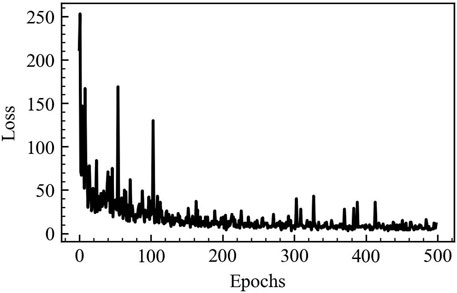
Figure 6. Mean squared error of the deep convolutional autoencoder model over 500 epochs.
3 Results
3.1 Anomaly pattern identification methods and results
The trained model was applied to the test dataset to identify slope failure patterns. The test dataset contains 134 samples from the slope’s normal operational state and 8 samples from the failure development or failure stage. To use the model’s reconstruction error for identifying slope failure patterns, the mean and standard deviation of the reconstruction error from the training samples were calculated to establish a threshold evaluation system. The prediction results of the trained model on both the training and validation datasets were collected and visualized using a bar chart, as shown in Figure 7A. It can be observed that the frequency distribution of errors resembles the shape of a normal distribution. A quantile-quantile (Q-Q) plot was further used to assess the deviation of the error distribution from a normal distribution, as depicted in Figure 7B. Apart from the data at both ends, most points lie approximately on a straight line, supporting the assumption that the errors follow a normal distribution. Based on this, the mean of the error samples plus three times the standard deviation was used as the threshold to determine whether data anomalies exist, enabling the identification of abnormal patterns in slopes.
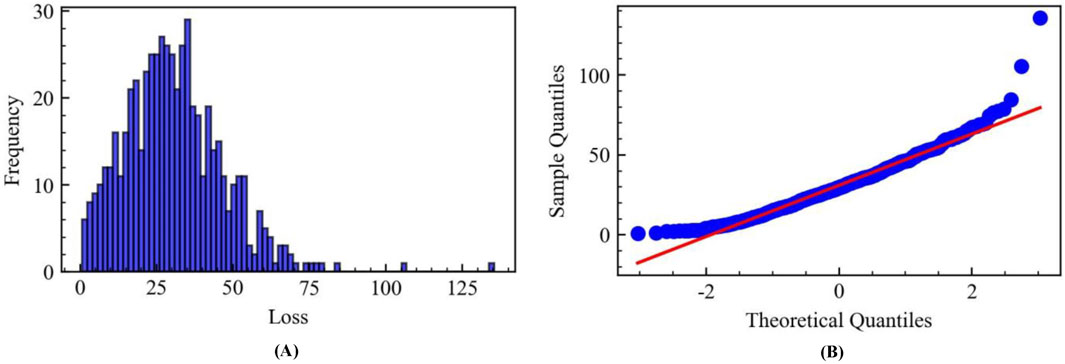
Figure 7. Frequency distribution and quantile-quantile plot of reconstruction loss for training and validation datasets. (A) Frequency distribution. (B) quantile-quantile plot.
In the test dataset, the 8 abnormal samples were derived from the monitoring data collected between 24 May 2024, and 31 May 2024. During these 8 days, the slope displacement gradually increased, with the rate of change accelerating each day. Using the anomaly detection method proposed in this study to determine whether the slope exhibited abnormal behavior, the model was able to accurately identify both the progression of the slope failure and the final failure event, as shown in Figure 8A. The site of the slope failure is shown in Figure 9. However, in the early stages of failure, specifically on 24 May 2024, when the displacement change was minimal, the model failed to detect the anomaly accurately. This is primarily because, in the early stages of a landslide, not all sensors are affected, and the mean squared error (MSE) metric inherently lacks sensitivity to early-stage anomalies. To enhance the timeliness of warnings, it is recommended to use a deep autoencoder as a feature extraction model, utilizing the features from its bottleneck layer as input to build an anomaly detection model that is more sensitive to fused features. For instance, an anomaly detection model based on Support Vector Machines (SVM) or a Gaussian Mixture Model (GMM) could be employed to address the insensitivity of MSE, which relies on averaging operations, to early-stage anomalies.
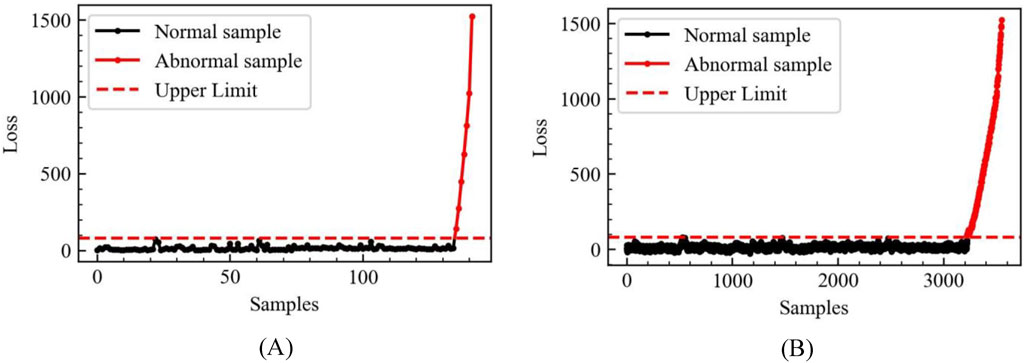
Figure 8. Slope anomaly pattern recognition results based on threshold and deep convolutional autoencoder reconstruction error. (A) Test sample recognition results with non-overlapping sliding window. (B) Test sample recognition results with overlapping sliding window.
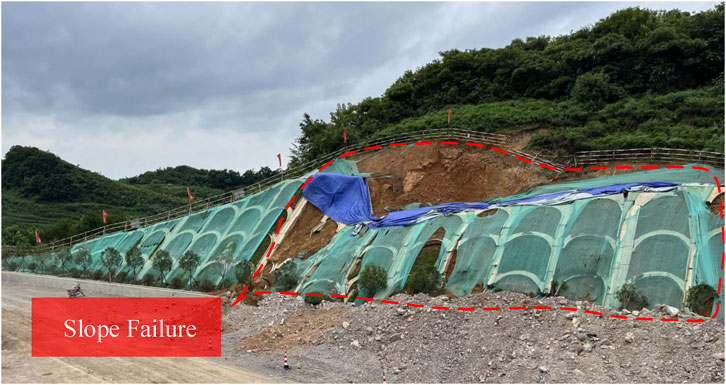
Figure 9. The on-site real image of the final slope collapse.
According to the performance evaluation metrics, the prediction accuracy in this case reached 99.30%, with a high accuracy for alarms, as shown in Table 2. With limited data, this study applies L1 regularization in the loss function by adding a regularization term to constrain the number of model parameters. Additionally, the Adam optimizer and weight decay mechanism are used to minimize the impact of overfitting. It should be noted that the most effective approach remains increasing the data volume. In the future, the dataset will be further expanded to establish a standardized anomaly detection sample set, providing a solid data foundation for training similar models.

Table 2. Performance evaluation metrics of the model on the test set with non-overlapping sliding window.
Results demonstrate that the model can accurately detect unseen data anomalies. This unsupervised learning algorithm has broad applicability, requiring only normal data samples for training. It effectively addresses the issue of insufficient anomalous data samples in structural monitoring.
3.2 Further improving the timeliness of anomaly pattern identification
To further enhance the timeliness of anomaly detection, the non-overlapping sliding window was replaced with an overlapping sliding window, as shown in Figure 10. The sliding step was set to 1 h, allowing a new sample to be constructed whenever new data arrived for the model to evaluate for anomalies. Validation on the test dataset using this approach revealed that the previous non-overlapping sliding window mode struggled to accurately detect anomalies due to small displacements on the first day, requiring 48 h to identify anomalies. In contrast, the overlapping sliding window mode successfully detected anomalies within 30 h, significantly reducing the anomaly detection time and improving the potential for practical engineering applications. The test set, constructed using overlapping sliding windows, contains a total of 3,385 samples, of which 192 samples correspond to monitoring data during the landslide occurrence process, while the remaining samples represent the normal operational stage of the slope. The model accurately classified 3,356 samples, while the remaining 29 samples, belonging to the early development stage of the landslide, were not correctly identified as landslide anomaly patterns. The classification results of the samples are detailed in Figure 8B, and the evaluation metrics are presented in Table 3. Since the sliding window includes more monitoring data from the early stages of landslide occurrence, which were not accurately identified, the accuracy, F1 score, and recall of the model have decreased compared to previous results.
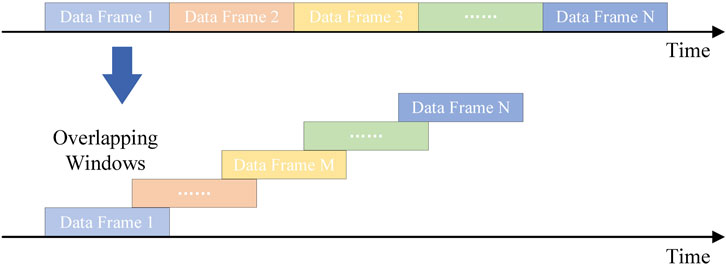
Figure 10. Schematic diagram of non-overlapping and overlapping windows.
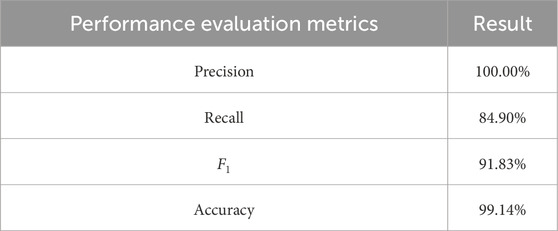
Table 3. Performance evaluation metrics of the model on the test set with overlapping sliding window.
4 Discussion
In this study, a deep convolutional autoencoder-based unsupervised failure mode recognition algorithm is proposed to identify and alert slope failure modes. This algorithm integrates surface displacement, vertical displacement, and rainfall monitoring data from the slope. By training the model with normal operation phase data, it assesses the proximity of the structure to failure by comparing the reconstruction error between the reconstructed and observed data. Validation through a slope case study revealed that the model can accurately identify the development stages of slope failure, achieving a recognition accuracy of 99.30%. However, this method has certain limitations. First, the current monitoring data contains many missing values, leading to insufficient model training. Further data collection is needed to establish a standardized dataset. Second, early detection of slope failure remains a challenge, largely due to the reliance on reconstruction error as the main assessment method. Future research will focus on using the bottleneck layer features of the model for anomaly recognition to further improve the accuracy of failure mode identification.
Data availability statement
The raw data supporting the conclusions of this article will be made available by the authors, without undue reservation.
Author contributions
NH: Conceptualization, Writing–original draft, Methodology, Investigation, Validation, Visualization, Writing–review and editing. WM: Resources, Writing–review and editing. ML: Resources, Writing–review and editing. MM: Writing–review and editing. QH: Resources, Writing–review and editing. LD: Writing–review and editing. JT: Writing–review and editing.
Funding
The author(s) declare that no financial support was received for the research, authorship, and/or publication of this article.
Acknowledgments
The authors wish to express their gratitude for the guidance received and the invaluable lessons learned throughout this academic endeavor. This research has been a meaningful learning experience, and we are deeply appreciative of the opportunity to contribute to the field.
Conflict of interest
Authors WM and QH were employed by Guizhou Transportation Planning Survey and Design Academe Co., Ltd. Author ML was employed by Guangxi Communications Design Group Co., Ltd. Author JT was employed by Yunnan Provincial Transportation Planning and Design Institute Co. Ltd.
The remaining authors declare that the research was conducted in the absence of any commercial or financial relationships that could be construed as a potential conflict of interest.
Generative AI statement
The author(s) declare that no Generative AI was used in the creation of this manuscript.
Publisher’s note
All claims expressed in this article are solely those of the authors and do not necessarily represent those of their affiliated organizations, or those of the publisher, the editors and the reviewers. Any product that may be evaluated in this article, or claim that may be made by its manufacturer, is not guaranteed or endorsed by the publisher.
Supplementary material
The Supplementary Material for this article can be found online at: https://www.frontiersin.org/articles/10.3389/feart.2025.1531857/full#supplementary-material
References
Alam, M. J. B., Manzano, L. S., Debnath, R., and Ahmed, A. A. (2024). Monitoring slope movement and soil hydrologic behavior using IoT and AI technologies: a systematic review. Hydrology 11 (8), 111. doi:10.3390/hydrology11080111
Anantrasirichai, N., Biggs, J., Kelevitz, K., Sadeghi, Z., Wright, T., Thompson, J., et al. (2020). Detecting ground deformation in the built environment using sparse satellite InSAR data with a convolutional neural network. IEEE Trans. Geoscience Remote Sens. 59 (4), 2940–2950. doi:10.1109/tgrs.2020.3018315
Angiulli, F., and Pizzuti, C. (2002). “Fast outlier detection in high dimensional spaces,” in European conference on principles of data mining and knowledge discovery (Springer), 15–27.
Arslan Kelam, A., Akgün, H., Bobet, A., and Koçkar, M. K. (2024). Engineering geological characterization and assessment of complex rock slope failures in Mudurnu, Turkey. Nat. Hazards 120 (4), 3271–3298. doi:10.1007/s11069-023-06331-0
Bao, Y., Tang, Z., Li, H., and Zhang, Y. (2019). Computer vision and deep learning–based data anomaly detection method for structural health monitoring. Struct. Health Monit. 18 (2), 401–421. doi:10.1177/1475921718757405
Bui, X.-N., Nguyen, H., Choi, Y., Nguyen-Thoi, T., Zhou, J., and Dou, J. (2020). Prediction of slope failure in open-pit mines using a novel hybrid artificial intelligence model based on decision tree and evolution algorithm. Sci. Rep. 10 (1), 9939. doi:10.1038/s41598-020-66904-y
Chand, K., and Koner, R. (2024). Failure zone identification and slope stability analysis of mine dump based on realistic 3D numerical modeling. Geotechnical Geol. Eng. 42 (1), 543–560. doi:10.1007/s10706-023-02588-1
Chen, J., Li, Q., Zhang, S., Lin, C., and Wei, S. (2024). Convolutional autoencoder-based damage detection for urban railway tracks using an ultra-weak FBG array monitoring system. IEEE Sensors J. 24, 33585–33593. doi:10.1109/jsen.2024.3411652
Cheng, Z., Sun, H., Takeuchi, M., and Katto, J. (2018). “Deep convolutional autoencoder-based lossy image compression,” in 2018 Picture Coding Symposium (PCS) (IEEE), 253–257. doi:10.1109/PCS.2018.8456308
Dong, C., Xue, T., and Wang, C. (2018). “The feature representation ability of variational autoencoder,” in 2018 IEEE Third International Conference on Data Science in Cyberspace (DSC) (IEEE), 680–684. doi:10.1109/DSC.2018.00108
Fan, Z., Tang, X., Chen, Y., Ren, Y., Deng, C., Wang, Z., et al. (2024). Review of anomaly detection in large span bridges: available methods, recent advancements and future trends. Adv. Bridge Eng. 5 (1), 2. doi:10.1186/s43251-024-00113-9
Fang, K., Dong, A., Tang, H., An, P., Wang, Q., Jia, S., et al. (2024). Development of an easy-assembly and low-cost multismartphone photogrammetric monitoring system for rock slope hazards. Int. J. Rock Mech. Min. Sci. 174, 105655. doi:10.1016/j.ijrmms.2024.105655
Fang, K., Miao, M., Tang, H., Jia, S., Dong, A., An, P., et al. (2023). Insights into the deformation and failure characteristic of a slope due to excavation through multi-field monitoring: a model test. Acta Geotech. 18 (2), 1001–1024. doi:10.1007/s11440-022-01627-0
Garo, T., Tesfaye, M., and Karuppannan, S. (2024). Slope stability modeling using limit equilibrium and finite element methods: a case study of the Adama City, Northern Main Ethiopian Rift. Quat. Sci. Adv. 15, 100228. doi:10.1016/j.qsa.2024.100228
He, Y., Yan, H., Yang, W., Yao, S., Zhang, L., Chen, Y., et al. (2022). Time-series analysis and prediction of surface deformation in the Jinchuan mining area, Gansu Province, by using InSAR and CNN–PhLSTM network. IEEE J. Sel. Top. Appl. Earth Observations Remote Sens. 15, 6732–6751. doi:10.1109/jstars.2022.3198728
Huber, M., Scholtès, L., and Lavé, J. (2024). Stability and failure modes of slopes with anisotropic strength: insights from discrete element models. Geomorphology 444, 108946. doi:10.1016/j.geomorph.2023.108946
Jiang, X., Zhanyuan, Z., Chen, H., Deng, M., Niu, Z., Deng, H., et al. (2020). Natural dam failure in slope failure mode triggered by seepage. Geomatics, Nat. Hazards Risk 11 (1), 698–723. doi:10.1080/19475705.2020.1746697
Jing, S., Alves, T. M., Omosanya, K. O., and Li, W. (2024). Long-term slope instability induced by the reactivation of mass transport complexes: an underestimated geohazard on the Norwegian continental margin. Bulletin 136 (3-4), 1701–1712. doi:10.1130/B36816.1
Kim, D., Yang, H., Chung, M., Cho, S., Kim, H., Kim, M., et al. (2018). “Squeezed convolutional variational autoencoder for unsupervised anomaly detection in edge device industrial internet of things,” in 2018 international conference on information and computer technologies (icict) (IEEE), 67–71. doi:10.1109/INFOCT.2018.8356842
Li, S., Cao, Y., Gdoutos, E. E., Tao, M., Alkayem, N. F., Avci, O., et al. (2024). Intelligent framework for unsupervised damage detection in bridges using deep convolutional autoencoder with wavelet transmissibility pattern spectra. Mech. Syst. Signal Process. 220, 111653. doi:10.1016/j.ymssp.2024.111653
Liu, X., and Wang, Y. (2023). Analytical solutions for annual probability of slope failure induced by rainfall at a specific slope using bivariate distribution of rainfall intensity and duration. Eng. Geol. 313, 106969. doi:10.1016/j.enggeo.2022.106969
Lu, J., Wang, Y., Zhu, Y., Liu, J., Xu, Y., Yang, H., et al. (2024). DACLnet: a dual-attention-mechanism CNN-lstm network for the accurate prediction of nonlinear InSAR deformation. Remote Sens. 16 (13), 2474. doi:10.3390/rs16132474
Qin, Y., Chen, Y., Lai, J., Qiu, J., Wang, Z., Liu, T., et al. (2024). Failures in loess slope-tunnel system: an overview of trigging sources, acting mechanism and mitigation strategies. Eng. Fail. Anal. 158, 107996. doi:10.1016/j.engfailanal.2024.107996
Ramaswamy, S., Rastogi, R., and Shim, K. (2000). “Efficient algorithms for mining outliers from large data sets,” in Proceedings of the 2000 ACM SIGMOD international conference on Management of data, 427–438. doi:10.1145/335191.335437SIGMOD Rec.
Schlegl, T., Seeböck, P., Waldstein, S. M., Schmidt-Erfurth, U., and Langs, G. (2017). “Unsupervised anomaly detection with generative adversarial networks to guide marker discovery,” in International conference on information processing in medical imaging (Springer), 146–157. doi:10.1007/978-3-319-59050-9_12
Shehadeh, A., Alshboul, O., and Almasabha, G. (2024). Slope displacement detection in construction: an automated management algorithm for disaster prevention. Expert Syst. Appl. 237, 121505. doi:10.1016/j.eswa.2023.121505
Teng, S., Liu, Z., Luo, W., Chen, G., and Cheng, L. (2024). Bridge anomaly detection based on reconstruction error and structural similarity of unsupervised convolutional auto-encoder. Struct. Health Monit. 23 (4), 2221–2237. doi:10.1177/14759217231200096
Wang, C., Li, L., Kou, H., Cheng, Y., and Meng, D. (2024). Rainfall induced slope reliability analysis using radial degraded random fields. Geotechnical Geol. Eng. 42 (7), 6523–6548. doi:10.1007/s10706-024-02905-2
Wang, H., Sun, P., Wang, G., and Wu, L. (2021). Experimental and numerical study of shallow loess slope failure induced by irrigation. Catena 206, 105548. doi:10.1016/j.catena.2021.105548
Wenner, M., Hibert, C., Meier, L., and Walter, F. (2020). Near real-time automated classification of seismic signals of slope failures with continuous random forests. Nat. Hazards Earth Syst. Sci. Discuss. 2020, 1–23. doi:10.5194/nhess-21-339-2021
Yang, H.-Q., and Zhang, L. (2024). Bayesian back analysis of unsaturated hydraulic parameters for rainfall-induced slope failure: a review. Earth-Science Rev. 251, 104714. doi:10.1016/j.earscirev.2024.104714
Yuan, W.-H., Liu, K., Zhang, W., Dai, B., and Wang, Y. (2020). Dynamic modeling of large deformation slope failure using smoothed particle finite element method. Landslides 17 (7), 1591–1603. doi:10.1007/s10346-020-01375-w
Zhang, L., Zhang, J., Zhang, L., and Tang, W. H. (2011). Stability analysis of rainfall-induced slope failure: a review. Proc. Institution Civ. Engineers-Geotechnical Eng. 164 (5), 299–316. doi:10.1680/geng.2011.164.5.299
Keywords: multi-source data fusion, deep convolutional autoencoder, slope displacement, rainfall, health monitoring
Citation: Han N, Miao W, Li M, Mohamad Ismail MA, Hu Q, Duan L and Tang J (2025) Integrating multi-source monitoring data and deep convolutional autoencoder technology for slope failure pattern recognition. Front. Earth Sci. 13:1531857. doi: 10.3389/feart.2025.1531857
Received: 21 November 2024; Accepted: 02 January 2025;
Published: 20 January 2025.
Edited by:
Wen Nie, Jiangxi University of Science and Technology, ChinaReviewed by:
Antonio Giovanni Iaccarino, University of Naples Federico II, ItalyKun Fang, Hong Kong University of Science and Technology, Hong Kong SAR, China
Copyright © 2025 Han, Miao, Li, Mohamad Ismail, Hu, Duan and Tang. This is an open-access article distributed under the terms of the Creative Commons Attribution License (CC BY). The use, distribution or reproduction in other forums is permitted, provided the original author(s) and the copyright owner(s) are credited and that the original publication in this journal is cited, in accordance with accepted academic practice. No use, distribution or reproduction is permitted which does not comply with these terms.
*Correspondence: Mohd Ashraf Mohamad Ismail, Y2Vhc2hyYWZAdXNtLm15