
94% of researchers rate our articles as excellent or good
Learn more about the work of our research integrity team to safeguard the quality of each article we publish.
Find out more
ORIGINAL RESEARCH article
Front. Earth Sci., 11 March 2025
Sec. Petrology
Volume 13 - 2025 | https://doi.org/10.3389/feart.2025.1527797
 Roberto Visalli1
 Marisa Giuffrida1*
 Massimiliano Cardone1Giorgio Costa1
 Gaetano Ortolano1
 Marco Viccaro1,2
The adoption of semi-automated image processing methods to investigate geo-petrological processes has grown quickly in recent years. Utilizing multivariate statistical analysis of X-ray maps, these methods effectively extract quantitative textural, chemical, and modal parameters from selected thin sections or micro-domains in volcanic samples whose constituents can show peculiar textures due to the magmatic processes involved. In this study, we have processed X-ray maps of major elements from the 2021 basaltic lava rocks of Pacaya volcano (Guatemala) through the Quantitative X-ray Map Analyzer (Q-XRMA) software. The processing strategy is based on the sequential application of the Principal Components Analysis and the supervised Maximum Likelihood Classification algorithms that allow us distinguishing among rock constituents (mineral phases, vesicles and glasses), quantifying their modal abundances, and identifying textural and chemical variations in a simplified and quick process. Here, the capability of the software has been applied to plagioclase crystals, whose textural and chemical complexities are faithful recorders of the physical and chemical conditions and processes controlling the evolution of the magmatic system. Plagioclase displays a variable extent of disequilibrium at the core and rim, as well as growth textures developed at different degrees of undercooling. This variability makes it very difficult to establish how many crystal populations are present in a sample, and to objectively decide whether there are crystals that can be considered representative of a population. The procedure applied in this study has proved to be effective for rapidly gathering chemical and textural data on plagioclase, and quantitatively document the distribution of crystals according to their size, shape, and compositions. Results demonstrate that the chemical and textural variability of crystals can be fully discerned at microscopic scale, and thus it can be adopted as a template for interpretation of magmatic processes.
Textural analysis of magmatic minerals, especially when correlated with chemical changes, represents a very useful tracer in reconstructing the physico-chemical modifications occurring during the evolution of magmatic systems. Among volcanic minerals, plagioclase is particularly useful for investigating magmatic processes, being a very common mineral phase highly sensitive to small changes in melt temperature, pressure, oxygen fugacity, or water concentration during crystallization. This behavior often results in a variety of specific textures, including combinations of complex zoning patterns, skeletal, dissolution and resorption features (e.g., Haase et al., 1980; Allegre et al., 1981; Tsuchiyama, 1985; Kirkpatrick et al., 1979; Cashman, 1990; Nelson and Montana, 1992; Streck, 2008 and references therein).
Distinguishing a huge set of plagioclase textures generated from different magmatic processes and linked with varying chemical zonings can be difficult via optical observations or traditional high-resolution imaging methods only. This is due to the presence of crystals with potentially complex growth patterns marked by more than one type of texture, whose recognition requires a combination of morphological and chemical clues. The use of a single method is, therefore, not suitable to properly studying and interpreting mineral textures. For instance, the mineral inspection under the transmitted light polarizing microscope is not appropriate to retrieve compositional information, although the method is of great help to obtain an overview of the available textural types at the thin-section scale. Instead, the back-scattered electron (BSE) imaging and the Nomarski differential interference contrast (NDIC) imaging techniques are able to reveal very fine textural details otherwise invisible in transmitted light (Pearce et al., 1987; Pearce and Kolisnik, 1990; Singer et al., 1995; Stewart and Fowler, 2001; Ginibre et al., 2002). However, these techniques do not readily indicate composition, but they give only qualitative information. Using in-situ microanalytical techniques (e.g., EMP, SEM-EDS/WDS analyses, laser interferometry), the chemical variations throughout the crystal can be measured and correlated to specific textural features, and thus one can have an idea of what processes have occurred within the magma plumbing system during the crystal growth.
Nowadays, the combined use of microanalytical techniques and high-resolution imaging methods represents a routine procedure, particularly helpful to obtain relevant information on the crystal growth history (Ginibre et al., 2002; Viccaro et al., 2010; Nicotra and Viccaro, 2012), though extremely time consuming. This has the main disadvantage that morphological and quantitative compositional information has to be collected in individual crystals, following a meticulous analytical work and a careful selection of appropriate zones for the analyses which is strictly dependent by the subjectivity of the operator.
In the last decades, image analysis based on the multivariate statistical treatment of EDS/WDS X-ray multispectral images has become a powerful tool for obtaining quantitative compositional data (Lanari et al., 2014; 2019 and references therein). This tool has the advantage of exploiting the intrinsic multispectral characteristics of the X-ray maps which record the distribution of the chemical elements (Launeau et al., 1994; Cossio et al., 2002; Friel and Lyman, 2006). The widespread use of this technique is supported by the availability of semi-automatized tools that create mineral maps and quantify modal parameters from selected thin-section micro-domains (e.g., Cossio et al., 2002; Lanari et al., 2014; Ortolano et al., 2018). These outputs assist operators in making more informed decisions about microprobe spot locations, thereby reducing the need for extensive decision-making activity. Image analysis found wide application in several branches of the geosciences (Ortolano et al., 2014a; Fazio et al., 2018; Zucali et al., 2021; Belfiore et al., 2022; Acevedo Zamora et al., 2024; Caso et al., 2024), and in the case of volcanic rocks it was largely used for examining vesicle and crystal size distribution (Shea et al., 2010; Gurioli et al., 2014; Neave et al., 2017) and for investigating compositional variations (Perugini et al., 2004; Shea et al., 2014; Yoshimura et al., 2019; Visalli et al., 2023), whereas there are only few examples regarding textural characterization of plagioclase (e.g., Higgins et al., 2021).
In this work, we adopted an advanced image analysis capable of combining compositional, morphological and grain size information of rock constituents, with the specific aim of identifying and quantifying plagioclase textures in porphyritic volcanic rocks. In doing this, we used the ArcGIS-based Quantitative X-ray Maps Analyzer (Q-XRMA) software (Ortolano et al., 2018). This tool can identify the rock-forming constituents and the existence of mineral zonings at the thin-section scale through the multivariate statistical treatment of an array of X-ray maps. Here, the potential of this software has been verified for rapid acquisition of quantitative textural and mineralogical information on basaltic rocks from the 2021 eruption of Pacaya volcano (Guatemala, Figure 1). These basalts preserve a complex crystal cargo, with both individual plagioclase and glomerocrysts showing large variations in crystal habit, zoning and resorption, thus appearing as the perfect candidates for such a kind of application.
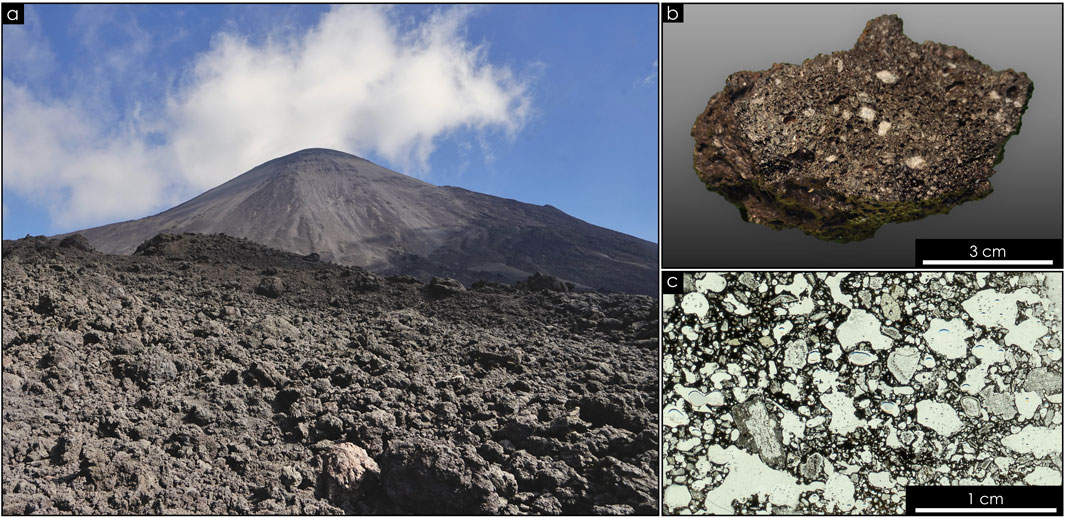
Figure 1. (A) The MacKenney cone and a portion of the lava field produced during the 2021 eruption, from the northwestern slope of Pacaya volcano. (B) Lava sample from the 2021 eruption collected on the northwestern portion of the lava field, characterized by vacuolar structure and millimeter-sized plagioclase phenocrysts. (C) One of the thin sections investigated for this study, within which vacuoles and mm-sized crystals of plagioclase and olivine can be distinguished.
Volcanic rocks inspected in this study are porphyritic basaltic lavas (Figure 1B) emplaced in spring 2021 along the northwestern flank of the Mackenney cone, the younger and only active of the craters constituting the Pacaya volcanic complex (Western Guatemala; Figure 1A). Pacaya is considered one of the most active volcanoes in Central America. The volcano typifies for a nearly continuous open-vent activity that has persisted since 1961, alternating periods of mild intra-crateric activity at the Mackenney cone with phases of more intense explosions (strombolian to lava fountaining) and lava effusions (Rose et al., 2013). The latest eruptive cycle covers the period June 2015-November 2021 (Gonzalez-Santana et al., 2024). Flank fissures were the source of multiple lava flows during 2019-2021. The effusive activity intensified by early March 2021, producing multiple lava flows covering large part of the volcanic edifice (Gonzalez-Santana et al., 2024). The latest lava flow, which is the source of the studied samples, began on 29 April 2021, and run for over 2 km before effusion finally ceased on May 17. These lavas have been sampled during a field campaign in February 2024.
The examination has been carried out on seven samples using optical and electron microscopy, revealing quite similar petrographic characteristics. The rock texture is porphyritic and highly vesicular containing phenocrysts of plagioclase, olivine, clinopyroxene and opaque oxides, with clear dominance of plagioclase crystals with respect to the other mineral phases. The groundmass is composed of the same minerals in addition to glass, and contains abundant, euhedral plagioclase laths. No fluidal textures have been recognized in the studied rocks either for what regards the phenocrysts or the microliths of the groundmass.
Plagioclase phenocrysts occur as euhedral to subhedral grains up to 2 mm in size, sometimes forming glomerophyric structures with olivine. Phenocrysts typically exhibit variable extent of disequilibrium at the core and rim, which results in a variety of textures that sometimes coexist within the same crystal. BSE imaging (Figure 2) reveals geochemical contrasts across plagioclase, thus providing an indication of the anorthite variation between adjacent, texturally diverse plagioclase zones. Based on the observed textural and compositional characteristics, an overall subdivision of plagioclase phenocrysts into five main types was done, namely: a) Type 1, clear, oscillatory zoned crystals with no evidence of dissolution/resorption. In these crystals, the chemical zoning is barely visible under electron microscope (Figure 2A); b) Type 2, coarse-sieve textures characterized by micrometric-scale glass inclusions randomly distributed within the core of plagioclase (Figure 2B); c) Type 3, rounded cores bounded by dissolution surface (Figure 2C); d) Type 4, sieve textures formed by bands of melt inclusions crosscutting the oscillatory zoning patterns at the crystal rim (Figure 2D); e) Type 5, swallow-tiled crystals (Figure 2E). The combination of these textures can also be observed (Figure 2F).
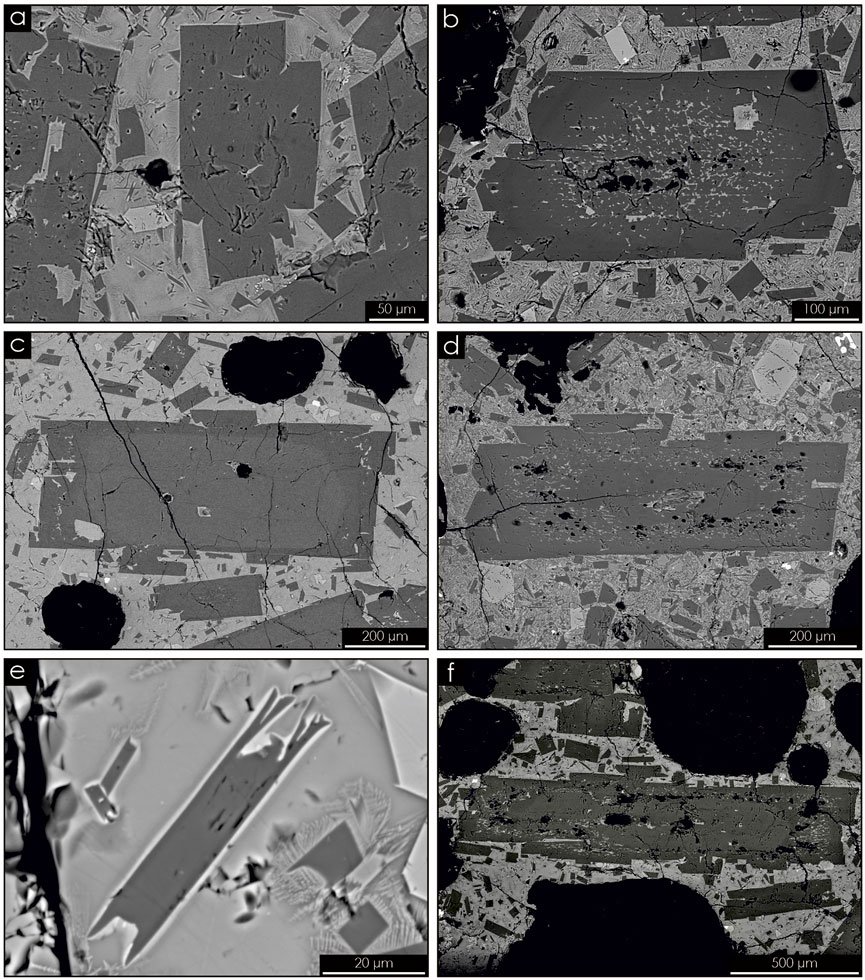
Figure 2. Back-Scattered Electron (BSE) images of the different textural types of plagioclases found in the 2021 lavas of Pacaya volcano: (A) Type 1, oscillatory zoning; (B) Type 2, coarse-sieved; (C) Type 3; rounded core; (D) Type 4, sieved-rim; (E) Type 5, swallow-tailed; (F) combined Type 3 + Type 4 textures.
The An enrichment is evident in most of the observed sieved zones, while in other crystals it is almost impossible to distinguish from the adjacent zones due to the weak contrasting gray-scale color.
Overall, the largest crystals (>1 mm in size) exhibit the highest degree of destabilization, being typically affected by pervasive sieve textures at the core and rim. Coarse-sieved cores are also common among the phenocrysts with sizes 0.3–1 mm. The smallest crystals are instead dominantly euhedral oscillatory-zoned, only rarely displaying disequilibrium textures in the form of coarse sieve textures or dissolution surfaces.
Thin (80 μm-thick) and polished sections were prepared for petrographic, micro-chemical and image analyses. Preliminary textural observations were performed on plagioclase crystals via high-contrast back-scattered electron images (BSE, Figure 2; 1,024 × 864 pixels) obtained at the Dipartimento di Scienze Biologiche, Geologiche e Ambientali of the University of Catania by means of a Tescan Vega-LMU scanning electron microscope equipped with an EDAX Neptune XM4-60 microanalyzer operating by energy dispersive system (EDS) equipped by an ultra-thin Be window. The EDS microanalyzer is coupled with an EDAX WDS LEXS (wavelength dispersive low energy X-ray spectrometer) calibrated for light elements (not used for this set of analyses on plagioclase). Operating conditions were set at 20 kV accelerating voltage and ∼8 nA beam current.
Fourteen representative microdomains from seven lava samples of the 2021 eruption of Pacaya were selected at the scale of thin sections for quantitative textural analyses by Q-XRMA. X-ray maps (see Supplementary Figures S1–S7) were acquired with the same instrumentation described above, under high vacuum conditions at an accelerating voltage of 20 kV, beam current of 8 nA and working distance of 15.5 mm. The resolution of the output images is 512 × 400 pixels for an average pixel size of 2 μm in 256 grey-scale levels (i.e., eight-bit images) obtained with a dwell time of 500 μs per 128 frames, corresponding to an acquisition time for each map array of 4 h and 30 min. X-ray maps were acquired to obtain the distribution and the relative concentration of the major elements (i.e., Al, Ca, Fe, K, Mg, Mn, Na, P, Si, and Ti) on the selected microdomains.
The acquired maps were processed via the Q-XRMA software (Ortolano et al., 2018) to identify the rock-forming constituents, quantify their associated modal abundances, and investigate the occurrence of compositional zonings within plagioclase crystals to be linked with a specific textural type. These goals are achieved using two analytical cycles: i) the first cycle is applied to discriminate the main rock phases at thin section and microdomain scales quantifying, at the same time, the related modal percentage; ii) the second cycle provides the possibility to pose attention on a specific phase recognized during the first cycle, to highlight the potential occurrence of chemical variability in zoned minerals.
Both cycles are based on a multivariate statistical data handling of the X-ray raster maps employing the sequential application of the Principal Components Analysis (PCA; Hotelling, 1933; Jolliffe, 2002; Karl Pearson, 1901) and the Maximum Likelihood Classification (MLC; Johnson and Wichern, 1988; Ortolano et al., 2014b; Richards and Jia, 2006). PCA is effective in data compression as it helps in eliminating redundancy, emphasizing the variance within the bands of a raster and making data more interpretable for an improved classification. MLC enables the categorization of raster pixels into clusters (for an unsupervised classification) or classes (for a supervised classification). The MLC employs a spectral signature file to analyze the statistical distribution of grayscale values ranging from 0 to 255. It assigns a probability to each pixel, indicating its likelihood of belonging to a specific class or cluster. This file contains a subset of pixels from the Principal Component (PC) maps that are representative of any particular class or cluster. In the unsupervised approach, Q-XRMA automatically classifies data grouping pixels into a user-defined number of clusters. The supervised classification, on the other hand, involves users’ creation of training areas on the PCA multiband raster through the ArcGIS graphical user interface, selecting pixels that best represent each class. Both approaches allow for defining the a priori probability of pixel assignment to a specific class or cluster as: i) equal, where each pixel is assigned to the class with the highest likelihood of membership; ii) sample, where the probability of a pixel belonging to a class or cluster is proportional to the number of representative pixels associated with each signature. The result is a classified map that divides the study area into known classes or clusters, whose associated modal abundances are calculated based on the total pixel matrix of the map. This output is accompanied by a confidence map showing the level of classification confidence. The latter is based on a reject fraction which determines whether a pixel will be classified based on its likelihood of being correctly assigned to one of the classes. This means that a pixel will be assigned to a class only if the associated probability corresponds to a confidence level higher than a reject fraction defined by the user. There are 14 levels of confidence, where the first level consists of pixels with the shortest distance to any mean vector stored in the input signature file, providing the lowest uncertainty of pixels correctly classified. In contrast, the last level provides the highest uncertainty. To minimize this effect, post-classification filters operating on a 3 × 3 pixel matrix (such as focal median and maximum frequency) can be applied to the classified image.
In this work, the first cycle was applied individually in each investigated domain to automatically recognize the rock-forming constituents (i.e., plagioclase, olivine, pyroxene, oxide, vesicle, and glass) and derive the associated modal abundances. This implies that the comparison between the microdomains of the different thin sections are made on the classified images that are yet the final results of the procedures that bring to an interpretation supported by a statistically meaningful dataset. Ultimately, the comparison between different samples, or between different microdomains, is perfectly consistent as it is done between images classified in advance with the propaedeutic aid of PCA, which is useful “simply” to guide the operator in the choice of training areas.
The processing time of this cycle is 30–40 min per microdomain. The second cycle was instead applied to detect compositional variations within plagioclase, accomplishing this in 20–30 min per microdomain. The first five PC maps were selected as most informative in the first cycle for all of the analyzed microdomains, whereas four PC maps were selected in the second cycle considering Al, Ca, Na, and Si as the elements of interest. The supervised classification has been adopted in both analytical cycles by choosing the sample a priori probability and zero as reject fraction, whereas the maximum frequency filter has been applied in the post-classification phase.
Chemical subdivisions obtained through the second cycle were verified via spot analyses on different plagioclase crystals selected to cover all the chemical variability recognized via the image processing. All measurements were done at the University of Catania by SEM-EDS/WDS, using the same instrumentation described above. Operating conditions were set at 20 kV accelerating voltage with 2 nA beam current to obtain the analysis of major element abundances. Repeated analyses on an internationally certified An65 plagioclase (SPI 02753-AB Serial KF crystal #35) during the analytical runs ensured precision of around 3%–5% for all elements, while accuracy is ∼5%. The major element abundances were measured along core-to-rim traverses. Analytical traverses were done parallel to the longest side of plagioclase with spacing between individual analytical spots of ∼5 µm.
Finally, a Raster to Polygon conversion function implemented within the ArcGIS environment was used to vectorize the plagioclase crystals, identified through the first cycle of the Q-XRMA, in individual polygon features. In the creation of polygons, each group of contiguous pixels classified as plagioclase is converted into a polygon, making a separation at the contact between different groups. This approach can be ineffective when two plagioclase crystals are in contact as they are constituted by a unique group of contiguous pixels, thus resulting in a merged polygon. However, in the investigated domains this effect is poorly observed or overcome through a manual post-processing using the editing tools provided by ArcGIS. The time processing of this step is 10–30 min per microdomain. The polygon features created were then used as input data in the ArcGIS Minimum Bounding Box function to obtain length and width data for each crystal following the calculation described in Visalli et al. (2021). This permitted classifying crystals not only based on their specific chemical compositions but also based on their length, subdividing all plagioclases in microlites (<0.1 mm), microphenocrysts (0.1< × < 0.3 mm) and phenocrysts (>0.3 mm), following the Armienti et al. (1984) definition. Digitized polygons enclosing less than ten pixels have been considered artifacts of the vectorization procedure and were not considered in the calculation.
Results of the first cycle permitted the recognition of plagioclase (Pl), olivine (Ol), clinopyroxene (Px), and oxides (Ox) as mineral rock constituents, along with glass fractions (Gl) and vesicles (Bb) (Figure 3), with an average of 11.1% of classified pixels in the confidence level of highest uncertainty (confidence level 14, see Supplementary Figure S8). The results indicate that plagioclase, found as large crystals and microlites sparse within the groundmass, is the most abundant mineral phase averaging 37.4% of the total modal abundance (Table 1). This is followed by olivine, clinopyroxene, and Fe-Ti oxides, which account for average modal abundances of 3.7%, 1.4%, and 0.3%, respectively (Table 1). Across all analyzed domains, the modal abundance of plagioclase ranges from 22.2% to 48.1%. In contrast, olivine typically appears in modal abundances of around 1%–3%, although some microdomains exhibit larger crystals with modal amounts from 4.9% to 11.7% (Figures 3A, D, K, M; Table 1). Clinopyroxene, which occurs as microlites floating within the glass fraction, shows a modal amount varying from 0.5% to 1.3% except for two microdomains (Figures 3G, H), where it is in the range of 3.6%–4.5%. Lastly, Fe-Ti oxides are poorly represented with modal percentages lower than 1% (Figure 3O; Table 1). The glass fraction, including both the glassy matrix and the glass inclusions within crystals, vary between 40.0% and 62.5% (Table 1). The remaining portion is constituted of vesicles with modal amounts varying from 1.4% to 26.3% (Table 1).
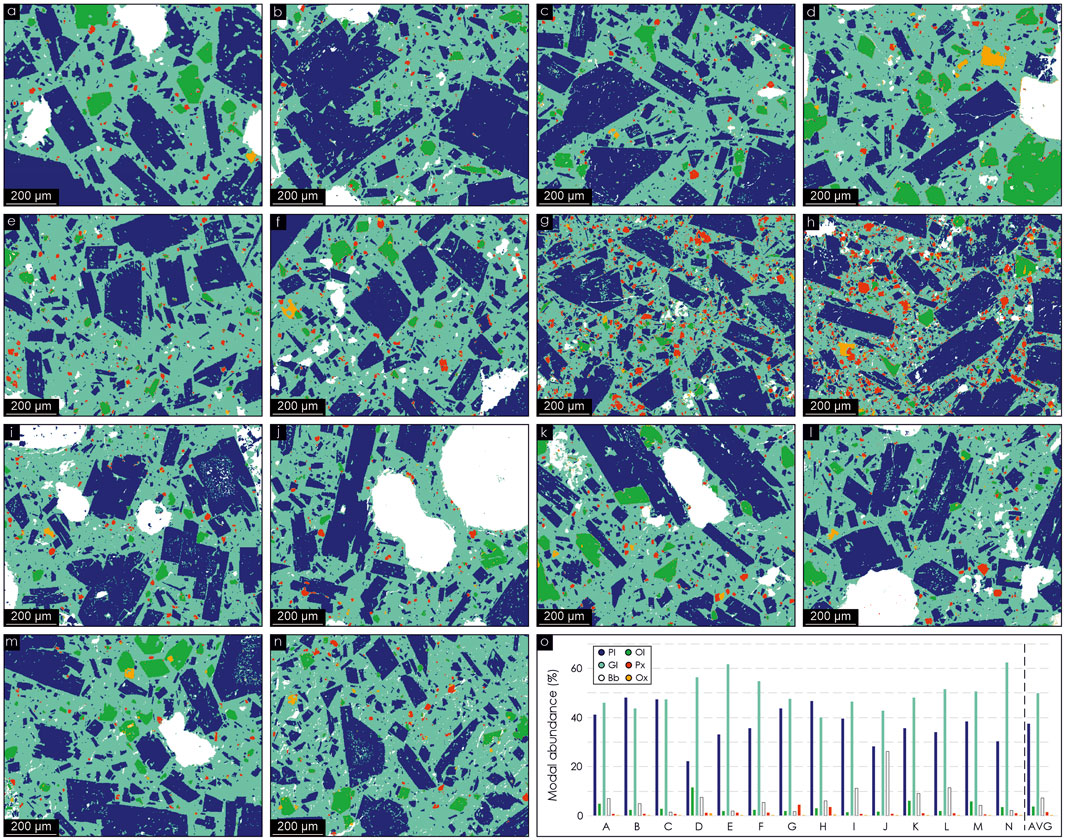
Figure 3. (A–N) Outputs of the rock-constituents recognition through the first cycle of the Q-XRMA; (O) Histograms of the modal percentages derived in each investigated microdomains. Pl: plagioclase; Ol: olivine; Gl: glass; Px: pyroxene; Bb: vesicle; Ox: oxide; avg: average. Field of view of each microdomain: 1 mm.
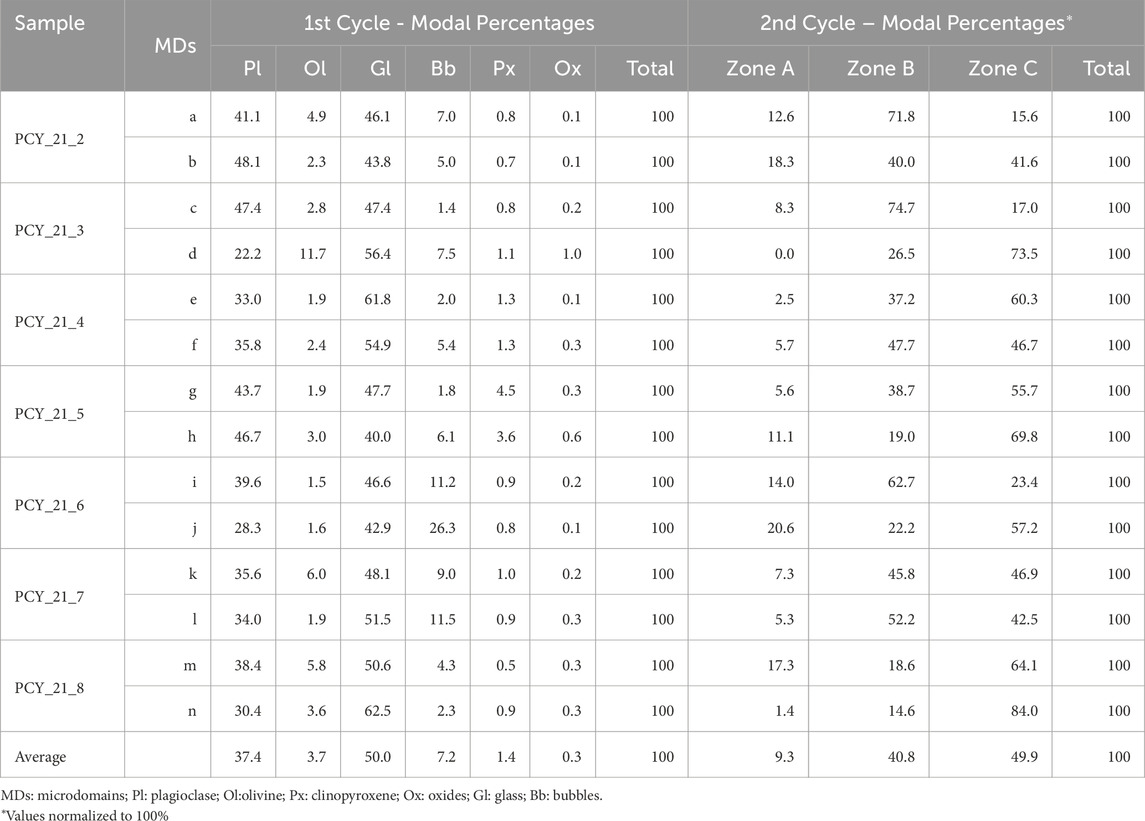
Table 1. Modal percentages obtained through the two analytical cycles of the Q-XRMA.
According to the results from the second cycle (Figure 4), it was possible to distinguish three compositionally different zones at high, intermediate and low Ca concentrations (Supplementary Figures S1–S7), labeled as zones A, B, and C, respectively. The estimated percentage of classified pixels falling in the confidence level of highest uncertainty (confidence level 14) for the second cycle classification is 4.6% on average (see Supplementary Figure S9). The largest phenocrysts typically display A+B+C sequences, marked by decreasing Ca content from core to rim (Figures 4, 5A). In these crystals, euhedral chemical interfaces mark the transition from one zone to the adjacent. Smaller crystals mainly display B and C zones, forming either normal B+C zoning (Figures 4, 5B) or B+C+B oscillatory zoning patterns (Figures 4, 5C). In a few cases, we also observed tiny A zones surrounding cores at lower Ca content (i.e., B cores) possibly resulting from dissolution/resorption phenomena (Figures 4, 5D). Rarely, rounded Ca-rich cores (A type compositions) are surrounded by C zones (Figures 4, 5E). In the groundmass, plagioclase microlites are particularly abundant and appear rather homogeneous in composition, being essentially characterized by low Ca concentration from core to rim (C type composition; Figures 4, 5F).
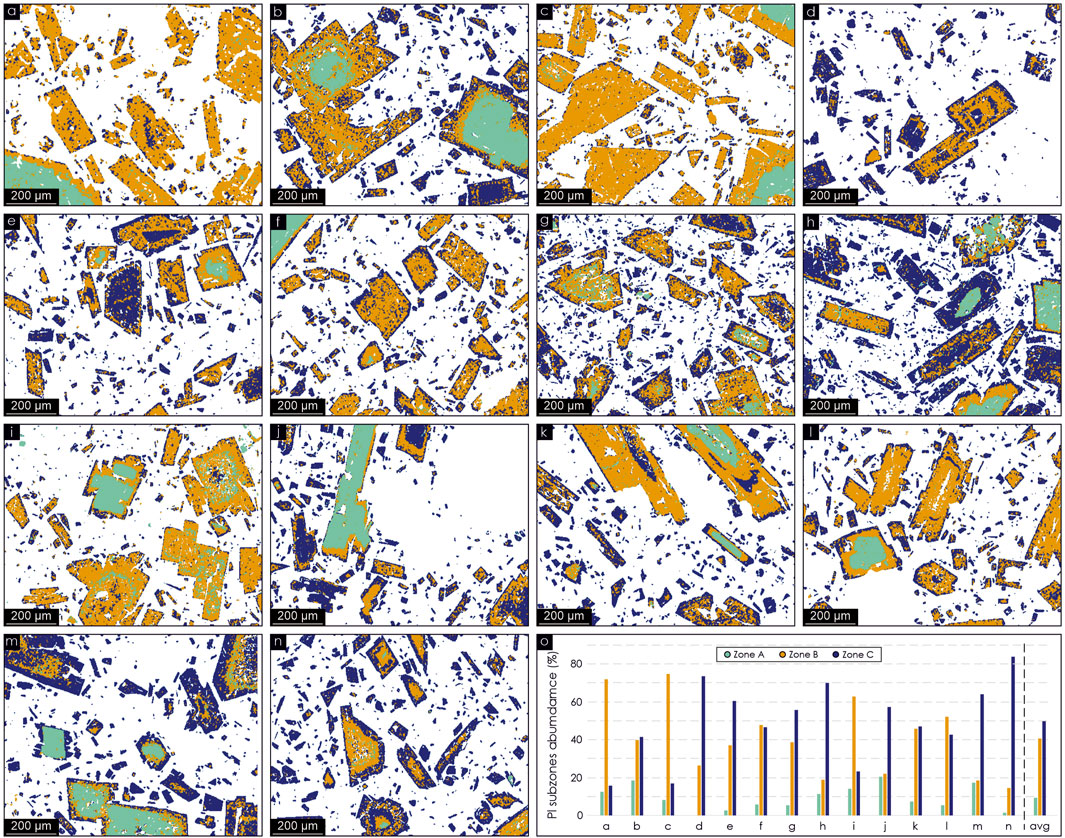
Figure 4. (A–N) Outputs of the chemical zones recognized in plagioclase (PI) through the second cycle of the Q-XRMA; (O) Histograms of the modal percentages derived in each investigated microdomain. avg: average. Field of view of each microdomain: 1 mm.
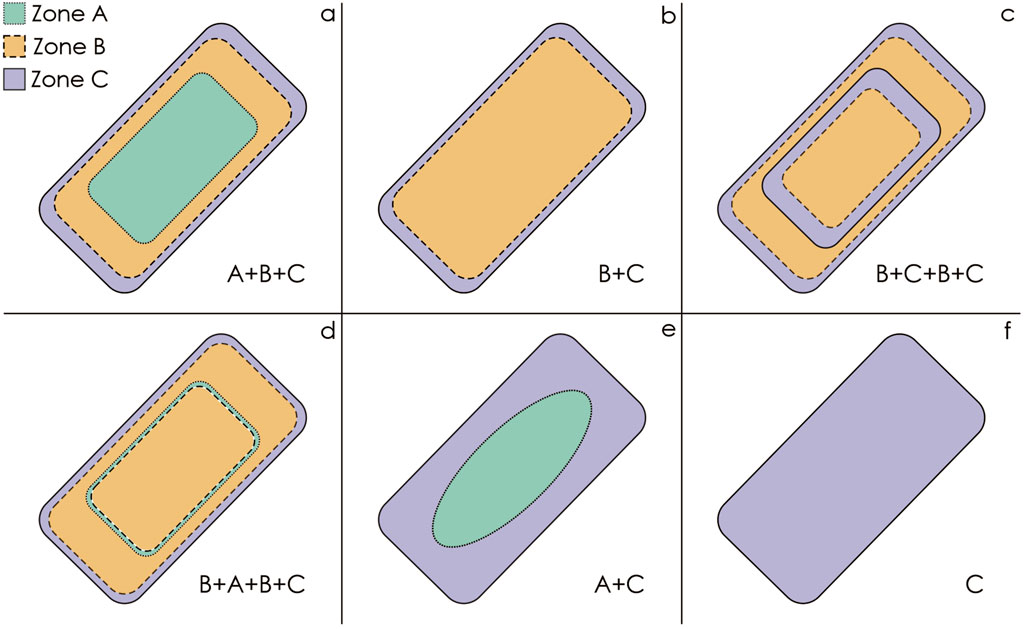
Figure 5. Different zoning patterns recognized through the second cycle: (A) high-anorthite (An) core (A) to low-An rim (C) zoning; (B) intermediate-An core (B) to low-An rim (C) zoning; (C) oscillatory zoning; (D) high-An “rings” (A) surrounding intermediate-An core; (E) rounded high-An core wrapped by low-An rim; (F) low-An zoning.
The B and C chemical zones are the most abundant in all analyzed domains, representing an average of 49.9% and 40.8%, respectively (Figure 4; Table 1). Contrarywise, the A zones comprise only 9.3% of plagioclase zoning (Table 1) and are primarily located at the core of the larger crystals.
These compositionally different zones, initially identified through the second cycle, were therefore calibrated for the An content through quantitative SEM-EDS/WDS spot analyses. The analyses have confirmed the observed differences among the A, B and C zones. In particular, the A zone was found to reflect XAn [Ca/(Ca+Na) mol] in the range 0.8–0.9, the B zone displays XAn close to 0.6, whereas the C zone typifies for XAn 0.4–0.5 (Table 2).
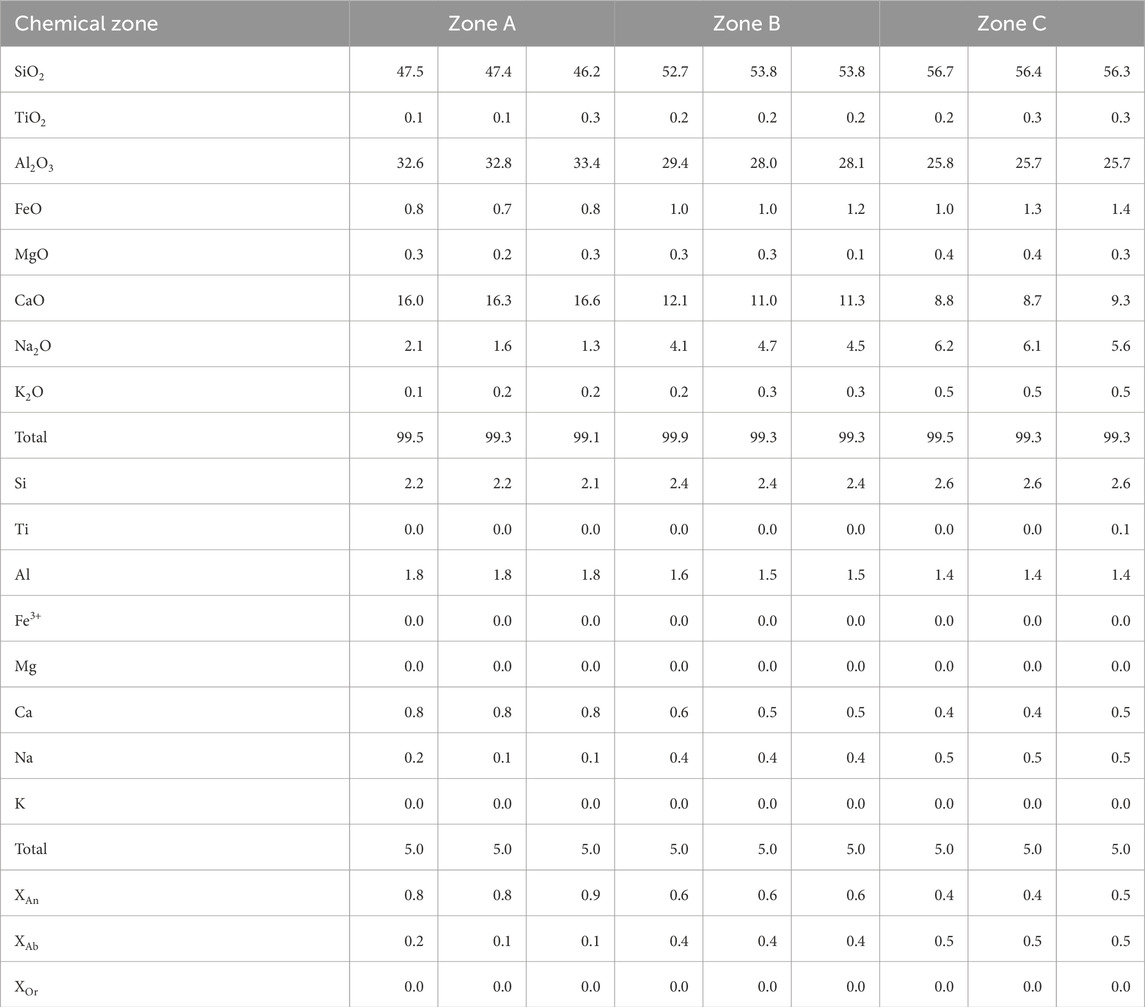
Table 2. Representative analyses of the chemical zones recognized through the Q-XRMA.
Maps of plagioclase classified in the second cycle were used to digitize and categorize the crystals into microlites (ML: <0.1 mm), microphenocrysts (MP: 0.1–0.3 mm), and phenocrysts (P: >0.3 mm) (Figure 6). Digitization accuracy is average ∼98% (Table 3). This step permitted to outline of 3,885 crystals (Tables 3, 4) mainly constituted by microlites (3,673), and to a lesser extent, by microphenocrysts (179) and phenocrysts (33). Our analysis of the crystal grain size indicates a number of microlites grains varying between 144 and 436 across rock MDs. However, microlites occupy an average of less than 10% of the total MDs area (Table 3). The number of digitized grains decreases significantly for microphenocrysts (9–19 grains per microdomain) and phenocrysts (1–4 grains), but their relative modal abundances increase to mean values of 14.7% for microphenocrysts and 12.4% for phenocrysts (Table 3).
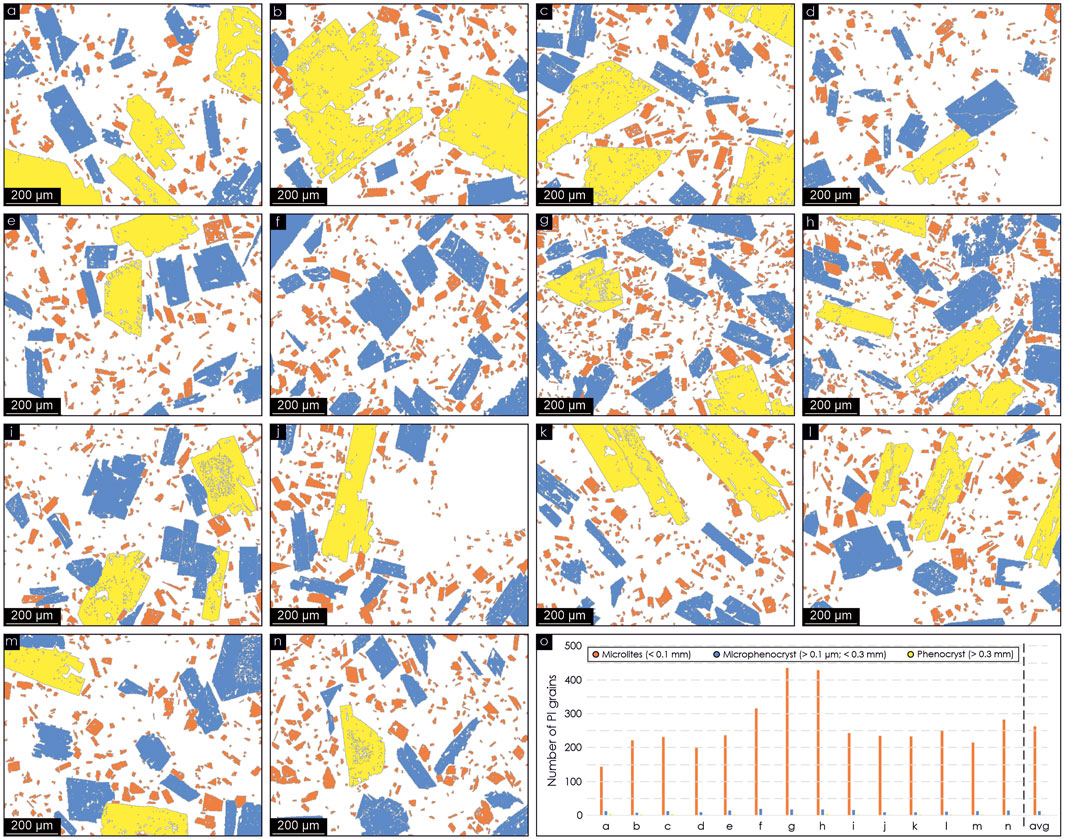
Figure 6. (A–N) Outputs of the digitized crystals through the Raster to Polygon conversion tool, subdivided per grainsize classes; (O) Histograms of the number of grains obtained in each investigated microdomains. avg: average. Field of view of each microdomain: 1 mm.
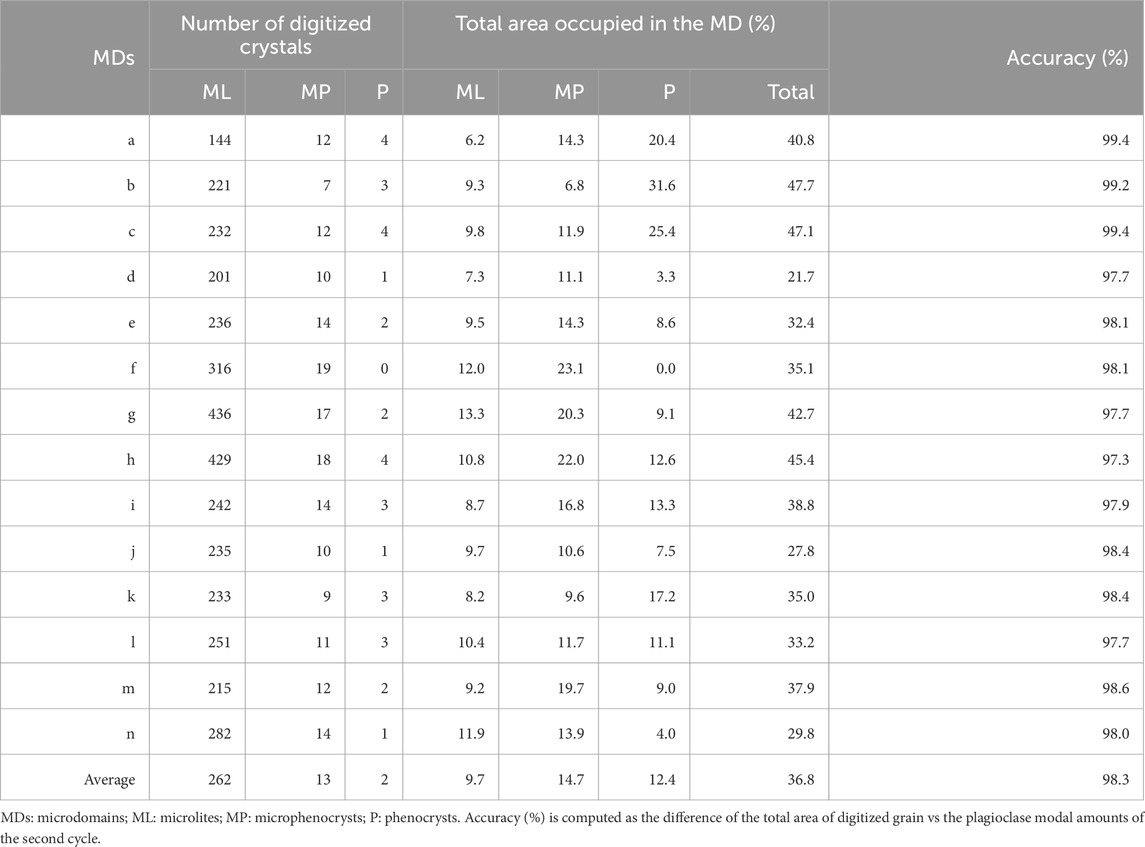
Table 3. Number of digitized crystals vs the percentage of the total area covered in the analyzed microdomain.
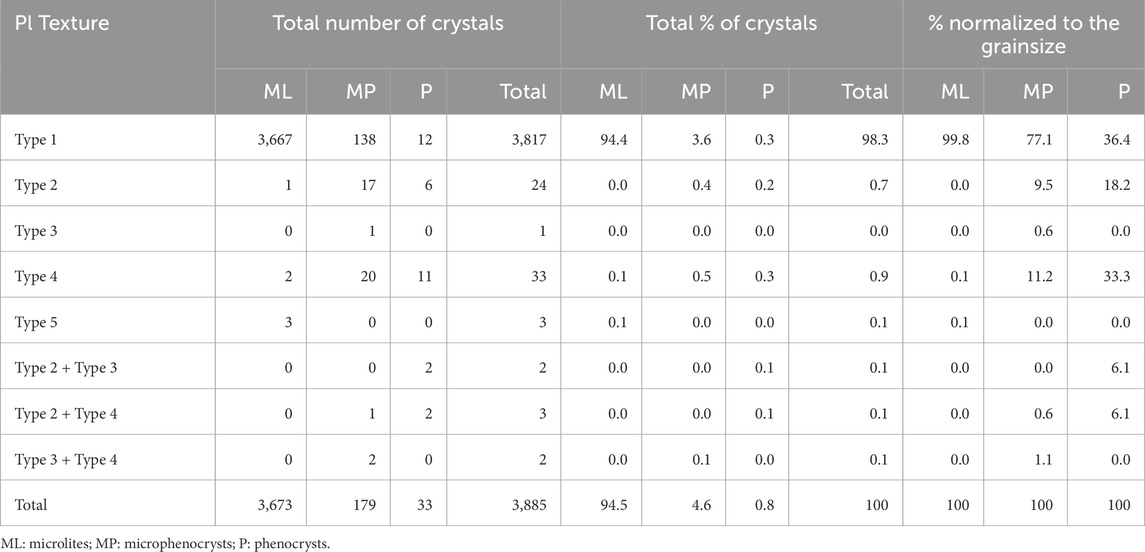
Table 4. Textural types recognized in all investigated plagioclase crystals, subdivided per grain sizes.
Figure 4 shows the variety of textures recognized in plagioclase through the integration of classified images produced by Q-XRMA. The combination of quantitative compositional, morphological and grain size information allowed the distribution of plagioclase textures to be quantified for different size classes. In this context, our image analysis indicates a plagioclase cargo dominated by clear, oscillatory zoning types (Type 1) in percentage of 98.3% (Table 4). Type 1 is typically observed in microlites (94.4%) and, to a lesser extent, in microphenocrysts (3.6%) and phenocrysts (0.3%) (Table 4). Except for Type 1, a few microlites showing sizes close to 0.1 mm also preserve coarse sieve (Type 2; <0.1%), sieved rim (Type 4; <0.1), and shallow-tailed (Type 5; <0.1) textures (Table 4). Instead, microphenocrysts and phenocrysts display the largest variability in terms of crystal textures, with prevalence of Type 2 cores and Type 4 (sieve-textured) rims (Table 4).
Considering textural variability within the grain size class, Type 1 microphenocrysts are the most abundant (77.1%). Sieved rim and coarse-sieved core represent 11.2% and 9.5% of the observed textures in microphenocrysts respectively, followed by dissolved core (Type 3; 1.7%). We also observed combinations of two or more disequilibrium textures, such as microphenocrysts with sieved cores surrounded by sieved rims (Type 2 + Type 4; 0.6%), or crystals with rounded Ca-rich cores affected by dissolution and sieve-textured rims (Type 3 + Type 4; 1.1%) (Table 4).
At the grain size of phenocrysts, Type 1 and Type 4 are the main textural types recognized (36.4% and 33.3% of the total phenocryst textures) followed by sieved cores (Type 2; 18.2%). Moreover, an equal number of combination of textures, such as Type 2 + Type 3 and Type 2 + Type 4 (6.1% per each; Table 4) are also quantified.
The results of our image analysis provide a detailed characterization of the basaltic samples belonging to the 2021 eruption of Pacaya volcano. This analysis reveals important insights into the mineral composition, groundmass, and vesicle structures, and also allows identifying distinct zoning patterns within plagioclase linked to various textures.
The quantitative data obtained from image analysis matches the observations made by optical and electronic microscopes for what concerns the distribution of crystal size, proportions of the mineral phases and the texture types and their relative abundance. The applied method greatly reduces the degree of subjectivity in the evaluation of plagioclase distribution in a rock sample, since it rapidly classifies and quantifies minerals based on their size and their morphological and chemical diversity.
The variety of plagioclase crystals in Pacaya basalts (see Figures 1C, 2) makes it very difficult to establish how many crystal populations are present in a sample, and to objectively decide whether there are crystals that can be considered representative of a population, and thus used to derive conclusions about the magmatic processes.
Given the ease by which representative classified images of many rock domains can be gathered (see Figures 3, 4), it is possible to obtain a large quantitative dataset that can be used to fully characterize the rock sample (see Table 1). The advantages of Q-XRMA mapping compared to spot analyses include shorter analysis times and the capacity to recognize even subtle chemical variations. An in-depth analysis of these variations aids in accurately identifying mineralogical textures, providing a better understanding of the chemical and physical history experienced by the investigated rocks. Figure 5 illustrates the different zoning patterns that can be rapidly detected in plagioclase through image analysis, highlighting the effectiveness of this technique. Furthermore, in both analytical cycles the level of confidence reached by the classification assures a statistically meaningful identification of the rock-forming constituents and plagioclase chemical zones, thus permitting a more reliable quantification of their modal abundances. The highest uncertainty associated with the classification, indeed, is located at the borders of crystals (see Supplementary Figures S8 S9), where pixels have values with the longest distance to any mean vector stored in the input signature file. Such uncertainty can be reduced by increasing the number of training areas, implying a longer processing time.
Grain digitization through the raster to polygon and the minimum bounding box tools proved to be a fundamental step to quantitatively linking rock fabric parameters with specific compositional variations and effectively differentiating the compositional patterns based on varying grain sizes. Indeed, it enabled us to digitize and categorize, with high accuracy, a huge number of crystals in three different size classes across all the investigated microdomains (see Figure 6; Table 3). While this classification has a degree of subjectivity, defining dimensional classes is crucial for accurately parameterizing the distribution of plagioclase’s textural and chemical features based on crystal grain size. This permits discerning between different textural types subdivided per each size class (see Figure 7), allowing the compilation of a more informative dataset higher than the dataset potentially investigated by using only optical or SEM analyses.
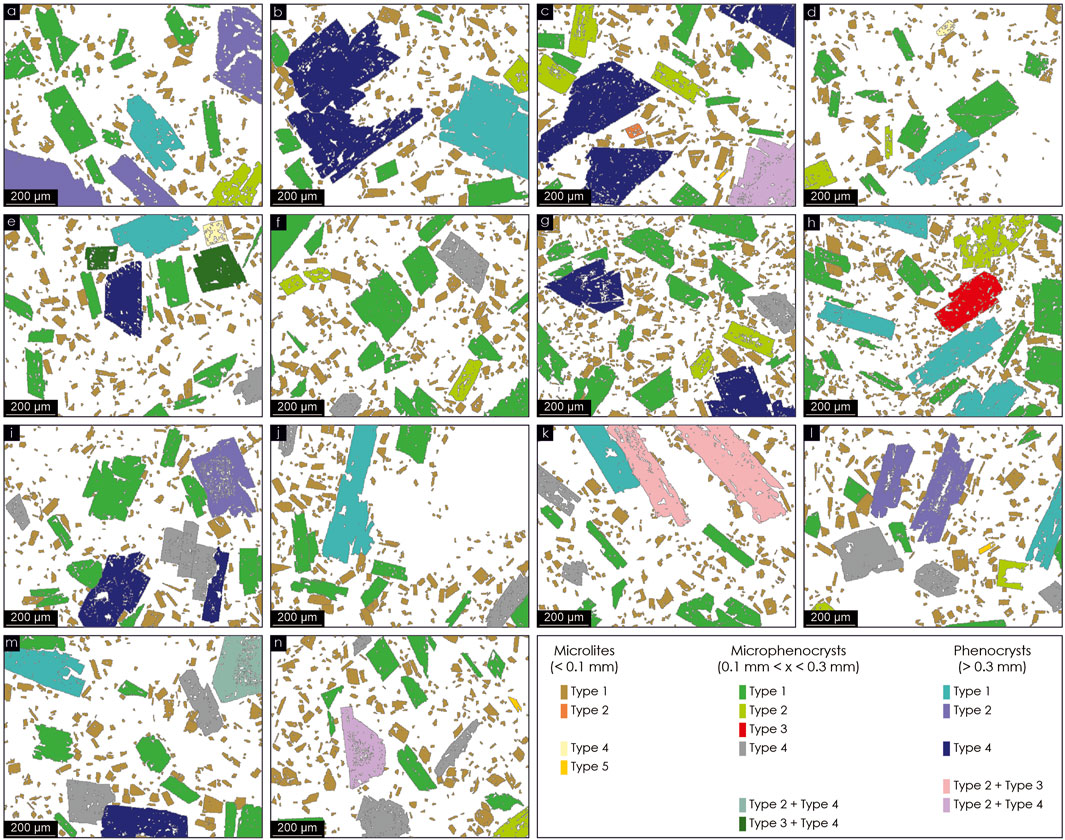
Figure 7. (A–N) Different textural types subdivided per grainsize recognized across the investigated microdomains. Field of view of each microdomain: 1 mm.
This technique can be therefore considered a complementary analysis to join with the possibilities of SEM, EPMA, or laser interferometry, which can still serve as preparatory techniques when higher resolution, sensitivity, or accuracy are required.
Our findings emphasize the advantages of the Q-XRMA image analysis to determine the size, shape, and compositional variations of minerals in volcanic rocks. The capability of the software has been tested on basaltic lavas of the 2021 eruption at the Pacaya volcano, focusing in particular on textural complexities of plagioclase grains. The method we present offers an efficient tool for rapidly gathering chemical and textural data, effectively reducing subjectivity in assessing plagioclase distribution within rock samples and permitting, at the same time, the identification and quantification of the complex variations in the texture and composition of the mineral cargo. Furthermore, it enables a plagioclase grain categorization into different types based on their mutual differences in grain size, zoning, and resorption textures within a GIS-based database, ready to use for further geostatistical investigations.
Our results demonstrate that the chemical zoning of plagioclase crystals can be fully discerned at a microscopic scale and can be adopted as a template driving the interpretation of magmatic processes, thus constituting a valid tool in association with optical observations and SEM/EMPA investigations.
The original contributions presented in the study are included in the article/Supplementary Material, further inquiries can be directed to the corresponding author.
RV: Conceptualization, Formal Analysis, Investigation, Methodology, Software, Visualization, Writing–original draft. MG: Conceptualization, Investigation, Validation, Visualization, Writing–original draft. MC: Investigation, Writing–original draft, Visualization. GC: Investigation, Visualization, Writing–original draft. GO: Writing–original draft. MV: Conceptualization, Funding acquisition, Project administration, Resources, Supervision, Writing–original draft.
The author(s) declare that financial support was received for the research, authorship, and/or publication of this article. Marisa Giuffrida benefited of a contract within the framework of the PON 2014-20 Action IV.6 REACT-EU for the project “Contribution of geothermal fluids in volcanic areas for recovery of Critical Raw Materials in light of the green energy transition” (Scientific Responsible Marco Viccaro). This work was supported by the funding program PIACERI 2020-22 of the University of Catania (PAROSSISMA project, code 22722132140; principal investigator Marco Viccaro).
The authors declare that the research was conducted in the absence of any commercial or financial relationships that could be construed as a potential conflict of interest.
The author(s) declare that no Generative AI was used in the creation of this manuscript.
All claims expressed in this article are solely those of the authors and do not necessarily represent those of their affiliated organizations, or those of the publisher, the editors and the reviewers. Any product that may be evaluated in this article, or claim that may be made by its manufacturer, is not guaranteed or endorsed by the publisher.
The Supplementary Material for this article can be found online at: https://www.frontiersin.org/articles/10.3389/feart.2025.1527797/full#supplementary-material
Acevedo Zamora, M. A., Kamber, B. S., Jones, M. W. M., Schrank, C. E., Ryan, C. G., Howard, D. L., et al. (2024). Tracking element-mineral associations with unsupervised learning and dimensionality reduction in chemical and optical image stacks of thin sections. Chem. Geol. 650, 121997. doi:10.1016/j.chemgeo.2024.121997
Allegre, C. J., Provost, A., and Jaupart, C. (1981). Oscillatory zoning: a pathological case of crystal growth. Nature 294, 223–228. doi:10.1038/294223a0
Armienti, P., Barberi, F., Innocenti, F., Pompilio, M., Romano, R., and Villari, L. (1984). Compositional variation in the 1983 and other recent Etnean lavas: insights on the shallow feeding system. Bull. Volcanol. 47, 995–1007. doi:10.1007/BF01952357
Belfiore, C. M., Visalli, R., Ortolano, G., Barone, G., and Mazzoleni, P. (2022). A GIS-based image processing approach to investigate the hydraulic behavior of mortars induced by volcanic aggregates. Constr. Build. Mater. 342 (B), 128063. doi:10.1016/j.conbuildmat.2022.128063
Cashman, K. V. (1990). “Textural constraints on the kinetics of crystallization of igneous rocks,” in Modern methods of igneous petrology, understanding magmatic process. Editors J. Nicholls, and J. K. Russell (Washington, D.C: Mineralogical Society of America), 24.
Caso, F., Piloni, C. B., Filippi, M., Pezzotta, A., Fazio, E., Visalli, R., et al. (2024). Combining traditional and quantitative multiscale structural analysis to reconstruct the tectono-metamorphic evolution of migmatitic basements: the case of the Valpelline Series, Dent-Blanche Tectonic System, Western Alps. J. Struct. Geol. 182, 105099. doi:10.1016/j.jsg.2024.105099
Cossio, R., Borghi, A., and Ruffini, R. (2002). Quantitative modal determination of geological samples based on X-ray multielemental map acquisition. Microsc. Microanal. 8 (2), 139–149. doi:10.1017/s1431927601020062
Fazio, E., Ortolano, G., Visalli, R., Cirrincione, R., Fiannacca, P., Kern, H., et al. (2018). Strain rates of the syn-tectonic Symvolon pluton (Southern Rhodope Core Complex, Greece): an integrated approach combining quartz paleopiezometry, flow laws and PT pseudosections. Ital. J. Geosci. 137 (2), 219–237. doi:10.3301/IJG.2018.10
Friel, J. J., and Lyman, C. E. (2006). Tutorial review: X-ray mapping in electron-beam instruments. Microsc. Microanal. 12, 2–25. doi:10.1017/s1431927606060211
Ginibre, C., Kronz, A., and Wörner, G. (2002). High-resolution quantitative imaging of plagioclase composition using accumulated backscattered electron images: new constraints on oscillatory zoning. Contrib. Mineral. Petrol. 142, 436–448. doi:10.1007/s004100100298
Gonzalez-Santana, J., Wauthier, C., and Waite, G. (2024). The 2021 eruption of Pacaya Volcano, Guatemala–Geophysical analysis through satellite geodesy and seismic noise correlations. J. Volcanol. Geotherm. Res. 447, 108027. doi:10.1016/j.jvolgeores.2024.108027
Gurioli, L., Colò, L., Bollasina, A. J., Harris, A. J. L., Whittington, A., and Ripepe, M. (2014). Dynamics of Strombolian explosions: inferences from field and laboratory studies of erupted bombs from Stromboli volcano. J. Geophys. Res. Solid Earth 119 (1), 319–345. doi:10.1002/2013JB010355
Haase, C. S., Chadam, J., Feinn, D., and Ortoleva, P. (1980). Oscillatory zoning in plagioclase feldspar. Science 209, 272–274. doi:10.1126/science.209.4453.272
Higgins, O., Sheldrake, T., and Caricchi, L. (2021). Quantitative chemical mapping of plagioclase as a tool for the interpretation of volcanic stratigraphy: an example from Saint Kitts, Lesser Antilles. Bull. Volcanol. 83, 51. doi:10.1007/s00445-021-01476-x
Hotelling, H. (1933). Analysis of a complex of statistical variables into principal components. J. Educ. Psychol. 24 (6–7), 417–441. doi:10.1037/h0071325
Johnson, R. A., and Wichern, D. W. (1988). Applied multivariate statistical analysis. Prentice-Hall, 607.
Jolliffe, I. T. (2002). “Principal component analysis,” in Springer series in statistics. 2nd ed. (Springer-Verlag). doi:10.1007/b98835
Karl Pearson, F. R. S. (1901). LIII. On lines and planes of closest fit to systems of points in space. Lond. Edinb. Dublin Philosophical Mag. J. Sci. 2 (11), 559–572. doi:10.1080/14786440109462720
Kirkpatrick, R. J., Klein, L. M., Uhlman, D. R., and Hays, J. F. (1979). Rates and processes of crystal growth in the system anorthite–albite. J. Geophys. Res. 84, 3671–3676. doi:10.1029/jb084ib07p03671
Lanari, P., Vho, A., Bovay, T., Airaghi, L., and Centrella, S. (2019). Quantitative compositional mapping of mineral phases by electron probe microanalyser. Geol. Soc. Lond. Sp. Publ. 478 (1), 39–63. doi:10.1144/SP478.4
Lanari, P., Vidal, O., De Andrade, V., Dubacq, B., Lewin, E., Grosch, E., et al. (2014). XMapTools: a MATLAB©-based program for electron microprobe X-ray image processing and geothermobarometry. Comput. Geosci. 62, 227–240. doi:10.1016/j.cageo.2013.08.010
Launeau, P., Cruden, A. R., and Bouchez, J. L. (1994). Mineral recognition in digital images of rocks: a new approach using multichannel classification. Can. Mineral. 32 (4), 919–933.
Neave, D. A., Buisman, I., and Maclennan, J. (2017). Continuous mush disaggregation during the long-lasting Laki fissure eruption, Iceland. Am. Mineral. 102 (10), 2007–2021. doi:10.2138/am-2017-6015CCBY
Nelson, S. T., and Montana, A. (1992). Sieve-textured plagioclases in volcanic rocks produced by rapid decompression. Am. Mineral. 77, 1242–1249.
Nicotra, E., and Viccaro, M. (2012). Unusual magma storage conditions at Mt. Etna (Southern Italy) as evidenced by plagioclase megacryst-bearing lavas: implications for the plumbing system geometry and summit caldera collapse. Bull. Volcanol. 74, 795–815. doi:10.1007/s00445-011-0566-9
Ortolano, G., Visalli, R., Cirrincione, R., and Rebay, G. (2014a). PT-path reconstruction via unraveling of peculiar zoning pattern in atoll shaped garnets via image assisted analysis: An example from the Santa Lucia del Mela garnet micaschists (northeastern Sicily-Italy). Period. Mineral. 83 (2), 257–297. doi:10.2451/2013pm0015
Ortolano, G., Visalli, R., Godard, G., and Cirrincione, R. (2018). Quantitative X-ray map analyser (Q-XRMA): a new GIS-based statistical approach to mineral image analysis. Comput. Geosci. 115, 56–65. doi:10.1016/j.cageo.2018.03.001
Ortolano, G., Zappalà, L., and Mazzoleni, P. (2014b). X-Ray Map Analyser: a new ArcGIS® based tool for the quantitative statistical data handling of X-ray maps (Geo- and material-science applications). Comput. Geosci. 72, 49–64. doi:10.1016/j.cageo.2014.07.006
Pearce, T. H., and Kolisnik, A. M. (1990). Observations of plagioclase zoning using interference imaging. Earth Sci. Rev. 29, 9–26. doi:10.1016/0012-8252(0)90024-p
Pearce, T. H., Russel, J. K., and Wolfson, I. (1987). Laser-interference and Normansky interference imaging of zoning profiles in plagioclase phenocrysts from the May 18, 1980, eruption of Mount St. Helens, Washington. Am. Mineral. 72, 1131–1143.
Perugini, D., Ventura, G., Petrelli, M., and Poli, G. (2004). Kinematic significance of morphological structures generated by mixing of magmas: a case study from Salina Island (southern Italy). Earth Planet. Sci. Lett. 222 (3–4), 1051–1066. doi:10.1016/j.epsl.2004.03.038
Richards, J. A., and Jia, X. (2006). Remote sensing digital image analysis: an introduction. Berlin: Springer-Verlag, 439.
Rose, W. I., Palma, J. L., Escobar Wolf, R., and Matías Gomez, R. O. (2013). “A 50 yr eruption of a basaltic composite cone: Pacaya, Guatemala,” in Understanding open-vent volcanism and related hazards. Editors W. I. Rose, J. L. Palma, H. Delgado Granados, and N. Varley (Boulder, CO: Geological Society of America), 1–21.
Shea, T., Hellebrand, E., Gurioli, L., and Tuffen, H. (2014). Conduit- to localized-scale degassing during Plinian eruptions: insights from major element and volatile (Cl and H2O) analyses within Vesuvius AD 79 Pumice. J. Petrol. 55 (2), 315–344. doi:10.1093/petrology/egt069
Shea, T., Houghton, B. F., Gurioli, L., Cashman, K. V., Hammer, J. E., and Hobden, B. J. (2010). Textural studies of vesicles in volcanic rocks: an integrated methodology. J. Volcanol. Geotherm. Res. 190 (3–4), 271–289. doi:10.1016/j.jvolgeores.2009.12.003
Singer, B., Dungan, M. A., and Layne, G. D. (1995). Textures and Sr, Ba, Mg, Fe, K and Ti compositional profiles in volcanic plagioclase: clues to the dynamics of calc-alkaline magma chambers. Am. Mineral. 80, 776–798. doi:10.2138/am-1995-7-815
Stewart, M. L., and Fowler, A. D. (2001). The nature and occurrence of discrete zoning in plagioclase from recently erupted andesitic volcanic rocks, Montserrat. J. Volcanol. Geotherm. Res. 106, 243–253. doi:10.1016/S0377-0273(00)00240-7
Streck, M. J. (2008). “Mineral textures and zoning as evidence for open system processes.” in Minerals, inclusions and volcanic processes. Editors K. D. Putirka, and F. J. Tepley (Chantilly, VA; Mineralogical Society of America) 69, 595–622.
Tsuchiyama, A. (1985). Dissolution kinetics of plagioclase in the melt of the system diopside-albite-anorthite, and origin of dusty plagioclase in andesites. Contrib. Mineral. Petrol. 89, 1–16. doi:10.1007/bf01177585
Viccaro, M., Giacomoni, P. P., Ferlito, C., and Cristofolini, R. (2010). Dynamics of magma supply at Mt. Etna volcano (Southern Italy) as revealed by textural and compositional features of plagioclase phenocrysts. Lithos 116 (1-2), 77–91. doi:10.1016/j.lithos.2009.12.012
Visalli, R., Giuffrida, M., and Viccaro, M. (2023). Unraveling textural and chemical features in volcanic rocks through advanced image processing: a case study from the 2019 paroxysmal eruptions of stromboli. Geochem. Geophys. Geosyst. 24 (3), e2022GC010774. doi:10.1029/2022GC010774
Visalli, R., Ortolano, G., Godard, G., and Cirrincione, R. (2021). Micro-fabric analyzer (MFA): a new semiautomated ArcGIS-based edge detector for quantitative microstructural analysis of rock thin-sections. ISPRS Int. J. Geo-Inf. 10 (2), 51. doi:10.3390/ijgi10020051
Yoshimura, S., Kuritani, T., Matsumoto, A., and Nakagawa, M. (2019). Fingerprint of silicic magma degassing visualised through chlorine microscopy. Sci. Rep. 9 (1), 786. doi:10.1038/s41598-018-37374-0
Zucali, M., Corti, L., Roda, M., Ortolano, G., Visalli, R., Ortolano, G., et al. (2021). Quantitative X-ray maps analaysis of composition and microstructure of permian high-temperature relicts in acidic rocks from the sesia-lanzo zone eclogitic continental crust, western alps. Minerals 11 (12), 1421. doi:10.3390/min11121421
Keywords: image analysis, Q-XRMA, principal component analysis, basalts, ArcGIS
Citation: Visalli R, Giuffrida M, Cardone M, Costa G, Ortolano G and Viccaro M (2025) Image-assisted textural analysis of plagioclase crystals in volcanic rocks: an application to lavas erupted on 2021 at Pacaya volcano, Guatemala. Front. Earth Sci. 13:1527797. doi: 10.3389/feart.2025.1527797
Received: 13 November 2024; Accepted: 19 February 2025;
Published: 11 March 2025.
Edited by:
Costanza Bonadiman, University of Ferrara, ItalyReviewed by:
L. Paul Bedard, Université du Québec à Chicoutimi, CanadaCopyright © 2025 Visalli, Giuffrida, Cardone, Costa, Ortolano and Viccaro. This is an open-access article distributed under the terms of the Creative Commons Attribution License (CC BY). The use, distribution or reproduction in other forums is permitted, provided the original author(s) and the copyright owner(s) are credited and that the original publication in this journal is cited, in accordance with accepted academic practice. No use, distribution or reproduction is permitted which does not comply with these terms.
*Correspondence: Marisa Giuffrida, bWFyaXNhLmdpdWZmcmlkYUB1bmljdC5pdA==
Disclaimer: All claims expressed in this article are solely those of the authors and do not necessarily represent those of their affiliated organizations, or those of the publisher, the editors and the reviewers. Any product that may be evaluated in this article or claim that may be made by its manufacturer is not guaranteed or endorsed by the publisher.
Research integrity at Frontiers
Learn more about the work of our research integrity team to safeguard the quality of each article we publish.