 Rui Wei
 Xuan Wang
 Guangling Hao3
94% of researchers rate our articles as excellent or good
Learn more about the work of our research integrity team to safeguard the quality of each article we publish.
Find out more
ORIGINAL RESEARCH article
Front. Earth Sci., 20 February 2025
Sec. Hydrosphere
Volume 13 - 2025 | https://doi.org/10.3389/feart.2025.1527786
This article is part of the Research TopicWater and Ecological System: Response, Management, and Restoration-Volume IIView all 14 articles
The agricultural water footprint (WF) is essential for understanding environmental impacts and managing water resources, especially in water-scarce regions. In this study, an integrated framework for assessing water resource pressure and sustainability based on the total-element agricultural water footprints was developed. Firstly, three types of WFs (i.e., blue, green and grey WFs) of major crops including wheat and maize in the Beijing area were calculated, and spatiotemporal variations were analysed. Subsequently, the water stress index (WSI) of WFs was calculated, and based on this, the reliability-resilience-vulnerability (RRV) indices was established for systematically assessing water resource stress sustainability in agricultural systems. Finally, the driving factors of agricultural WF were analysed using STIRPAT model. The results were as follows. (1) The overall WF decreased from 22.0 × 10⁸ m3 to 3.9 × 10⁷ m3, showing a significant downward trend from 1978 to 2018. (2) The WSI values exceeded 1 in 25 out of the 35 years, indicating that the Beijing area continued to experience frequent water shortages. The RRV indices indicated that the sustainability of water resources in the Beijing area had improved in recent years, and the value was 0.35 in 2018, but remained at a low level. (3) Enhancing the effectiveness of irrigation, increasing agricultural machinery density, and reducing the planting area of water-intensive crops can significantly lower the agricultural WF. This study assessed the water resource pressure and sustainability of total-element agricultural WFs by combining the WSI and the RRV indices, from the integrated perspective of both water quantity and quality. This approach is of significant importance for the sustainable utilisation and management of agricultural water resources in water-scarce regions, based on water footprint analysis.
A critical challenge to economic development is the scarcity of water resources. Agriculture accounts for 70% of global freshwater withdrawals and 90% of freshwater consumption (Dolganova et al., 2019). In China, the agricultural sector was responsible for 63.1% of the country’s total water use in 2015 (Beijing Municipal Bureau of Statistics, 2016). As the global population expands and the demand for food intensifies, the research and management of agricultural water resources have become increasingly critical. Consequently, analysing variations in agricultural water use is essential for both regional water resource planning and the implementation of agricultural water conservation strategies, especially for areas with rapid socioeconomic development and serious conflicts between water supply and water use.
The water footprint (WF) method has been widely used to better quantify water resources and to explore the relationship between human production activities and water resource embedded in products and services (Lovarelli et al., 2016; Liu et al., 2023; Mialyk et al., 2024a; Rodriguez et al., 2024). The agricultural WF accounts for water directly consumed during crop production, tillage, and irrigation (Wang et al., 2022), as well as the indirect water associated with the production and consumption of inputs including fertilizers, pesticides, and energy. Thereby the agricultural water footprint can provide a robust basis for agricultural water management. The concept of the WF was first proposed by Dutch water expert Arjen Hoekstra in 2002 (Hoekstra and Hung, 2002). The WF is a multidimensional indicator of water use and pollution (Hogeboom, 2020) and comprises blue, green, and grey WFs. Green water refers to the moisture stored in the unsaturated zone of the soil that is available for evapotranspiration; the green WF reflects the amount of green water consumed in agricultural production. Blue water, commonly understood as water resources, includes rivers, lakes, surface water, and groundwater; the blue WF refers to the amount of blue water consumed during production and consumption. Grey water refers to the volume of water required to dilute pollutants generated by agricultural production to meet water quality standards (Hoekstra, 2011); the grey WF is used to assess the extent of water pollution in terms of water volume (Wang et al., 2019; Elbeltagi et al., 2020). Since its introduction, the WF has been extensively quantified at various scales: global (Mialyk et al., 2024b; Sturla et al., 2024), national (Wang and Ge, 2020; Feng et al., 2022), urban (Cai et al., 2020; Ma and Jiao, 2023), and so on. In previous research, Hoekstra quantified the WF for crop yields in various countries and regions worldwide, establishing the first global benchmarks for crop yield WFs (Mekonnen and Hoekstra, 2014). Xu et al. (2019) quantified the agricultural WF of 207 counties in North China, exploring variations in China’s agricultural WF from a county-level perspective.
While quantification of the agricultural WF provides insight into the amount of water resources consumed during crop production, it does not adequately capture the relationship between production activities and regional water resources (Chu et al., 2022). Therefore, building on WF quantification, many studies have analysed the agricultural water stress index (AWSI) (Cao et al., 2017), green water scarcity (WSgreen) (D'Ambrosio et al., 2020), and other indicators to evaluate variations in water resource systems. In previous studies, Xie et al. (2020) considered the impact of irrigation on blue and green water and, on this basis, assessed the scarcity of these water resources in the Yellow River Basin via the WF. Cao et al. (2021) developed the water resource efficiency (WRE) index to assess water use efficiency in crop production. The water stress index (WSI) is a key indicator for assessing regional water stress, as it reflects the pressure on the water system by comparing the ratio of water consumption to the available water resources within the region (Dehghanpir et al., 2024). For instance, Wang Q. et al. (2023) employed the WSI to examine the pressure on water resources resulting from afforestation in the Inner Mongolia Autonomous Region. Typically, only blue and green WFs are used to evaluate the efficiency and scarcity of water resources, with grey WFs rarely included in the evaluation framework. However, the grey WF can assess water resource utilization from a water quality perspective. Addressing agricultural water pollution is also crucial for effective water management and sustainable development. The reliability-resilience-vulnerability (RRV) indices, proposed by Hashimoto, is widely used to evaluate the performance of specific systems (Hashimoto et al., 1982). In water resource studies, the RRV indices has been used to evaluate the performance of water supply systems (Golmohammadi et al., 2021), characterize droughts (Chanda et al., 2014), assess the impacts of water resource allocation (Zeng et al., 2024), analyse the effects of different climatic conditions on water resource systems (Asefa et al., 2014), and assess the sustainability of these systems (Sediqi and Komori, 2024). The WSI reflects the scarcity of agricultural water at a point in time, whereas the RRV indices reflects the sustainability of the system over an extended period. Building on the quantified WF, the WSI and RRV indices are combined to evaluate the pressure and sustainability of local agricultural water resource systems, effectively assessing variations and providing a theoretical basis for the sustainable development of these resources.
This study investigated the spatiotemporal changes and the driving factors of the crop production WF in the Beijing area from 1984 to 2018 while evaluating the shortage and sustainability of the agricultural water resources of the region. As a representative international megacity with high water demand, the Beijing area faces significant challenges in water resource management due to its high population density, dense urban infrastructure, and complex urban governance. This study proposed a framework for assessing water shortages and sustainability based on total-element agricultural WFs (i.e., blue, green, and grey WFs). Compared with previous studies, this research emphasized the critical role of the grey WF in the comprehensive assessment of water resource stress, evaluating agricultural water resources from both the water quantity and water quality perspectives through blue, green, and grey water. Additionally, on the basis of the calculation of the WSI, the RRV indices was constructed to systematically evaluate the pressure on and the sustainability of agricultural water resources. This enhancement can improve the comprehensive water resource evaluation system and provide a theoretical basis for policy formulation and scientific planning for the sustainable development of agricultural water resources.
The Beijing area is situated in the northwest of North China Plain, covering an area of 16,410.54 km2 (Figure 1), with a semi-humid and semi-arid monsoon climate. The perennial average precipitation is 400–500 mm. The precipitation from June to August accounts for approximately 80% of the annual average throughout the year. In 2018, the total water resources of the Beijing area amounted to 3.546 billion m3, with the surface water resources accounting for 1.432 billion m3 and groundwater resources for 2.114 billion m3. As domestic water demand in the Beijing area increased, agricultural water resources were significantly reduced. Agricultural water consumption decreased year by year. Figure 2 illustrates the change in agricultural water consumption in the Beijing area between 1987 and 2018. It decreased from 2.184 billion m3 in 1984 to 420 million m3 in 2018, marking a reduction of nearly 81% over 35 years.
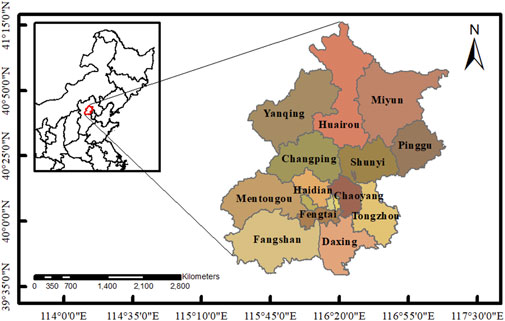
Figure 1. Map of administrative divisions of Beijing area, China.
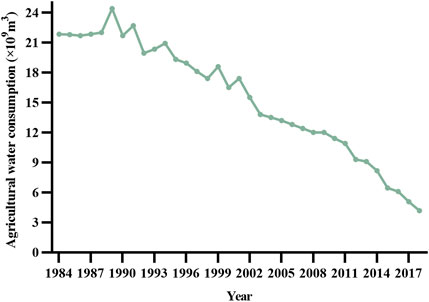
Figure 2. Agricultural water consumption in Beijing area, 1984-2018.
By the end of 2018, the Gross Domestic Product of the Beijing area had reached 3,310.6 billion CNY, with a resident population of 21.542 million, including 2.9 million in agriculture. The plains of the Beijing area were predominantly located in the southeast, offering favourable irrigation conditions. The main soil types of the planting region in the Beijing area were moist soil, brown soil, and brown soil. The primary crops grown included winter wheat, maize, soybeans, and rice. In 2018, the output value of major agricultural products in the Beijing area was 11.47 billion CNY, with an output of 341,000 tonnes of key grain crops. The area sown with major grain crops was 55.6 thousand hectares, which was 89% less than in 1984, when it was 523.1 thousand hectares. As a representative megacity in China, the Beijing area is characterized by high population density, dense urban infrastructure, and complex urban governance challenges. Like many other megacities, the traditional extensive development approach of the Beijing area has led to “urban diseases”, such as environmental pollution and resource shortages (Zhu et al., 2022). The situation regarding water resources is particularly critical. In 1984, the per capita water availability of the Beijing area was 407 m3, whereas by 2018, it had dwindled to just 164 m3. The scarcity of water resources has significantly constrained regional economic development.
The long-term meteorological data used in this study included monthly average temperature, wind speed, relative humidity, precipitation, and sunshine hours. The data covering the period from January 1984 to December 2018 were obtained mainly from Beijing weather stations and the China meteorological data sharing site. The agricultural data included soil data, fertilizer input, the agricultural population and sowing area, output, and the crop coefficient of the main crops, including wheat and maize, in the Beijing area. The data were obtained mainly from the agricultural development statistical bulletin of 30 years of reform and opening up supported by the Beijing Bureau of Statistics website and the Beijing Municipal Bureau of Statistics Information Office. Some data came from the WF assessment manual setting the global standard and the main food crop irrigation water quota of the main food crop in northern China. The soil data included the total available soil moisture, maximum precipitation infiltration rate, maximum planting depth, initial soil water consumption, etc. No wheat or maize were planted in Dongcheng District or Xicheng District, so these two districts were not considered.
In this study, a comprehensive water resource assessment framework based on the agricultural WF was constructed, as illustrated in Figure 3. The first step involved quantifying the blue, green, and grey WFs in crop production and analysing their spatiotemporal characteristics. The second step involved evaluating the pressure and sustainability of the water resource system from two perspectives: water quantity and water quality, via the WSI and RRV indices. The third step involved analysing the driving factors of the agricultural WF by using the stochastic impacts by regression on population affluence and technology (STIRPAT) model. This framework built upon the use of the WSI to assess the existing pressure on water resources and incorporated the RRV indices to analyse the long-term changes in the sustainability of the water resource system from the perspectives of reliability, resilience, and vulnerability. The framework allowed for a comprehensive evaluation of the agricultural water resource system, enhancing the multi-dimensional assessment of water resources and addressing the limitations of single-method evaluations, thereby providing a theoretical basis for promoting the sustainable development of these resources.
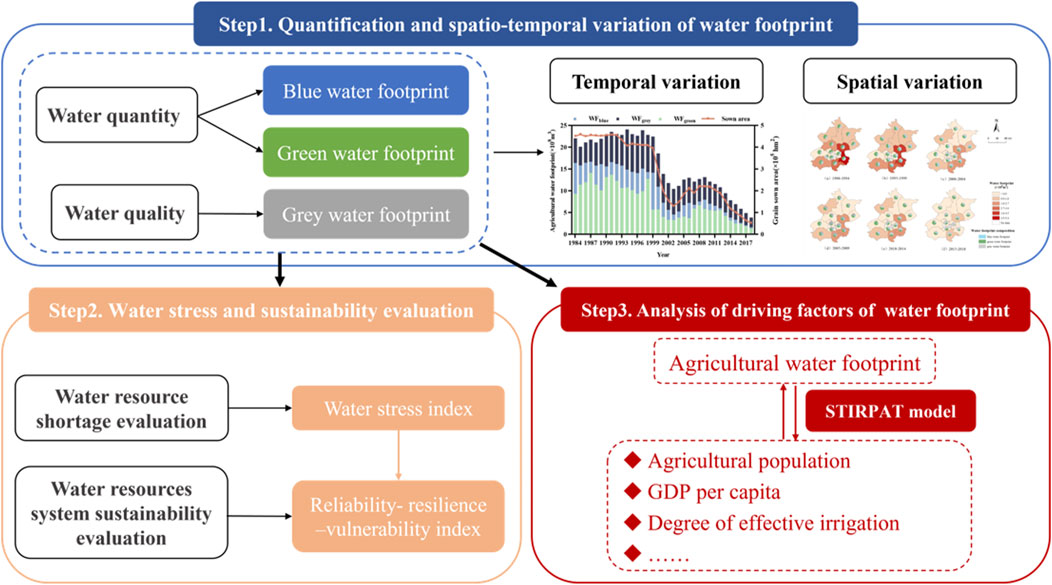
Figure 3. Research framework.
Blue, green and grey WFs were considered in the measurement of the WF for crop production. The first step in calculating the green WF and blue WF of crop production was the determination of the crop water requirement, which was calculated via the CROPWAT model, which is based on the improved Penman formula recommended by the Food and Agriculture Organization (FAO). The crop water requirement was calculated by the reference evapotranspiration (ET0), which is based on the Penman formula and considers the influence of climatic factors, can be expressed by Equation 1:
where Rn is the net radiation (MJ·m−2 d−1), G is the soil heat flux (MJ·m−2 d−1), T is the average air temperature (°C), u2 is the wind speed at a height of 2 m (m·s−1), ea is the saturation vapour pressure (kPa), ed is the actual vapour pressure (kPa), Δ is the slope of the saturation vapour pressure versus air temperature curve (kPa·°C−1), and γ is the psychrometric constant (kPa·°C−1).
The crop evapotranspiration (ETc) was estimated by Equation 2:
where Kc is a crop coefficient that varies with the crop stage.
WFblue and WFgreen can be calculated based on Equations 3, 4:
where WFblue is the surface water or groundwater consumed in the crop production process, WFgreen is the precipitation consumed in the crop production process, 10 is the unit conversion coefficient to convert units by mm (depth) into m3/hm2 (water amount per unit area), and
The grey WF (WFgrey) of agricultural nonpoint source pollution can be calculated by Equation 5:
where Appl is the input of pesticide or fertilizer, α is the proportion of the pollutant in the total pesticide or fertilizer input, Cmax is the maximum allowable concentration of pollutants (kg/m3), and Cnat is the initial concentration of pollutants (kg/m3). According to previous research (Zhang, 2017), 10 mg/L was used for Cmax.
The Department of Agriculture typically adopts nitrogen (N) and phosphorus (P) as indices reflecting the grey WF. In this case, α is the leaching loss rate of N or P. As nitrogen fertilizer contributes the most to the grey WF in agricultural production in China, nitrogen was taken as the representative index for calculating WFgrey.
The MK test method was used to analyse the variation trends in crop production WFs. According to the MK test, for the time series x1, x2, … , xn, the statistic S is given by Equation 6:
where n is the length of the series, xi and xj are the sequential data values, and
when n ≥ 10, the statistic S is approximately normally distributed with a mean of 0, and its standard deviation can be expressed as:
In Equation 7, where σx is the standard deviation of S and ti is the number of ties of extent i. The MK test statistic Z is expressed as Equation 8:
The significance trend is tested by comparing the absolute value of Z at the desired significance level α. In this study, a Z value beyond the interval of ±1.96 means that the trend is considered significant at the 95% confidence level. An increasing statistical Z value indicates an increasing trend, and vice versa.
The WSI can reflect agricultural water scarcity in a region and was calculated on the basis of the agricultural WF and agricultural water use as determined by Equations 9–13:
where
where TWR is the total amount of blue water resources available for agriculture; EWR is the demand for environmental water; and WR is the total quantity of available blue water resources within the region. Additionally, AWU is the agricultural water consumption and WU is the total water consumption.
In addition, the footprints of blue water, green water, and grey water are calculated as
where
In accordance with the methods of Shu et al. (2021), a water scarcity assessment based on the grey WF was constructed
where
The WSI classified water scarcity into four levels: 0 < WSI < 0.2, no water shortage; 0.2 < WSI < 0.4, slight shortage; 0.4 < WSI < 0.8, moderate shortage; 0.8 < WSI <1, high shortage; WSI > 1, severe shortage.
To further explore the sustainability of agricultural water resources, the RRV indices was used to evaluate the sustainability of agricultural water resources in the Beijing area on the basis of the WSI. First, a standard C was defined. In this study, C was the WSI value when water shortage was under extreme pressure, that is, WSI = 1.0, and
where Wt is the recovery index of the water resource system from severe shortages:
The RRV indices includes three indices, namely, reliability, resilience and vulnerability. Reliability refers to the likelihood that the system remains in a satisfactory state, resilience indicates the speed at which the system recovers from an unsatisfactory state, and vulnerability measures the degree to which the system is in its least satisfactory state as represented by Equations 17–19 (Hashimoto et al., 1982).
where T is the time step, set to 10 years in this study; n indicates the number of failure events; d(j) is the duration of the jth failure event;
The sustainability index was used to evaluate the sustainability of water resources system, and was the geometric average of the reliability, resilience and vulnerability after standardization, as expressed in Equation 20. A higher sustainability index indicates greater sustainability of the water resource system, categorized into five levels: 0-0.20, poor; 0.20–0.40, fair; 0.40–0.60, average; 0.60–0.80, good; and 0.80–1.0, excellent.
The impact of population, affluence and technology (IPAT) model was proposed by Ehrlich and Holden to study the impacts of human socioeconomic activities on the environment and is formulated in Equation 21 (Ehrlich and Holdren, 1971):
where I is the resulting environmental impact, P is the population size, A is the level of affluence, and T is the level of technology.
The proposed IPAT model provides a way to explain the impact of a range of human activities on the environment, but it still has strong limitations, mainly including the simplicity of the interrelationship among parameters and the assumption that the elasticities of P, A, and T are the same, which implies the same contributions of different factors to environmental pressure. This conflicts with the EKC assumption (Liu and Xiao, 2018). Therefore, on the basis of this model, Dietz and Rosa proposed the stochastic impacts by regression on population affluence and technology (STIRPAT) model, which is expressed in Equation 22 (Dietz and Rosa, 1997):
where a is the intercept term; b, c, and d are the elastic coefficients of P, A and T, respectively; e is the residual error.
The STIRPAT model is usually used in logarithmic posterior form (York et al., 2003; Lohwasser et al., 2020):
The drivers of environmental stress are related not only to population, affluence and technology level but also to various socioeconomic factors, so the STIRPAT model can be analysed by adding more factors according to real needs. To investigate the drivers of the agricultural WF in the Beijing area, we selected six factors, namely, the agricultural population (P), gross output value of agriculture (A1), GDP per capita (A2), industrial structure (A3), degree of effective irrigation (T1), agricultural machinery density (T2), and planting structure (PS), as shown in Table 1, and are expressed with Equation 24. Among these factors, the agricultural population (P) represented the number of people engaged in agricultural activities, directly influencing the water demand in the agricultural sector. The gross output value of agriculture (A1) and GDP per capita (A2) reflected the level of affluence, the development of the agricultural economy, and the impact of increases in production scale and economic growth on the agricultural WF. The industrial structure (A3) affected the agricultural WF by altering the input of agricultural resources and production methods. The degree of effective irrigation (T1) and agricultural machinery density (T2) reflected advances in agricultural production technology, which in turn influenced the agricultural WF. The adjustment of the planting structure (PS) directly affected the total agricultural water demand, making it a key factor representing the production structure.
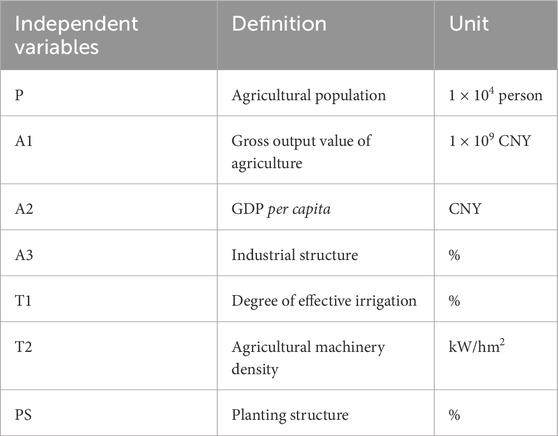
Table 1. Description of each variable in the STIRPAT model.
Equations 1–5 were used to calculate the agricultural WF in the Beijing area from 1984 to 2018. The results of WF and the sown area of main grains are shown in Figure 4A. From 1984 to 2018, the annual average agricultural WF in the Beijing area was 16.0 × 10⁸ m³, decreasing from 22.0 × 10⁸ m³ in 1984 to 3.86 × 10⁸ m³ in 2018, with an average annual variation rate of 4.54%. The absolute Z value from the Mann‒Kendall (MK) test was greater than 1.96, indicating a significant downward trend over the study period. The maximum value was 24.1 × 10⁸ m³ in 1994, and the minimum value was 3.86 × 10⁸ m³ in 2018. Between 1984 and 2000, the agricultural WF fluctuated slightly, averaging approximately 22.2 × 10⁸ m³. Starting in 2001, the agricultural WF of the Beijing area began to decrease significantly, although it exhibited an increasing trend from 2004 to 2009, with an average annual growth rate of 4.11%. With an average annual decline of 12.6%, the agricultural WF displayed a continuous downward trend from 2009 to 2018.
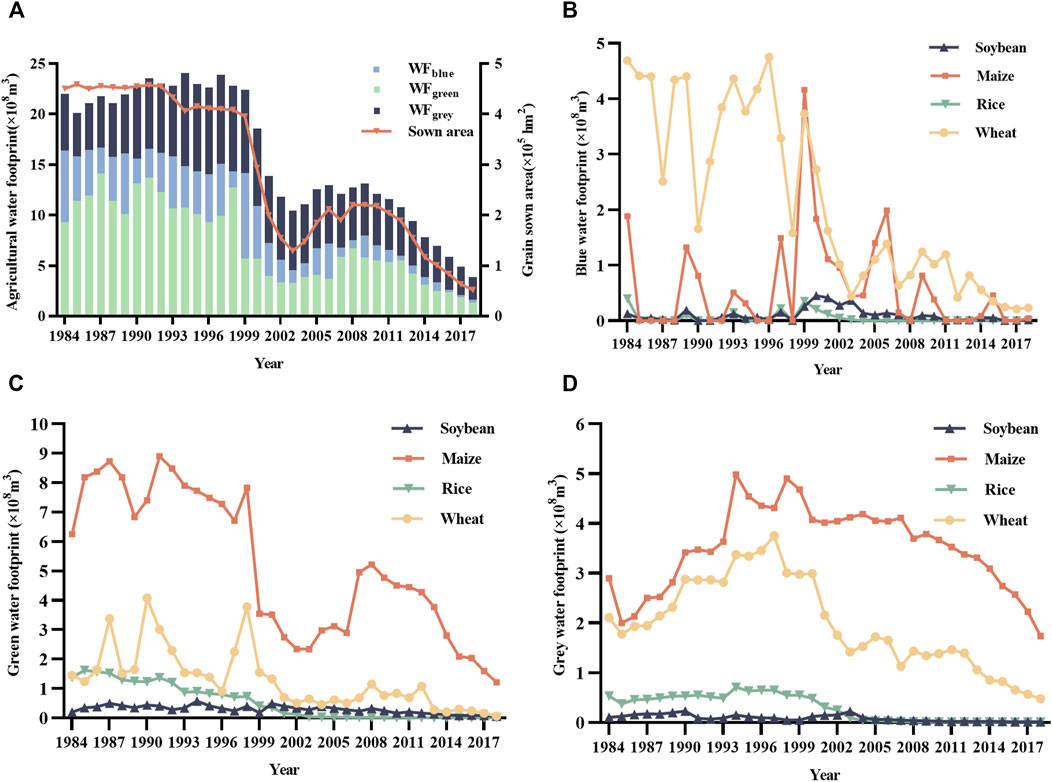
Figure 4. (A) Agricultural WF and composition, (B) blue WF, (C) green WF and (D) grey WF of four food crops in Beijing area.
The trend in WF variation was consistent with the variation in the crop sowing area, indicating that the crop sowing area was a key factor influencing the WF. In terms of WF composition, the overall pattern observed was green WF > grey WF > blue WF. On average, the green WF accounted for approximately 44% of the total WF, the grey WF accounted for 40%, and the blue WF accounted for 16%. The trend in the variation in the green WF was largely consistent with that in the total WF, with an average annual variation rate of 16.0%. The grey WF initially increased, peaking at 9.21 × 10⁸ m³ in 1994, before continuously decreasing to a minimum of 2.23 × 10⁸ m³ in 2018. The annual variation rate of the blue WF was 52.0%, which was significantly influenced by precipitation and the planting structure.
The green, blue, and grey WFs of the four crops are depicted in Figures 4B–D. The average green WF of the four crops, ranked from largest to smallest, was as follows: maize > wheat > rice > soybean, with a significant decline observed across all crops. The average annual green WF for soybeans was 0.29 × 10⁸ m³. Between 1984 and 1998, the average green WF of maize was approximately 7.75 × 10⁸ m³, but it significantly decreased to 3.55 × 10⁸ m³ in 1999, primarily due to severe drought in the Beijing area, where rainfall was only 36% of that of the previous year. Among the four crops, wheat was the most water intensive, exhibiting the highest blue WF, followed by maize, soybean, and rice. The blue WF of wheat showed a significant fluctuating downward trend, reaching a minimum of 0.21 × 10⁸ m³ in 2017. The blue WF of maize varied significantly from year to year, with an average of 0.59 × 10⁸ m³. When precipitation meets crop growth needs—specifically, when effective precipitation exceeds crop evapotranspiration—the blue WF is zero. The blue WFs of soybeans and rice remained consistently low. The grey WF of maize and wheat accounted for 93.6% of the total footprint among the four crops, initially increasing and then decreasing, whereas that of soybeans and rice remained very low. The MK trend test results are presented in Table 2. From 1984 to 2018, the absolute Z values for the WFs of all crops except for the blue WF and grey WF of maize exceeded 1.96 and were all negative, indicating a significant downward trend.
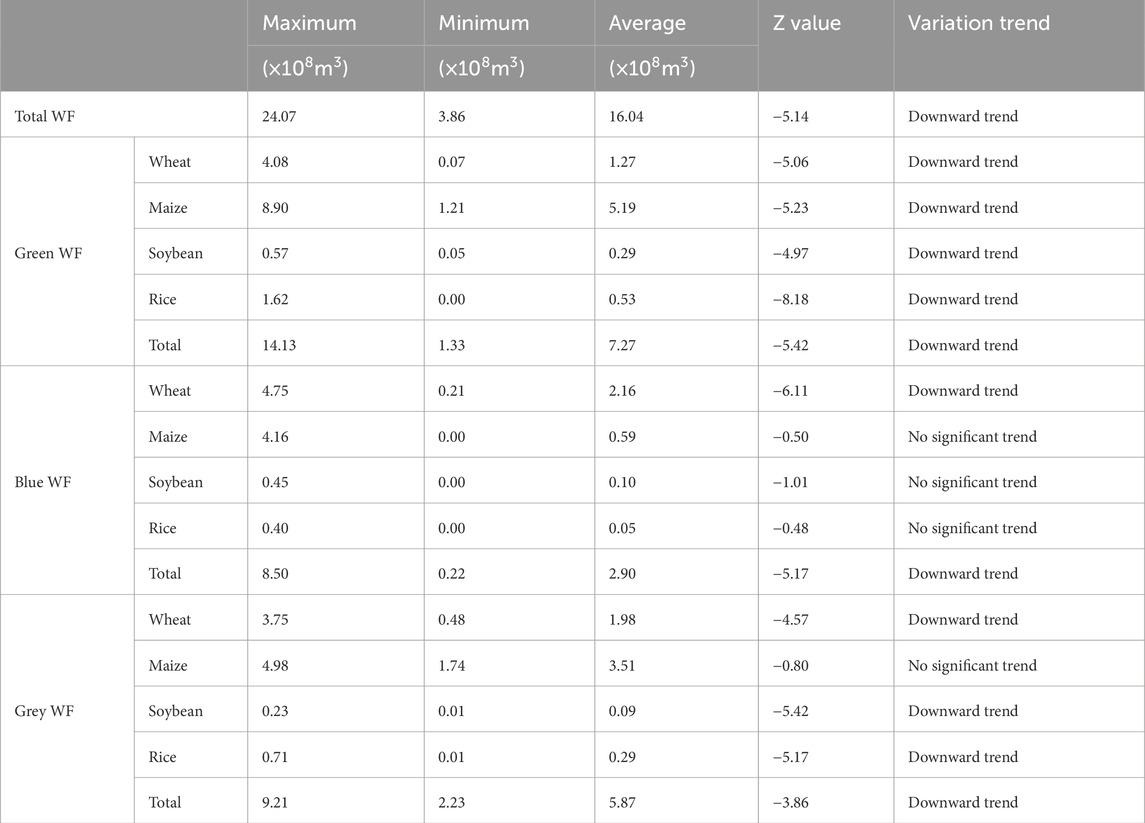
Table 2. MK trend test for WFs.
Figure 5 illustrates the spatial distribution and temporal evolution of the agricultural WF across various districts and counties in the Beijing area from 1990 to 2018. Overall, there were considerable variations in the agricultural WF among the districts and counties. Tongzhou District recorded the highest agricultural WF, with an average annual value of 2.71 × 10⁸ m³, followed by Shunyi District and Daxing District, with averages of 2.59 × 10⁸ m³ and 2.44 × 10⁸ m³, respectively. Tongzhou and Shunyi districts were the two largest areas in terms of grain sown area, with an average of 5.4 × 10⁴ m3 and 5.3 × 10⁴ m3 per year. These values were approximately 1.1 × 10⁴ m³ higher than that of Daxing district, which ranked third with 4.2 × 10⁴ m³. The blue and green WFs in Tongzhou and Shunyi districts were relatively similar, with the primary difference lying in the grey WF. Between 1990 and 2018, Tongzhou district had an average fertiliser use of 200 kg per hectare more than Shunyi district. This higher fertiliser application, in the context of similar blue and green WFs, contributed to agricultural WF of Tongzhou district being the highest among all districts and counties in the Beijing area. The agricultural WF in each district decreased by an average of 80.1% from 2015 to 2018 compared to that from 1990 to 1994. Notably, the agricultural WFs of the Chaoyang and Fengtai districts exhibited the most significant reductions, each decreasing by more than 98%. In 1992, the actual cultivated land area of the Beijing area was 408,300 hm2, with 37,900 hm2 located in the suburban districts of Chaoyang, Fengtai, Shijingshan, and Haidian. By the end of 2018, the cultivated land area of the Beijing area had decreased to 212,800 hm2, with the four suburban districts reduced to 6,600 hm2, which was an 82.6% reduction. This significant reduction in arable land was accompanied by a corresponding decrease in the agricultural WF.
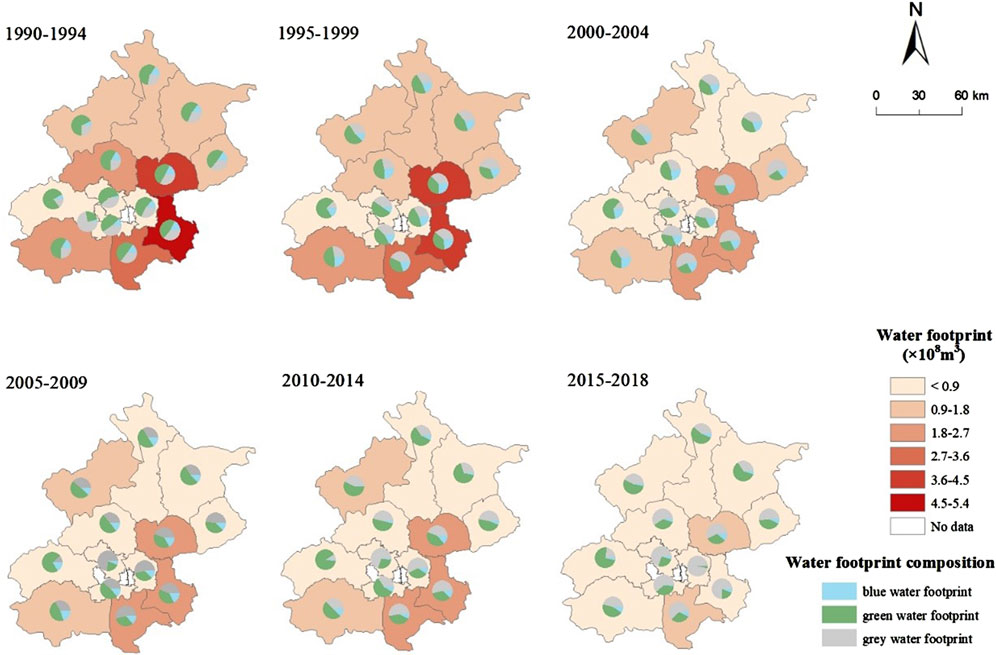
Figure 5. Agricultural WFs of Beijing area in different periods.
In terms of WF composition, the green WF was dominant from 1990 to 1994, accounting for an average of 50%, followed by the grey and blue WFs. The proportion of the grey WF gradually increased thereafter, reaching 55% from 2015 to 2018, whereas the green WF decreased to 39%. The WF composition among different districts and counties showed little variation; however, the green WF in Mentougou District consistently exceeded 70% over many years. This was attributed to the district having the lowest fertilizer usage per unit of cultivated land, resulting in a relatively small grey WF.
Equations 9–19 were employed to calculate the agricultural WSI and RRV indices for the Beijing area from 1984 to 2018. The calculation results of WSI index are shown in Figure 6A. The annual average WSI was 1.21, indicating a severe level of agricultural water resource stress in the Beijing area over the long term, with WSI values exceeding 1 in 25 out of the 35 years. Between 1999 and 2007, the WSI remained above 1 for nine consecutive years, primarily because of significantly lower precipitation than the annual average, marking the most severe drought period in the Beijing area since the 1950s (Shuang-shuan, 2015). WSIblue and WSIgreen quantified water resource scarcity during crop production from a water quantity perspective. The annual average WSIblue value was 1.37, with a maximum value of 6.70 in 1999; and the annual average WSIgreen value was 0.60 with a maximum value of 0.73 in 2007. A high WSIblue typically corresponded to a low amount of available water resources, indicating extreme blue water scarcity in the Beijing area, with significant interannual variations. WSIgrey quantified the sustainability of water resource use from a water quality perspective (Shu et al., 2021). Between 1984 and 2018, the annual average WSIgrey was 0.63, indicating a moderate level of water scarcity. Between 1999 and 2002, WSIgrey was greater than 1, coinciding with high WSIblue values and low available water resources, indicating an increased likelihood of agricultural water pollution during this period. To assess the sustainability of agricultural water resources in the Beijing area, RRV index was calculated, as presented in Figure 6B. From 1984 to 2018, the WSI values exceeded 0.8 on 25 occasions, with a multiyear reliability average of 0.25, peaking at 0.60 in 1993 and 1994 and reaching its lowest value of 0.10 between 2001 and 2010. The reliability of agricultural water resources in the Beijing area continuously declined from 1994 to 2001, reaching its lowest value of 0.10 before increasing to 0.30 after 2009. In recent years, the reliability of agricultural water resources in the Beijing area had exhibited a downward trend owing to consistently high WSI values exceeding 1. The average annual resilience index was 0.20, reflecting the capacity of water resources to recover from extreme stress to normal levels. The WSI of the Beijing area frequently exceeded 1, suggesting low resilience in agricultural water resources. When pressure becomes too severe, recovery to normal levels is difficult within a short time. Additionally, the average vulnerability index was 1.94, exceeding 1 from 1999 to 2015, reaching a maximum of 4.28 in 2006, and subsequently decreasing from 2016 to 2018. The sustainability index indicated that the sustainability of the agricultural water resource system in the Beijing area peaked in 1993, continued to decline until 2001, and remained in a state of poor sustainability until 2010. After it rose from 2011 to 2018, it decreased again, reaching a fair level in 2018.
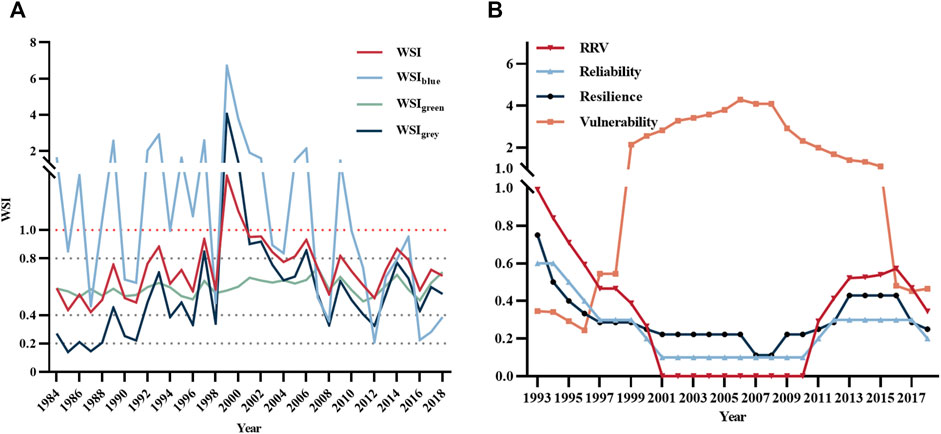
Figure 6. (A) WSI of total agricultural WF, blue WF, green WF and grey WF in Beijing area, and (B) Reliability-resilience-vulnerability indices.
The driving factors of the agricultural WF in the Beijing area from 1984 to 2018 were analysed via the extended STIRPAT model. The regression results are shown as Table 3. To address the strong multicollinearity between the dependent and independent variables and prevent interference from their overlapping information, ridge regression was performed by using SPSS 26.0 software. This yielded the regression equation and the corresponding R2 value with varying asynchronous length k. A smaller k value corresponded to a smaller deviation. The standardized regression coefficients stabilized, leading to the selection of k = 0.02 as the step size. After adjustment, the R2 value was 0.966, with all seven independent variables passing the significance test and with VIF values less than 10. The equation of the STIRPAT model was obtained as follows:
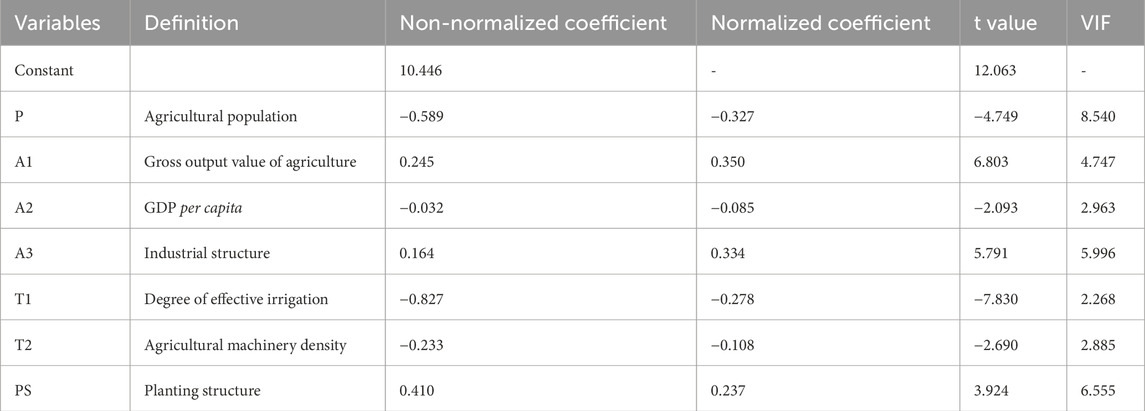
Table 3. Regression results.
Equation 25 revealed that increases in A2, T1, and T2 reduced the agricultural WF of the Beijing area, whereas increases in P, A1, A3, and PS led to an increase in the WF. Among these factors, the most influential on the agricultural WF of the Beijing area was the effective irrigation degree (T1). For every 1% increase in the degree of effective irrigation, the agricultural WF of the Beijing area decreased by 0.827%. Additionally, the agricultural population and planting structure played significant roles. The planting structure emerged as the largest positive driving factor, whereas effective irrigation was the most significant negative driving factor.
In this study, the agricultural WF across urban and county areas of the Beijing area from 1978 to 2018 was quantified. The agricultural WF in the Beijing area showed slight fluctuations before 1999, a significant decrease from 1999 to 2003, and a trend of an initial increase followed by a decrease from 2004 to 2018; this was consistent with previous research findings (Xu et al., 2015; Jin et al., 2016). From 2000 to 2018, the agricultural WF in the Beijing area showed a trend of first increasing but then decreasing. Nationwide, the agricultural WF exhibited an increasing trend, while the proportion of the agricultural WF in the Beijing area relative to the national total gradually decreased (Wang Z. et al., 2023). This indicated a shift in the industrial structure of the Beijing area, which was characterized by a decline in the proportion of agriculture. The agricultural green WF of the Beijing area accounted for the largest proportion of its WF, with green water being consumed primarily in agricultural production. It played a significant role in both rain-fed crops and irrigated farmland (Cao et al., 2015; Cao et al., 2017). Therefore, improving the utilization rate of green water was crucial for alleviating water resource pressure. Throughout the study period, the proportion of the grey WF showed an increasing trend. The decline in soil fertility in recent years had led to the increased application of chemical fertilizers as the primary means to replenish soil nutrients and improve grain yield. Fertilizer use was the primary source of the grey WF in agricultural production. The fertilizer utilization efficiency in China is low, and the grey WF generated by fertilizer leaching negatively impacts the water environment. Enhancing fertilizer utilization efficiency in grain cultivation is a critical strategy to reduce the grey WF and control agricultural nonpoint source pollution.
The WF of food crops is influenced by natural factors, including crop type, regional climate, and soil type, and social factors, such as agricultural policy, land planning, and economic conditions (Xu et al., 2022). Owing to the relatively small variations in climate types across districts and counties within the Beijing area, the impact of topography is reflected mainly in the differences in cultivated area. The terrain of the Beijing area is characterized by higher elevations in the northwest and lower elevations in the southeast. This study indicated that the southeastern region, which was dominated by plains, featured large and dense crop planting areas, leading to a high and concentrated agricultural WF. According to Beijing major function-oriented zone planning, Tongzhou district, Shunyi district, Daxing district, and the plains of the Changping and Fangshan districts have been designated new urban development areas tasked with advancing modern agriculture. For many years, these five districts had accounted for more than 60% of the total WF, necessitating stronger management of agricultural water resources to address the water scarcity in the Beijing area.
Rapid population growth and economic development during the urbanization of the Beijing area had significantly increased water demand, leading to severe groundwater overexploitation. The average groundwater depth increased from 6.4 m in 1978 to 25.66 m in 2014, indicating extreme strain on water resources (Liu et al., 2019; Qin, 2021). To further explore the pressure and sustainability of the water resource system in the Beijing area, this study combined the WSI and RRV indices to establish a new comprehensive water resource assessment framework. The WSI results indicated that the regional agricultural water resources had experienced severe shortages for many years, mainly water quantity type water shortage, in which the blue water shortage problem had been particularly frequent. In 1999, a water quality shortage occurred, primarily due to the scarcity of blue water resources. Since the 1960s, the Beijing area had experienced below-average annual precipitation and uneven annual distribution, while the increasing water demand due to population growth had exacerbated agricultural water resource conflicts, significantly restricting the sustainable development of agriculture. This study showed that after 2007, precipitation levels increased compared with those in previous years, leading to a decrease in the WSI and an increase in reliability, resilience, and sustainability, returning to pre-1999 levels. Since 2000, the Beijing Municipal Government had implemented various measures to mitigate water shortages, including increasing reclaimed water irrigation in farmlands, adjusting the agricultural industrial structure, promoting water-saving agriculture and continuously reducing agricultural water consumption. However, further measures are necessary to address the ongoing scarcity of agricultural blue water resources. In particular, under the influence of climate change, it was crucial to strengthen the assessment of and response to natural disaster risks, such as drought. From 2013 to 2018, the WSI remained above 1, and sustainability remained at a poor to average level, indicating that the shortage of agricultural water resources remained severe. The RRV results indicated that, in recent years, the sustainability of agricultural water resources in the Beijing region showed an improvement relative to the 2000s. However, when compared to the 1990s, there was little improvement, and sustainability levels remained relatively low. While agricultural water consumption in the Beijing area had gradually decreased over the years, further measures, such as the use of advanced water-saving irrigation technology, the development of high-standard farmland, and modernization restructuring, were essential for increasing water resource efficiency and promoting sustainable usage.
This research framework comprehensively considered blue, green, and grey WFs, constructing a comprehensive evaluation system for water resources on the basis of the WSI and RRV indices from the perspectives of both water quantity and quality. Compared with many previous studies, the water stress due to the heavy use of fertilizers was considered, and the grey WF was included into the assessment system in this study. Additionally, by combining the WSI and RRV indices, the RRV indices was proposed as a new systematic approach for assessing water resource in agricultural systems. The agricultural water resource evaluation system was further improved to provide robust and scientific data support for effective water resource management.
Over the past 35 years, the agricultural WF of the Beijing area had decreased by 82.5%, with the blue WF decreasing by 95.9%, the green WF decreasing by 85.6%, and the grey WF decreasing by 60.4%. From the perspective of water consumption sources, the reduction in the sown area was the primary factor contributing to the decrease in the agricultural WF of the Beijing area. On the one hand, the transformation of the Beijing area into a megacity had led to significant changes in land use due to economic and social development needs; on the other hand, the aggressive promotion of ecological and environmental protection policies, such as returning farmland to forests, reduced the city’s cultivated land area. Moreover, as living standards have improved, the demand for fruits and vegetables has increased, leading to a reduction in the area sown with grain. By 2018, the area sown with food crops was only 16.7% of that in 1984.
Variations in crop types significantly impact the amount of water required for irrigation. The WF per unit of wheat and rice was greater than that per unit of corn and soybeans. The driver analysis indicated that a 1% increase in wheat cultivation resulted in a 0.41% increase in the agricultural WF. Given that wheat and corn constituted approximately 90% of the total crop production, cultivating crops such as corn, which had a lower unit WF, can promote more efficient water resource use. Considering the current situation of water shortages in the Beijing area, it is necessary to change the planting structure.
Each 1% increase in the degree of effective irrigation and density of agricultural machinery could reduce the agricultural WF by 0.827% and 0.233%, respectively. This research indicated that agricultural modernization and the continuous progress of water-saving irrigation technology and supportive measures could reduce irrigation water consumption, increase the efficiency of agricultural water resource utilization, and subsequently lower the agricultural WF. Agricultural modernization is an important goal in China, with mechanization serving as its foundation. The growing demand for food crops due to population growth has driven advancements in agricultural machinery. On the one hand, this progress has led to increased crop yield and improved agricultural production efficiency; on the other hand, water-saving agricultural mechanization has improved the utilization efficiency of agricultural water resources.
Population factors significantly influenced the agricultural WF in the Beijing area. The results indicated that a 1% increase in the permanent population corresponded to a 0.589% decrease in the agricultural WF of the Beijing area. Typically, an increase in population led to an increase in the agricultural WF (Huang et al., 2021); however, the context in the Beijing area was contrary to this trend. As a megacity in China, the permanent resident population of the Beijing area in 2018 was 223% of that in 1984, whereas the agricultural population in 2018 was only 75% of that in 1984. Rapid urban development has driven more workers from rural areas to seek employment in cities. This shift had led to the abandonment of cultivated land and a reduction in the agricultural population (Gong et al., 2020). Owing to rapid urbanization and urban planning in the Beijing area, the cultivated land area decreased from 422,000 ha in 1984 to just 21.3 ha in 2018. This drastic reduction in cultivated land area led to a corresponding decrease in the agricultural WF, resulting in a negative impact of population on the agricultural WF of the Beijing area.
Various economic factors exerted distinct impacts on the agricultural WF in the Beijing area. The total agricultural output value was the largest positive driving force of the agricultural WF in the Beijing area; for every 1% increase in the gross output value of agriculture, the agricultural WF increased by 0.245%. From 1984 to 2018, the total agricultural output value of the Beijing area increased from 1.44 billion CNY to 11.47 billion CNY (Beijing Municipal Bureau Of Statistics, 2019). An increase in the gross output value of agriculture indicated an increase in crop production, necessitating significant water resources to support crop growth. The industrial structure was the second most significant positive driver of the agricultural WF in the Beijing area. A 1% increase in the proportion of primary industry resulted in a 0.164% increase in the agricultural WF of the Beijing area. Between 1984 and 2018, the proportion of primary industry in the Beijing area declined from 6.8% to 0.4%. The industrial structure of the Beijing area had been progressively optimized, with primary and secondary industries gradually shifting to the tertiary sector, significantly reducing the agricultural WF. The negative correlation between GDP per capita and the agricultural WF of the Beijing area indicated a reduced reliance on agriculture for economic development, with residents increasingly deriving economic benefits from secondary and tertiary industries, in line with the evolving industrial structure.
The population growth in megacities such as Beijing inevitably increases the demand for food, which in turn drives higher water demand. As a result, the Beijing area imports significant quantities of food crops to alleviate pressure on water resources. While reducing the crop planting area is the primary strategy for minimizing agricultural water use, the Beijing area must still preserve a certain amount of cultivated land to maintain ecosystem services and ensure a basic level of food self-sufficiency (Huang et al., 2012). To alleviate agricultural water resource pressures and promote regional sustainable water use, the recommendations are proposed as follows. (1) To maximize the efficient use of water resources by considering local climate conditions, selecting suitable crop types, optimizing planting structures, and reducing the planting area of high-water-consuming crops such as wheat. (2) To promote the adoptions of water-saving technologies in agriculture. As of 2020, the effective utilization coefficient of farmland irrigation water in the Beijing area was 75%, leading the nation, although it was still behind the 80%–90% efficiency levels seen in agriculturally developed countries. Advancements in water-saving technology can reduce blue water losses during irrigation, increase the efficiency of green water resource use, and thereby ease agricultural water resource pressures in the Beijing area. Additionally, the government should promote water-saving technologies tailored to the needs of farmers and crop types while encouraging the cultivation of drought-tolerant and water-efficient crops. (3) To continuously promote the applications of formulated fertilizers, organic fertilizers and other scientific fertilizer application methods, such as tailor-made fertilizer formulations according to different soil types and crop varieties along with policy subsidies, strengthen publicity and education on scientific fertilizer application, enhance fertilizer utilization efficiency, reduce grey WF, and control agricultural nonpoint source pollution. At the same time, crop yields have increased, indirectly reducing the WF of crop production.
This study analysed the temporal and spatial variations in the agricultural WF from 1978 to 2018, assessing the degree of water resource scarcity from both water quantity and water quality perspectives through blue, green, and grey WFs. On the basis of these assessments, an RRV indices was developed to evaluate the sustainability of agricultural water resources in the Beijing area, further enriching the comprehensive assessment system of water resources. The STIRPAT model was subsequently employed to investigate the driving factors influencing the agricultural WF. The results were as follows. (1) Agricultural WF in the Beijing area decreased significantly from 1978 to 2018. The green WF accounted for 43% of the total WF of the Beijing area. It indicated that the primary requirement for the growth of grain crops in the Beijing area was green water. (2) The WSI revealed that the Beijing area had consistently faced blue water shortages over the years, with water scarcity remaining severe. The RRV results indicated that the sustainability of the water resources system remained at a low level. The Beijing municipal government should continue to increase water resource utilization efficiency to alleviate ongoing water resource pressures. (3) Analysis of the driving factors suggested that reducing the proportion of water-intensive crops such as wheat, enhancing irrigation support measures, and promoting water-saving technologies can effectively reduce the agricultural WF. This study proposed an innovative water resource assessment framework that combined the WSI and the RRV indices. Building on the traditional WSI assessment method, this framework not only analysed the current pressure on water resources but also extended the evaluation to the long-term sustainability of the water resource system. It can provide a more comprehensive and systematic analytical tool for the sustainable management of water resources.
This study has several limitations in quantifying the agricultural WF of the Beijing area, as it considers only the WF of certain crops, does not include the WF of animal husbandry, and does not account for virtual water flows associated with trade. Given that the grain supply for the Beijing area is largely supplied from other regions, future studies should place greater emphasis on the impact of virtual water trade.
The raw data supporting the conclusions of this article will be made available by the authors, without undue reservation.
RW: Conceptualization, Data curation, Formal Analysis, Investigation, Methodology, Visualization, Writing–original draft, Writing–review and editing. XW: Conceptualization, Project administration, Resources, Supervision, Writing–original draft, Writing–review and editing. GH: Conceptualization, Data curation, Investigation, Methodology, Writing–original draft. JC: Formal Analysis, Methodology, Writing–review and editing. ZL: Formal Analysis, Methodology, Writing–review and editing.
The author(s) declare that financial support was received for the research, authorship, and/or publication of this article. This research was financially supported by the National Natural Science Foundation of China (52270194, 52070024).
We would like to extend special thanks to the editor and the reviewers for their valuable comments in greatly improving the quality of this paper.
The authors declare that the research was conducted in the absence of any commercial or financial relationships that could be construed as a potential conflict of interest.
The author(s) declare that no Generative AI was used in the creation of this manuscript.
All claims expressed in this article are solely those of the authors and do not necessarily represent those of their affiliated organizations, or those of the publisher, the editors and the reviewers. Any product that may be evaluated in this article, or claim that may be made by its manufacturer, is not guaranteed or endorsed by the publisher.
Asefa, T., Clayton, J., Adams, A., and Anderson, D. (2014). Performance evaluation of a water resources system under varying climatic conditions: reliability, Resilience, Vulnerability and beyond. J. Hydrol. (Amst). 508, 53–65. doi:10.1016/j.jhydrol.2013.10.043
Beijing Municipal Bureau of Statistics (2016). Beijing statistical yearbook. Available at: https://nj.tjj.beijing.gov.cn/nj/main/2016-tjnj/zk/e/indexch.htm (Accessed October 21, 2016).
Beijing Municipal Bureau of Statistics (2019). Beijing statistical yearbook. Available at: https://nj.tjj.beijing.gov.cn/nj/main/2019-tjnj/zk/e/indexch.htm (Accessed April 28, 2021).
Cai, J., He, Y., Xie, R., and Liu, Y. (2020). A footprint-based water security assessment: an analysis of Hunan province in China. J. Clean. Prod. 245, 118485. doi:10.1016/j.jclepro.2019.118485
Cao, X., Wang, Y., Wu, P., Zhao, X., and Wang, J. (2015). An evaluation of the water utilization and grain production of irrigated and rain-fed croplands in China. Sci. Total Environ. 529, 10–20. doi:10.1016/j.scitotenv.2015.05.050
Cao, X., Zeng, W., Wu, M., Li, T., Chen, S., and Wang, W. (2021). Water resources efficiency assessment in crop production from the perspective of water footprint. J. Clean. Prod. 309, 127371. doi:10.1016/j.jclepro.2021.127371
Cao, X. C., Wu, M. Y., Guo, X. P., Zheng, Y. L., Gong, Y., Wu, N., et al. (2017). Assessing water scarcity in agricultural production system based on the generalized water resources and water footprint framework. Sci. Total Environ. 609, 587–597. doi:10.1016/j.scitotenv.2017.07.191
Chanda, K., Maity, R., Sharma, A., and Mehrotra, R. (2014). Spatiotemporal variation of long-term drought propensity through reliability-resilience-vulnerability based Drought Management Index. Water Resour. Res. 50 (10), 7662–7676. doi:10.1002/2014WR015703
Chu, Q., Shi, X., Zhao, J., Jia, H., Zhao, J., Lu, J., et al. (2022). Seeking sustainable pathway of crop production by optimizing planting structures and management practices from the perspective of water footprint. Sci. Total Environ. 843, 157091. doi:10.1016/j.scitotenv.2022.157091
D'Ambrosio, E., Gentile, F., and De Girolamo, A. M. (2020). Assessing the sustainability in water use at the basin scale through water footprint indicators. J. Clean. Prod. 244, 118847. doi:10.1016/j.jclepro.2019.118847
Dehghanpir, S., Bazrafshan, O., Etedali, H. R., Holisaz, A., and Collins, B. (2024). Water scarcity assessment in Iran's agricultural sector using the water footprint concept. Environ. Dev. Sustain 26 (11), 28995–29020. doi:10.1007/s10668-023-03852-3
Dietz, T., and Rosa, E. A. (1997). Effects of population and affluence on CO2 emissions. Proc. Natl. Acad. Sci. U. S. A. 94 (1), 175–179. doi:10.1073/pnas.94.1.175
Dolganova, I., Mikosch, N., Berger, M., Nunez, M., Mueller-Frank, A., and Finkbeiner, M. (2019). The water footprint of European agricultural imports: hotspots in the context of water scarcity. Resources-Basel. 8 (3), 141. doi:10.3390/resources8030141
Ehrlich, P. R., and Holdren, J. P. (1971). Impact of population growth. Obstet. \& Gynecol. Surv. 26, 769–771. doi:10.1097/00006254-197111000-00014
Elbeltagi, A., Aslam, M. R., Malik, A., Mehdinejadiani, B., Srivastava, A., Bhatia, A. S., et al. (2020). The impact of climate changes on the water footprint of wheat and maize production in the Nile Delta, Egypt. Sci. Total Environ. 743, 140770. doi:10.1016/j.scitotenv.2020.140770
Feng, H., Yang, M., Zeng, P., Liu, Y., Sun, F., Wang, K., et al. (2022). Transprovincial water quality impacts and the environmental inequity of grey water footprint transfer in China. Resour. Conserv. Recycl 186, 106537. doi:10.1016/j.resconrec.2022.106537
Golmohammadi, M. H., Safavi, H. R., Sandoval-Solis, S., and Fooladi, M. (2021). Improving performance criteria in the water resource systems based on fuzzy approach. Water Resour. Manag. 35 (2), 593–611. doi:10.1007/s11269-020-02739-6
Gong, Y., Li, J., and Li, Y. (2020). Spatiotemporal characteristics and driving mechanisms of arable land in the Beijing-Tianjin-Hebei region during 1990-2015. Socioecon. Plann Sci. 70, 100720. doi:10.1016/j.seps.2019.06.005
Hashimoto, T., Stedinger, J. R., and Loucks, D. P. (1982). Reliability, resiliency, and vulnerability criteria for water resource system performance evaluation. Water Resour. Res. 18, 14–20. doi:10.1029/wr018i001p00014
Hoekstra, A., and Hung, P. Q. (2002). Virtual water trade: a quantification of virtual water flows between nations in relation to international crop trade. Water Sci. Technol. 49, 203–209. doi:10.2166/wst.2004.0456
Hoekstra, A. Y., Mekonnen, M. M., Chapagain, A. K., Mathews, R. E., and Richter, B. D. (2012). Global monthly water scarcity: blue water footprints versus blue water availability. PLoS One 7 (2), e32688. doi:10.1371/journal.pone.0032688
Hogeboom, R. J. (2020). The water footprint concept and water's grand environmental challenges. One Earth 2 (3), 218–222. doi:10.1016/j.oneear.2020.02.010
Huang, H., La, Z., Wang, R., Shang, K., Li, M., Yang, X., et al. (2021). Agricultural infrastructure: the forgotten key driving force of crop-related water footprints and virtual water flows in China. J. Clean. Prod. 309, 127455. doi:10.1016/j.jclepro.2021.127455
Huang, J., Zhang, H., Tong, W., and Chen, F. (2012). The impact of local crops consumption on the water resources in Beijing. J. Clean. Prod. 21 (1), 45–50. doi:10.1016/j.jclepro.2011.09.014
Jin, C., Huang, K., Yu, Y., and Zhang, Y. (2016). Analysis of influencing factors of water footprint based on the STIRPAT model: evidence from the Beijing agricultural sector. Water (Basel) 8 (11), 513. doi:10.3390/w8110513
Liu, D., and Xiao, B. (2018). Can China achieve its carbon emission peaking? A scenario analysis based on STIRPAT and system dynamics model. Ecol. Indic. 93, 647–657. doi:10.1016/j.ecolind.2018.05.049
Liu, L., Hu, X., Zhan, Y., Sun, Z., and Zhang, Q. (2023). China's dietary changes would increase agricultural blue and green water footprint. Sci. Total Environ. 903, 165763. doi:10.1016/j.scitotenv.2023.165763
Liu, W., Chen, W., Feng, Q., and Deo, R. C. (2019). Situations, challenges and strategies of urban water management in Beijing under rapid urbanization effect. Water Sci. Technol. Water Supply 19 (1), 115–127. doi:10.2166/ws.2018.057
Lohwasser, J., Schaffer, A., and Brieden, A. (2020). The role of demographic and economic drivers on the environment in traditional and standardized STIRPAT analysis. Ecol. Econ. 178, 106811. doi:10.1016/j.ecolecon.2020.106811
Lovarelli, D., Bacenetti, J., and Fiala, M. (2016). Water Footprint of crop productions: a review. Sci. Total Environ. 548, 236–251. doi:10.1016/j.scitotenv.2016.01.022
Ma, X., and Jiao, S. (2023). Comprehensive analysis of water resources from the perspective of water footprint and water ecological footprint: a case study from Anyang City, China. Environ. Sci. Pollut. Res. Int. 30 (1), 2086–2102. doi:10.1007/s11356-022-22139-0
Mekonnen, M. M., and Hoekstra, A. Y. (2014). Water footprint benchmarks for crop production: a first global assessment. Ecol. Indic. 46, 214–223. doi:10.1016/j.ecolind.2014.06.013
Mialyk, O., Booij, M. J., Schyns, J. F., and Berger, M. (2024a). Evolution of global water footprints of crop production in 1990-2019. Environ. Res. Lett. 19 (11), 114015. doi:10.1088/1748-9326/ad78e9
Mialyk, O., Schyns, J. F., Booij, M. J., Su, H., Hogeboom, R. J., and Berger, M. (2024b). Water footprints and crop water use of 175 individual crops for 1990-2019 simulated with a global crop model. Sci. Data 11 (1), 206. doi:10.1038/s41597-024-03051-3
Qin, H. (2021). Numerical groundwater modeling and scenario analysis of Beijing plain: implications for sustainable groundwater management in a region with intense groundwater depletion. Environ. Earth Sci. 80 (15), 499. doi:10.1007/s12665-021-09795-0
Rodriguez, C. I., Arrien, M. M., Silva, S. H., and Aldaya, M. M. (2024). Global relevance of Argentinean rainfed crops in a climatic variability context: a water footprint assessment in Buenos Aires province. Sci. Total Environ. 927, 171946. doi:10.1016/j.scitotenv.2024.171946
Sediqi, M. N., and Komori, D. (2024). Assessing water resource sustainability in the kabul River Basin: a standardized runoff index and reliability, resilience, and vulnerability framework approach. Sustainability 16 (1), 246. doi:10.3390/su16010246
Shu, R., Cao, X., and Wu, M. (2021). Clarifying regional water scarcity in agriculture based on the theory of blue, green and grey water footprints. Water Resour. Manag. 35 (3), 1101–1118. doi:10.1007/s11269-021-02779-6
Shuang-shuan, L. (2015). The characteristics of drought-flood variation and its influence factors in Beijing during 1960-2013. J. Nat. Resour. doi:10.11849/zrzyxb.2015.06.006
Sturla, G., Ciulla, L., and Rocchi, B. (2024). Estimating the global production and consumption-based water footprint of a regional economy. Sustain Prod. Consum. 44, 208–220. doi:10.1016/j.spc.2023.11.023
Wang, L., Zhang, Y., Jia, L., Yang, G., Yao, Y., and Wang, W. (2019). Spatial characteristics and implications of grey water footprint of major food crops in China. Water (Basel) 11 (2), 220. doi:10.3390/w11020220
Wang, Q., and Ge, S. (2020). Carbon footprint and water footprint in China: similarities and differences. Sci. Total Environ. 739, 140070. doi:10.1016/j.scitotenv.2020.140070
Wang, Q., Zheng, G., Li, J., Huang, K., Yu, Y., and Qu, S. (2023a). Imbalance in the city-level crop water footprint aggravated regional inequality in China. Sci. Total Environ. 867, 161577. doi:10.1016/j.scitotenv.2023.161577
Wang, Y., Chen, Y., Duan, W., and Jiao, L. (2022). Evaluation of sustainable water resource use in the tarim River Basin based on water footprint. Sustainability 14 (17), 10611. doi:10.3390/su141710611
Wang, Z., Xu, D., Peng, D., and Zhang, X. (2023b). Future climate change would intensify the water resources supply-demand pressure of afforestation in inner Mongolia, China. J. Clean. Prod. 407, 137145. doi:10.1016/j.jclepro.2023.137145
Xie, P., La, Z., Yang, X., Huang, H., Gao, X., and Wu, P. (2020). Spatial-temporal variations in blue and green water resources, water footprints and water scarcities in a large river basin: a case for the Yellow River basin. J. Hydrol. (Amst) 590, 125222. doi:10.1016/j.jhydrol.2020.125222
Xu, C., Liu, Y., and Fu, T. (2022). Spatial-temporal evolution and driving factors of grey water footprint efficiency in the Yangtze River Economic Belt. Sci. Total Environ. 844, 156930. doi:10.1016/j.scitotenv.2022.156930
Xu, Y., Huang, K., Yu, Y., and Wang, X. (2015). Changes in water footprint of crop production in Beijing from 1978 to 2012: a logarithmic mean Divisia index decomposition analysis. J. Clean. Prod. 87, 180–187. doi:10.1016/j.jclepro.2014.08.103
Xu, Z., Chen, X., Wu, S. R., Gong, M., Du, Y., Wang, J., et al. (2019). Spatial-temporal assessment of water footprint, water scarcity and crop water productivity in a major crop production region. J. Clean. Prod. 224, 375–383. doi:10.1016/j.jclepro.2019.03.108
York, R., Rosa, E. A., and Dietz, T. (2003). STIRPAT, IPAT and ImPACT: analytic tools for unpacking the driving forces of environmental impacts. Ecol. Econ. 46 (3), 351–365. doi:10.1016/S0921-8009(03)00188-5
Zeng, Y., Liu, D., Guo, S., Xiong, L., Liu, P., Chen, J., et al. (2024). Assessment of the impacts of water resources allocation on the reliability, resilience and vulnerability of the water-energy-food-society (WEFS) nexus system. Agric. Water Manag. 295, 108780. doi:10.1016/j.agwat.2024.108780
Zhang, B. (2017). The research on the optimization of water usage structure of China. Hangzhou: Zhejiang University. (in Chinese).
Keywords: agricultural water footprint, agricultural water resource assessment, water stress index, reliability-resilience-vulnerability indices, STIRPAT model
Citation: Wei R, Wang X, Hao G, Cai J and Liao Z (2025) An integrated framework for assessing water resource pressure and sustainability based on the total-element agricultural water footprints. Front. Earth Sci. 13:1527786. doi: 10.3389/feart.2025.1527786
Received: 13 November 2024; Accepted: 27 January 2025;
Published: 20 February 2025.
Edited by:
Celso Santos, Federal University of Paraíba, BrazilReviewed by:
Hang Wan, Southern Marine Science and Engineering Guangdong Laboratory (Guangzhou), ChinaCopyright © 2025 Wei, Wang, Hao, Cai and Liao. This is an open-access article distributed under the terms of the Creative Commons Attribution License (CC BY). The use, distribution or reproduction in other forums is permitted, provided the original author(s) and the copyright owner(s) are credited and that the original publication in this journal is cited, in accordance with accepted academic practice. No use, distribution or reproduction is permitted which does not comply with these terms.
*Correspondence: Xuan Wang, d2FuZ3hAYm51LmVkdS5jbg==
Disclaimer: All claims expressed in this article are solely those of the authors and do not necessarily represent those of their affiliated organizations, or those of the publisher, the editors and the reviewers. Any product that may be evaluated in this article or claim that may be made by its manufacturer is not guaranteed or endorsed by the publisher.
Research integrity at Frontiers
Learn more about the work of our research integrity team to safeguard the quality of each article we publish.