 Jiejun Zhu
 Jian Peng1,2,3
 Shuangquan Chen
95% of researchers rate our articles as excellent or good
Learn more about the work of our research integrity team to safeguard the quality of each article we publish.
Find out more
ORIGINAL RESEARCH article
Front. Earth Sci. , 04 March 2025
Sec. Solid Earth Geophysics
Volume 13 - 2025 | https://doi.org/10.3389/feart.2025.1524301
This article is part of the Research Topic Experimental and Numerical Simulations of Rock Physics View all 17 articles
In the Chaixi region of the Qaidam Basin’s Qigequan tectonic zone, the compact sandstones are characterized by their low porosity and permeability, featuring intricate pore-throat formations, varied lithologies, assorted clay minerals, and pronounced unevenness among the reservoirs. There’s a weak link between reservoir metrics and logging reactions, making it challenging to assess these reservoir parameters. The microscopic pore structure of the reservoir can be illustrated through both the nuclear magnetic resonance relaxation time distribution and the capillary pressure curve. By using fractal dimensions to classify the reservoir, a conversion model between the transverse relaxation time in nuclear magnetic resonance logging and the capillary pressure in the mercury injection curve is established, enabling the conversion of pseudo-capillary pressure curves. Key elements of the pseudo-capillary pressure curve, specifically discharge and drive pressure, median pressure, and sorting coefficient, were analyzed and integrated with the generalized regression neural network for accurate reservoir type classification. An efficient categorization of reservoir types was accomplished by isolating three key elements from the pseudo capillary pressure curve—displacement pressure, median pressure, and sorting coefficient—and integrating them with the generalized regression neural network. Utilizing a rock physics framework, a correlation between transverse relaxation time of nuclear magnetic resonance and relative permeability conversion was formulated to accurately forecast the rate of water generation in the reservoirs of the western Qaidam Basin. The anticipated outcomes demonstrated a strong link with the real rate of water production. This technique presents an innovative method to forecast the comparative permeability of oil-water stages and the rates of water generation in compact sandstone reservoirs.
Assessing the structure of pores plays a crucial role in evaluating reservoirs. The dimensions and arrangement of pores and throats play crucial roles in determining the reservoir’s capacity for storage and its permeability (Lai et al., 2018). Widely adopted techniques for analyzing the architecture of rock pores encompass techniques like thin-section identification, mercury compression, nuclear magnetic resonance (NMR), and scanning electron microscopy (SEM). However, it is often difficult to systematically characterise the complex pore space information within the rock by a single pore structure characteristic parameter (Tian et al., 2018).
During the initial years of the 1990s, core NMR techniques were utilized in petrophysical experiments, revealing that both the T2 distribution and capillary pressure curve are indicative of the distribution of the pore size (Wang et al., 2018; Dong et al., 2023). Numerous researchers, aiming to perpetually assess reservoir characteristics and formation depth using logging curves, employed NMR for inverting capillary pressure curves (Xie et al., 2021; Jin et al., 2024), thereby determining the correlation between these pressure points and the period of transverse relaxation. Utilizing various transformation techniques, one can derive the pseudo-capillary pressure curve (Xiao et al., 2016; Zhang et al., 2020; Gray et al., 2021), and a power function correlation exists between the relaxation time at T2 and the size of pores in throat radius, altering across different sizes of pores (Guo et al., 2019; Zhou et al., 2022; Li et al., 2023). Oil and water phases’ relative permeability varies dynamically with alterations in pore configuration and water saturation levels, with the relative permeability curve mirroring the fundamental flow law of oil and water phases in oil and water seepage (Su et al., 2020; Ji et al., 2022; Pei et al., 2022; Moodie and McPherson, 2024).
Many researchers have devoted themselves to exploring the application of different methods in reservoir water yield prediction, including the determination of theoretical water yield curves through seepage theory and the correction of relative permeability curves through nonlinear optimisation algorithms, which are analysed based on production and core experimental data (Peng, 2020; Wu et al., 2024). A relative permeability calculation model considering the non-Darcy effect is established, and the effects of different non-Darcy coefficients on the phase permeability curve and reservoir production are analysed by phase permeability experiments and numerical simulations. There are also studies proposing the use of neural networks to construct a prediction model, as well as the development of a calculation model based on nuclear magnetic resonance and conventional logging data, etc., in order to better carry out the calculation and quantitative evaluation of water production rate (Azim and Aljehani, 2022; Mo et al., 2024). In addition, some researchers not only analysed the influence of phase permeability experiments and numerical simulations, but also introduced new parameters such as bound water saturation and tortuosity, aiming to improve the accuracy of water production rate prediction (Parvazdavani et al., 2022; Yi et al., 2024).
This research initially identifies the link between the NMR T2 spectrum and capillary pressure curve in the study area’s uneven strata, derived from petrophysical studies, and categorizes this connection with the capillary pressure curve, subsequently integrating it with the GRNN neural network for effective reservoir classification. In the case of various reservoir types, NMR T2 to relative permeability graphs were developed, leading to the computation of the reservoir’s water production rate, which closely aligns with the real production figures.
Situated in the Qinghai-Tibetan Plateau’s northeastern region, the Qaidam Basin, a diamond-shaped desert basin between mountains, ranks among China’s top ten inland sedimentary basins. It spans approximately 850 km from east to west and 150–300 km from north to south, spanning roughly 121,000 km2. Its elevation ranges between 2,600 and 3,700 m, with elevated areas in the west and low in the east, and wide in the west and narrow in the east (Figure 1). Currently, the basin comprises five main tectonic segments and 25 auxiliary tectonic segments; it features 13 stratigraphic formations spanning from the Paleozoic to the Cenozoic, with confirmed oil and gas reserves scattered across the Jurassic, Paleocene, Neocene, and Quaternary periods (Li X. et al., 2024).
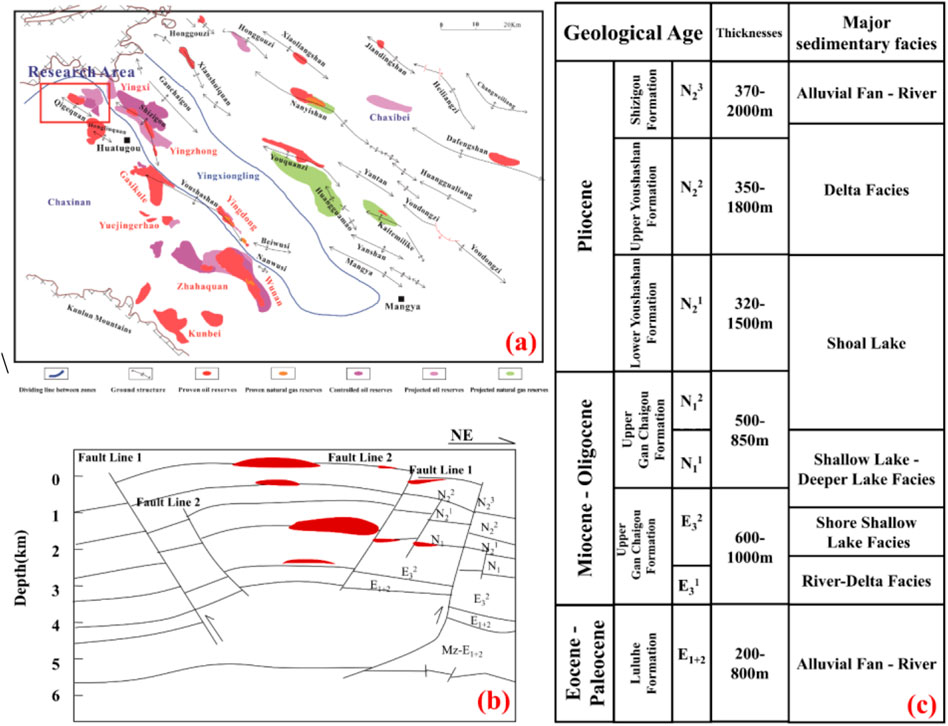
Figure 1. Allocation of key oil and gas reserves and the positioning of the Qigequan Oilfield in the Qaidam Basin’s western region (A), along with the hydrocarbon reservoir’s profile (B) and the stratigraphic lithological profile (C).
In the western region of Qaidam, the structure features a total backslope in its superficial section and a fractured nose in its deeper area, with the Qigequan Oilfield forming multiple layers of oil layers ranging from shallow to deep at the backslope’s heart. Presently, evidence supports the existence of seven distinct stratigraphic layers, specifically the Shishigou Formation (N32 uncapped), the Upper Youshashanshan Formation (N22), the Lower Youshashanshan Formation (N12·), the Shangchaigou Formation (N1·), the upper segment of the Lower Ganzhaigou (E23·), the lower segment of the Lower Ganzhaigou (E13·), and the Luluehe Formation (E1+2·). The tight sandstone reservoirs in Chaixi area are mainly developed in lacustrine sedimentary environments. The upper section of the Shanqiaogou Formation (E2³) is a lacustrine basal fine-grained detrital structure, with sediments mainly consisting of fine-grained mudstone and sandstone. The depositional depth ranges from 300 to 1,000 m, with gray sandstone and conglomerate dominating in the basin margins and brownish red mudstone predominating in the northwest section, concentrated in the sandstone-gravel and muddy sedimentary environments near the lake edge and in the center of the lake, showing obvious heterogeneity characteristics (Hao et al., 2020; Wenjie and Ye, 2024).
The examination of the core’s physical data reveals a wide range of physical characteristics in the Lower Ganchaigou Formation’s reservoir from the Oligocene, with the porosity of the eight core samples varying between 3.65% and 7.96%, averaging at 5.77%. Permeability ranges from 0.0007 to 0.47 × 10⁻³ μm2, with an average of approximately 1 × 10⁻³ μm2, categorized under low porosity and ultra-low permeability (Figure 2).
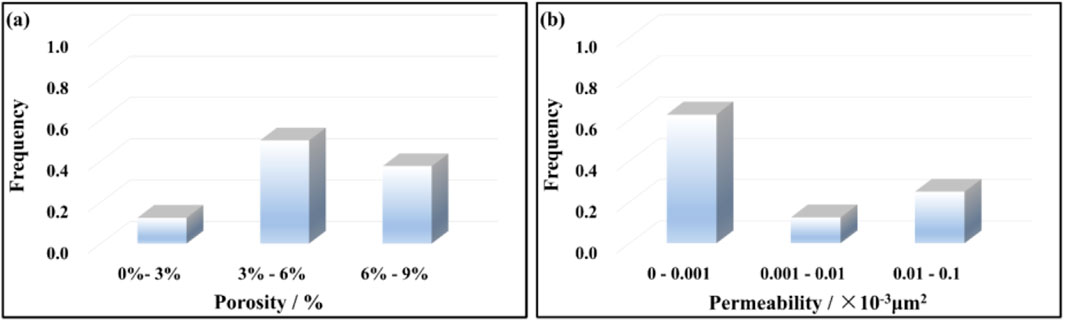
Figure 2. Histogram of porosity analysis (A), histogram of permeability analysis (B).
The rock chip composition of the samples is quartz, clasts, clay minerals and other colluvium (Figure 3). By analyzing the thickness of the casts, feldspar is clearly more abundant than quartz in content, and the colluvium is dominated by carbonates (calcite, dolomite, aragonite and rhodochrosite).
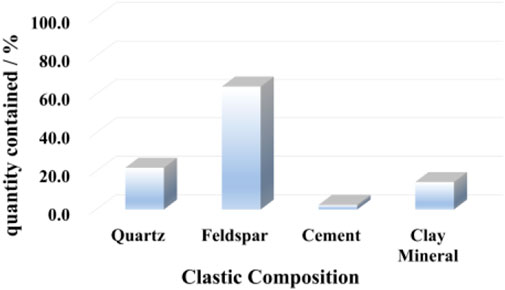
Figure 3. Statistical diagram of rock chip composition analysis.
Nuclear magnetic resonance (NMR) denotes the interplay between atomic nuclei and a magnetic field (Wei et al., 2019). The three main types of NMR relaxation are surface relaxation, fluid volume relaxation, and diffusion relaxation in a gradient field. Consequently, the complete relaxation of NMR in porous materials is characterized by this mathematical equation:
Where:
In single-phase pore fluid, the water’s volume relaxation time (2-3 s) is much longer than T2, making
Relaxation at the surface of rock particles happens due to energy reduction, a result of ongoing interactions between fluid molecules in the pore space and the surface of the particles. Surface relaxation depends on the rock’s relaxation intensity and surface area. Bigger pores exhibit lower S/V ratios, reduced particle collisions, and extended relaxation periods; conversely, smaller pores display higher S/V ratios and briefer relaxation durations. Consequently, the T2 spectrum observed in saturated water rocks essentially mirrors the interplay between the fluid within the pores and the surface of these pores. Equation Simplification of Equation 1 is possible as:
The S/V of spherical pores is 3/r, and the S/V of tubular throats is 2/r, r being the radius of the ball. Therefore, Equation 2 can be expressed in the form of Equation 3:
Where: F is the shape factor. The distribution of NMR T2 spectra reflects the distribution of rock pore sizes, with large pore sizes corresponding to large lateral relaxation times and small pore sizes corresponding to smaller lateral relaxation times.
The NMR T2 spectra of the core samples drilled from the reservoir of the Lower Paleocene Ganchaigou Formation were measured (Figure 4). The main peak (the peak with the largest amplitude) of the T2 spectrum of the core samples with Class I pore structure is located between 10 and 100 ms, and the amplitude of the main peak is lower than that of Class II, which indicates that there are more macropores; the main peak of the T2 spectrum of the core samples with Class II pore structure is located between 0 and 10 ms, which indicates that there are more micropores.
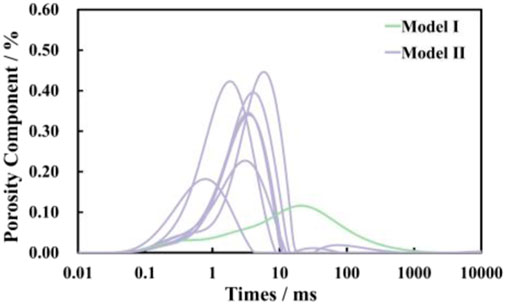
Figure 4. NMR T2 distribution of core samples from Qigequan Oilfield.
The capillary pressure curve delineates the correlation between capillary pressure and pore size in rock pores, derived from experimental data under specific circumstances. The term “capillary pressure” denotes the force exerted in a capillary tube by capillary movements, linked to aspects like the size of the pores and their ability to wet. The contour and features of the capillary pressure curve are indicative of the rock’s pore configuration and moisture-absorbing attributes, crucial for evaluating the reservoir’s water and fluid retention abilities (Zhao et al., 2021).
The capillary pressure curve in these experiments is primarily examined using the mercuric pressure technique. Given the relative stability of mercury’s surface tension and wetting contact angle, the capillary pressure curve, as recorded by the mercuric pressure meter, is frequently employed to adjust the size and distribution of pores. Under the presumption that the pore structure consists of cylindrical capillary clusters varying in thickness, Equation 4 illustrates the correlation between capillary pressure and the size of the pores.
Where: Pc is capillary pressure (absolute pressure), MPa; σ is surface tension, N/m; θ is wetting contact angle,
Under laboratory conditions,
The capillary pressure curve is converted to an orifice throat size and distribution curve according to Equation 5.
A graph depicting the mercury injection curve for the core sample was created. Based on the curve’s morphological features and mercury injection’s experimental variables, the core’s pore structures can be categorized into two groups (Figure 5). The parameter characteristics of the two types of reservoirs are shown in Table 1. A lesser drainage pressure results in a greater pore diameter. An increase in displacement pressure results in a reduction of the pore diameter. The characteristics of Class I pores are favorable, with the mercury entry curve being slanted, minimal drainage pressure, clear platform intervals, minimal drainage and median pressure, a larger pore throat ratio, the capillary pressure curve’s gentler section being parallel, the gentler section lower, and a well-maintained reservoir. Class II rock samples exhibit a less favorable pore structure compared to class I rock samples. When subjected to a specific increase in external pressure, the saturation point of pore displacement in high-pressure rocks is minimal, the average pressure is high, and the curve for capillary pressure is sharp. This indicates subpar organization of the reservoir, uneven fracture patterns, and a minor distortion in its coarseness.
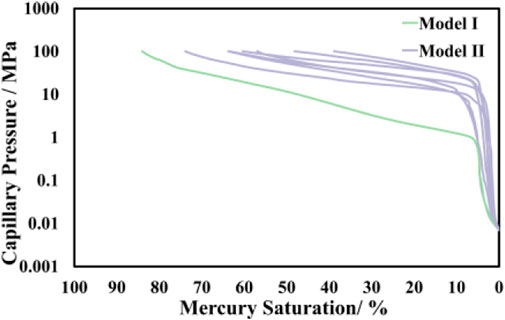
Figure 5. Capillary pressure curves of core samples from Qigequan Oilfield.
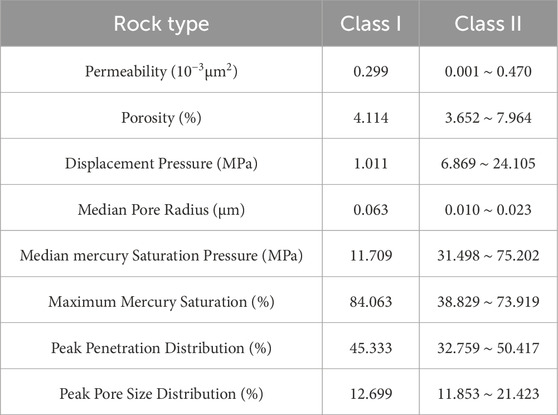
Table 1. Parameters of mercury compression for different reservoir types.
Assuming that the reservoir pore size distribution obeys the fractal theory (Cheng et al., 2024), there are N pores with pore sizes larger than r to satisfy the power law relationship as follows:
where a is the constant of proportionality, D is the fractal dimension, N is the number of pores, rmax is the maximum pore radius in the reservoir, and P(r) is the pore size distribution density function.
where
The cumulative pore volume for pores with sizes smaller than r is obtained by integrating P(r) over the pore volume formula, yielding:
Therefore, the total pore volume is calculated by setting r = rmax:
By taking the ratio of V (<r) to Vs, the cumulative pore volume fraction Sv is expressed. Assuming rmin << rmax, this simplifies to:
The above equation is called the fractal geometry equation for reservoir pore size distribution.
Since: T2 is proportional to the pore size r, therefore:
where Sv represents the proportion of the overall pore volume represented by the aggregate volume of pores exhibiting transverse relaxation times shorter than T2. At this juncture, a rough fractal geometry equation for the NMR T2 spectrum is derived.
According to the derivation of Equations 6–11, Taking logarithms on both sides has:
Derived from Equation 12 A linear correlation exists between saturation and T2 distribution time within the double logarithmic coordinate framework, suggesting a fractal nature of T2 distribution time.
The T2 cutoff value (T2_cutoff) is the corresponding T2 value when the cumulative saturation is maximum and tends to be stable at different T2 times after centrifugation. It is the dividing line between movable fluid and bound fluid. Movable fluid generally exists in large pores and is easy to be dislodged under a certain external pressure. Some bound fluids remain in small pores and cannot be dislodged. For compact sandstone deposits characterized by minimal porosity and permeability, the traditional T2_cutoff value for logging data processing (33 ms) has become inapplicable (Zhang et al., 2023).
Upon approximately setting 10 ms as the limit, significant alterations in the core samples’ slopes were observed on both sides of T2 = 10 ms (Figure 6). Consequently, the test samples were confined within the T2 threshold value, and the fractal dimension Ds for the percolating pores were determined for the segment of T2 ≥ T2_cutoff value, while the fractal dimension Da for the absorbed pores was computed for the segment of T2 < T2_cutoff (Figure 7). The results of the calculation of the fractal dimension of the sample are shown in Table 2.
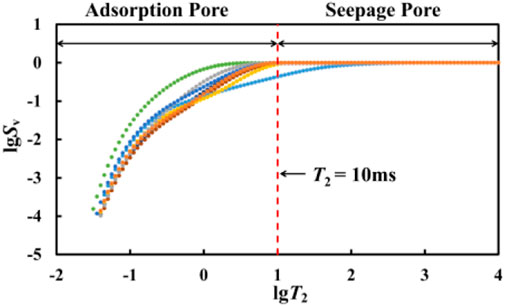
Figure 6. Relationship between T2 and Sv of rock samples from the reservoir of the Lower Paleocene Lower Ganchigou Formation.
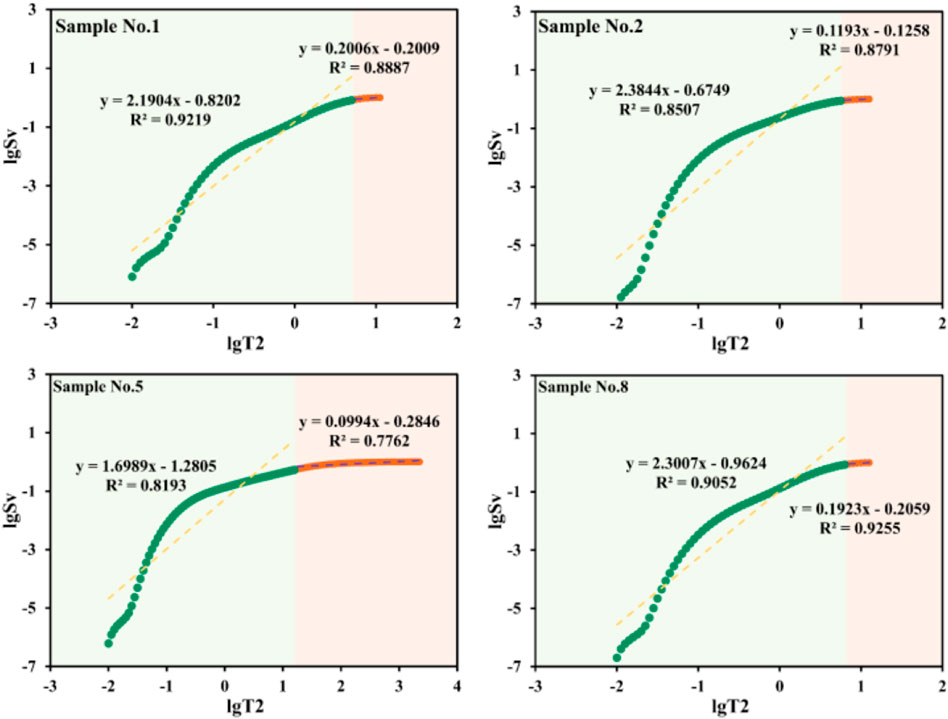
Figure 7. Calculation of the dimensionality of the nuclear magnetic fractal.
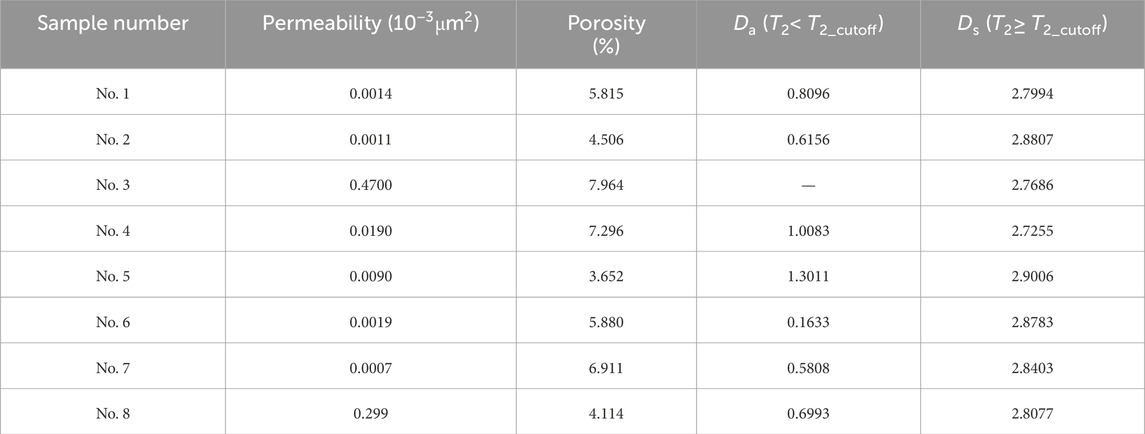
Table 2. Results of NMR fractal dimension calculation for rock samples.
Currently, the study of pore structure is mostly applied to core laboratory analysis, which mainly includes core CT, mercury pressure experiment and NMR experiment. However, the laboratory tests are expensive, the period is long, and the test results cannot represent the actual situation of the whole target stratigraphic section. Therefore, it is very necessary to use logging data to analyze the micro pore structure of the reservoir.
The time distribution spectrum of NMR T2, derived from aligning with NMR logging data, more accurately represents the size of rock pores. Currently, the lab predominantly utilizes compressed mercury data for assessing rock pore configurations, a method that fails to consistently represent the entire well section’s pore structure and is subject to certain constraints. Nonetheless, NMR data is capable of capturing the long-term details of the formation throughout the entire well section, and the T2 distribution of NMR is closely linked to the pore structure and maintains strong continuity, aiding in the rapid identification and classification of reservoirs in the continuous depth. Compared to measurements of capillary pressure profiles, NMR assessments are rapid and non-invasive. The methods for converting pseudo-capillary pressure curves using T2 distribution are: linear and power function methods (Li S. J. et al., 2024).
It was found that the capillary pressure Pc has a power exponential relationship with the transverse relaxation time T2 (Equation 13):
where m and n are transformation parameters and are dimensionless.
The case where the T2 spectrum is bimodal requires a segmented power function to construct the pseudo-capillary pressure curve (Equations 14, 15), where:
At the large aperture
At the small aperture
where: Pc1, Pc2 is the capillary pressure, MPa; T2 is the distribution time of the NMR T2 spectrum, ms; m1, m2, n1, n2 are the pending conversion parameters.
The core samples were subjected to NMR to pseudo-hairpipe pressure using the above equation, and the fit is shown (Figure 8).
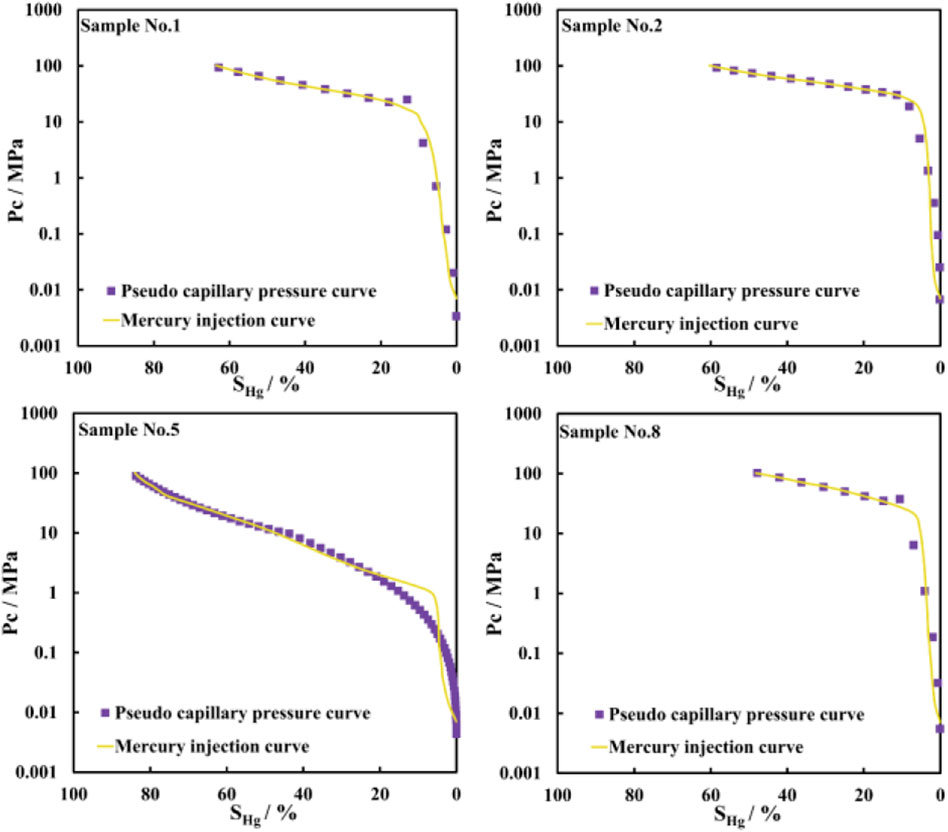
Figure 8. Nuclear magnetic conversion pseudo-capillary pressure curve.
Based on the categorization of the pressure mercury curve and the outcomes of the NMR fractal dimension analysis, along with the impact of the samples in aligning with the capillary pressure curve, two distinct conversion models have been formulated (Equations 16–19):
Model I: when Ds ≥ 2.9
Model II: When Ds < 2.9
Utilizing the segmented power function technique, the relationship between lateral relaxation time T2 and capillary pressure Pc in the piezomercury curve is determined. This model, tailored to various reservoirs, transforms the NMR T2 spectra of the entire well section into depth-dependent pseudo-capillary pressure curves. The characteristics of these pseudo-capillary pressure curves serve to qualitatively categorize the reservoirs directly. Utilizing the previously mentioned technique, a machine learning algorithm has been developed to handle the logging data for the entire well section.
The concept of the General Regression Neural Network (GRNN) was introduced by Dr. D. F. Specht. The foundation lies in the Radial Basis Function (RBF) network framework, lacking a distinct structure, and relies on the probability density function (PDF) linking independent and dependent variables in the sample data, rather than the intrinsic equation format. The Probability Density Function (PDF) is used to compare the independent and dependent variables in the sample data, rather than using the intrinsic equation format. Estimation of the function occurs via a Parzen window, employing the sample data as initial conditions, conducting nonparametric estimations, and determining the regression value of the dependent variable against the independent variable. The learning speed is fast, the nonlinear approximation is good, and it has strong robustness and fault tolerance. It also achieves good classification results with a small number of samples (Al-Dousari et al., 2022).
Pseudo-capillary pressures at continuous depths are obtained using T2-Pc conversion models for different reservoir types. The spectral peaks are forward and the double peaks are not obvious, the T2 distribution time is small, and the high discharge pressure corresponds to microporosity. As the T2 time increases, the spectral peaks are backward and the double peaks are obvious, and the small discharge-driven pressure corresponds to large pores.
For the training samples, the trio of capillary pressure curve parameters (Discharge Drive pressure, Median Pressure, and Sorting Coefficient) were chosen, capable of categorizing the type of reservoir throughout the entire well section (Figure 9).
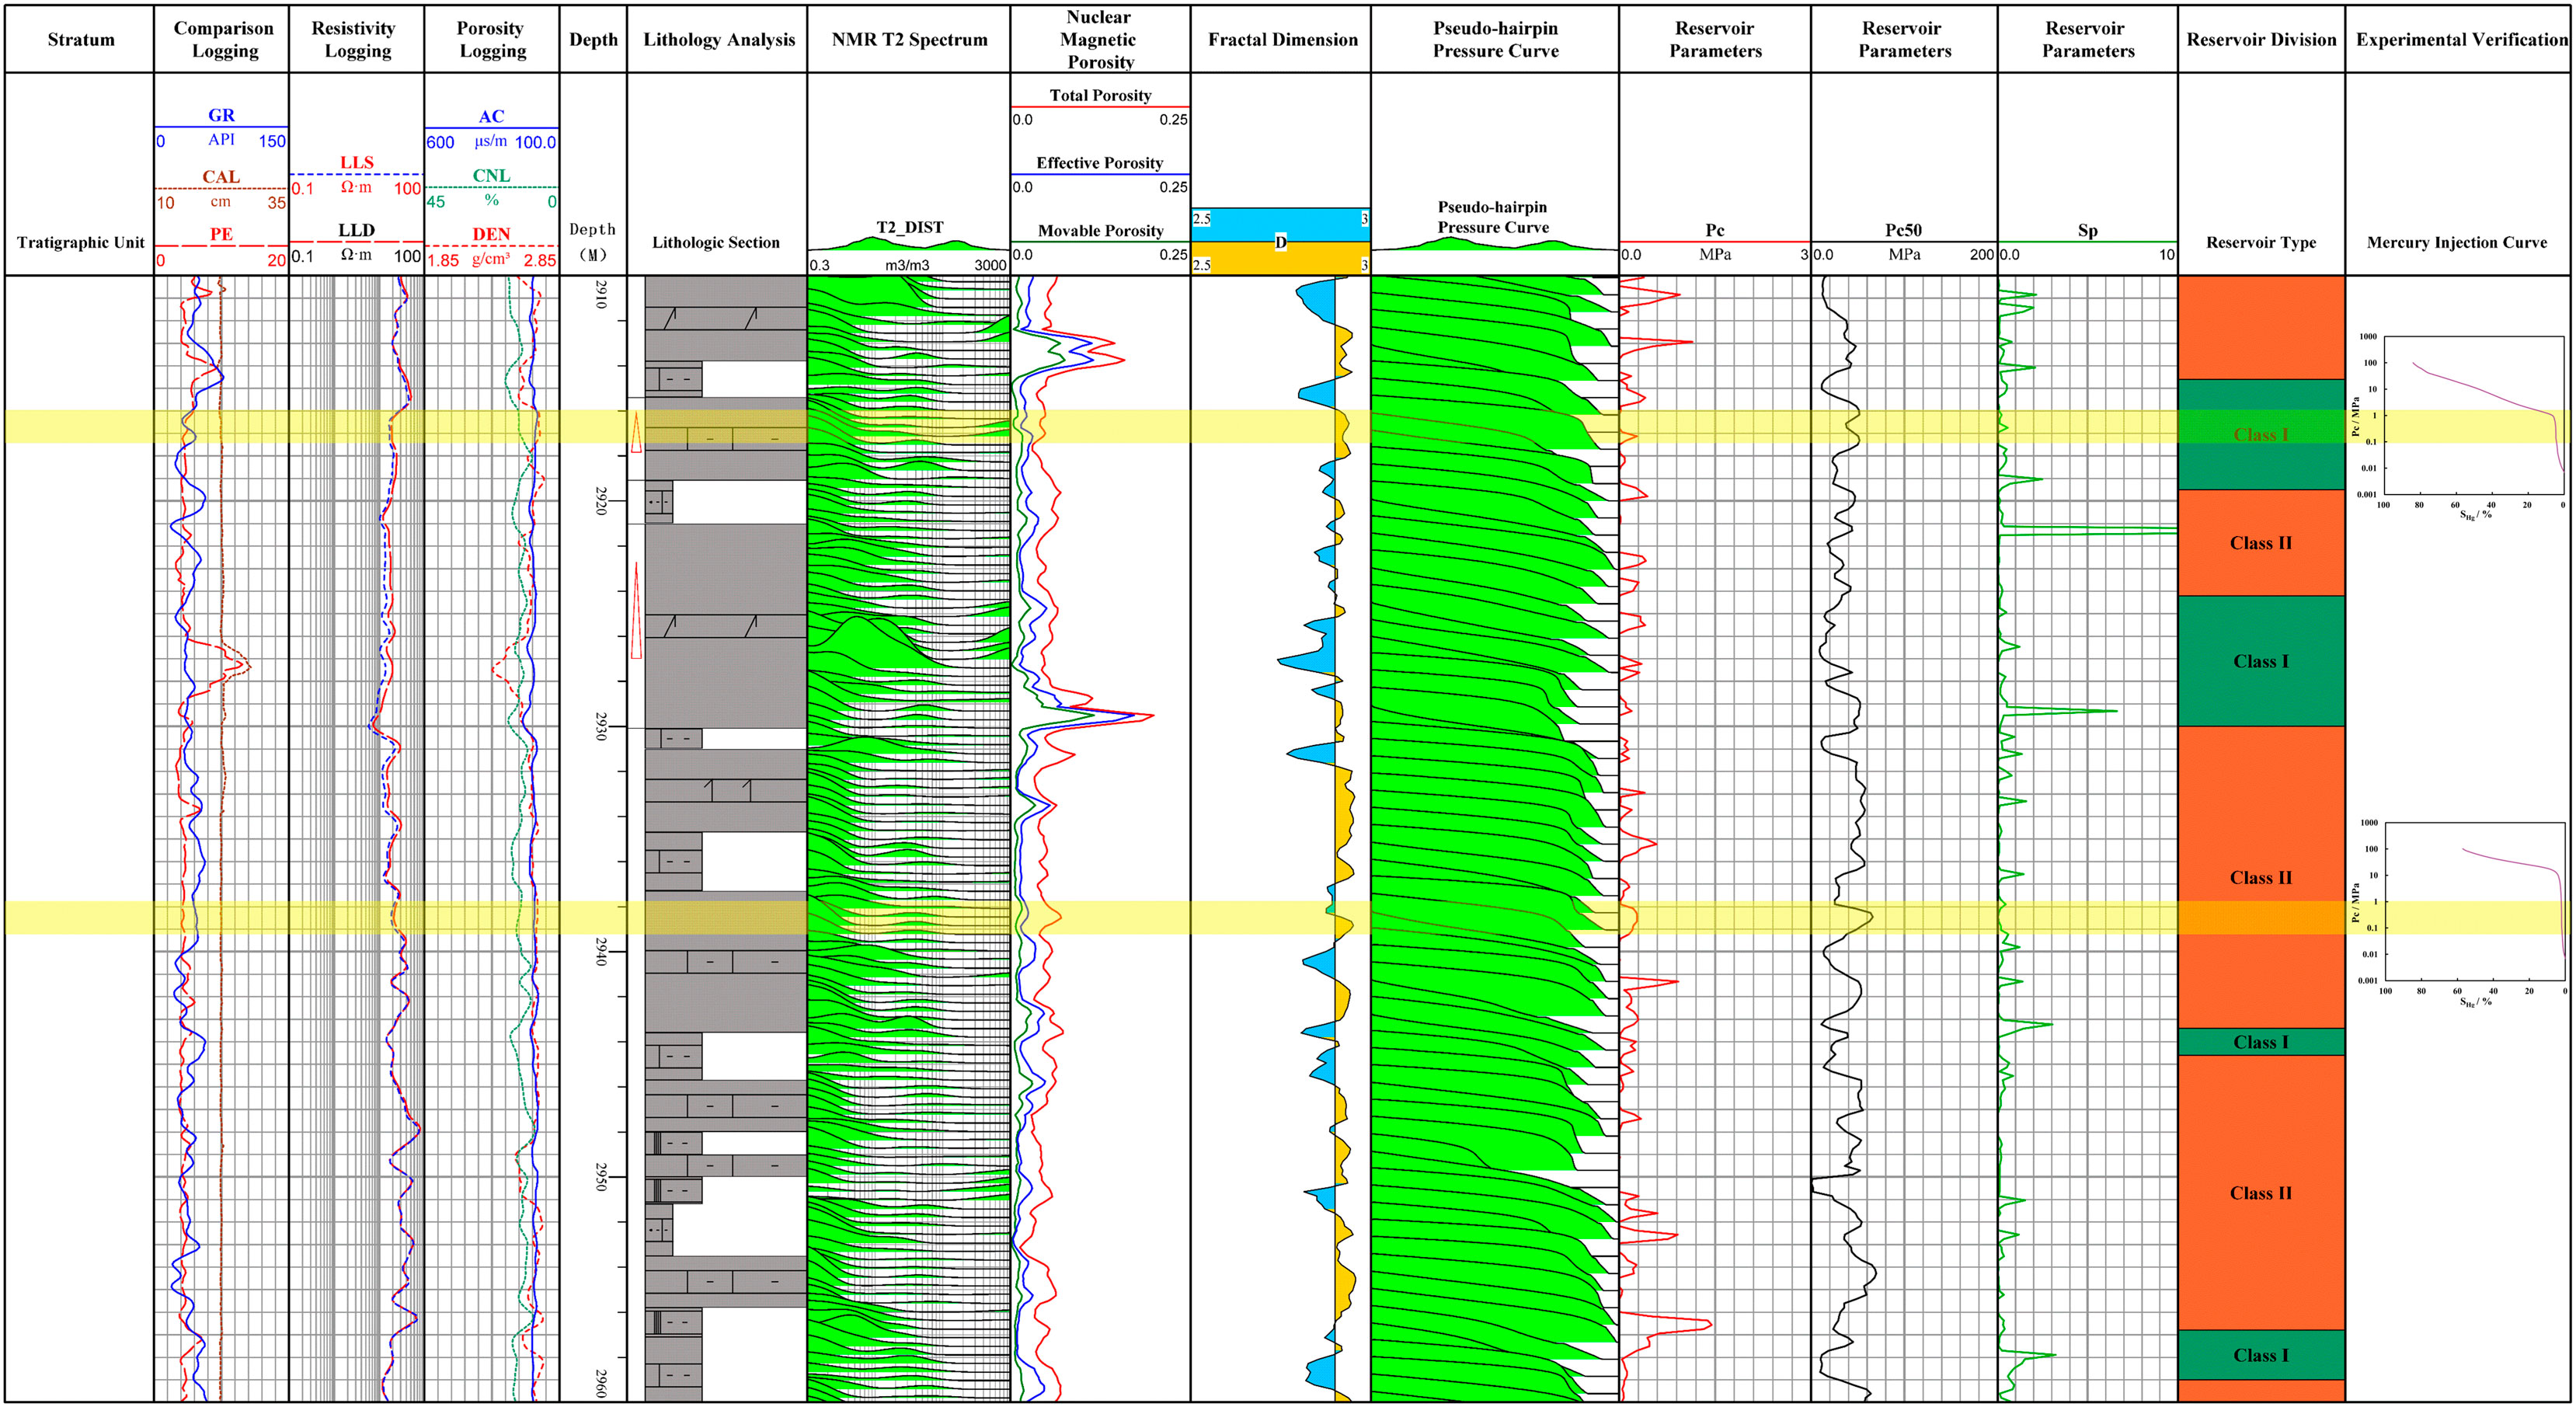
Figure 9. Effectiveness of NMR pseudo-capillary pressure in predicting reservoir category.
Figure 9 shows the classification results of the 2,910 ∼ 2,960 m well section, and combined with standard logging data for comprehensive analysis. According to the NMR T2 spectrum and the characteristics of the proposed capillary pressure curve, two different reservoir sections, 2,915 ∼ 2,917 m (Class i) and 2,937 ∼ 2,939 m (Class ii), are classified in this section.
The reservoir is located at 2,915 ∼ 2,917 m, which is a Class I reservoir with clear double peaks of NMR T2 inverse spectrum. This is typical of reservoirs with well-defined microporosity in which bound water dominates. In this profile, the middle part of the proposed capillary pressure curve is mostly parallel, and the pore size distribution is relatively uniform. The low replacement pressure, median pressure, and sorting coefficient indicate that the reservoir fluid flow resistance is low and the reservoir porosity is relatively uniform. These characteristics indicate that the reservoir has moderate to high permeability, which usually supports efficient hydrocarbon flow and makes it more favorable for production.
On the other hand, the forward NMR T2 spectrum of the Class II reservoir located at 2,937 ∼ 2,939 m has a less pronounced peak compared to that of the Class I reservoir, which may indicate a different distribution of pore sizes or a higher degree of presence of larger pores. The middle section of the pseudo-capillary pressure curve is basically parallel, but there is some distortion at the end. This indicates that the pore structure of this reservoir is more complex or non-homogeneous than that of class I reservoirs. The driving pressure, median pressure and sorting coefficient of this profile are higher than that of class I reservoir, indicating that the fluid flow resistance of this reservoir is greater, the pore structure is more non-homogeneous, the permeability is lower, and the fluid transportation is more difficult. This is characteristic of the reservoir and may require additional production enhancement or enhanced recovery techniques to optimize production. The results of this reservoir classification correspond to the classification of core samples, which demonstrates the feasibility of this method.
To further verify the effectiveness of the GRNN model in the reservoir type classification task, the model results were quantitatively analyzed using standard classification performance indicators, including accuracy (Accuracy), recall (Recall), and F1 score (F1-Score). In addition, the confusion matrix (Confusion Matrix) was used to visualize the classification effects of the model on different reservoir categories (Class I and Class II).
The classification performance of the GRNN model is shown in Table 3. On the Class I reservoir, the recall rate and F1 score are 91.5% and 92.4%, respectively, indicating that the model can accurately identify the Class I reservoir and has a good balance in classification results. On the Class II reservoir, the recall rate and F1 score are 88.7% and 87.5%, respectively, which are slightly lower than those of Class I, but still indicate that the model has good classification ability. The overall accuracy rate is 94.2%, indicating that the model has high accuracy in classifying the samples as a whole.

Table 3. Performance indicators of GRNN classification model.
Within dense sandstone regions, subpar relative permeability calculations result in imprecise water production rate estimations, prompting the creation of a T2-Kr conversion model to predict continuous strata’s water production rates.
The curve of relative permeability comprehensively mirrors the flow dynamics of oil and water phases. The rate of water production represents the proportion of water output to the overall liquid output when oil and water are combined.
The same reservoir has a constant viscosity ratio
In the area of dense sandstone, the relative permeability is poorly calculated, resulting in inaccurate calculation of water production rate. To address the challenge of interpreting logging due to the intricate nature of Qigequan Oilfield’s reservoir pores, the T2-Kr conversion model was developed for rock samples of various reservoir types (Guo et al., 2023; Wei et al., 2024), factoring in the intricacies of pore structures in dense sandstone reservoirs and the impact of meander curvature, to forecast the rate of water production in the continuous layer. According to Posenille’s law, the flow rate of fluid through a single capillary pore:
Let the pore volume of a single capillary tube be
Assuming that the number of capillaries that make up the rock is n, the total flow rate through the rock per unit cross sectional volume is:
Equation 23 can be obtained by combining Darcy's formula, which is used to calculate the absolute permeability:
Under the assumption of ongoing changes in the capillary radius, a correction factor is implemented to account for the discrepancy between the theoretical rock state and the actual rock (Equations 24, 25):
T2-Pc conversion model based on Bianhuiyuan’s derivation, as shown in Equation 26.
where T2c is the T2 cutoff corresponding to bound water, ms; c is an index related to pore structure, decimal.
Formula 27 is the calculation formula of oil phase relative permeability:
Substituting Equations 21, 22 into Equation 20 yields the water yield equation for the new T2-Pc conversion model.
A good linear relationship between the pore structure index c and lg (T2max/T2s) was found (Equation 28).
From Figures 10, 11 it can be shown that the predictions fit well with the experimentally measured results and the conversion model is feasible.
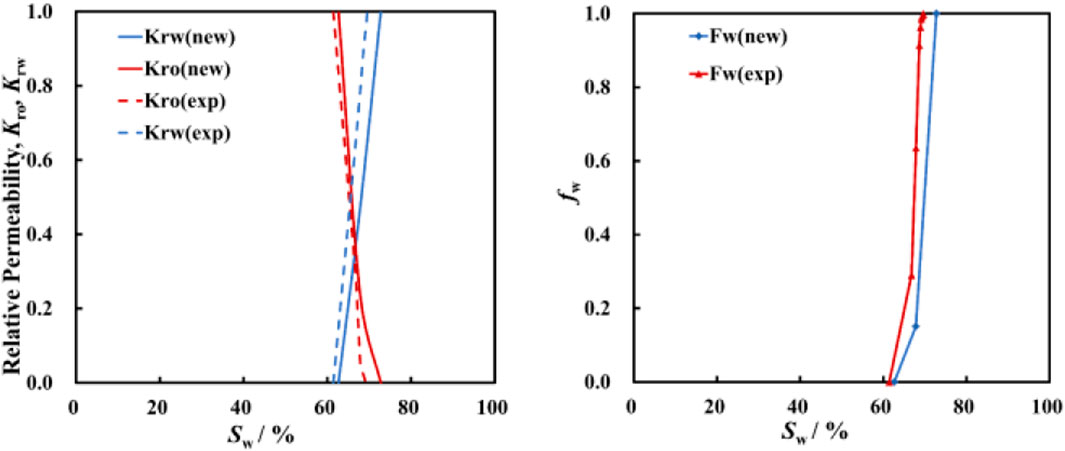
Figure 10. Comparison of calculated oil-water two-phase permeability and water yield curves of Class I rock samples with experimental analyses.
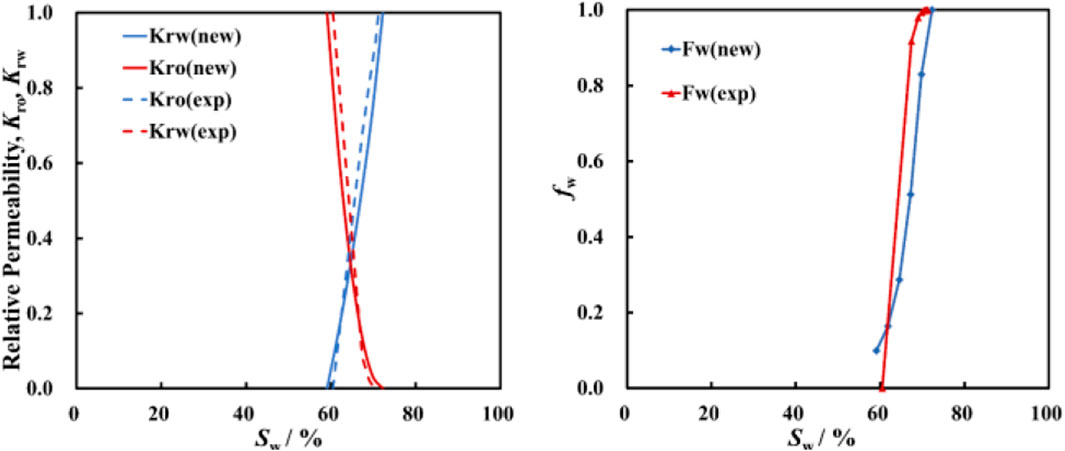
Figure 11. Comparison of calculated oil-water permeability and water yield curves of Class II rock samples with experimental analyses.
For each depth point in NMR logging, data undergo processing to ascertain normalized water saturation. Subsequently, the pore index is computed, determining the remaining oil saturation in the bound water. The relative permeability of oil and water, along with the pseudo-productivity curve at various depths, are ascertained. Following this, the water saturation from standard logging is utilized to project the water saturation onto the pseudo-productivity curve within the respective depth range, enabling the determination of the well section’s water productivity range. The ultimate outcome of transforming the entire well section is achieved (Figure 12).
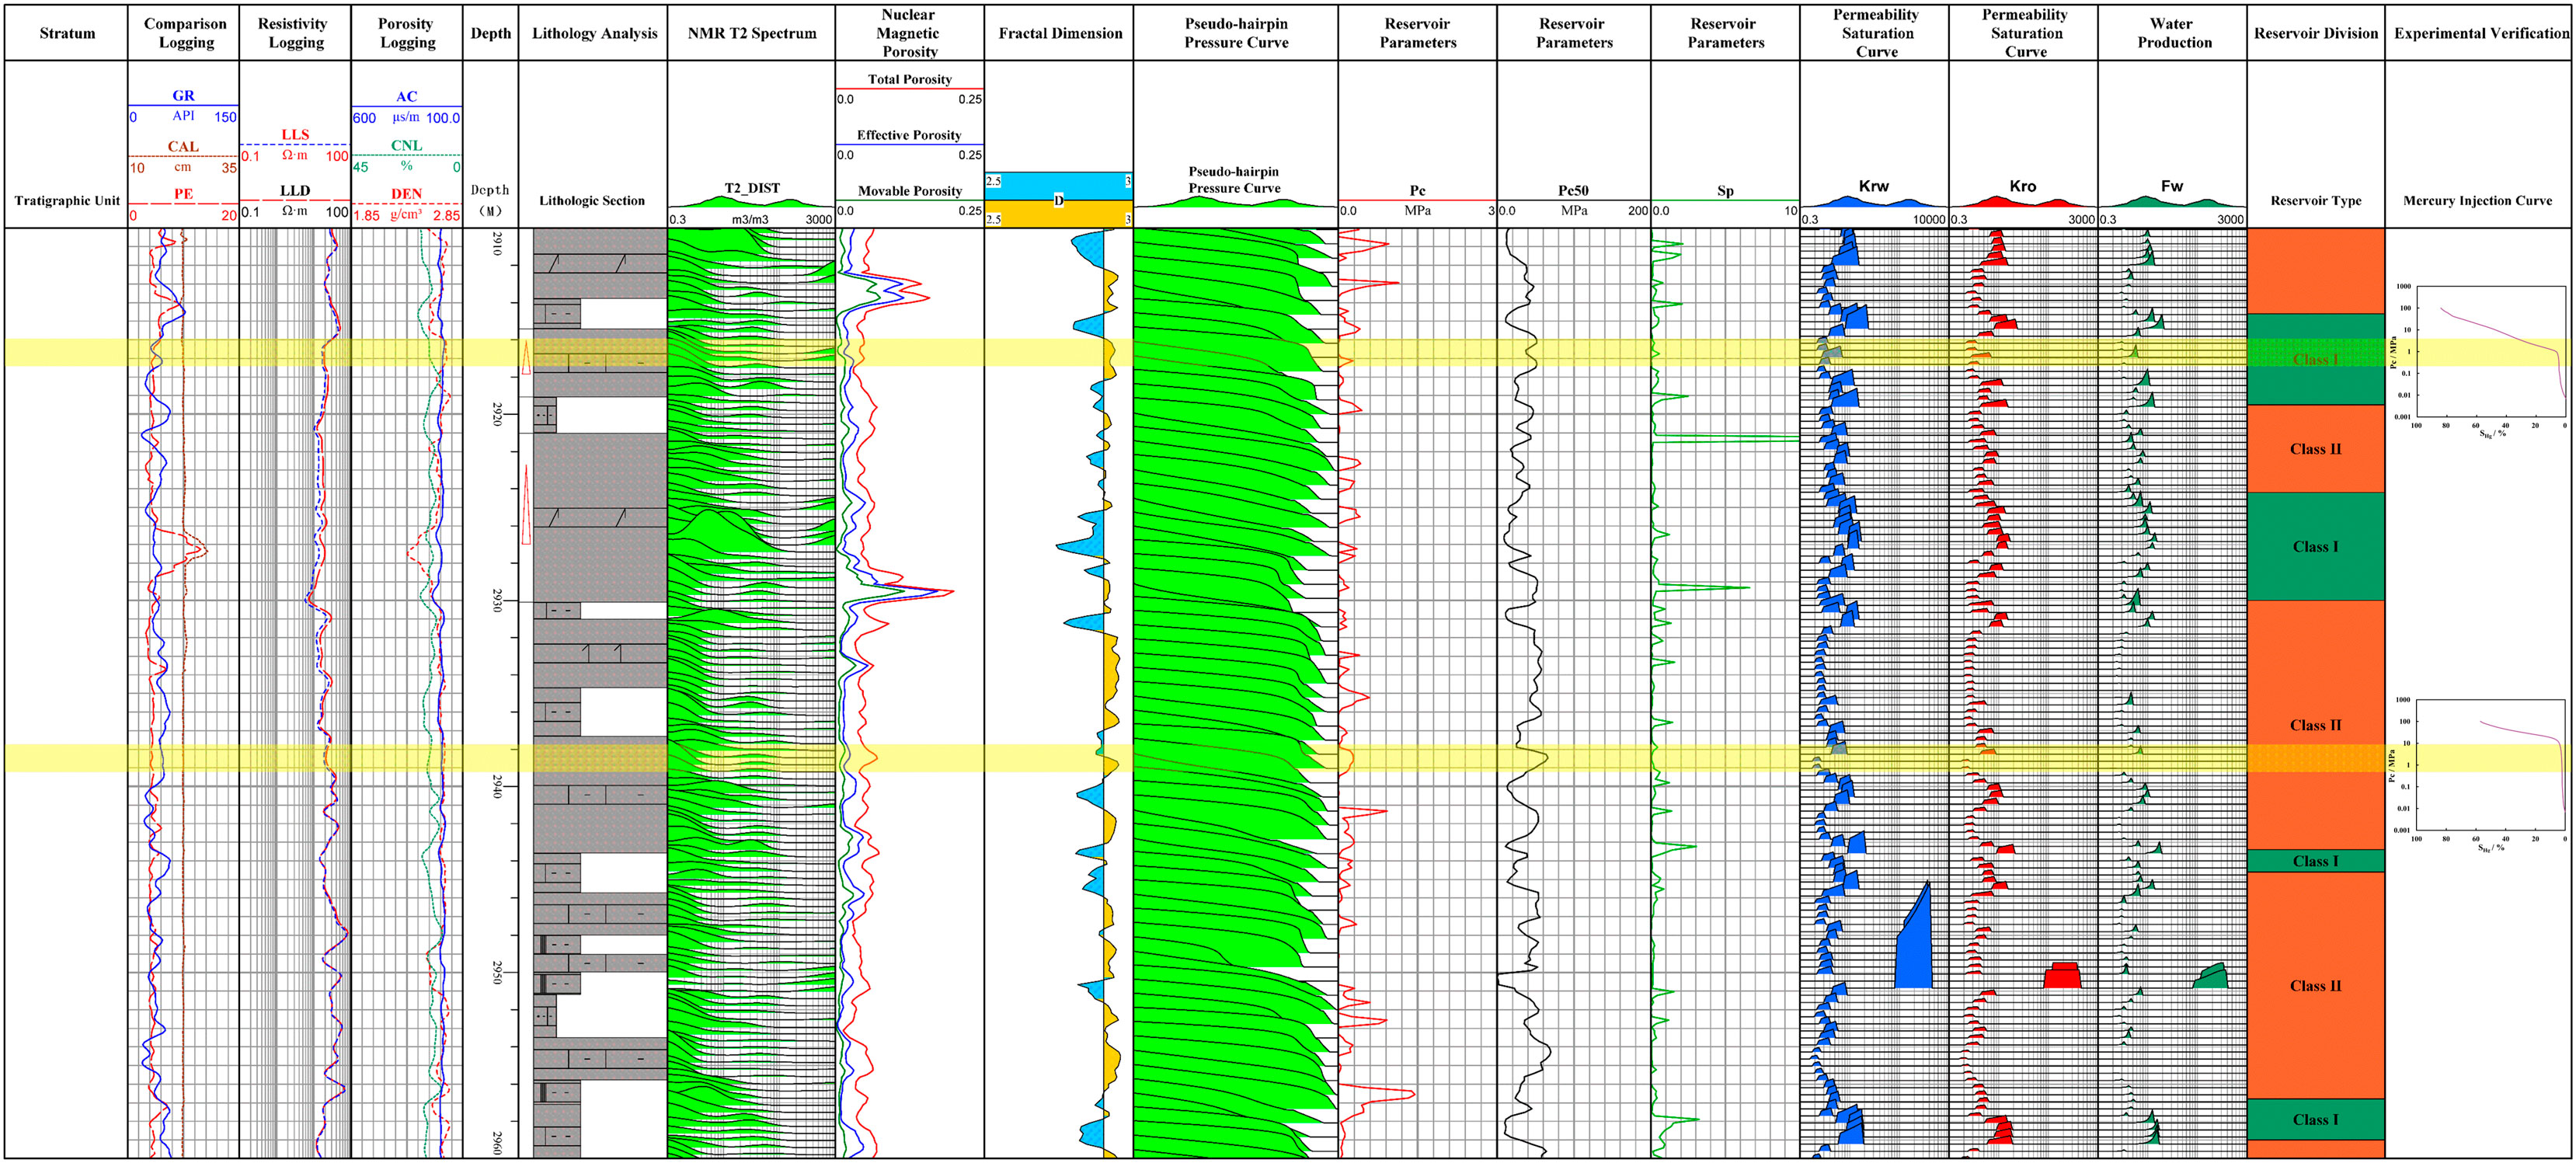
Figure 12. Reservoir quality and capacity treatment results for well X.
Standard logging figures for well X indicate a water saturation span of 29%–49%, equating to a pseudo water production rate of 79%–90.06%. The well’s daily oil output stands at 5.89 m3, and its water content is 88%, based on the well test outcomes from 3,240 to 3,242 m, aligning with both forecasted and actual test results.
As depicted in Figure 12, the T2-Kr conversion model can determine the comparative permeability of oil and water in compact sandstone and the rate of water generation. Two varieties of reservoir rocks were chosen for this model, demonstrating a favorable conversion outcome. The entire well section underwent conversion to achieve the research objective of forecasting the comparative permeability of oil and water in Chaiwai’s tight sandstone reservoirs and the rate of water production.
The experimental data of this study mainly come from the tight sandstone reservoirs in the Chaixi area. However, the adopted method has strong regional applicability and can be extended to different reservoir types and tectonic environments. Compared with the common linear transformation method and power function transformation method, the piecewise power function method used in this paper can depict the details more precisely when converting the nuclear magnetic transverse relaxation time to the capillary pressure curve, laying a foundation for the accuracy of parameter extraction in reservoir type classification. Meanwhile, in the conventional reservoir type classification, the unified model parameters are usually applied throughout the entire well section. In this paper, the fractal dimension is used to conduct the basic classification of pore structure for complex strata, and different model parameters are fitted for different pore types, providing higher accuracy for reservoir type classification. Future research can integrate more regional data to further verify and expand the applicability of the model. Additionally, although this study uses fractal dimension and machine learning methods for reservoir classification and permeability prediction, future research can explore the integration of more advanced technologies, such as deep learning, to further enhance the accuracy and universality of the model.
In this research zone, the compact sandstone deposits are characterized by their low porosity and permeability, exhibiting significant non-uniformity. Utilizing the fractal dimension aids in categorizing reservoirs, and a model linking the lateral relaxation time T2 in NMR logging to the capillary pressure Pc in the piezomercury curve has been developed for classifying reservoir types throughout the well section. The T2-Kr conversion model was developed to fulfill the research objective of forecasting the comparative permeability of oil, water, and the rate of water production in Chaixi’s dense sandstone reservoirs, with the thesis’s primary research findings being.
(1) By applying fundamental concepts from capillary pressure curves and NMR T2 spectra, we categorize rock specimens, utilizing the fractal dimension to confirm the precision of these classifications.
(2) Utilizing the reciprocal conversion dynamics of petrophysical factors, determine the segmented power function link between the lateral relaxation time T2 in NMR and the capillary pressure Pc in the piezomercury graph, and implement the related T2-Pc conversion model derived from the fractal dimension outcomes of the reservoir categorization, applied to the case and demonstrating the effectiveness of the conversion technique.
(3) Utilizing various conversion models for transforming NMR T2 spectra into pseudo-capillary pressure graphs, three principal capillary pressure parameters are chosen for calculation, these parameters are picked as the training set, and the GRNN neural network processes the entire well section’s formation data to forecast the type of reservoir. Findings indicate the technique’s suitability for categorizing dense sandstone deposits, with a positive classification impact.
(4) Utilizing the T2-Kr conversion model to forecast the relative permeability and rate of water generation in oil-water rock samples from various reservoir types, aiming to fulfill the research objective of estimating the relative permeability and production rate of water in tight sandstone reservoirs around Chaixi.
The original contributions presented in the study are included in the article/supplementary material, further inquiries can be directed to the corresponding author.
JZ: Data curation, Resources, Validation, Writing–original draft. JP: Software, Writing–original draft. ZL: Formal Analysis, Investigation, Writing–original draft. SC: Formal Analysis, Writing–review and editing.
The author(s) declare that no financial support was received for the research, authorship, and/or publication of this article.
The authors declare that the research was conducted in the absence of any commercial or financial relationships that could be construed as a potential conflict of interest.
The author(s) declare that no Generative AI was used in the creation of this manuscript.
All claims expressed in this article are solely those of the authors and do not necessarily represent those of their affiliated organizations, or those of the publisher, the editors and the reviewers. Any product that may be evaluated in this article, or claim that may be made by its manufacturer, is not guaranteed or endorsed by the publisher.
Al-Dousari, M., Almudhhi, S., and Garrouch, A. A. (2022). Predicting the flow zone indicator of carbonate reservoirs using NMR echo transforms and routine open-hole log measurements: insights from a field case study spanning extreme microstructure properties. J. Eng. Res. 10 (1A), 330–346. doi:10.36909/jer.13185
Azim, R. A., and Aljehani, A. (2022). Neural network model for permeability prediction from reservoir well logs. Processes 10 (12), 2587. doi:10.3390/pr10122587
Cheng, Y. Y., Luo, X., Zhuo, Q. G., Gong, Y. J., and Liang, L. (2024). Description of pore structure of carbonate reservoirs based on fractal dimension. Processes 12 (4), 825. doi:10.3390/pr12040825
Dong, J., Huang, Z. L., Chen, J. L., Li, T. J., Zhao, J., Pan, Y. S., et al. (2023). Pore structure and fractal characteristics of tight sandstone: a case study for huagang formation in the xihu sag, east China sea basin, China. Energies 16 (4), 2013. doi:10.3390/en16042013
Gray, M. E., Daniel, R., Kaldi, J., and Kulikowski, D. (2021). Generating pseudo-capillary pressure curves from nuclear magnetic resonance (NMR) data: a case study from the Cooper Basin, Australia. Aust. J. Earth Sci. 68 (1), 83–98. doi:10.1080/08120099.2020.1750482
Guo, H. X., Cheng, L. S., Jia, P., and Cao, R. Y. (2023). An improved method for fitting relative permeability curve using nuclear magnetic resonance imaging. Geoenergy Sci. Eng. 227, 211812. doi:10.1016/j.geoen.2023.211812
Guo, X. B., Huang, Z. L., Zhao, L. B., Han, W., Ding, C., Sun, X. W., et al. (2019). Pore structure and multi-fractal analysis of tight sandstone using MIP, NMR and NMRC methods: a case study from the Kuqa depression, China. J. Petroleum Sci. Eng. 178, 544–558. doi:10.1016/j.petrol.2019.03.069
Hao, B., Ma, X. Y., Zhang, Q. F., Zhong, J. H., and Sun, N. L. (2020). Sedimentary facies model in the southwestern Part Of the Qaidam Basin, China. Fresenius Environ. Bull. 29 (4A), 3040–3047.
Ji, Y. K., Kneafsey, T. J., Hou, J., Zhao, J. L., Liu, C. L., Guo, T. K., et al. (2022). Relative permeability of gas and water flow in hydrate-bearing porous media: a micro-scale study by lattice Boltzmann simulation. Fuel 321, 124013. doi:10.1016/j.fuel.2022.124013
Jin, G. W., Xie, R. H., and Jin, B. C. (2024). New insight into data processing of nuclear magnetic resonance logging for pore structure characterization in tight sandstone reservoirs. Ieee Trans. Geoscience Remote Sens. 62, 1–10. doi:10.1109/tgrs.2024.3368096
Lai, J., Wang, G. W., Wang, Z. Y., Chen, J., Pang, X. J., Wang, S. C., et al. (2018). A review on pore structure characterization in tight sandstones. Earth-Science Rev. 177, 436–457. doi:10.1016/j.earscirev.2017.12.003
Li, C. L., Tan, M. J., Wang, Z. Z., Li, Y. J., and Xiao, L. Z. (2023). Nuclear magnetic resonance pore radius transformation method and fluid mobility characterization of shale oil reservoirs. Geoenergy Sci. Eng. 221, 211403. doi:10.1016/j.geoen.2022.211403
Li, S. J., Bian, H. Y., Zhang, D., Liu, Y. X., Liu, G. L., and Wang, F. (2024a). Research on pore structure and classification evaluation of tight oil reservoirs based on fractal theory. Acta Geophys. 72, 4079–4089. doi:10.1007/s11600-024-01299-2
Li, X., Wang, J. G., Long, G. H., Xu, L., Cui, J., Sun, X. J., et al. (2024b). Eocene lacustrine microbialites in the western Qaidam Basin, China: implication for the sedimentary record and hydrocarbon potential. Carbonates Evaporites 39 (1), 5. doi:10.1007/s13146-023-00911-8
Mo, C. P., Zhang, G. D., Tang, Y., and Zeng, D. F. (2024). Multi-parameter modeling for prediction of gas-water production in tight sandstone reservoirs. J. Petroleum Explor. Prod. Technol. 14 (8-9), 2459–2471. doi:10.1007/s13202-024-01822-7
Moodie, N., and McPherson, B. (2024). An integrated approach to derive relative permeability from capillary pressure. Comput. Geosci. 28 (4), 755–770. doi:10.1007/s10596-024-10297-8
Parvazdavani, M., Movaghar, M. R. K., and Dehghani, S. A. M. (2022). Low salinity water flooding: evaluating the effect of salinity on oil and water relative permeability curves using coupling of DLVO and geochemical reactions. J. Petroleum Sci. Eng. 215, 110677. doi:10.1016/j.petrol.2022.110677
Pei, J. Y., Zhang, Y. F., Hu, J., Zhang, J., Zhu, X. M., Wang, Q., et al. (2022). Experimental verification of reservoirs with different wettability using an oil-water relative permeability model. Processes 10 (6), 1211. doi:10.3390/pr10061211
Peng, S. (2020). Gas-water relative permeability of unconventional reservoir rocks: hysteresis and influence on production after shut-in. J. Nat. Gas Sci. Eng. 82, 103511. doi:10.1016/j.jngse.2020.103511
Su, H. B., Zhang, S. M., Sun, Y. H., Wang, X. H., Yu, B. M., Wang, Y., et al. (2020). A comprehensive model for oil-water relative permeabilities in low-permeability reservoirs by fractal theory. Fractals-Complex Geometry Patterns Scaling Nat. Soc. 28 (3), 2050055. doi:10.1142/s0218348x20500553
Tian, F., Wang, W. M., Liu, N. G., Jiang, J. Q., Niu, C. K., Zhang, Y. D., et al. (2018). Rock-type definition and pore characterization of tight carbonate rocks based on thin sections and MICP and NMR experiments. Appl. Magn. Reson. 49 (7), 631–652. doi:10.1007/s00723-018-0993-2
Wang, F. Y., Yang, K., and Cai, J. C. (2018). Fractal characterization of tight oil reservoir pore structure using nuclear magnetic resonance and mercury intrusion porosimetry. Fractals-Complex Geometry Patterns Scaling Nat. Soc. 26 (2), 1840017. doi:10.1142/s0218348x18400170
Wei, D., Gao, Z. Q., Zhang, C., Fan, T. L., Karubandika, G. M., and Meng, M. M. (2019). Pore characteristics of the carbonate shoal from fractal perspective. J. Petroleum Sci. Eng. 174, 1249–1260. doi:10.1016/j.petrol.2018.11.059
Wei, H. Y., Xie, R. H., Wang, Y. X., Xie, B., Lai, Q., and Guo, J. F. (2024). Nuclear magnetic resonance T2 distribution-based gas-water relative permeability prediction in tight sandstone reservoirs: a case study on central sichuan basin, China. Energy and Fuels 38 (5), 3598–3608. doi:10.1021/acs.energyfuels.3c03972
Wenjie, F., and Ye, Z. (2024). Sedimentary characteristics and reservoir architecture of a lacustrine mixed carbonate/siliciclastic system: the lower member of the ShangGanchaigou Formation, Neogene, in the western Qaidam Basin, China. Front. Earth Sci. 12. doi:10.3389/feart.2024.1437205
Wu, J. T., Zhang, L., Liu, Y. X., Ma, K. Q., and Luo, X. B. (2024). Effect of displacement pressure gradient on oil-water relative permeability: experiment, correction method, and numerical simulation. Processes 12 (2), 330. doi:10.3390/pr12020330
Xiao, L., Mao, Z. Q., Zou, C. C., Jin, Y., and Zhu, J. C. (2016). A new methodology of constructing pseudo capillary pressure (Pc) curves from nuclear magnetic resonance (NMR) logs. J. Petroleum Sci. Eng. 147, 154–167. doi:10.1016/j.petrol.2016.05.015
Xie, W. B., Yin, Q. L., Wang, G. W., and Yu, Z. Y. (2021). Variable dimension fractal-based conversion method between the nuclear magnetic resonance T2 spectrum and capillary pressure curve. Energy and Fuels 35 (1), 351–357. doi:10.1021/acs.energyfuels.0c02924
Yi, J., Qi, Z. L., Li, X. C. Z., Liu, H., and Zhou, W. (2024). Spatial correlation-based machine learning framework for evaluating shale gas production potential: a case study in southern Sichuan Basin, China. Appl. Energy 357, 122483. doi:10.1016/j.apenergy.2023.122483
Zhang, H. T., Li, G. R., Guo, H. P., Zhang, W. J., Wang, Y. M., Li, W. B., et al. (2020). Applications of nuclear magnetic resonance (NMR) logging in tight sandstone reservoir pore structure characterization. Arabian J. Geosciences 13 (13), 572. doi:10.1007/s12517-020-05590-6
Zhang, N., Wang, S. D., Xun, X. J., Wang, H. Y., Sun, X. M., and He, M. C. (2023). Pore structure and fractal characteristics of coal-measure sedimentary rocks using nuclear magnetic resonance (NMR) and mercury intrusion porosimetry (MIP). Energies 16 (9), 3812. doi:10.3390/en16093812
Zhao, X. L., Yang, Z. M., Zhou, S. B., Luo, Y. T., Liu, X. W., Zhang, Y. P., et al. (2021). Research on characterization and heterogeneity of microscopic pore throat structures in tight oil reservoirs. Acs Omega 6 (38), 24672–24682. doi:10.1021/acsomega.1c03382
Keywords: dense sandstone reservoir, T2-Pc Modelling, fractal dimension, T2-Kr Modelling, projected water yield
Citation: Zhu J, Peng J, Lv Z and Chen S (2025) Reservoir type classification and water yield prediction based on petrophysical conversion models. Front. Earth Sci. 13:1524301. doi: 10.3389/feart.2025.1524301
Received: 07 November 2024; Accepted: 07 February 2025;
Published: 04 March 2025.
Edited by:
Huaimin Dong, Chang’an University, ChinaReviewed by:
Delu Li, Xi’an University of Science and Technology, ChinaCopyright © 2025 Zhu, Peng, Lv and Chen. This is an open-access article distributed under the terms of the Creative Commons Attribution License (CC BY). The use, distribution or reproduction in other forums is permitted, provided the original author(s) and the copyright owner(s) are credited and that the original publication in this journal is cited, in accordance with accepted academic practice. No use, distribution or reproduction is permitted which does not comply with these terms.
*Correspondence: Jiejun Zhu, NDUwOTUwNzM0QHFxLmNvbQ==
Disclaimer: All claims expressed in this article are solely those of the authors and do not necessarily represent those of their affiliated organizations, or those of the publisher, the editors and the reviewers. Any product that may be evaluated in this article or claim that may be made by its manufacturer is not guaranteed or endorsed by the publisher.
Research integrity at Frontiers
Learn more about the work of our research integrity team to safeguard the quality of each article we publish.