 Lou-Anne Chevrollier1*
 Adrien Wehrlé2
 Joseph M. Cook1
 Grégoire Guillet3
 Liane G. Benning4,5
 Alexandre M. Anesio1
 Martyn Tranter1
- 1Department of Environmental Science, iClimate, Aarhus University, Roskilde, Denmark
- 2Institute of Geography, University of Zürich, Zürich, Switzerland
- 3Department of Geosciences, University of Oslo, Oslo, Norway
- 4GFZ, Helmholtz Centre for Geosciences, Potsdam, Germany
- 5Department of Earth Sciences, Free University of Berlin, Berlin, Germany
Red snow algae bloom at the surface of snowfields worldwide, and their detection is relevant for ecological, biogeochemical and mass balance studies. In this study, we co-located RGB imagery acquired with a light-weight Uncrewed Aerial Vehicle (UAV) to 129 hyperspectral reflectance spectra from which the snow surface properties were retrieved, thereby enabling high-resolution aerial mapping of algal properties. We present maps of red snow algae abundance and albedo reducing effect over
1 Introduction
Red snow algae bloom on glaciers and ice sheets worldwide (Hoham and Remias, 2020), reducing snow surface albedo and accelerating snowmelt (Lutz et al., 2016; Cook et al., 2017; Ganey et al., 2017; Khan et al., 2021; Healy and Khan, 2023; Engstrom et al., 2022). In alpine environments, a faster retreat of seasonal snow has consequences for highly vulnerable snowbed habitats (Reinhardt, 2013; Matteodo et al., 2016), the Earth radiation budget (Flanner et al., 2011; Thackeray and Fletcher, 2016), and freshwater availability (Barnett et al., 2005). In addition, snow algae play an important ecological role in snow ecosystems (Terashima et al., 2017; Ono et al., 2021). Mapping algal abundance and algal albedo-reducing effect on seasonal snowfields is, therefore, important from both ecological and physical perspectives.
Red algal blooms are typically heterogeneously distributed at the snow surface (Thomas, 1972; Thomas and Duval, 1995; Nakashima et al., 2021), which makes it difficult to understand their spatial ecology at the scale of snowfields from ground measurements alone. Spaceborne or airborne observations offer the possibility to investigate algal blooms on areas too large, remote, difficult, or dangerous to access and do not alter the physical properties of the snow cover, as would manual monitoring. Consequently, uncrewed aerial vehicles (UAVs) are increasingly being used to study surface properties (e.g., Skiles et al., 2023; Di Mauro et al., 2015; Niedzielski et al., 2019; Healy and Khan, 2023; Ryan et al., 2017; Ryan et al., 2018; Cook et al., 2020) as they allow the measurement of surface reflectance at a much finer spatial resolution than satellite imagery and thus can detect patchy algal blooms over wide areas.
Remote sensing methods for quantitative algal detection require the development of algorithms that infer given algal properties from the signal detected by the sensor onboard the remote platform. The most common algorithms for such tasks are forward empirical relationships that correlate field-measured variables, such as cell count or biovolume, with a specific band index or spectral feature that can be calculated from the remotely sensed imagery. The complexity and accuracy of these relationships mostly depend on the number of empirical points available, as well as the spectral and spatial resolution of the imagery. For example, specific chlorophyll-a features that are thought to be produced only by photosynthetic life can be extracted from hyperspectral imagery (Painter et al., 2001). However, hyperspectral imagery is still typically expensive and challenging to acquire. Simpler multi-band indices targeting broader algal pigments features that can be applied to multispectral or red-green-blue (RGB) imagery are more frequently used (Takeuchi et al., 2006; Ganey et al., 2017; Gray et al., 2021; Engstrom et al., 2022; Healy and Khan, 2023). This forward index-based approach enables efficient upscaling of ground measurements to wide areas, but the presence of other light-absorbing particles at the snow surface and, in particular, mineral dust can significantly bias algal abundance retrievals (Di Mauro et al., 2024). In addition, once the algal abundance is estimated from the imagery, the associated darkening effect of the blooms is challenging to derive because it depends on numerous other parameters such as algal pigmentation and size distribution, snow physical properties, algal distribution at the surface, and/or the presence of other light-absorbing particles (Cook et al., 2017; He, 2022; Kaspari et al., 2014; Chevrollier et al., 2024).
Here, we use a novel approach to remotely map and quantify the impact of red snow algae, combining RGB imagery captured using a low-cost and light-weight UAV with high-resolution ground spectroscopy. This approach takes advantage of a large ground dataset, which was directly colocated with UAV reflectance imagery, enabling the direct estimation of algal abundance and albedo-reducing effect from the imagery while taking into account the effect of other light-absorbing particles. We present high-resolution maps of the red snow algae albedo-reducing effect over seasonal snowfields in Southern Norway, an alpine environment with a high abundance of snowbed habitats (Bryn and Horvath, 2020). This study contributes to the scarce literature about snow algal presence and melt impact in fast changing mid-latitude cryospheric environments.
2 Materials and methods
2.1 UAV imagery and ground spectroscopy
Prior to the acquisition of the UAV imagery, hemispherical conical reflectance factor (HCRF) measurements were collected on snowfields in Hardangervidda, Southern Norway, between 8 July and 6 August 2023. The data are presented in Chevrollier et al. (2024). The measurements were collected using an ASD FieldSpec 4 spectroradiometer (spectral range 0.35–2.5
A DJI Mini 3 camera was then deployed to capture RGB imagery of the snowfields. The Mini series are the cheapest and lightest (
2.2 Snow classification on the UAV imagery
A tree-based gradient boosting binary classifier was built for binary snow detection using the scikit-learn machine learning python package (Pedregosa et al., 2011). The model takes the UAV R, G, and B reflectance as input and returns whether the pixel is snow or not. Surface areas were manually labeled on 27 different UAV images, representing different surface types and resolutions, with half of the data points labeled as snow and the other half labeled as non-snow (surrounding vegetation and rocks), to ensure an equal representation of both classes during training and testing, for a total of 1.6
2.3 Calculation and comparison of colocated ground and airborne red-to-green indices
The circular surfaces associated with the HCRF ground measurements were visually identified on the higher-resolution UAV imagery using a series of pictures acquired during the acquisition of ground measurements and manually delineated on ImageJ (Schneider et al., 2012) using the footprint size of each measurement, calculated from the distance between the fore-optic and the snow surface. The R, G, and B reflectance of the UAV imagery corresponding to each HCRF ground measurement were then extracted, and the ground measurements were rescaled to R, G, and B bands using the spectral response of DJI Phantom Pro 4 (Burggraaff et al., 2019) as no spectral response could be provided by the manufacturer for DJI mini 3. Ground red-to-green (RG) band ratio indices were then computed from ground HCRFs, and the associated airborne RG band ratio indices were computed from the average RG index of the circles on the UAV imagery. This ratio was chosen because it has been used in the past with airborne (e.g., Healy and Khan, 2023) and spaceborne (Gray et al., 2021; Ganey et al., 2017; Engstrom et al., 2022) data to detect the presence of red algae, motivated by a strong dip in the surface reflectance between the chlorophyll and carotenoid pigment absorption features of the algae. This analysis relied on the Python packages scikit-image (van der Walt et al., 2014), pandas (Pandas development team, 2024; Wes, 2010), Matplotlib (Hunter, 2007), SciPy (Virtanen et al., 2020), PIL (Umesh, 2012), GeoPandas (den Bossche et al., 2024), Rasterio (Gillies et al., 2013), and NumPy (Harris et al., 2020).
An ordinary least square regression was fitted between the ground and airborne indices, showing a strong correlation between the 129 UAV and ground RG indices (r = 0.96, Figure 1). This confirms that the RG indices captured by the UAV can closely reproduce ground RG indices. The bias and the deviation from the 1:1 line could be explained by several factors: 1) the RGB spectral response used to calculate the ground RG indices may not be exactly the same as that of the sensors onboard DJI mini 3; 2) the distribution of data in the UAV pixels for each circle is unlikely normally distributed; hence, the mean may not be a good predictor; 3) the spatial response of the FieldSpec sensor is not perfectly homogeneous, i.e., the pixels in the middle of the footprint may be more important; 4) the JPEG compression and lack of further processing may have introduced small biases in the airborne reflectance data; and 5) small changes in atmospheric conditions including cloud cover may have occurred between the acquisition of the ground and airborne measurements. These factors are not investigated here as the correlation from Figure 1 serves only as a validation of the UAV signal and is not used as a statistical model in the analyses.
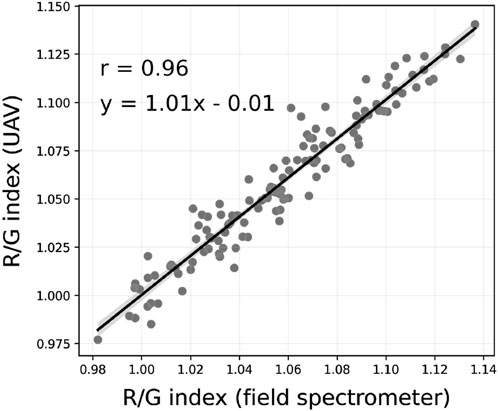
Figure 1. Red-to-green reflectance index at the sampled surface extracted from the UAV RGB imagery as a function of the index calculated from ground HCRF.
2.4 Statistical models for algal abundance and the albedo reduction effect
For each of the 129 surfaces pairing ground and UAV RG indices, the light-absorbing particle properties were available from Chevrollier et al. (2024). Specifically, Chevrollier et al. (2024) retrieved the red algae, dust, and black carbon abundance, as well as their associated broadband albedo-reducing effect by inversion of hyperspectral reflectance using deep learning and radiative transfer modeling. These properties are, therefore, not direct measurements at the surface but retrievals from model inversions. This physics-based approach accounts for the effect of the changing snow grain size on the albedo-reducing effect caused by the absorbing particles. A positive BBA reduction corresponds to a darkening effect and is calculated by differentiating the BBA of the surface with and without algae. Causal statistical models were then built between each of the surface variables and the RG indices of the UAV imagery using Bayesian inference with Markov Chain Monte Carlo (MCMC) sampling, implemented with PyMC (Abril-Pla et al., 2023). This method enables the retrieval of probability distributions rather than single values as statistical model parameters, providing estimates of the uncertainties in the model predictions. Probabilistic inference requires the definition of prior distributions for the model parameters and the distribution of the likelihood function. Using Bayes’ theorem, posterior distributions are then computed from the prior and likelihood distributions, providing a refined estimate of the model parameters. Posterior distributions are finally sampled using MCMC to generate probability distributions for the model parameters that preserve the full statistical information contained in the posterior distributions. In this case, the algal concentration was fitted to the RG ratio with a second-order polynomial of the form
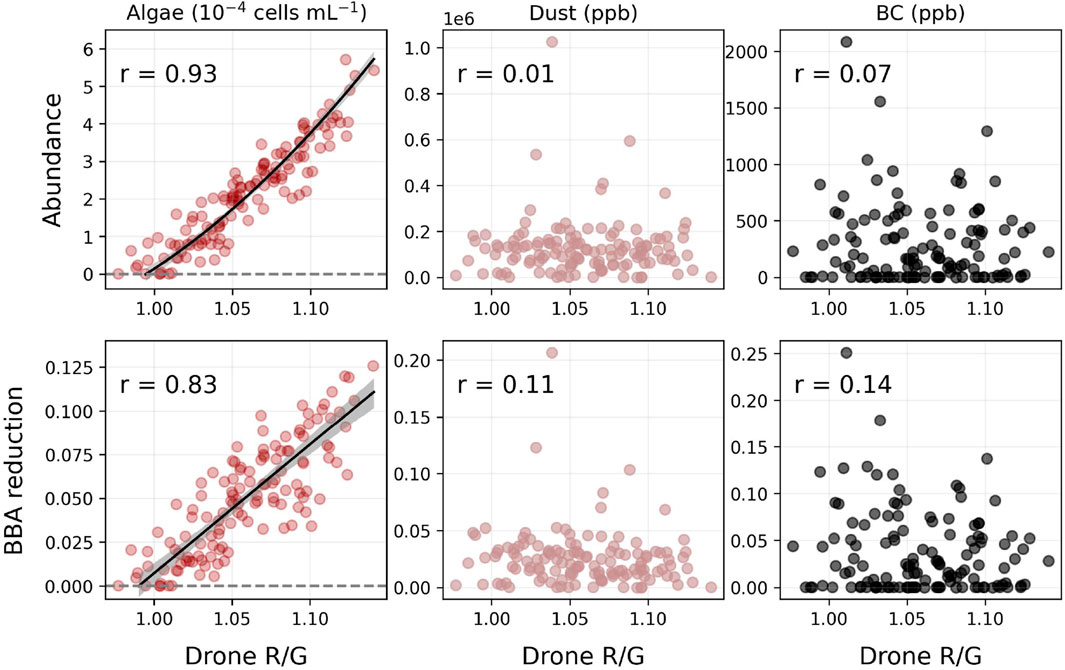
Figure 2. Correlations between the UAV RG band indices and the associated surface properties retrieved from inversions of HCRF spectra. Equations of the median posteriors for the algal models: algal abundance
The UAV RG indices correlated very well with the algal abundance (r = 0.93) and the algal-driven albedo reducing effect (r = 0.83) but did not correlate with the dust and black carbon properties (r
In order to calculate the algal properties on the visible bloom areas solely, surface pictures taken before each ground measurement were used to select the RG ratios associated with a visible bloom and determine a conservative threshold of 1.029. Specifically, the threshold was selected so that no bloom was visible on any surface picture associated with a lower RG ratio than this threshold.
2.5 Radiative forcing and melt
The daily radiative forcing (RF; W
2.6 Evaluation of sampling representativeness
The algal abundance maps were all rescaled at 3 cm resolution and numerically sampled pseudo-randomly to evaluate two ground sampling strategies in terms of how representative of the entire snowfield area ground samples of algal counts can be. The first strategy consisted in taking several small samples with a fixed footprint but distributed spatially across the snowfield, and the second consisted in increasing the sample footprint from a fixed location. In the first case, mean algal concentrations were calculated for 1,000 random points with an increasing sampling footprint from 0.001 to 4
3 Results and discussion
3.1 Red algal effect on the surface albedo of snowfields
The snow algal blooms were intense enough to reduce the overall albedo of each snowfield surface (
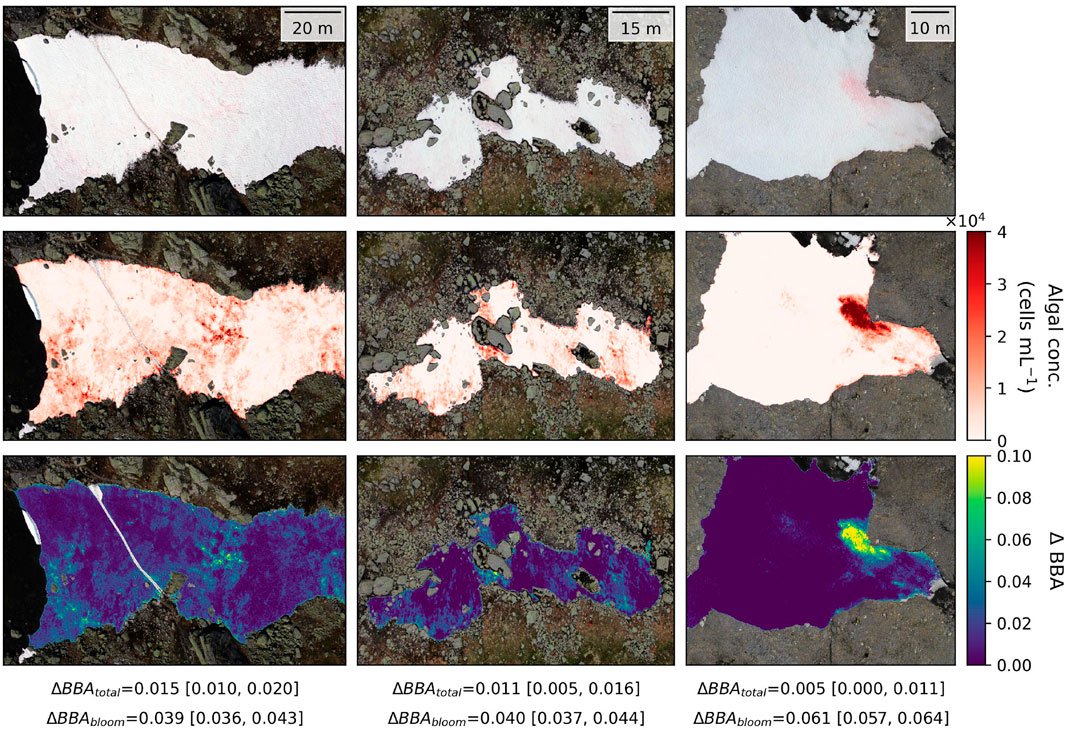
Figure 3. UAV RGB imagery of three studied snowfields, along with their associated maps of algal concentration and albedo-reducing effect.
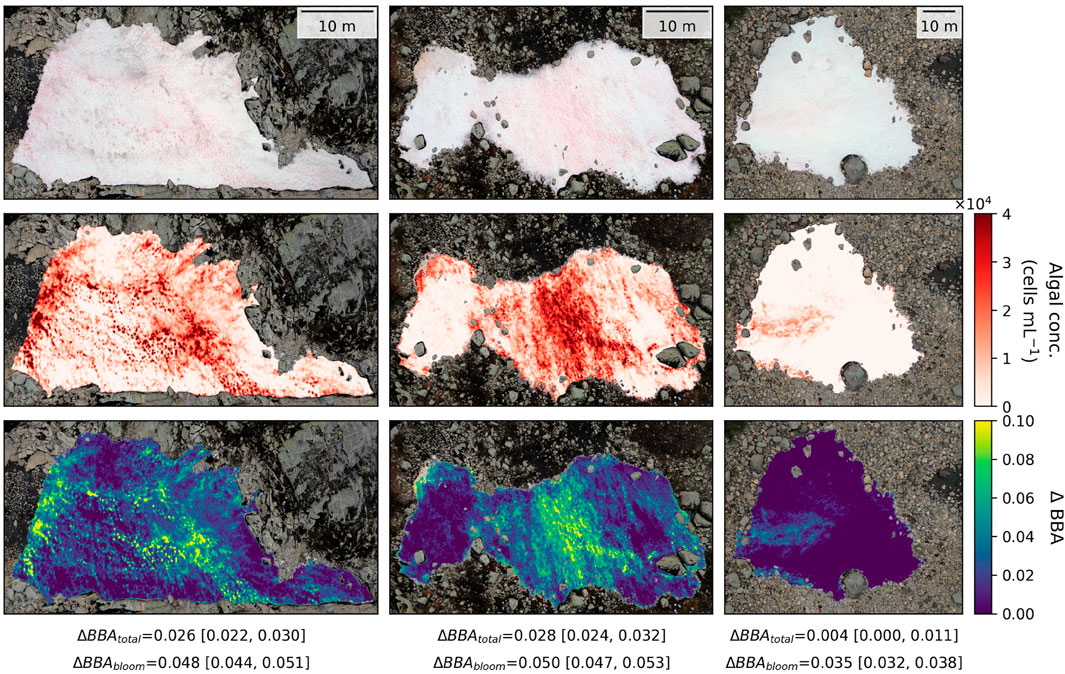
Figure 4. UAV RGB imagery of three studied snowfields, along with their associated maps of algal concentration and albedo-reducing effect.
Given the large temporal variability in the incoming shortwave irradiance in the studied region (Supplementary Figure S1), the impact of red algae on snowmelt varied greatly during our observational period. On a cloudy day, the radiative forcing of the algae was negligible for all snowfields, whilst on a sunny day, the daily radiative forcing was 4.3
3.2 Red algal bloom surface distribution
The coefficient of variation of the calculated algal concentration (standard deviation divided by the mean) ranged from 100% to 400%. The total coverage and intensity of the blooms therefore varied between and within the snowfields, confirming the high heterogeneity of snow algal blooms documented in other studies (Thomas, 1972; Thomas and Duval, 1995; Takeuchi et al., 2006; Lutz et al., 2017; Van Hees et al., 2023). When deep suncups were present on the snowfields, which are bowl-like structures forming spontaneously on the snow during the melting season in temperate alpine areas (Post and LaChapelle, 2000), the algae appeared to accumulate within them (Figures 5A, B). Differences in algal accumulation within suncups were also noticeable, and the algae could either be present in the entire depression (Figure 5A), mostly in the bottom of the depression (Figure 5B), or in the channel-like features where suncups are connected to each other (Figure 5C). In cases where the surface appeared smoother, yet still featuring small-scale ridges and depressions, algal distribution did not seem to be linked to surface roughness (Figure 5D).
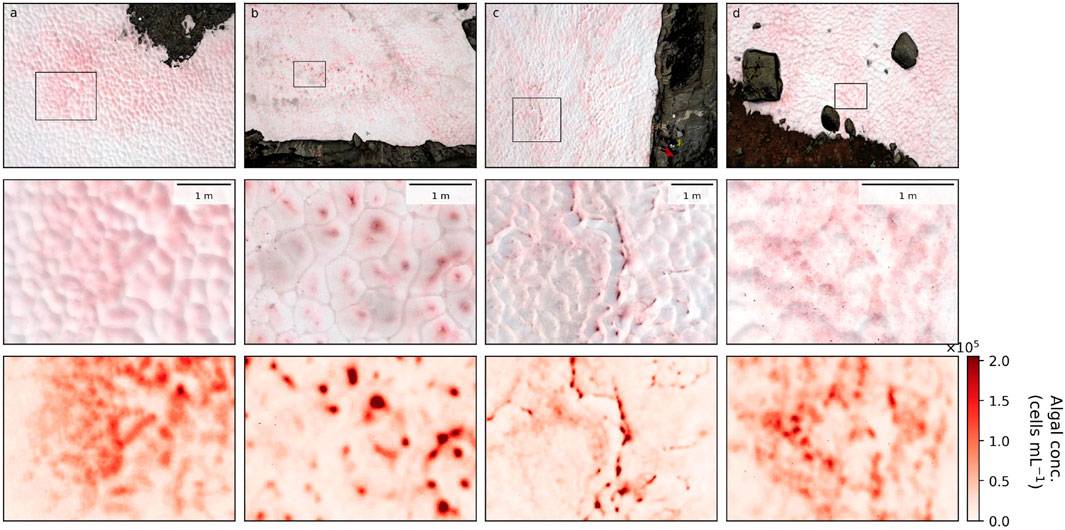
Figure 5. Four close-up areas illustrating different surface patterns (A–D). From top to bottom: UAV RGB imagery with marked close-up areas, UAV RGB imagery of close-up areas, and algal concentration imagery of close-up areas.
In order to further characterize bloom heterogeneity and investigate the potential implications for the representativeness of surface samples collected on the ground, numerical sampling experiments were designed. Specifically, the pixels from the UAV imagery were extracted in two different ways to represent different ground sampling strategies. First, the pixels were extracted from an increasingly large footprint from a single fixed point, and second, the pixels were extracted from an increasing number of 12 × 12-cm footprint squares distributed across the snowfield (see Methods). For all snowfields, the second strategy was more efficient at capturing a representative average algal concentration of the entire snowfield (Figure 6). For a total area of extracted pixels 10 times lower, the probability of obtaining a representative concentration was at least twice higher with the second strategy, and the representativeness of the samples barely improved with increasing the footprint size from a fixed point. This was verified even for the snowfields with a main localized bloom (4 and 6; Figure 6). These results indicate that the scale of the heterogeneity of the snowfields always superseded the maximum sampled area tested of 4
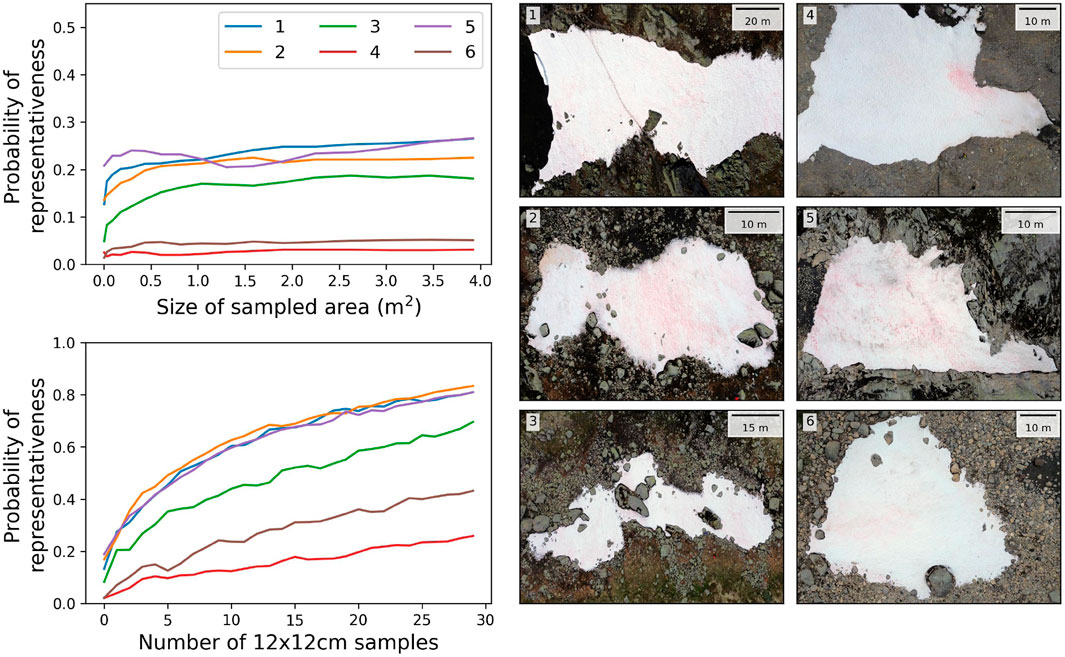
Figure 6. Representativeness probability calculated from the numerical sampling experiment with two different strategies: increasing the size of the sampled area (upper panel) and increasing the number of samples (lower panel).
Elucidating the processes behind algal spatial distribution was beyond the scope of this study, but we demonstrated the potential of a light-weight, low-cost, and easy-to-deploy UAV to map and describe algal surface distribution that can be used to monitor the blooms at high temporal and spatial resolution. Such datasets would enable the monitoring of large areas that cannot be accessed, circumventing the representativeness bias associated with ground sampling, and helping to elucidate major questions in the field of bio-albedo, such as the role of meteorological and snow conditions on the spatial distribution of algal blooms (Roussel et al., 2024; Chen et al., 2023).
4 Conclusion
We used UAV RGB imagery colocated with a ground dataset to map red snow algal blooms and their associated surface albedo-reducing effect at high spatial resolution in the Hardangervidda region. We found that the algae albedo-reducing effect was on average 0.012
Data availability statement
The data supporting the results of this study are available at https://figshare.com/s/72ada2e00d70eba1c9d0?file=49700991. The weather station data are available at https://doi.org/10.5194/egusphere-2024-2583.
Author contributions
LC: conceptualization, data curation, formal analysis, investigation, methodology, software, validation, visualization, writing–original draft, and writing–review and editing. AW: conceptualization, data curation, formal analysis, investigation, methodology, resources, software, validation, visualization, and writing–review and editing. JMC: project administration, supervision, and writing–review and editing. GG: methodology, software, and writing–review and editing. LGB: funding acquisition, project administration, and writing–review and editing. AMA: funding acquisition, project administration, and writing–review and editing. MT: funding acquisition, project administration, supervision, and writing–review and editing.
Funding
The author(s) declare that financial support was received for the research, authorship, and/or publication of this article. This work is part of the project DeepPurple that has received funding from the European Research Council (ERC) under the European Union’s Horizon 2020 research and innovation programme (Grant agreement No. 856416).
Acknowledgments
LC and AW thank Jens Ådne Rekkedal Haga for facilitating fieldwork logistics and the Finse Alpine Research Center, which is maintained by the University of Oslo and the University of Bergen.
Conflict of interest
The authors declare that the research was conducted in the absence of any commercial or financial relationships that could be construed as a potential conflict of interest.
Generative AI statement
The author(s) declare that no Generative AI was used in the creation of this manuscript.
Publisher’s note
All claims expressed in this article are solely those of the authors and do not necessarily represent those of their affiliated organizations, or those of the publisher, the editors and the reviewers. Any product that may be evaluated in this article, or claim that may be made by its manufacturer, is not guaranteed or endorsed by the publisher.
Supplementary material
The Supplementary Material for this article can be found online at: https://www.frontiersin.org/articles/10.3389/feart.2025.1508719/full#supplementary-material
References
Abril-Pla, O., Andreani, V., Carroll, C., Dong, L., Fonnesbeck, C. J., Kochurov, M., et al. (2023). Pymc: a modern, and comprehensive probabilistic programming framework in python. PeerJ Comput. Sci. 9, e1516. doi:10.7717/peerj-cs.1516
Barnett, T. P., Adam, J. C., and Lettenmaier, D. P. (2005). Potential impacts of a warming climate on water availability in snow-dominated regions. Nature 438, 303–309. doi:10.1038/nature04141
Bryn, A., and Horvath, P. (2020). Kartlegging av nin naturtyper i målestokk 1: 5000 rundt flux-tårnet og på hansbunuten. finse (vestland).
Burggraaff, O., Schmidt, N., Zamorano, J., Pauly, K., Pascual, S., Tapia, C., et al. (2019). Standardized spectral and radiometric calibration of consumer cameras. Opt. express 27, 19075–19101. doi:10.1364/oe.27.019075
Chen, X.-Y., Li, S.-L., Zhang, C., and Liu, D. Y. (2023). Snow algal blooms in antarctic king george island in 2017–2022 and their future trend based on cmip6 projection. Adv. Clim. Change Res. 14, 732–745. doi:10.1016/j.accre.2023.09.013
Chevrollier, L.-A., Wehrlé, A., Cook, J. M., Pirk, N., Benning, L. G., Anesio, A. M., et al. (2024). Separating the albedo reducing effect of different light absorbing particles on snow using deep learning. EGUsphere 2024, 1–16. doi:10.5194/egusphere-2024-2583
Cook, J. M., Hodson, A. J., Gardner, A. S., Flanner, M., Tedstone, A. J., Williamson, C., et al. (2017). Quantifying bioalbedo: a new physically based model and discussion of empirical methods for characterising biological influence on ice and snow albedo. Cryosphere 11, 2611–2632. doi:10.5194/tc-11-2611-2017
Cook, J. M., Tedstone, A. J., Williamson, C., McCutcheon, J., Hodson, A. J., Dayal, A., et al. (2020). Glacier algae accelerate melt rates on the south-western Greenland ice sheet. Cryosphere 14, 309–330. doi:10.5194/tc-14-309-2020
den Bossche, J. V., Jordahl, K., Fleischmann, M., Richards, M., McBride, J., Wasserman, J., et al. (2024). Geopandas/geopandas: v1.0.1. Zenodo. doi:10.5281/zenodo.12625316
Di Mauro, B., Fava, F., Ferrero, L., Garzonio, R., Baccolo, G., Delmonte, B., et al. (2015). Mineral dust impact on snow radiative properties in the european alps combining ground, uav, and satellite observations. J. Geophys. Res. Atmos. 120, 6080–6097. doi:10.1002/2015jd023287
Di Mauro, B., Garzonio, R., Ravasio, C., Orlandi, V., Baccolo, G., Gilardoni, S., et al. (2024). Combined effect of algae and dust on snow spectral and broadband albedo. J. Quantitative Spectrosc. Radiat. Transf. 316, 108906. doi:10.1016/j.jqsrt.2024.108906
Engstrom, C. B., Williamson, S. N., Gamon, J. A., and Quarmby, L. M. (2022). Seasonal development and radiative forcing of red snow algal blooms on two glaciers in british columbia, Canada, summer 2020. Remote Sens. Environ. 280, 113164. doi:10.1016/j.rse.2022.113164
Flanner, M. G., Shell, K. M., Barlage, M., Perovich, D. K., and Tschudi, M. (2011). Radiative forcing and albedo feedback from the northern hemisphere cryosphere between 1979 and 2008. Nat. Geosci. 4, 151–155. doi:10.1038/ngeo1062
Ganey, G. Q., Loso, M. G., Burgess, A. B., and Dial, R. J. (2017). The role of microbes in snowmelt and radiative forcing on an alaskan icefield. Nat. Geosci. 10, 754–759. doi:10.1038/ngeo3027
Gelman, A., Carlin, J. B., Stern, H. S., and Rubin, D. B. (1995). Bayesian data analysis. Chapman and Hall/CRC.
Gillies, S., Ward, B., and Petersen, A. S. (2013). Rasterio: geospatial raster i/o for Python programmers.
Gray, A., Krolikowski, M., Fretwell, P., Convey, P., Peck, L. S., Mendelova, M., et al. (2021). Remote sensing phenology of antarctic green and red snow algae using worldview satellites. Front. Plant Sci. 12, 671981. doi:10.3389/fpls.2021.671981
Harris, C. R., Millman, K. J., van der Walt, S. J., Gommers, R., Virtanen, P., Cournapeau, D., et al. (2020). Array programming with NumPy. Nature 585, 357–362. doi:10.1038/s41586-020-2649-2
He, C. (2022). Modelling light-absorbing particle–snow–radiation interactions and impacts on snow albedo: fundamentals, recent advances and future directions. Environ. Chem. 19, 296–311. doi:10.1071/en22013
Healy, S. M., and Khan, A. L. (2023). Albedo change from snow algae blooms can contribute substantially to snow melt in the north cascades, USA. Commun. Earth and Environ. 4, 142. doi:10.1038/s43247-023-00768-8
Hoham, R. W., and Remias, D. (2020). Snow and glacial algae: a review1. J. Phycol. 56, 264–282. doi:10.1111/jpy.12952
Hunter, J. D. (2007). Matplotlib: a 2d graphics environment. Comput. Sci. and Eng. 9, 90–95. doi:10.1109/MCSE.2007.55
Kaspari, S., Painter, T. H., Gysel, M., Skiles, S., and Schwikowski, M. (2014). Seasonal and elevational variations of black carbon and dust in snow and ice in the solu-khumbu, Nepal and estimated radiative forcings. Atmos. Chem. Phys. 14, 8089–8103. doi:10.5194/acp-14-8089-2014
Khan, A. L., Dierssen, H. M., Scambos, T. A., Höfer, J., and Cordero, R. R. (2021). Spectral characterization, radiative forcing and pigment content of coastal antarctic snow algae: approaches to spectrally discriminate red and green communities and their impact on snowmelt. Cryosphere 15, 133–148. doi:10.5194/tc-15-133-2021
Lutz, S., Anesio, A. M., Edwards, A., and Benning, L. G. (2017). Linking microbial diversity and functionality of arctic glacial surface habitats. Environ. Microbiol. 19, 551–565. doi:10.1111/1462-2920.13494
Lutz, S., Anesio, A. M., Raiswell, R., Edwards, A., Newton, R. J., Gill, F., et al. (2016). The biogeography of red snow microbiomes and their role in melting arctic glaciers. Nat. Commun. 7, 11968. doi:10.1038/ncomms11968
Matteodo, M., Ammann, K., Verrecchia, E. P., and Vittoz, P. (2016). Snowbeds are more affected than other subalpine–alpine plant communities by climate change in the swiss alps. Ecol. Evol. 6, 6969–6982. doi:10.1002/ece3.2354
Nakashima, T., Uetake, J., Segawa, T., Procházková, L., Tsushima, A., and Takeuchi, N. (2021). Spatial and temporal variations in pigment and species compositions of snow algae on mt. tateyama in toyama prefecture, Japan. Front. Plant Sci. 12, 689119. doi:10.3389/fpls.2021.689119
Niedzielski, T., Szymanowski, M., Miziński, B., Spallek, W., Witek-Kasprzak, M., Ślopek, J., et al. (2019). Estimating snow water equivalent using unmanned aerial vehicles for determining snow-melt runoff. J. Hydrology 578, 124046. doi:10.1016/j.jhydrol.2019.124046
Ono, M., Takeuchi, N., and Zawierucha, K. (2021). Snow algae blooms are beneficial for microinvertebrates assemblages (tardigrada and rotifera) on seasonal snow patches in Japan. Sci. Rep. 11, 5973. doi:10.1038/s41598-021-85462-5
Painter, T. H. (2011). Comment on singh and others,‘hyperspectral analysis of snow reflectance to understand the effects of contamination and grain size. J. Glaciol. 57, 183–185. doi:10.3189/002214311795306646
Painter, T. H., Duval, B., Thomas, W. H., Mendez, M., Heintzelman, S., and Dozier, J. (2001). Detection and quantification of snow algae with an airborne imaging spectrometer. Appl. Environ. Microbiol. 67, 5267–5272. doi:10.1128/aem.67.11.5267-5272.2001
Pedregosa, F., Varoquaux, G., Gramfort, A., Michel, V., Thirion, B., Grisel, O., et al. (2011). Scikit-learn: machine learning in Python. J. Mach. Learn. Res. 12, 2825–2830.
Pirk, N., Aalstad, K., Yilmaz, Y. A., Vatne, A., Popp, A. L., Horvath, P., et al. (2023). Snow–vegetation–atmosphere interactions in alpine tundra. Biogeosciences 20, 2031–2047. doi:10.5194/bg-20-2031-2023
Reinhardt, S. (2013). “The importance of snow for mountain vegetation in the hardangervidda area (southern Norway): plant distribution, plant phenology, plant diversity, and effects of global climate change,”. PhD thesis (Porsgrunn, Norway: Telemark University College).
Roussel, L., Dumont, M., Gascoin, S., Monteiro, D., Bavay, M., Nabat, P., et al. (2024). Snowmelt duration controls red algal blooms in the snow of the european alps. Proc. Natl. Acad. Sci. 121, e2400362121. doi:10.1073/pnas.2400362121
Ryan, J. C., Hubbard, A., Box, J. E., Brough, S., Cameron, K., Cook, J. M., et al. (2017). Derivation of high spatial resolution albedo from uav digital imagery: application over the Greenland ice sheet. Front. Earth Sci. 5, 40. doi:10.3389/feart.2017.00040
Ryan, J. C., Hubbard, A., Stibal, M., Irvine-Fynn, T. D., Cook, J., Smith, L. C., et al. (2018). Dark zone of the Greenland ice sheet controlled by distributed biologically-active impurities. Nat. Commun. 9, 1065. doi:10.1038/s41467-018-03353-2
Schneider, C. A., Rasband, W. S., and Eliceiri, K. W. (2012). Nih image to imagej: 25 years of image analysis. Nat. methods 9, 671–675. doi:10.1038/nmeth.2089
Skiles, S. M., Donahue, C. P., Hunsaker, A. G., and Jacobs, J. M. (2023). Uav hyperspectral imaging for multiscale assessment of landsat 9 snow grain size and albedo. Front. Remote Sens. 3, 1038287. doi:10.3389/frsen.2022.1038287
Skiles, S. M., and Painter, T. H. (2018). Assessment of radiative forcing by light-absorbing particles in snow from in situ observations with radiative transfer modeling. J. Hydrometeorol. 19, 1397–1409. doi:10.1175/jhm-d-18-0072.1
Takeuchi, N., Dial, R., Kohshima, S., Segawa, T., and Uetake, J. (2006). Spatial distribution and abundance of red snow algae on the harding icefield, Alaska derived from a satellite image. Geophys. Res. Lett. 33. doi:10.1029/2006gl027819
Terashima, M., Umezawa, K., Mori, S., Kojima, H., and Fukui, M. (2017). Microbial community analysis of colored snow from an alpine snowfield in northern Japan reveals the prevalence of betaproteobacteria with snow algae. Front. Microbiol. 8, 1481. doi:10.3389/fmicb.2017.01481
Thackeray, C. W., and Fletcher, C. G. (2016). Snow albedo feedback: current knowledge, importance, outstanding issues and future directions. Prog. Phys. Geogr. 40, 392–408. doi:10.1177/0309133315620999
Thomas, W. H. (1972). Observations on snow algae in California 1, 2. J. Phycol. 8, 1–9. doi:10.1111/j.1529-8817.1972.tb03994.x
Thomas, W. H., and Duval, B. (1995). Sierra Nevada, California, USA, snow algae: snow albedo changes, algal-bacterial interrelationships, and ultraviolet radiation effects. Arct. Alp. Res. 27, 389–399. doi:10.2307/1552032
van der Walt, S., Schönberger, J. L., Nunez-Iglesias, J., Boulogne, F., Warner, J. D., Yager, N., et al. (2014). scikit-image: image processing in python. PeerJ 2, e453. doi:10.7717/peerj.453
Van Hees, D., Hanneman, C., Paradis, S., Camara, A., Matsumoto, M., Hamilton, T., et al. (2023). Patchy and pink: dynamics of a chlainomonas sp.(chlamydomonadales, chlorophyta) algal bloom on bagley lake, north cascades, wa. FEMS Microbiol. Ecol. 99, fiad106. doi:10.1093/femsec/fiad106
Virtanen, P., Gommers, R., Oliphant, T. E., Haberland, M., Reddy, T., Cournapeau, D., et al. (2020). SciPy 1.0: fundamental algorithms for scientific computing in Python. Nat. Methods 17, 261–272. doi:10.1038/s41592-019-0686-2
Keywords: snow, albedo, uncrewed aerial vehicle, algae, blooms
Citation: Chevrollier L-A, Wehrlé A, Cook JM, Guillet G, Benning LG, Anesio AM and Tranter M (2025) Mapping red algal blooms and their albedo-reducing effect on seasonal snowfields at Hardangervidda, Southern Norway. Front. Earth Sci. 13:1508719. doi: 10.3389/feart.2025.1508719
Received: 09 October 2024; Accepted: 21 January 2025;
Published: 19 February 2025.
Edited by:
Alun Hubbard, University of Oulu, FinlandReviewed by:
Tomonori Tanikawa, Japan Meteorological Agency, JapanStephen Brough, University of Liverpool, United Kingdom
Copyright © 2025 Chevrollier, Wehrlé, Cook, Guillet, Benning, Anesio and Tranter. This is an open-access article distributed under the terms of the Creative Commons Attribution License (CC BY). The use, distribution or reproduction in other forums is permitted, provided the original author(s) and the copyright owner(s) are credited and that the original publication in this journal is cited, in accordance with accepted academic practice. No use, distribution or reproduction is permitted which does not comply with these terms.
*Correspondence: Lou-Anne Chevrollier, bG91LmNoZXZyb2xsaWVyQGVudnMuYXUuZGs=