 Defu Wang1
 Chao Luo
94% of researchers rate our articles as excellent or good
Learn more about the work of our research integrity team to safeguard the quality of each article we publish.
Find out more
ORIGINAL RESEARCH article
Front. Earth Sci., 27 February 2025
Sec. Geohazards and Georisks
Volume 13 - 2025 | https://doi.org/10.3389/feart.2025.1498028
Slow-moving landslides pose significant long-term hazards in seismically active mountainous regions. However, their subtle deformation patterns and complex internal structures present challenges for accurate identification and monitoring using conventional methods. This study integrates remote sensing technologies, including InSAR, DIC, LiDAR, and UAV photogrammetry, to comprehensively analyze the Shibatai creep landslide in the Wenchuan earthquake-affected area. Results reveal that the landslide exhibits a four-stage evolution process, from initial gravity-induced creep to earthquake disturbance, rainfall influence, and multi-level sliding formation. The study identifies six secondary sliding bodies within the landslide, with the most intense deformation occurring at their boundaries. Notably, DIC and UAV technologies demonstrated superior performance in detecting significant deformation features, aligning closely with field observations. The research proposes a multi-scale, multi-technology combination strategy for landslide investigation, emphasizing the complementary nature of different remote sensing techniques. Furthermore, the study highlights the importance of focusing on main deformation areas, particularly at the boundaries of secondary blocks, for efficient field verification and monitoring. These findings provide valuable insights for refining landslide identification processes, optimizing monitoring strategies, and enhancing risk assessment in post-earthquake environments.
Landslides represent one of the most pervasive and destructive natural hazards globally, causing thousands of casualties annually and inflicting significant economic losses (Fang et al., 2023a). These geological disasters pose a persistent threat to human lives, infrastructure, and economic development in mountainous regions worldwide. Of particular concern are slow-moving landslides, which often exhibit long-term creep deformation before catastrophic failures (Zhan et al., 2024). These gradual movements, while less dramatic than rapid landslides, can persist for years or even decades, slowly compromising the stability of slopes and potentially leading to devastating consequences if left undetected or unmanaged.
The catastrophic Wenchuan earthquake (Ms 8.0) that struck Sichuan Province, China, on 12 May 2008, serves as a stark reminder of the long-lasting impact of seismic events on landscape stability. This devastating event not only triggered numerous coseismic landslides but also generated substantial amounts of loose deposits on hillslopes (Huang and Li, 2014). These seismically induced slope instabilities have set in motion a prolonged period of geological adjustment, with landslide activities expected to continue for 20 years or more after the earthquake (Li et al., 2018). Many of these post-earthquake landslides have entered a stage of slow, continuous deformation, exhibiting characteristics of creep activity. Although these slow-moving landslides may appear benign due to their gradual nature, they often remain concealed and can pose serious threats to the lives and property of residents living on or near the landslide body. The danger becomes particularly acute if accelerated deformation occurs due to external triggering factors such as heavy rainfall or human activities (Lacroix et al., 2020). The complex and often subtle nature of slow-moving landslides presents significant challenges for their identification, monitoring, and risk assessment. Traditional field-based methods, such as inclinometers and GPS surveys, are often limited in monitoring slow-moving landslides. These methods provide point-based measurements, which may miss deformation outside the instrumented area and are labor-intensive and costly for large-scale applications. Recent advancements in physical modeling, such as centrifuge modeling, have highlighted these limitations and provided insights into complex landslide processes (Fang et al., 2023a). In response to these challenges, remote sensing technologies have emerged as powerful tools in the field of landslide research, offering significant advantages in terms of large-scale coverage, high temporal resolution, and the ability to detect subtle surface changes (Lin et al., 2021; Zhao et al., 2012; Jaboyedoff et al., 2012; Lucieer et al., 2014).
The array of remote sensing techniques applicable to landslide studies is diverse, including high-resolution optical imagery, Interferometric Synthetic Aperture Radar (InSAR), Light Detection and Ranging (LiDAR), and Unmanned Aerial Vehicle (UAV) photogrammetry. Each of these technologies brings unique capabilities to landslide investigation: High-resolution optical imagery provides a rich historical archive and enables visual interpretation of landslide features (Lissak et al., 2020). However, its effectiveness can be limited by cloud cover and dense vegetation, which may obscure subtle surface deformations (Zhu et al., 2019). InSAR technology has revolutionized landslide monitoring by enabling the detection of millimeter-level ground displacements over vast areas. This capability makes InSAR invaluable for identifying and monitoring slow-moving landslides that might otherwise go unnoticed. However, the technique can be affected by temporal decorrelation in areas of dense vegetation or rapid land cover changes (Zhao et al., 2012). LiDAR offers unparalleled capabilities in generating high-resolution, three-dimensional topographic data. Its ability to penetrate vegetation canopy makes it excellent for identifying subtle geomorphological features associated with landslides. However, the high cost of LiDAR surveys can limit its application in large-scale or long-term monitoring programs (Jaboyedoff et al., 2012; Xu et al., 2023).UAV photogrammetry has gained popularity due to its flexibility, high spatial resolution, and cost-effectiveness for small to medium-scale surveys. UAVs can be rapidly deployed to capture detailed imagery of landslide areas, enabling the creation of high-resolution orthophotos and digital elevation models (Lucieer et al., 2014).
Despite the individual strengths of these technologies, each has its limitations, making it challenging for any single remote sensing technique to comprehensively and accurately identify and assess landslides (Xu et al., 2023; Dai et al., 2023). For instance, while InSAR can accurately measure extensive landslide deformations, creep landslides detected by InSAR often lack obvious deformation evidence, such as cracks and downward scarps, during field surveys (Xu et al., 2022; Lissak et al., 2020). This limitation underscores the need for integrated approaches that combine multiple remote sensing technologies. Recognizing these challenges, an increasing number of researchers are adopting multi-technology approaches to landslide detection across various stages and scales. The combination of InSAR and optical remote sensing images has proven effective in broad-scale active landslide detection (Xu et al., 2023; Xu et al., 2019; Lu et al., 2024), as well as in the study of individual landslides (Xie et al., 2020; Wang et al., 2021). More comprehensive studies have integrated additional technologies to provide multi-dimensional insights into landslide dynamics. For example, researchers have combined InSAR, UAV photogrammetry, and optical remote sensing to study the morphological changes, spatiotemporal evolution, and destruction mechanisms of landslides such as the Jiangou, Jiangdingya, and Shanyang landslides (Zhan et al., 2024; Zhu et al., 2021; Ma et al., 2021). Others have explored the integration of LiDAR with UAV photogrammetry for detailed feature extraction (Wang et al., 2024) or combined InSAR, LiDAR, and high-resolution optical imagery for potential landslide identification (Dong et al., 2022). The Aniangzhai landslide study demonstrated the power of integrating InSAR, LiDAR, and UAV photogrammetry for comprehensive landslide assessment (Dai et al., 2023), while the Gokseong landslide investigation further incorporated UAV multispectral data to enhance analysis capabilities (Choi et al., 2024).
A particularly promising development in landslide research is the application of digital image correlation (DIC) technology (Paz and Malcolm, 2016; Caporossi et al., 2018; Bickel et al., 2018). DIC calculates high-resolution horizontal displacement from multi-temporal images, offering new deformation information for landslide movement. When combined with InSAR technology, DIC effectively compensates for the limitations of line-of-sight (LOS) deformation detection, providing a more comprehensive view of landslide dynamics. This powerful combination has been successfully applied in studies of various slow-moving landslides, including the Home Hill landslide (Lucieer et al., 2014), Harmaliere landslide (Paz and Malcolm, 2016; Lacroix et al., 2018), MAPE landslide (Bivic et al., 2017), Mindu landslide (Yang et al., 2020), and Bage landslide (Ding et al., 2021), demonstrating significant effectiveness in unraveling the complex behavior of these gradual yet potentially destructive geological phenomena.
In light of the complexity of slow-moving landslides and their persistent threat in post-earthquake environments, this study aims to conduct a comprehensive analysis of the Shibatai creep landslide in the Wenchuan earthquake-affected area by integrating multiple remote sensing technologies, including InSAR, DIC, LiDAR, and UAV. Our objectives are to evaluate the effectiveness of various remote sensing techniques in identifying and characterizing slow-moving landslides, analyze the spatiotemporal deformation patterns and morphological features of the landslide, investigate its movement mechanism and evolution stages, and develop an optimal framework for combining remote sensing technologies for landslide identification and monitoring at different scales. Additionally, this research will explore how to utilize multi-source remote sensing data to refine landslide identification and field verification processes. By achieving these goals, we aim not only to advance the scientific understanding of landslide processes but also to provide practical insights for future landslide monitoring strategies and risk management practices in seismically active mountainous regions, ultimately enhancing our ability to predict, assess, and mitigate landslide hazards and protect vulnerable communities.
The Shibatai landslide (103°35′38.3″E, 31º27′50.8″N) is located in southeastern Wenchuan County, Sichuan Province, China (Figure 1A). The regional geological structure is part of the Longmenshan Fault seismic activity zone and is near the Wenchuan-Maoxian Fault. The fault trends NNE-NE and consists of a series of imbricate reverse faults that dip northwest. Significant activity was observed during the early Pleistocene, continuing into the middle and late Pleistocene (Huang, 2009) (Figure 1B). The surrounding geomorphological type of the landslide comprises erosional high mountain terrain, characterized by steep upper slopes and gentler lower slopes, with some local slopes exceeding 70°. The landslide strata are part of the Devonian Yuelizhai Group (Dy1), consisting of dark gray phyllite, limestone, and sandstone (Figure 1C), overlain by Quaternary residual slope deposits (Q4el + dl), colluvial layers (Q4col), and landslide deposits (Q4del). The residual slope deposits mainly consist of gravel, sandy soil, and strongly weathered loess (Figure 1D).
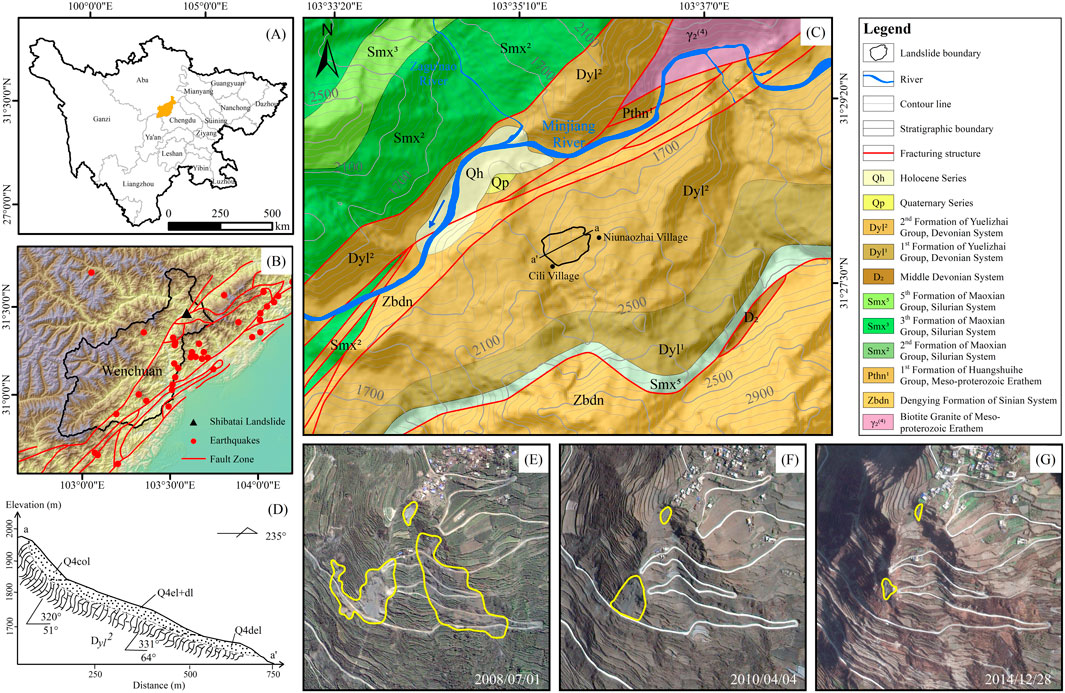
Figure 1. Geological and imaging characteristics of the Shibatai landslide area. (A) Geographic location of the landslide; (B) Regional seismicity and fault distribution; (C) Regional stratigraphic lithology; (D) Longitudinal section showing landslide structure; (E) Landslide image from 1 July 2008; (F) Landslide image from 4 April 2010; (G) Landslide image from 12 December 2014.
Intense mountain earthquakes often triggered numerous coseismic landslides, resulting in severe damage to surface vegetation (Li et al., 2022). According to multi-temporal remote sensing images acquired by Google Earth Engine from July 2008 to December 2014 (Figures 1E–G), the central part of the slope had been subject to a large-scale landslide following the Wenchuan earthquake. After more than a decade of vegetation recovery, the landslide traces on the slope surface were no longer evident in images. However, reports from frontline geological disaster prevention personnel in 2022 indicated that the walls of houses in the middle and lower parts of the landslide had continued to deform and bend due to rainfall. This indirectly suggested that the loosening of the slope caused by the earthquake had affected the post-earthquake stability of the slope for nearly 14 years.
This study utilized multiple remote sensing technologies, including InSAR, DIC, LiDAR, and UAV photography, for detailed interpretations of the Shibatian landslide’s deformation displacement, morphological structure, and micro-geomorphological features. Conclusions were drawn through comprehensive comparison and cross-validation (Figure 2). The technical process was as follows: 1) For landslide deformation displacement analysis, SBAS-InSAR technology was used to process multi-temporal SAR images to obtain LOS deformation and analyze overall deformation and spatiotemporal patterns of the landslide. DIC technology processed two periods of optical satellite images to obtain horizontal displacement, assessing macro changes and severely deformed areas of the landslide. 2) For landslide morphological contour and micro-geomorphological feature identification, LiDAR point cloud data was used to generate high-precision DEM and high-resolution UAV optical images, identify the three-dimensional morphology of the landslide, delineate boundary zones, and identify micro-geomorphological features. 3) The LOS deformation, DIC horizontal displacement, and boundary contours obtained by these methods were compared and analyzed to achieve refined identification and analysis results. 4) Based on comparison and field verification results, the landslide movement mechanism, the practicality of multi-source combination technology, and remote sensing application insights were discussed. Table 1 summarizes the specifics of the dataset used in this study.
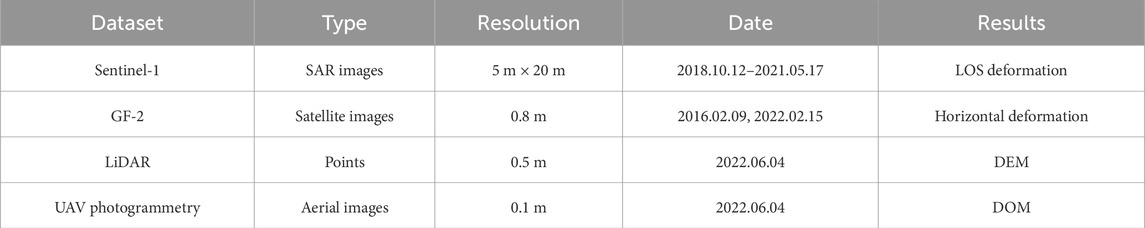
Table 1. Research dataset.
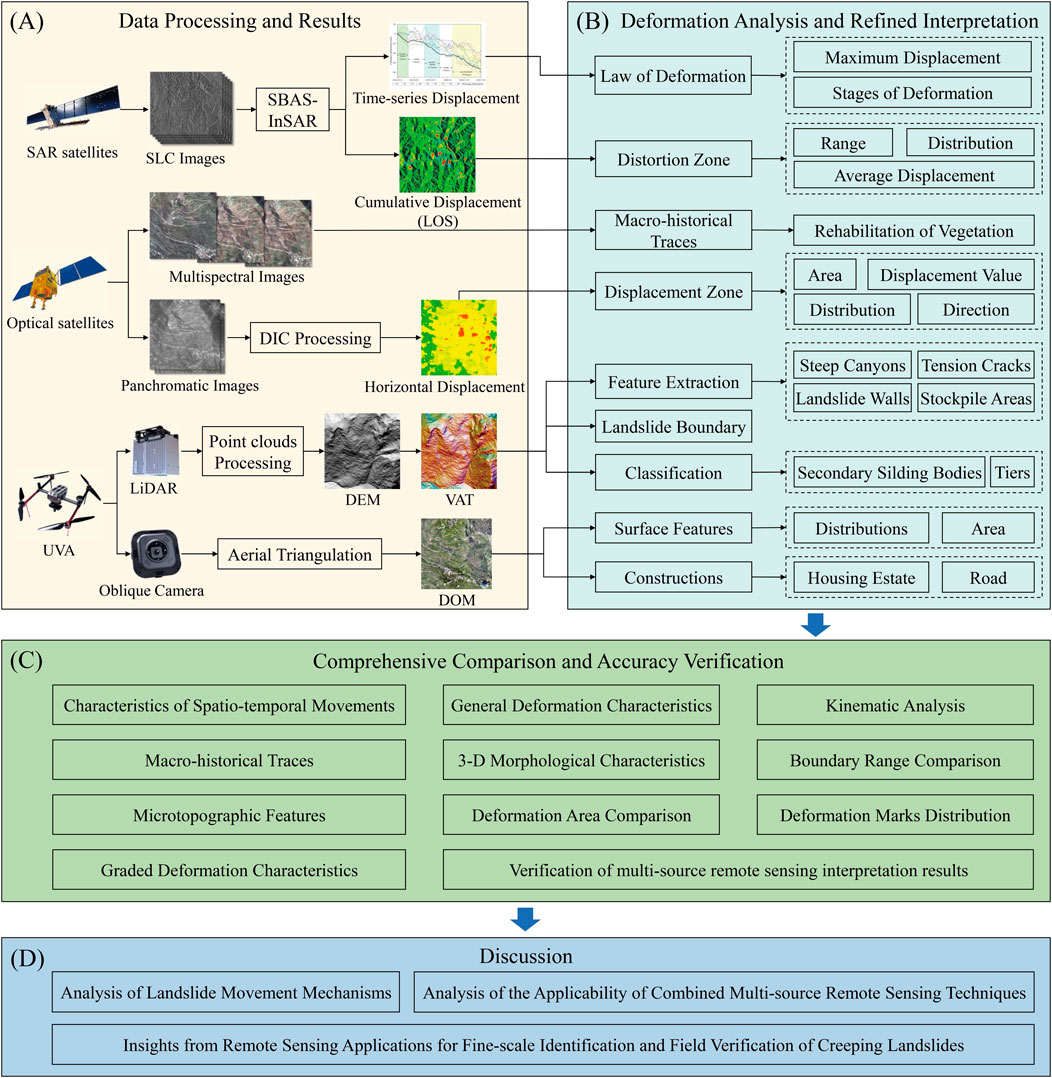
Figure 2. Technical flowchart of the multi-source remote sensing approach, illustrating the integration of InSAR, DIC, LiDAR, and UAV technologies for landslide analysis. (A) Data processing and results; (B) Deformation analysis and refined interpretation; (C) Comprehensive comparison and accuracy verification; (D) Discussion.
This study employed the Small Baseline Subset Interferometric Synthetic Aperture Radar (SBAS-InSAR) technique, a time-series InSAR method capable of detecting slow-moving deformations with millimeter-level precision by stacking SAR interferograms (Berardino et al., 2002). Compared to traditional D-InSAR, the SBAS-InSAR method overcame spatial and temporal decorrelation issues (Dai et al., 2023), making it particularly suitable for high-precision and temporally continuous monitoring of large-scale surface deformations. In this study, we used GAMMA software to process C-band Sentinel-1 SAR satellite images from the European Space Agency to detect landslide deformation. Specifically, we collected and processed 104 ascending and 96 descending images, totaling 200 images, from 12 October 2018, to 17 May 2021, providing 31 months of continuous observation data. We processed C-band Sentinel-1 SAR images using GAMMA software, setting temporal and spatial baselines to 120 days and 202 m, respectively, to balance coherence and deformation signal capture. To enhance processing accuracy, we used a 1:10,000 scale digital elevation model (DEM) with 10-m resolution to eliminate flat-earth effects and topographic phases. For interferometric processing parameter settings, we set the temporal baseline to 120 days and the spatial baseline to 202 m. These parameter choices were based on a comprehensive consideration of the study area’s surface deformation characteristics and image quality. Adaptive filtering was applied during interferogram generation to reduce phase noise. Tropospheric correction was performed using the Generic Atmospheric Correction Online Service for InSAR (GACOS), and precise orbit data refined satellite orbit parameters. The longer temporal baseline (120 days) allowed us to capture slow defohile the moderate spatial baseline (202 m) helped maintain high interferometric coherence. The SBAS-InSAR processing involved several key steps: SAR image registration, interferogram generation, topographic phase removal, phase unwrapping, orbit refinement, atmospheric correction, and time-series inversion.
Digital Image Correlation (DIC) is an advanced optical method for monitoring surface deformation. It accurately measures large-scale horizontal displacements by analyzing changes in surface texture (He et al., 2019). DIC excels in detecting north-south displacements and resists noise from dense vegetation, effectively complementing InSAR technology (Ding et al., 2016). This study used a frequency-domain phase correlation algorithm with the COSI-Corr software developed by the California Institute of Technology, achieving sub-pixel accuracy of up to 1/20 pixel (Leprince et al., 2007). Based on the best image pair principle (Yang, 2020), we selected two GF-2 satellite images from 9 February 2016, and 15 February 2022, with a resolution of 0.8 m. The processing workflow included four main steps: 1) image preprocessing, involving selection of the best image pair, cropping, registration, resampling, and masking; 2) cross-correlation calculation to obtain deformation images in east-west (E-W) and north-south (N-S) directions; 3) error post-processing, including handling decorrelation noise, stripe errors, systematic displacement compensation, and filtering; and 4) final calculations to determine total displacement and movement direction based on the processed E-W and N-S deformation images. For parameter settings, we used an initial window of 128 × 128 pixels, a final window of 16 × 16 pixels, a step size of 1 × 1 pixel, a masking threshold of 0.9, and 5 iterations to balance computational accuracy and efficiency. This method not only provided high-precision horizontal displacement information capable of detecting millimeter-level surface deformations but also effectively complemented InSAR technology’s limitations in monitoring large gradient deformations and vegetation-covered areas.
Airborne LiDAR, with its high accuracy, high density, and ability to penetrate vegetation, effectively eliminates the impact of vegetation cover on landslide identification and monitoring, thereby providing 3-D information on the actual ground surface. This is particularly useful for the densely vegetated, rugged terrain of the western mountainous regions (Xu, 2020). Visualization methods derived from LiDAR-DEM clearly and accurately delineate the boundaries of landslide activities and micro-geomorphic features. In this study, LiDAR point clouds from 14 June 2022, were acquired using the D-LiDAR2000 laser radar sensor mounted on the FEIMA D2000 aerial photography platform. The average density of the point cloud exceeded 150 points/m2. Through spatial interpolation of the filtered ground point clouds, DEM data with an accuracy of better than 0.5 m was produced.
Hillshading images are commonly used for DEM visualization; however, due to the sun’s azimuth and altitude angles, some micro-geomorphic features may not be effectively displayed. To enhance the stereoscopic and micro-geomorphic display effects of DEM visualization, the Visualization for Archaeological Topography (VAT) method (Kokalj and Somrak, 2019) was employed, combining mountain shading, slope, positive openness, and sky view factors. This method retains the advantages of the four aforementioned visualization techniques while enhancing the recognition of micro-geomorphic features (Verbovšek et al., 2019). The VAT parameter settings are provided in Table 2, and the generated results are displayed in Figure 3C.
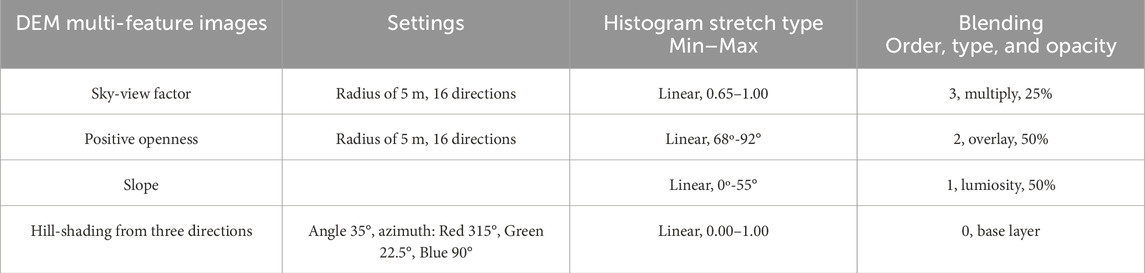
Table 2. Parameter settings for VAT.
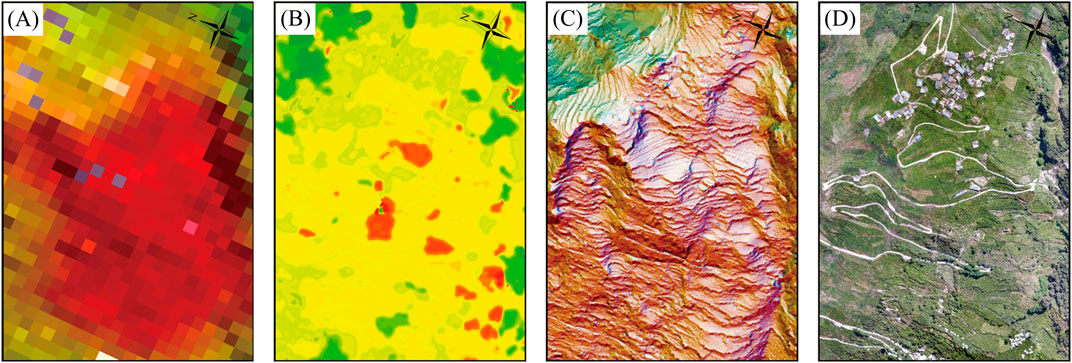
Figure 3. Processing results of multi-source remote sensing techniques. (A) SBAS-InSAR deformation map showing line-of-sight (LOS) displacement rates; (B) DIC-derived horizontal displacement map; (C) LiDAR-DEM visualization using the VAT method; (D) High-resolution UAV-derived orthophoto (DOM).
Unmanned Aerial Vehicle (UAV) aerial images provide centimeter-to-decimeter resolution, enabling detailed observation of surface deformation and slope damage. However, vegetation can reduce identification accuracy. The D-OP3000 oblique photography module is also mounted on the FEIMA D2000 aerial photography platform to obtain aerial images, aiding in the refined interpretation and identification of landslide elements. Using position and orientation system (POS) data, aerial triangulation, and mosaic cropping, we generated a Digital Orthophoto Map (DOM) with a resolution better than 0.1 m, as shown in Figure 3D.
Based on the detailed analysis of spatiotemporal movement patterns derived from InSAR data, we visualized the line-of-sight (LOS) deformation distribution in the study area (Figure 4A), which was a vector point map converted from the SBAS-InSAR deformation raster image (Figure 3A). The line-of-sight (LOS) deformation rates of the slope ranged from −1.6 mm/a to −23.6 mm/a, with negative values indicating movement away from the satellite along the LOS direction. Nine deformation points (P1-P9) were strategically selected to form a grid-like monitoring network, covering the rear edge, central portion, and front edge of the landslide. These points were chosen based on spatial coverage, deformation intensity, and alignment with key geomorphological features (e.g., scarps, cracks, and secondary sliding bodies), ensuring a representative distribution of deformation patterns across the landslide. This systematic selection ensured that the points captured the full range of deformation behaviors, from slow creep to active sliding zones, and aligned with field observations and other remote sensing data. The average deformation rate for the entire slope was −12.7 mm/a, covering an area of 27.79 × 10⁴ m2, and exhibiting an elliptical distribution on the slope.
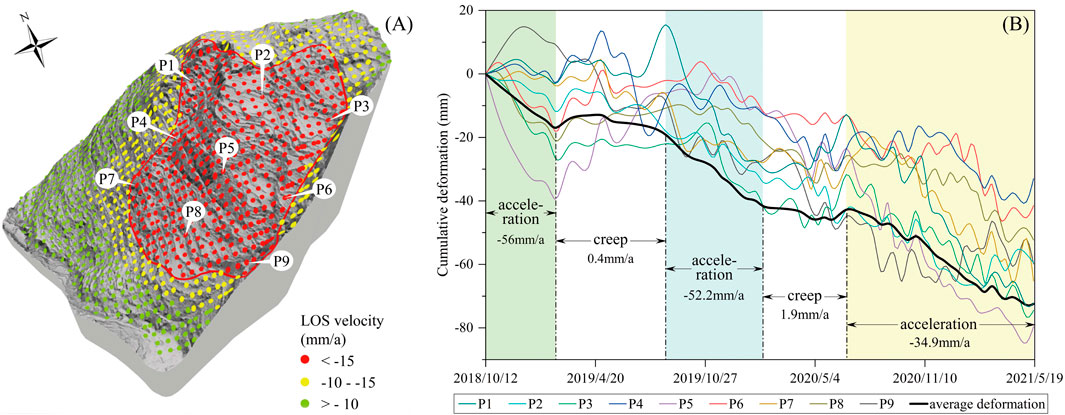
Figure 4. Analysis of spatiotemporal motion patterns based on InSAR. (A) Line-of-sight (LOS) deformation distribution with key monitoring points (P1–P9); (B) Cumulative deformation curves for Points 1–9, showing deformation characteristics across five stages.
To comprehensively reflect the slope development characteristics and deformation patterns, nine deformation points (P1 to P9) were selected as control points at key locations parallel and perpendicular to the main sliding direction of the landslide, forming a grid-like monitoring network. According to the deformation rate curves, P4 showed relatively small deformation, while P5 exhibited stronger deformation, with a maximum cumulative deformation reaching −79.6 mm. The deformation intensity from strong to weak was in the order of P2, P1, P5, P6, P3, P6, P8. Laterally, the deformation rates at the rear edge (P1-P2-P3) were generally smaller than those at the front edge (P7-P8-P9), with a larger deformation area on the left side of the rear edge (P9). Longitudinally, comparing deformation points P1-P4-P7, P2-P5-P8, and P3-P6-P9, it was found that the deformation area on the right side of the front edge was larger. To assess the overall deformation of the slope body, 431 deformation points within the main deformation area (red curve in Figure 4A) were statistically analyzed to obtain the average deformation amount for each period. To avoid the interference of individual extreme points on the statistical results, the Iteratively Reweighted Least Squares (IRLS) method was employed (Koch, 1999), with the results represented by the black curve in Figure 4B.
Between 12 October 2018, and 19 May 2021, the landslide experienced five deformation stages: acceleration, creep, acceleration, creep, and acceleration. The first and third stages had average deformation rates exceeding −50.0 mm/a. Although the fifth stage showed slower deformation, it still indicated continuous subsidence.
This study utilized Digital Image Correlation (DIC) technology to conduct a comprehensive analysis of ground deformation in the research area. The results (Figure 3B) revealed 14 significant ground deformation zones within the study area, with cumulative deformation ranges from 0 to 5.84 m (Figure 5A). By comparing satellite images from 2016 to 2019, notable changes were observed in some areas, such as reservoir water level decrease and road route modifications (Figure 5B). The displacement frequency distribution showed multi-peak patterns, reflecting diverse deformation across regions (Figure 5C). Area 8 had the largest average displacement (2.949 ± 0.570 m) and variability, while Area 1 had the smallest (2.510 ± 0.037 m) and least variability. Most areas had average displacements concentrated between 2.65–2.75 m, indicating a widespread deformation trend in the study area (Figure 5D). These findings not only revealed the spatial distribution and temporal evolution characteristics of ground deformation but also provided an important basis for identifying high-risk areas and formulating corresponding disaster prevention and mitigation strategies.
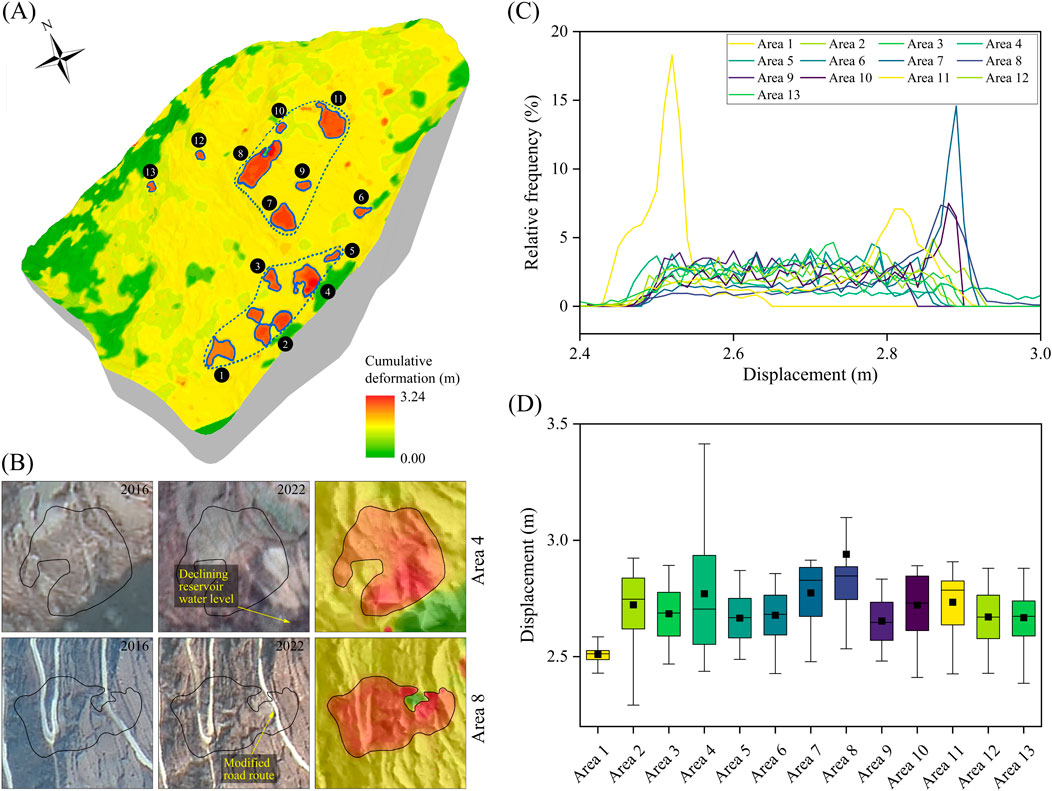
Figure 5. Ground deformation analysis results based on DIC technology. (A) Spatial distribution of 14 significant deformation zones; (B) Comparison of image changes in two typical areas (Area 4 and Area 8) between 2016 and 2022, showing reservoir water level decrease and road route modifications; (C) Relative frequency distribution of displacements across 14 areas; (D) Displacement magnitudes for each area.
VAT image analysis (Figure 3C) identified old landslides based on topography, showing distinct boundaries and typical landslide morphology (Figure 6A). This LiDAR data-based analysis method not only accurately depicted the overall contour of the landslide but also revealed its internal structure and secondary deformation features. The overall slope was steep, with a distinct steep scarp at the rear edge and visible displaced side walls on both sides. Multiple secondary deformation bodies were visible within the slope, with 10 developed cliffs irregularly distributed in semi-circular or arc shapes at the rear, middle, and front edges of the landslide. The identification of these detailed features highlighted the advantages of this method in identifying and extracting characteristics of old landslides. Measurement results showed that the elevation of the landslide rear edge was 2,040 m, while the front edge near the river was at 1,590 m, with a relative height difference of 450 m. The shape was approximately tongue-like, with a longitudinal length of about 770 m and a bottom width of about 520 m. The main sliding direction was 257°. The slope top was steep, and the bottom was gentle, with a planar area of approximately 37.28 m2 and an estimated volume of about 55.92 × 10⁴ m³. Based on the landslide elements analyzed in Figure 6A, using spatial combination analysis methods, combined with engineering geological mechanics and micro-geomorphological combination analysis, six secondary sliding bodies were identified on the slope (Figure 6B). This multi-level identification further demonstrated the method’s ability to identify the internal structure of old landslides under complex terrain conditions. According to the scale and spatial relationships of the landslide, it could be divided into four levels. The first level was the entire landslide body (HPT), which could be divided into two second-level secondary sliding bodies, H01 and H02. The third-level secondary sliding bodies H03 and H04, and the fourth-level secondary sliding body H06 were located above H01, while the third-level secondary sliding body H05 was located above H02. Data indicated that H04 had the most intense deformation, with a lateral tensile crack about 80 m long visible at its rear edge, almost perpendicular to the slope direction.
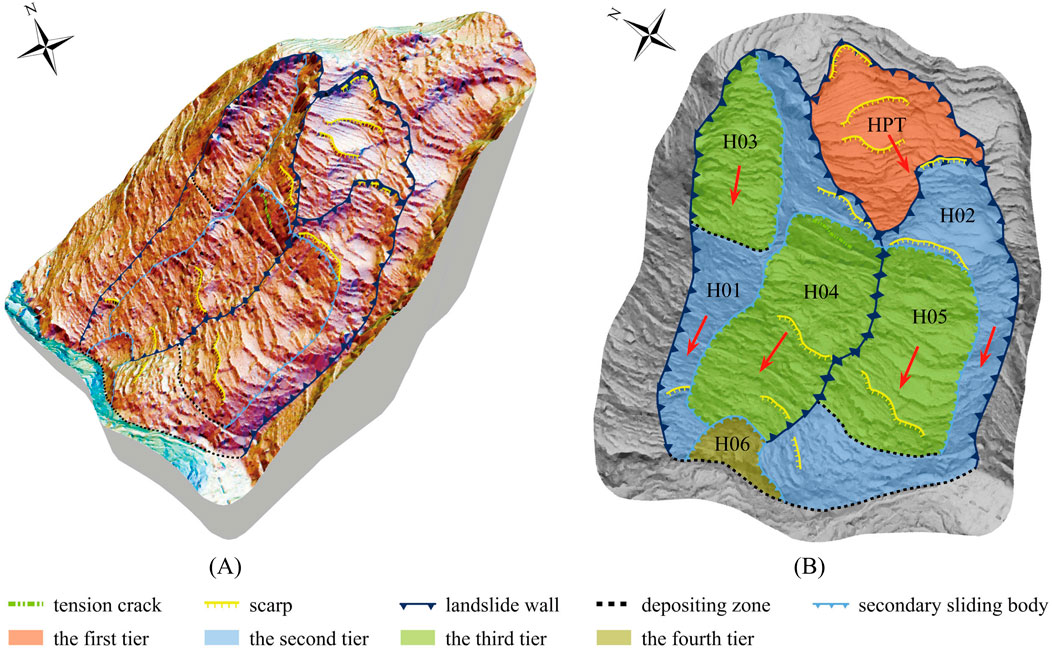
Figure 6. Landslide element and morphology identification. (A) Interpretation results using VAT visualization, showing landslide boundaries and secondary deformation features; (B) Multi-level sliding partitions, highlighting six secondary sliding bodies (H01–H06).
Figure 7 presented the interpretation results of recent deformation activities based on UAV imagery. Historical remote sensing images (Figures 1E–G) and UAV DOM (Figure 3D) indicated that although the overall vegetation recovery on the slope was good, this recovery also blurred the landslide boundaries and micro-geomorphological features, reducing overall interpretability. However, the slope surface still showed fresh landslide traces, with 16 surface landslide areas identified, mainly composed of loose gravel deposits (Figure 7A). These areas ranged from 105 m2 to 1,519 m2 in size, with an average area of 492 m2. Most surface landslide traces were concentrated in the middle part of the slope, showing varying degrees of deformation. Detailed analysis revealed three types of deformation: collapse areas (Figures 7B–D), sliding areas (Figures 7E–G), and deformation areas (Figures 7H–J). The three deformation types were classified based on distinct characteristics: collapse areas exhibited abrupt elevation changes (>1 m) and clear detachment scars; sliding areas showed continuous surface cracks (0.5–1 m displacement) and tilted structures; and deformation areas featured minor cracks (<0.5 m displacement) and subtle ground undulations, indicating initial stress redistribution. Each type of deformation had clear boundary delineations and direction indicators in the corresponding subfigures, comprehensively displaying the spatial distribution and characteristics of recent landslide activities in the study area.
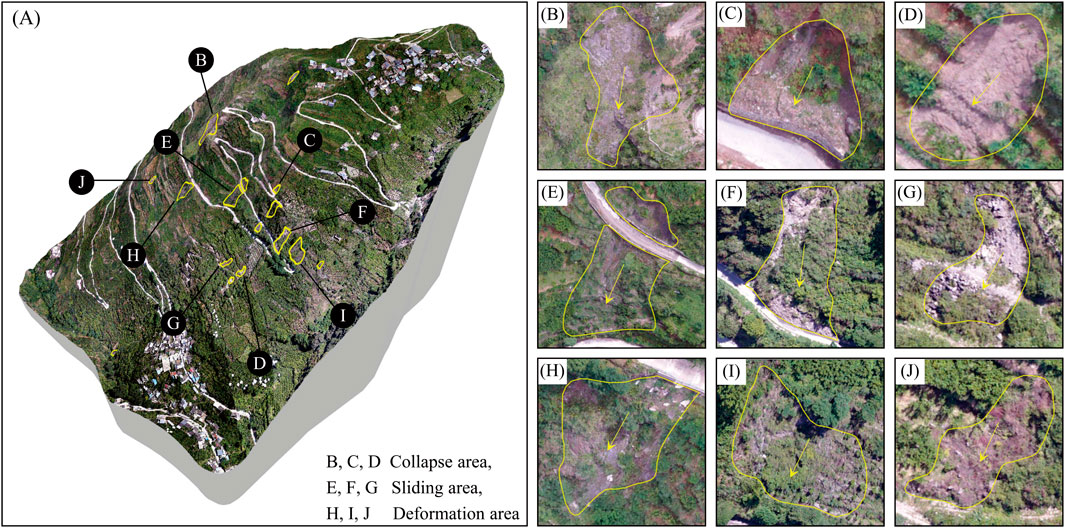
Figure 7. Interpretation of recent deformation activities based on UAV imagery. (A) Aerial view of the landslide area, highlighting multiple deformation zones (B–J); (B–D) Collapse areas with exposed land and visible soil/rock movement; (E–G) Sliding areas showing ongoing slow movement; (H–J) Deformation areas with minor surface changes.
Through spatial overlay analysis of landslide deformation scales identified by different data methods, we found significant differences in the identification results among various methods (Figure 8A). In terms of identified area, LiDAR and InSAR identified regions far larger than DIC and UAV, highlighting their advantages in identifying overall landslide outlines and deformation scales (Figure 8B). This result was consistent with the application effects of InSAR and LiDAR technologies in large-scale landslide surveys (Xu et al., 2023). Spatially, LiDAR and InSAR results were continuously distributed across the entire slope, while DIC and UAV results were more scattered, with sliding features mainly distributed in the upper and middle parts of the slope and side edges. This distribution difference reflected the complexity and non-uniformity of internal deformation in slow-moving landslides (Lacroix et al., 2020). There were also differences in the degree of overlap between methods (Figure 8C). InSAR provided millimeter-level LOS time series deformation results, while DIC, although less precise, was not limited by time and deformation measurement scale, being more sensitive to large gradient deformations in local areas. This complementarity highlights the necessity of comprehensively applying multiple techniques, especially in capturing large-scale surface displacements (Leprince et al., 2007).
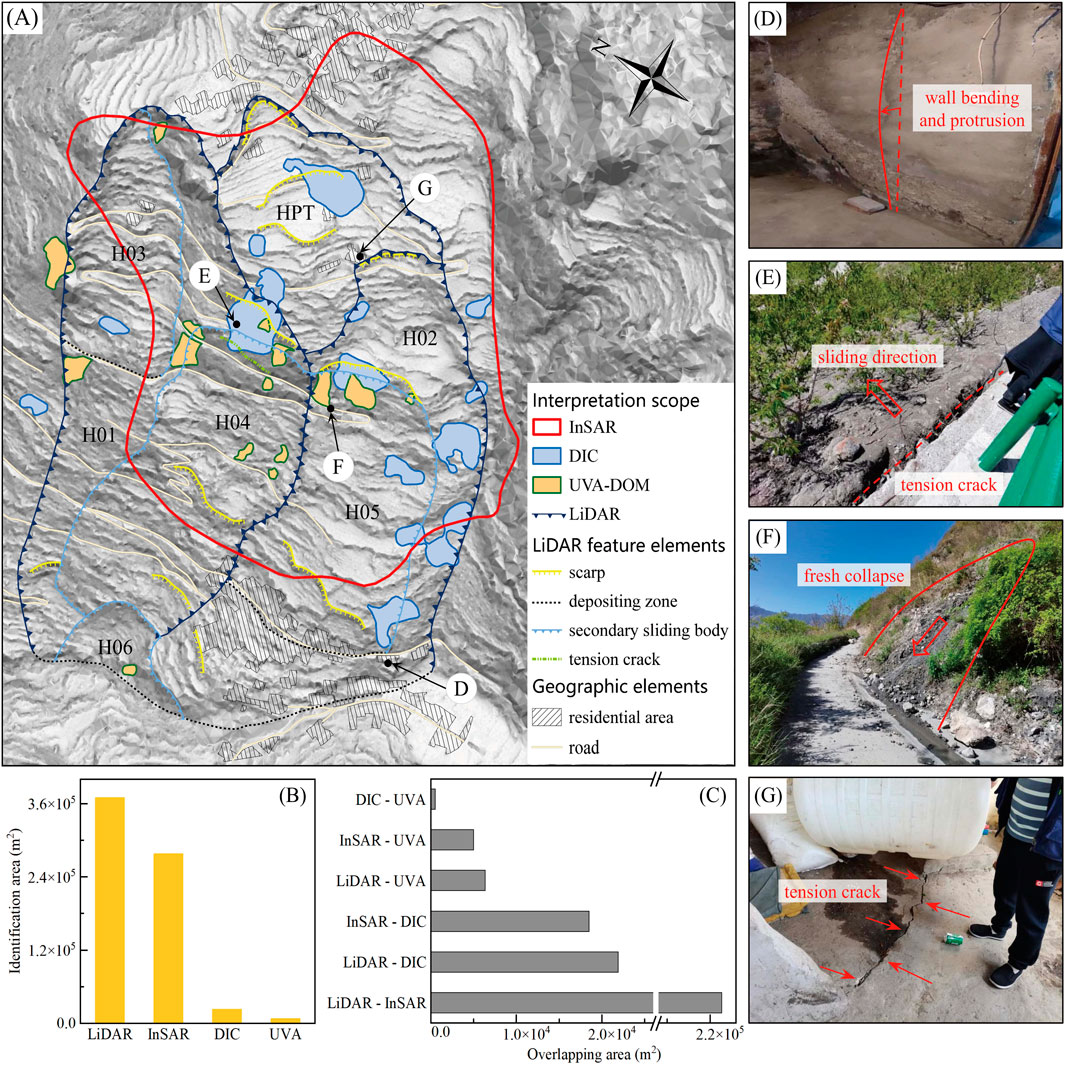
Figure 8. Comprehensive comparison of multi-source data interpretation results. (A) Spatial overlay of multi-source data interpretation results, showing the integration of InSAR, DIC, LiDAR, and UAV analyses. (B) Overlapping areas between DIC and UAV interpretations. (C) Overlapping areas between InSAR and UAV interpretations. (D) Field verification photo showing wall bulging at the slope foot. (E, F) Field verification photos of deformation slides in the middle slope. (G) Field verification photo of tensile crack deformation in the upper slope.
LiDAR-detected landslide boundaries aligned well with the slope’s micro-topographic features, and VAT images revealed more detailed elements. This highlights LiDAR’s importance in high-precision landslide surveys (Verbovšek et al., 2019). In contrast, although InSAR-detected deformation boundaries extend beyond the actual landslide boundaries and show lower consistency with micro-topographic features, they effectively capture the spatiotemporal motion characteristics of landslides, supporting long-term monitoring (Berardino et al., 2002). DIC-derived horizontal displacements and movement directions were more precise and localized than InSAR results, especially in identifying significant deformation areas. The surface damage features captured by UAV directly reflected the current deformation state of the landslide, providing strong support for rapid assessment (Jaboyedoff et al., 2012). Overall, each method had its unique advantages and limitations, influenced by factors such as terrain, vegetation cover, and data quality. This diversity of technical characteristics emphasizes the importance of adopting multi-dimensional, multi-directional technical combinations in landslide analysis (Casagli et al., 2023). Smart measurement techniques, such as multi-smartphone photogrammetric systems (Fang et al., 2024) and multi-field monitoring (Fang et al., 2023b), offer significant advantages in landslide monitoring. These methods provide high-resolution, real-time data on surface and subsurface deformations, enabling better understanding of slope behavior and failure mechanisms. For instance, multi-field monitoring can capture area, line, and point information, offering comprehensive insights into slope deformation stages. Such systems are cost-effective, easy to assemble, and capable of detecting changes with centimeter-level accuracy, making them valuable tools for early warning and risk assessment. By integrating the advantages of different technologies, we can obtain a more comprehensive and accurate understanding of landslide characteristics, laying a solid foundation for subsequent monitoring and early warning work.
While the integration of multi-source remote sensing data provides comprehensive insights, potential sources of error must be acknowledged. These include temporal and spatial decorrelation in InSAR data, misregistration in DIC processing due to terrain relief or cloud cover, vegetation occlusion in LiDAR and UAV data, and subjective interpretation during field verification. To mitigate these errors, we employed optimized baseline thresholds and atmospheric correction for InSAR, rigorous co-registration and filtering for DIC, high-density point clouds and VAT visualization for LiDAR, and systematic cross-verification with remote sensing data for field observations. These measures enhance the reliability of our results and provide a transparent framework for future studies.
To ensure the reliability of the analysis results, we conducted field verification in June 2022. During the 5-h detailed inspection from the slope foot to the top, we focused on looking for evidence of ground cracks, rock and soil sliding, and tensile displacements. This systematic field verification method not only validated the results of remote sensing analysis but also provided direct observations for understanding the actual state of the landslide (Fang et al., 2023a). In the residential area at the slope foot, we found some walls bulging outward (Figure 8D), located at the front shear outlet of the secondary landslide H05. In the middle part of the slope, at the boundary of secondary landslides H04 and H05, two obvious deformation slides were observed (Figures 8E, F). In a residence in the upper part of the slope, at the rear boundary of secondary landslide H02, a significant tensile crack deformation was discovered (Figure 8G). This deformation distribution pattern is consistent with the long-term impact characteristics of post-earthquake landslides, reflecting the different degrees of deformation that may occur in different parts of the slope after seismic disturbance (Huang and Li, 2014).
Field verification showed that DIC and UAV results matched field conditions best, while LiDAR and InSAR results had lower consistency. This result further confirms the effectiveness of DIC technology in identifying large-scale landslide movements (Bivic et al., 2017), while also highlighting the advantages of UAVs in capturing surface detail changes. This combination of multi-source remote sensing data and field verification not only improves the accuracy of landslide identification and monitoring but also provides valuable insights into the performance of different technologies in practical applications. Through this comprehensive analysis, we can better assess the applicability and limitations of various remote sensing technologies in landslide investigations, guiding future technology selection and application (Xu et al., 2023).
Based on spatiotemporal deformation and morphological feature analysis, combined with geological processes, we identified the Shibatai landslide as a typical creep landslide. This type of landslide is common in loose soil slopes or rock slopes with poor sliding conditions, exhibiting obvious time-dependent deformation characteristics. The landslide body has experienced multiple repetitive deformation processes from initial deformation to final instability and failure, which can be divided into three stages: “initial deformation, uniform velocity deformation, and accelerated deformation” (Lin et al., 2024). This staged evolution pattern is highly consistent with the long-term evolution characteristics of landslides observed after the Wenchuan earthquake, further confirming the possible long-term creep process that earthquake-induced landslides may undergo (Li et al., 2018). According to the comprehensive analysis results, the Shibatai landslide’s deformation can be divided into four stages. Initially, gravity causes the slope to creep slowly, forming tensile cracks parallel to the slope surface at steep areas (Figure 9A). This initial stage fully reflects the key role of gravity in the initial deformation of landslides, consistent with the typical characteristics of the initial stage of slow-moving landslides (Lacroix et al., 2020). Subsequently, seismic disturbances caused severe deformation in the upper part of the slope, producing major control cracks perpendicular to the slope direction, with local damage and cracks appearing in the lower part of the slope (Figure 9B). This stage demonstrates the significant impact of earthquakes on slope structure, consistent with the typical characteristics of earthquake-induced landslides (Huang and Li, 2014).
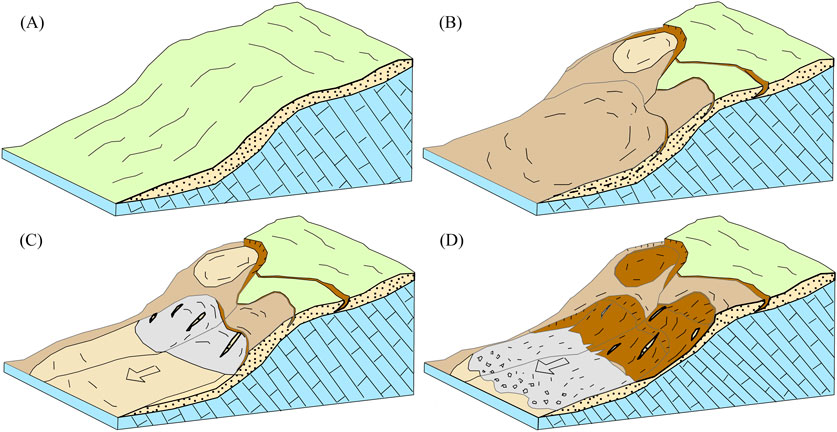
Figure 9. Schematic diagram of the movement stages and deformation characteristics of the Shibatai creep landslide. (A) Self gravity creep stage. (B) Earthquake disturbance damage stage. (C) Water infiltrated deformation stage. (D) Unstable sliding stage.
In the third stage, the effects of rainfall and irrigation water became more significant. Water infiltrated into previously formed cracks, changing the shear strength of the slope body, leading to the connection of multiple transverse tensile cracks and obvious subsidence of the slope body (Figure 9C). This process highlights the important role of rainfall in promoting the further development of post-earthquake landslides (Li et al., 2018). Finally, as deformation continued to develop, stress within the slope body began to redistribute, and potential shear surfaces were sheared through, ultimately forming multi-level sliding (Figure 9D). This stage reflects the complex deformation patterns that landslides may form during the destabilization process (Zhan et al., 2024). These stages are driven by distinct geological mechanisms: gravity-induced stress accumulation initiates creep, seismic disturbances disrupt slope stability, rainfall infiltration reduces shear strength, and stress redistribution leads to multi-level sliding. This progression highlights the interplay between gravitational, seismic, and hydrological factors in landslide evolution. Through this continuous, progressive analysis, we not only gained a deep understanding of the evolution process of the Shibatai landslide but also provided important references for landslide early warning and forecasting under similar geological conditions (Lin et al., 2024). Currently, the Shibatai landslide is in the third stage, exhibiting characteristics of a translational landslide. This judgment has important guiding significance for formulating subsequent monitoring and prevention measures. The findings reveal the complex interplay between geological, seismic, and hydrological factors in landslide evolution. The four-stage process and identification of six secondary sliding bodies highlight the importance of long-term monitoring to capture gradual changes and stress redistribution. The consistency between DIC-detected deformation and field observations underscores the potential of optical image correlation for rapid assessment and early warning in landslide-prone areas. It is worth noting that the evolution process of landslides is not an independent state but a continuous, interacting process. For example, the initial gravity action and crack formation provided conditions for subsequent earthquake and rainfall influences, while earthquakes and rainfall further exacerbated the instability of the slope body. This complex interaction mechanism emphasizes the necessity of adopting multi-dimensional, long-term monitoring strategies. Through continuous observation and analysis, we can better understand the dynamic change process of landslides, thereby providing a scientific basis for precise early warning and effective prevention. At the same time, this staged analysis method also provides a valuable reference framework for research on other similar creep landslides, contributing to improving our overall understanding and management capabilities for such complex geological hazards.
In the process of landslide investigation and monitoring, different remote sensing technologies demonstrate their respective advantages and limitations. Our study shows that LiDAR and InSAR technologies excel in capturing overall landslide outlines and slow deformation signals, while DIC and UAV technologies are more effective in detecting significant deformation features or sliding traces. This technological difference not only reflects the characteristics of various methods but also highlights the importance of comprehensively applying multiple remote sensing technologies in landslide analysis (Xu et al., 2023; Casagli et al., 2023). To maximize the advantages of different technologies and improve the effectiveness of large-scale engineering applications, we conducted a comprehensive comparison of various methods, analyzing their advantages, limitations, and applicable scenarios (Table 3). At the same time, we used the Analytic Hierarchy Process (Fang et al., 2024) to evaluate multiple aspects such as data source richness, technical complexity, computational efficiency, data acquisition cost, and result accuracy (Figure 10A). This systematic evaluation method not only helps us better understand the characteristics of various technologies but also provides a scientific basis for selecting the most suitable technology combination in practical applications. The research results show that although DIC and InSAR have rich satellite resources, they also face some technical challenges, such as high registration accuracy requirements, susceptibility to cloud cover and image resolution effects, and dependence on SAR coherence. These challenges further emphasize the importance of selecting the best image pairs in practical applications (Yang, 2020). In contrast, LiDAR and UAV technologies, although having relatively fewer data resources, are mature technologies with lower processing difficulties. However, their high acquisition costs limit their use in large-scale applications, which is consistent with the challenges faced by LiDAR technology in large-scale applications (Jaboyedoff et al., 2012).
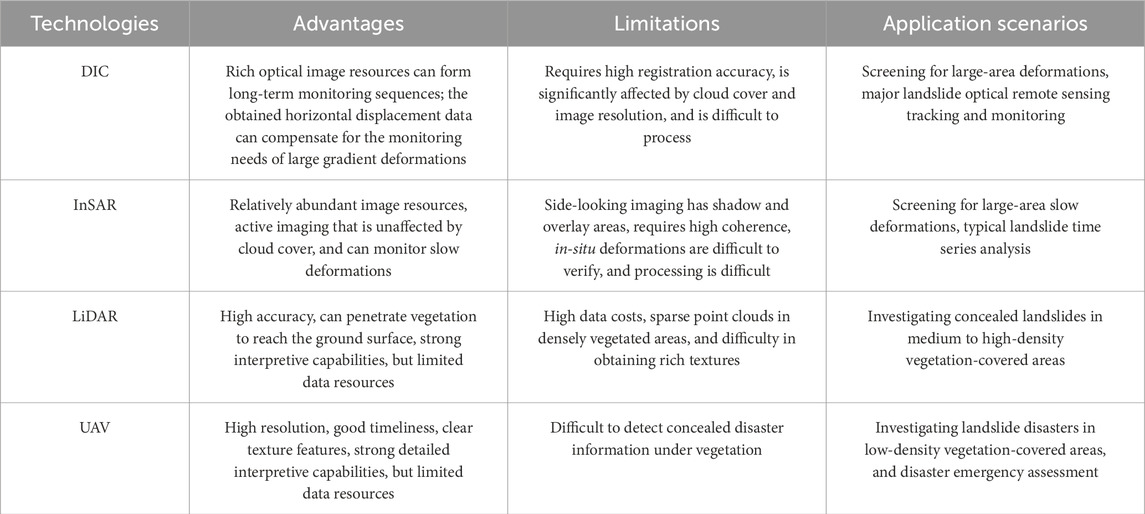
Table 3. Comparison of advantages and limitations of different technologies.
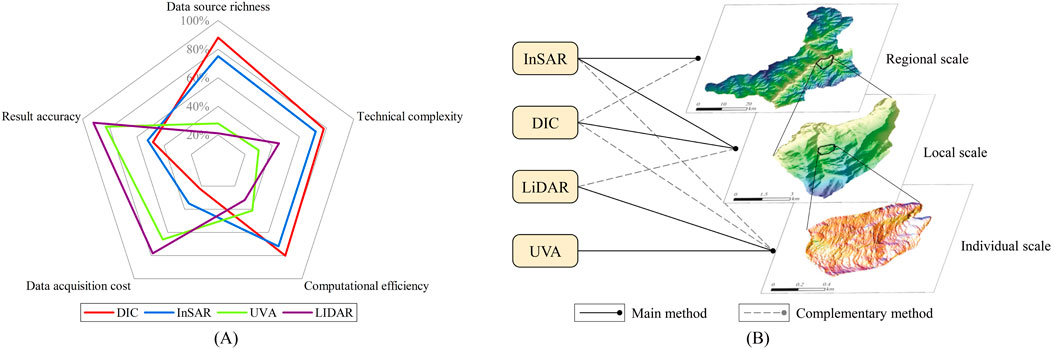
Figure 10. Comparison and applicable scenarios of different remote sensing technologies. (A) Comparison of Radar Images with Different Technologies. (B) Combination solutions for different technological applications.
Based on these analyses, we propose a remote sensing identification technology combination scheme for landslides at different scales and scenarios (Figure 10B). At the regional scale, we suggest prioritizing the use of InSAR technology, with DIC technology as a supplement to address InSAR monitoring blind spots and large deformation monitoring issues. This combination not only fully utilizes the advantages of InSAR but also compensates for its shortcomings through DIC technology, especially in detecting landslide precursor movements (Lacroix et al., 2018). At the local scale, for areas with low to medium vegetation density, we recommend using the InSAR + DIC technology combination to obtain LOS and horizontal displacement information, forming “multi-angle” deformation monitoring, thereby improving the accuracy of hazard identification. This multi-dataset investigation method can provide more comprehensive landslide analysis information (Caporossi et al., 2018). For high-density vegetation areas, the application of LiDAR technology can effectively remove vegetation effects and accurately delineate landslide boundary outlines, fully leveraging its advantages in penetrating vegetation to obtain surface information (Jaboyedoff et al., 2012). Optimizing the fusion of multi-source remote sensing data remains a key challenge. Future research should focus on developing advanced algorithms to integrate InSAR, LiDAR, UAV, and DIC data effectively, leveraging machine learning for automated data weighting and establishing standardized protocols for spatial-temporal registration. At the individual scale, especially in landslide investigations in key towns, residential areas, and densely populated areas, we suggest adopting a combination of UAV + LiDAR technology to obtain high-precision terrain information and accurately delineate landslide boundaries and features. At the same time, combining InSAR + DIC technology or specialized equipment for periodic monitoring forms a continuous assessment and analysis system. This comprehensive approach fully utilizes the advantages of various technologies and can provide more comprehensive and precise landslide monitoring information (Jaboyedoff et al., 2012).
Through this multi-scale, multi-technology combination strategy, we can not only overcome the limitations of single technologies but also choose the most suitable technology combination in different investigation stages and geographical environments. This flexible approach not only improves the accuracy and efficiency of landslide identification and monitoring but also provides a reliable technical framework for large-scale landslide investigation and long-term monitoring.
In the Wenchuan strong earthquake zone, frequent seismic activities have disturbed and damaged the internal structure of many slopes. The surfaces of these slopes are in a long-term slow deformation stage, with deformation rates ranging from millimeters to centimeters. However, certain parts within the landslide or at its edges may exhibit significant deformation, with rates ranging from decimeters to meters. This difference in deformation intensity across various parts of the same landslide increases the complexity of landslide identification and field verification. For instance, in the large-scale identification process of the Shibatai landslide in this study, using only InSAR and optical remote sensing technologies for detection initially delineated a potential hazard “target area” of 27.79 × 10⁴ m2. However, it took 5 h during the field verification process to discover obvious deformation evidence, such as tensile cracks. This situation highlights the importance of comprehensively applying multi-source remote sensing technologies in identifying potential hazards of slow-moving landslides (Lu et al., 2024).
The integrated application of multi-source remote sensing technologies can obtain morphological and deformation information from different angles, improving the refinement and reliability of landslide identification. However, in the current “space-air-ground” large-scale landslide investigation system, due to the vast survey area and urgent time requirements, often only InSAR and optical remote sensing technologies can be simply combined, which to some extent limits the full potential of remote sensing technologies (Xu et al., 2019). The results of this study show that the significant deformation areas observed in the field are highly consistent with the main deformation areas identified by DIC technology, reflecting the inadequacy of relying solely on InSAR and optical visual interpretation. Therefore, strengthening the application of DIC technology in landslide investigations becomes particularly important, as it can effectively detect major deformation areas, forming a comprehensive deformation target area including “slight deformation and severe deformation” (Yang et al., 2020). This comprehensive approach not only meets the detection needs of various deformation characteristics but also provides more precise guidance for ground verification, reducing the workload of comprehensive inspection from slope foot to top and avoiding blind verification. According to the field verification results in Section 4.2, significant evidence of landslide deformation was mainly concentrated at the front shear outlet of secondary landslide body H05, the adjacent boundary of secondary landslide bodies H04 and H05, and the rear boundary of secondary landslide body H02. These locations showed the highest consistency with the deformation areas identified by DIC and UAV. This finding suggests that in landslides with multiple internal fractured blocks, areas of strong deformation are often located at the boundaries or adjacent edges of these secondary blocks, which are likely to be the most significant areas of subsequent deformation changes in the landslide (Zhu et al., 2021; Ma et al., 2021).
Based on these observations, we suggest that future landslide identification and ground verification processes should focus on the main deformation areas of the landslide body. By analyzing landslide deformation patterns, such as compressive landslides (Figures 11A, B) and retrogressive landslides (Figures 11C, D), we can more accurately predict the areas where landslide deformation and damage are most likely to concentrate in the short term (Wang et al., 2024; Dong et al., 2022). This targeted approach not only improves the efficiency of field verification but also provides more precise information for landslide monitoring and early warning. Furthermore, this study emphasizes the importance of long-term monitoring in understanding the evolution process of slow-moving landslides. Through continuous multi-source remote sensing data collection and analysis, we can better capture the dynamic change process of landslides, identify potential accelerated deformation stages, and thus provide a scientific basis for timely warning and effective prevention (Ding et al., 2021; Huang, 2009). At the same time, this long-term monitoring strategy also helps us gain a deeper understanding of the impact of external factors such as earthquakes and rainfall on landslide evolution, providing important support for regional-scale landslide risk assessment (Li et al., 2022).
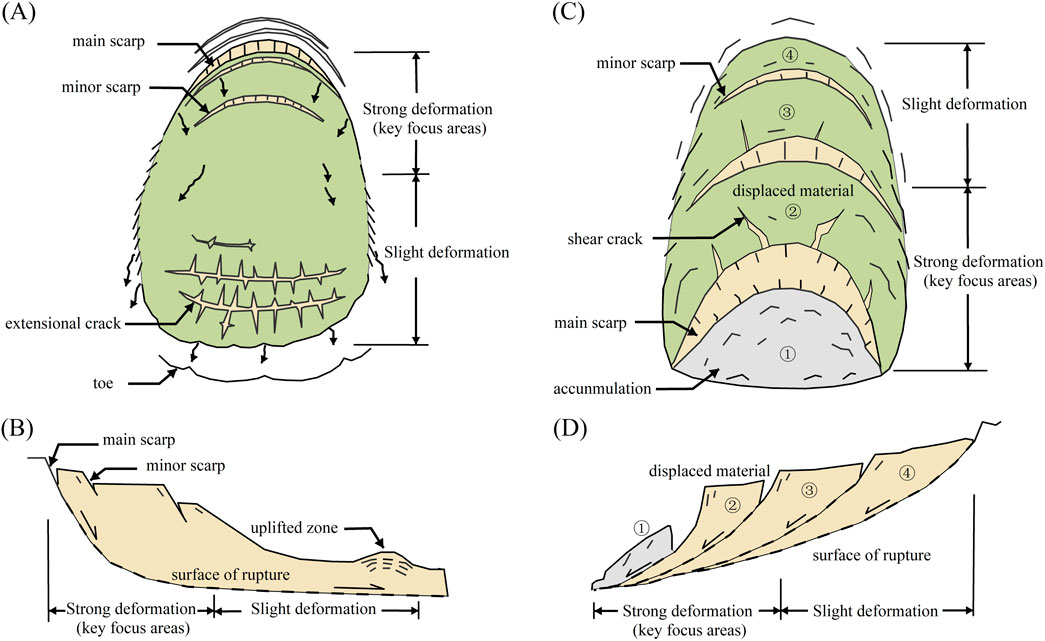
Figure 11. Schematic diagram of key locations for ground verification of creep landslides. (A) Compressive landslide plane figure. (B) Cross section of compressive landslide. (C) Retrogressive landslide plane figure. (D) Cross section of retrogressive landslide.
In conclusion, the refined identification and field verification of slow-moving landslides requires the comprehensive application of multi-source remote sensing technologies and targeted field investigation strategies. By integrating the advantages of different technologies and combining them with an in-depth understanding of landslide evolution mechanisms, we can significantly improve the accuracy and efficiency of landslide identification. This is not only crucial for the management of individual landslides but also provides a reliable technical framework for large-scale landslide investigations and long-term risk assessments. Future research should focus on optimizing multi-source data fusion and integrating emerging technologies like artificial intelligence to improve landslide identification and monitoring systems. Additionally, optimizing multi-source data fusion through advanced algorithms and machine learning techniques will be crucial for improving the accuracy and efficiency of landslide identification and monitoring. Future research should focus on integrating emerging technologies like artificial intelligence and machine learning to enhance landslide detection and monitoring. Advanced data fusion algorithms and long-term monitoring networks combining satellite, UAV, and ground-based sensors will improve the understanding of landslide dynamics and support effective risk mitigation strategies.
This study analyzed the Shibatai creep landslide using multi-source remote sensing technologies, revealing its complex deformation characteristics and evolution. It also provides new insights for identifying and monitoring slow-moving landslides. The integration of InSAR, DIC, LiDAR, and UAV data enabled a comprehensive understanding of the landslide’s spatiotemporal deformation patterns and morphological features. Key findings include: 1) the landslide exhibits a four-stage evolution process, driven by gravity-induced creep, seismic disturbances, rainfall infiltration, and stress redistribution, leading to the formation of multi-level sliding; 2) six secondary sliding bodies were identified, with the most intense deformation occurring at their boundaries, highlighting the importance of focusing on these areas for field verification and monitoring; and 3) DIC and UAV technologies demonstrated superior performance in detecting significant deformation features, aligning closely with field observations, while InSAR and LiDAR provided valuable insights into overall deformation and morphological characteristics. These findings underscore the effectiveness of combining multiple remote sensing technologies to overcome the limitations of individual methods and improve the accuracy of landslide identification and monitoring, particularly in post-earthquake environments.
While this study provides valuable insights, some limitations should be acknowledged, such as the temporal resolution challenges in InSAR and DIC data and the difficulties in interpreting micro-geomorphological features in densely vegetated areas. Future research should focus on integrating real-time monitoring systems (e.g., multi-smartphone photogrammetry and multi-field monitoring) to enhance temporal resolution and early warning capabilities, developing advanced algorithms for multi-source data fusion to improve the accuracy and efficiency of landslide identification, and expanding the application of these methods to other landslide-prone regions to validate their generalizability and refine monitoring strategies.
The raw data supporting the conclusions of this article will be made available by the authors, without undue reservation.
DW: Conceptualization, Data curation, Formal Analysis, Funding acquisition, Methodology, Project administration, Writing–review and editing. LL: Conceptualization, Supervision, Writing–original draft. CL: Data curation, Formal Analysis, Methodology, Writing–original draft. XW: Supervision, Validation, Writing–original draft. YL: Validation, Visualization, Writing–original draft. DR: Resources, Writing–original draft. WT: Investigation, Writing–original draft.
The author(s) declare that financial support was received for the research, authorship, and/or publication of this article. This research was funded by the Project of Ministry and Province Cooperation, Ministry of Natural Resources of the People’s Republic of China (Grant Nos SCDZRS2023), the Fund of Department of Natural Resources of Sichuan Province (KJ-2024-022), and the Open Fund of Sichuan Society of Surveying and Mapping Geoinformation (CCX202406).
We are grateful to the reviewers for their suggestions and comments.
The authors declare that the research was conducted in the absence of any commercial or financial relationships that could be construed as a potential conflict of interest.
All claims expressed in this article are solely those of the authors and do not necessarily represent those of their affiliated organizations, or those of the publisher, the editors and the reviewers. Any product that may be evaluated in this article, or claim that may be made by its manufacturer, is not guaranteed or endorsed by the publisher.
Berardino, P., Fornaro, G., Lanari, R., and Sansosti, E. (2002). A new algorithm for surface deformation monitoring based on small baseline differential SAR interferograms. IEEE Trans. Geoscience Remote Sens. 40 (11), 2375–2383. doi:10.1109/TGRS.2002.803792
Bickel, V. T., Manconi, A., and Amann, F. (2018). Quantitative assessment of digital image correlation methods to detect and monitor surface displacements of large slope instabilities. Remote Sens. 10, 865. doi:10.3390/rs10060865
Bivic, R., Allemand, P., Quiquerez, A., and Delacourt, C. (2017). Potential and Limitation of SPOT-5 Ortho-Image Correlation to Investigate the Cinematics of Landslides: The Example of “Mare à Poule d'Eau” (Réunion, France). Remote Sens. 9, 106. doi:10.3390/rs9020106
Caporossi, P., Mazzanti, P., and Bozzano, F. (2018). Digital image correlation (DIC) analysis of the 3 december 2013 montescaglioso landslide (basilicata, southern Italy): results from a multi-dataset investigation. ISPRS Int. J. Geo-Information 7, 372. doi:10.3390/ijgi7090372
Casagli, N., Intrieri, E., Tofani, V., Gigli, G., and Raspini, F. (2023). Landslide detection, monitoring and prediction with remote-sensing techniques. Nat. Rev. Earth and Environ. 4, 51–64. doi:10.1038/s43017-022-00373-x
Choi, S.-K., Ramirez, R. A., Lim, H.-Ho, and Kwon, T.-H. (2024). Multi-source remote sensing-based landslide investigation: the case of the August 7, 2020, Gokseong landslide in South Korea. Sci. Rep. 14, 12048. doi:10.1038/s41598-024-59008-4
Dai, K., Li, Z., Xu, Q., Tomas, R., Li, T., Jiang, L., et al. (2023). Identification and evaluation of the high mountain upper slope potential landslide based on multi-source remote sensing: the Aniangzhai landslide case study. Landslides 20, 1405–1417. doi:10.1007/s10346-023-02044-4
Ding, C., Feng, G., Li, Z., Shan, X., Du, Y., and Wang, H. (2016). Spatio-temporal error sources analysis and accuracy improvement in landsat 8 image ground displacement measurements. Remote Sens. 8, 937. doi:10.3390/rs8110937
Ding, C., Feng, G., Liao, M., Tao, P., Zhang, L., and Xu, Q. (2021). Displacement history and potential triggering factors of Baige landslides, China revealed by optical imagery time series. Remote Sens. Environ. 254, 112253. doi:10.1016/j.rse.2020.112253
Dong, X., Yin, T., Dai, K., Pirasteh, S., Zhuo, G., Li, Z., et al. (2022). Identifying potential landslides on giant niexia slope (China) based on integrated multi-remote sensing technologies. Remote Sens. 14, 6328. doi:10.3390/rs14246328
Fang, K., Dong, A., Tang, H., An, P., Wang, Q., Jia, S., et al. (2024). Development of an easy-assembly and low-cost multismartphone photogrammetric monitoring system for rock slope hazards. Int. J. Rock Mech. Min. Sci. 174, 105655. doi:10.1016/j.ijrmms.2024.105655
Fang, K., Miao, M., Tang, H., Jia, S., Dong, A., An, P., et al. (2023b). Insights into the deformation and failure characteristic of a slope due to excavation through multi-field monitoring: a model test. Acta Geotech. 18 (2), 1001–1024. doi:10.1007/s11440-022-01627-0
Fang, K., Tang, H., Li, C., Su, X., An, P., and Sun, S. (2023a). Centrifuge modelling of landslides and landslide hazard mitigation: a review. Geosci. Front. 14 (1), 101493. doi:10.1016/j.gsf.2022.101493
He, L., Feng, G., Feng, Z., and Gao, H. (2019). Coseismic displacements of 2016 Mw7.8 Kaikoura, New Zealand earthquake using Sentinel-2 optical images. Acta Geod. Cartogr. Sinica 48 (3), 339–351. doi:10.11947/1.AGCS2019.20170671
Huang, R. (2009). Mechanism and geomechanical modes of landslide hazards triggered by Wenchuan 8.0 earthquake. Chin. J. Rock Mech. Eng. 28 (06), 1239–1249. doi:10.3321/j.issn:1000-6915.2009.06.021
Huang, R., and Li, W. (2014). Post-earthquake landsliding and long-term impacts in the wenchuan earthquake area, China. Eng. Geol. 182, 111–120. doi:10.1016/j.enggeo.2014.07.008
Jaboyedoff, M., Oppikofer, T., Abellán, A., Derron, M.-H., Loye, A., Metzger, R., et al. (2012). Use of LIDAR in landslide investigations: a review. Nat. Hazards 61, 5–28. doi:10.1007/s11069-010-9634-2
Koch, K.-R. (1999). Parameter estimation and hypothesis testing in linear models. 2nd edn. Berlin: Springer. doi:10.1007/978-3-662-03976-2
Kokalj, Ž., and Somrak, M. (2019). Why not a single image? Combining visualizations to facilitate fieldwork and on-screen mapping. Remote Sens. 11, 747. doi:10.3390/rs11070747
Lacroix, P., Bièvre, G., Pathier, E., Kniess, U., and Jongmans, D. (2018). Use of Sentinel-2 images for the detection of precursory motions before landslide failures. Remote Sens. Environ. 215, 507–516. doi:10.1016/j.rse.2018.03.042
Lacroix, P., Handwerger, A. L., and Bièvre, G. (2020). Life and death of slow-moving landslides. Nat. Rev. Earth and Environ. 1, 404–419. doi:10.1038/s43017-020-0072-8
Leprince, S., Barbot, S., Ayoub, F., and Avouac, J.-P. (2007). Automatic and precise orthorectification, coregistration, and subpixel correlation of satellite images, application to ground deformation measurements. IEEE Trans. Geoscience Remote Sens. 45 (6), 1529–1558. doi:10.1109/TGRS.2006.888937
Li, C., Wang, M., and Liu, K. (2018). A decadal evolution of landslides and debris flows after the Wenchuan earthquake. Geomorphology 323, 1–12. doi:10.1016/j.geomorph.2018.09.010
Li, J., Xie, X., Zhao, B., Xiao, X., and Xue, B. (2022). Spatio-temporal processes and characteristics of vegetation recovery in the earthquake area: a case study of wenchuan, China. Land 11 (4), 477. doi:10.3390/land11040477
Lin, Q., Cao, P., Wen, G., Meng, J., Cao, R., and Zhao, Z. (2021). Crack coalescence in rock-like specimens with two dissimilar layers and pre-existing double parallel joints under uniaxial compression. Int. J. Rock Mech. Min. Sci. 139, 104621. doi:10.1016/j.ijrmms.2021.104621
Lin, Q., Zhang, S., Liu, H., and Shao, Z. (2024). Water saturation effects on the fracturing mechanism of sandstone excavating by TBM disc cutters. Archives Civ. Mech. Eng. 24 (3), 154. doi:10.1007/s43452-024-00964-z
Lissak, C., Bartsch, A., Michele, M., Gomez, C., Maquaire, O., Raucoules, D., et al. (2020). Remote sensing for assessing landslides and associated hazards. Surv. Geophys. 41, 1391–1435. doi:10.1007/s10712-020-09609-1
Lu, H., Li, W., Xu, Q., Yu, W., Zhou, S., Li, Z., et al. (2024). Active landslide detection using integrated remote sensing technologies for a wide region and multiple stages: a case study in southwestern China. Sci. Total Environ. 931, 172709. doi:10.1016/j.scitotenv.2024.172709
Lucieer, A., De Jong, S. M., and Turner, D. (2014). Mapping landslide displacements using Structure from Motion (SfM) and image correlation of multi-temporal UAV photography. Prog. Phys. Geogr. 38 (1), 97–116. doi:10.1177/0309133313515293
Ma, S., Qiu, H., Hu, S., Yang, D., and Liu, Z. (2021). Characteristics and geomorphology change detection analysis of the Jiangdingya landslide on July 12, 2018, China. Landslides 18, 383–396. doi:10.1007/s10346-020-01530-3
Paz, F., and Malcolm, W. (2016). A new technique for the detection of large scale landslides in glacio-lacustrine deposits using image correlation based upon aerial imagery: a case study from the French Alps. Int. J. Appl. Earth Observations Geoinformation 52, 1–11. doi:10.1016/j.jag.2016.05.002
Verbovšek, T., Popit, T., and Kokalj, Ž. (2019). VAT method for visualization of mass movement features: an alternative to hillshaded DEM. Remote Sens. 11 (24), 2946. doi:10.3390/rs11242946
Wang, D., Li, Y., Ren, J., Fan, Y., Liu, L., and Luo, C. (2024). Application of joint UAV optics and airborne LiDAR in high level landslide element identification: a case study from the longxigou landslide in wenchuan, western sichuan. Geoscience 38 (02), 464–476. doi:10.19657/j.geoscience.1000-8527.2023.101
Wang, Z., Zhao, C., Liu, X., and Li, B. (2021). Evolution analysis and deformation monitoring of yigong landslide in tibet with optical remote sensing and InSAR. Geomatics Inf. Sci. Wuhan Univ. 46 (10), 1569–1578. doi:10.13203/j.whugis20210168
Xie, M., Zhao, J., Ju, N., He, C., and Wang, J. (2020). Research on temporal and spatial evolution of landslide based on multisource data: a case study of huangnibazi landslide. Geomatics Inf. Sci. Wuhan Univ. 45 (6), 923–932. doi:10.13203/j.whugis20190060
Xu, Q. (2020). Understanding and consideration of related issues in early identification of potential geohazards. Geomatics Inf. Sci. Wuhan Univ. 45 (11), 1651–1659. doi:10.13203/j.whugis20200043
Xu, Q., Dong, X., and Li, W. (2019). Integrated space-air-ground early detection, monitoring and warning system for potential catastrophic geohazards. Geomatics Inf. Sci. Wuhan Univ. 44 (07), 957–966. doi:10.13203/i.whugis20190088
Xu, Q., Lu, H., Li, W., Dong, X., and Guo, C. (2022). Types of potential landslide and corresponding identification technologies. Geomatics Inf. Sci. Wuhan Univ. 47 (3), 377–387. doi:10.13203/j.whugis20210618
Xu, Q., Zhao, B., Dai, K., Dong, X., Li, W., Zhu, X., et al. (2023). Remote sensing for landslide investigations: a progress report from China. Eng. Geol. 321, 107156. doi:10.1016/j.enggeo.2023.107156
Yang, W. (2020). Selecting the best image pairs to measure slope deformation. Sensors 20 (17), 4721. doi:10.3390/s20174721
Yang, W., Liu, L., and Shi, P. (2020). Detecting precursors of an imminent landslide along the Jinsha River. Nat. Hazards Earth Syst. Sci. 20 (11), 3215–3224. doi:10.5194/nhess-20-3215-2020
Zhan, J., Sun, Y., Yu, Z., Meng, H., Zhu, W., and Peng, J. (2024). Characterization of pre- and post-failure deformation and evolution of the Shanyang landslide using multi-temporal remote sensing data. Landslides 21, 1659–1672. doi:10.1007/s10346-024-02257-1
Zhao, C., Lu, Z., Zhang, Q., and Fuente, J. (2012). Large-area landslide detection and monitoring with ALOS/PALSAR imagery data over Northern California and Southern Oregon, USA. Remote Sens. Environ. 124, 348–359. doi:10.1016/j.rse.2012.05.025
Zhu, Q., Zeng, H., Ding, Y., Liu, F., Zhang, L., Li, H., et al. (2019). A review of maior potential landslide hazards analysis. Acta Geod. Cartogr. Sinica 48 (12), 1551–1561. doi:10.11947/j.AGCS.2019.20190452
Keywords: Wenchuan earthquake area, creep landslide, multi-source remote sensing, refined identification, application inspiration
Citation: Wang D, Liu L, Luo C, Wen X, Li Y, Ren D and Tang W (2025) Application of multi-source remote sensing technologies in identification and evolution mechanism analysis of creep landslides: a case study of Shibatai landslide in Wenchuan earthquake area. Front. Earth Sci. 13:1498028. doi: 10.3389/feart.2025.1498028
Received: 18 September 2024; Accepted: 28 January 2025;
Published: 27 February 2025.
Edited by:
Xiaoping Zhou, Chongqing University, ChinaCopyright © 2025 Wang, Liu, Luo, Wen, Li, Ren and Tang. This is an open-access article distributed under the terms of the Creative Commons Attribution License (CC BY). The use, distribution or reproduction in other forums is permitted, provided the original author(s) and the copyright owner(s) are credited and that the original publication in this journal is cited, in accordance with accepted academic practice. No use, distribution or reproduction is permitted which does not comply with these terms.
*Correspondence: Li Liu, bGl1bGkuY25AaG90bWFpbC5jb20=
Disclaimer: All claims expressed in this article are solely those of the authors and do not necessarily represent those of their affiliated organizations, or those of the publisher, the editors and the reviewers. Any product that may be evaluated in this article or claim that may be made by its manufacturer is not guaranteed or endorsed by the publisher.
Research integrity at Frontiers
Learn more about the work of our research integrity team to safeguard the quality of each article we publish.