 Qi Liu1
 Meihong Ma
94% of researchers rate our articles as excellent or good
Learn more about the work of our research integrity team to safeguard the quality of each article we publish.
Find out more
ORIGINAL RESEARCH article
Front. Earth Sci., 14 January 2025
Sec. Geohazards and Georisks
Volume 12 - 2024 | https://doi.org/10.3389/feart.2024.1537486
This article is part of the Research TopicMonitoring, Early Warning and Mitigation of Natural and Engineered Slopes – Volume IVView all 30 articles
Extreme rainfall events are frequent, particularly in economically underdeveloped hilly areas, where conventional hydrological models struggle to accurately simulate the formation of flash floods. Therefore, this study focuses on the Daxi River Basin in Guangdong Province. First, CMIP6 precipitation data is utilized to analyze the future precipitation variations on interannual and monthly scales. Compared to the baseline period, the annual precipitation increases under all three scenarios. Next, design storms with a return period greater than 2 years are allocated into rainfall patterns. By combining the accumulated precipitation with the soil moisture content, different distributed hydrological models are applied to calculate the corresponding flood discharges for different rainfall events. The results indicate that: 1) Precipitation under the SSP5-8.5 scenario is generally higher than under the SSP1-2.6 and SSP2-4.5 scenarios, with the SSP1-2.6 scenario showing the mildest increase. 2) The peak flood simulated by the CREST model are relatively low, at 235.4 m³/s, with fewer precipitation events covered, which is significantly lower than the simulation accuracy of the CNFF model. 3) The Daxi River Basin has a low probability of experiencing flash flood disasters exceeding the 10-year return period in the period from 2026 to 2070. The above research results will provide important references for flash flood disaster prevention in similar basins.
In recent years, climate change has triggered changes in the state of the hydrological cycle. In particular, the frequency of extreme precipitation events has increased the probability of flood risk (Fowler et al., 2021; Zhou et al., 2021). According to the sixth Assessment of Intergovernmental Panel on Climate Change (IPCC), the increase in temperature over the next 20 years will be 1.5°C or more,and precipitation has increased, but with spatial and temporal variability (Zhu et al., 2024) (i.e., In 2021, summer and fall precipitation led to severe flooding in many places in the north of China. From July 29 to 1 August 2023, torrential to heavy rainfall occurred in most parts of Beijing and the central southern region of Tianjin and Hebei, with extraordinarily heavy rainfall in some areas, and the maximum rainfall reached 1,003 mm) The frequent occurrence of extreme precipitation induces severe flooding (Ma et al., 2024). Flash floods belong to a kind of flood disaster, which refers to stream and river floods, mudslides, landslides and other disasters triggered by heavy rainfall in a small area (usually within a few hundred km2) of a hilly area (Hong et al., 2013), which is sudden, difficult to forecast and warn, and seriously hazardous. Therefore, for the defense of flash floods, the prediction of flash flood trends under future climate scenarios is an important reference.
Future flash flood prediction is one of the research hotspots in the field of climate change (Zhang et al., 2023), and General Circulation Models (GCMs) can better simulate climate characteristics at annual or seasonal scales, and they are the main tools for studying future climate change. The Coupled Model Intercomparison Projec (CMIP), initiated and organized by World Climate Research Programme’s Working Group on Coupled Modelling (WGCM) in 1995, has achieved a series of research results in climate numerical simulation and shared data. Many scholars at home and abroad use CMIP simulation results to conduct climate change research for the next 5–10a, which provides important data support for predictions in the directions of climate extremes, food security, and sea level rise (Wu and Xin, 2019). Among them, CMIP6 corrects the long-standing problems of model bias and poor quantification of radiative forcing in CMIP5 (Song et al., 2021; You et al., 2021). Ridder et al. (2021) found that the CMIP6 model simulated the combined events of precipitation and strong winds, drought and heat waves and their return periods over North America, Europe and Eurasia well. Kim et al. found that the CMIP6 model was able to capture the global and regional extreme temperature patterns compared to the CMIP5 model (Kim et al., 2020). Additionally, precipitation intensity simulations have been improved in terms of reducing drought bias. Based on precipitation and temperature from 1985 to 2014, Wu et al. (2023) used 20 CMIP climate patterns to conduct a comprehensive assessment of the water conservation area of the Yellow River Basin and verify that its simulation effect is the best. Dong and Dong. (2021) used CMIP6 and CMIP5 to simulate and evaluate extreme precipitation in Asia, finding the polarization of CMIP6’s simulation performance was severe, but its simulation performance was good. Dai et al. combining the CMIP6 multi-model averaged data, found that temperature and precipitation of the Shiyang River Basin in the period of 2023–2,100 showed an increasing trend (Dai et al., 2023). Xu et al. used CMIP6 to predict future extreme precipitation changes in China. Under the SSP2-4.5 and SSP5-8.5 scenarios, total precipitation, maximum 5-day precipitation, and the number of extremely heavy precipitation days are expected to increase significantly. However, the drought risk caused by precipitation anomalies is expected to be alleviated (Xu et al., 2022). With the continuous development of GCMs, CMIP6 improves the spatial resolution as well as the simulation capability, and its temperature characteristics are better than the precipitation characteristics. Meanwhile, different models exhibit varying simulation capabilities, providing valuable references for mitigating future disaster risks at local spatial and temporal scales.
The simulation accuracy of hydrological models is the core technology for flash flood disaster prevention. Many research on the mechanism of flash flood runoff mostly focuses on the aspects of precipitation-infiltration-runoff (Liu and Huang, 2020; Liu et al., 2019). Due to the differentiated topography and hydrometeorological conditions in different study areas, coupled with frequent extreme weather and significant urbanization effects, Hydrological mechanisms such as Underlay surface and rainfall infiltration have changed, resulting in the complexity and randomness of hydrological processes such as runoff generation and confluence, which has caused problems such as calculation bias in the two-dimensional numerical simulation of flash floods, so the models targeting different spatiotemporal characteristics in the same area have been developed and used successively (Li et al., 2023). Model calculation methods mainly include statistical quantification and hydrological and hydrodynamic methods. The statistical quantification method is relatively simple, but requires a large amount of data and is not suitable for small watersheds in remote mountainous areas prone to flash floods. hydrodynamic methods can consider the physical formation process of runoff and require higher accuracy (Wang et al., 2022). It can predict flash floods in watersheds without data (Chen et al., 2022; Li et al., 2024; Hao et al., 2023). Hydrological and hydrodynamic models take into account dynamic characteristics such as motion waves and diffusion waves, and can better express the spatiotemporal characteristics of slope runoff. Among them, distributed hydrological models such as MIKE SHE and SWAT have strong physical foundations and can be extended to small watersheds Region (Chen et al., 2022). HEC-HMS and TOPMODEL models are commonly used in semi-distributed hydrological models, and their parameter determination is relatively simple. Distributed hydrological models have been applied and verified in many mountainous watersheds at home and abroad, showing certain effectiveness and superiority. For example, Simulation of Spatiotemporal Variable Sources Mixed Runoff Model and China Flash Flood Hydrological Model (CNFF), the former is suitable for flash flood simulation in small mountainous watersheds with diverse topography and complex runoff mechanisms, and the latter uses modular modeling technology to integrate various nonlinear runoff generation and confluence models (He et al., 2024). The algorithm satisfies the simulation of flood processes in small watersheds in different mountainous areas. The Coupled Routing and Excess Storage model (CREST) is a grid-based distributed hydrological model, mainly used for real-time hydrological simulation, and is suitable for multi-watershed or small- and medium-scale watershed simulation at high resolution (Kan et al., 2017). All in all, selecting appropriate models for different watersheds is of great significance for improving the simulation and prediction of hydrological processes.
Under the background of global warming, coupled with the impact of human activities, extreme precipitation occurs frequently. The responses of different underlying surfaces to changes in different climate elements have regional differences, so using appropriate hydrological models to accurately simulate flash flood processes can minimize the risk of flash flood disasters. This paper analyzed the temporal and spatial variation patterns of future precipitation based on the CMIP6 precipitation data. Then selected different distributed hydrological models, comprehensively considered the previous influencing rainfall, conducted simulation comparisons, and then predicted the changes in flash flood disaster risks under different future climate scenarios. The aim is to obtain more accurate flash flood simulation results to provide a reference for regional disaster prevention. In recent years, numerous studies have explored the impacts of climate change on extreme precipitation and associated flash floods, highlighting the increasing frequency and intensity of these events. Research has shown that extreme rainfall is closely linked to secondary disasters such as landslides, debris flows, and slope failures, particularly in mountainous regions with complex topography (Wei et al., 2024; Qiu et al., 2024). The combination of high-intensity rainfall and human-induced changes to the landscape exacerbates flood risks. Advances in CMIP6 data and hydrological models, such as MIKE SHE, SWAT, and CREST, have significantly improved the simulation of these extreme events, yet challenges remain in accurately predicting secondary hazards. Addressing these gaps is critical for enhancing regional flood preparedness and disaster risk management. The structure of this study is as follows: following the introduction in Section 1, Section 2 presents the data and methods employed in this research. It begins with a description of the study area and proceeds to an overview of data preprocessing, methodologies, and research framework. Section 3 provides a detailed explanation and discussion of the research results. Finally, Section 4 concludes the article and offers prospects for future work.
Lianping County is located in Heyuan City, Guangdong Province, with mountains, hills and basins accounting for more than 90% of the total area of the county, and is a typical mountainous county (Figure 1). The climate belongs to the subtropical monsoon climate, the precipitation season is obvious, concentrated in April to September, the precipitation is more, the average annual is more than 1,000 mm, and at the same time, it is affected by the Pacific typhoon, and there are many heavy rains and floods. The topography of Lianping County is inclined from north to southeast and southwest, with an average altitude of 693.5 m. The permanent population is 285,200, and the GDP of Lianping County in 2023 will be 1062035 million yuan, a year-on-year increase of 4.6%. The Daxi Water Basin is located in Lianping County and flows into the Xinfeng River, the largest tributary of the Dongjiang River system. In this paper, the upper reaches of the Daxi River are mainly selected, with latitude and longitude from 114°32′25″to 114°42′38″east longitude and 24°26′26″to 24°35′12″north latitude, with a basin area of 175.95 km2. The topography of the basin is high around the periphery, low in the middle and the drop is large. The outlet of the basin is located in the southwest. The basin belongs to the subtropical monsoon climate, and the precipitation is concentrated from April to September, with an average annual precipitation of more than 1,000 mm. From May 21 to 23, 1989, the county suffered a flash flood caused by heavy rainfall, causing 86,800 people to be affected and eight people died; on 23 April 1992, Lianping County was hit by a heavy rainstorm not seen in a century, with a rainfall of 223.5 mm in just over 2 hours. On 10 June 2019, a catastrophic flood occurred in Daxishui, affecting more than 50,000 people and killing 11 people.
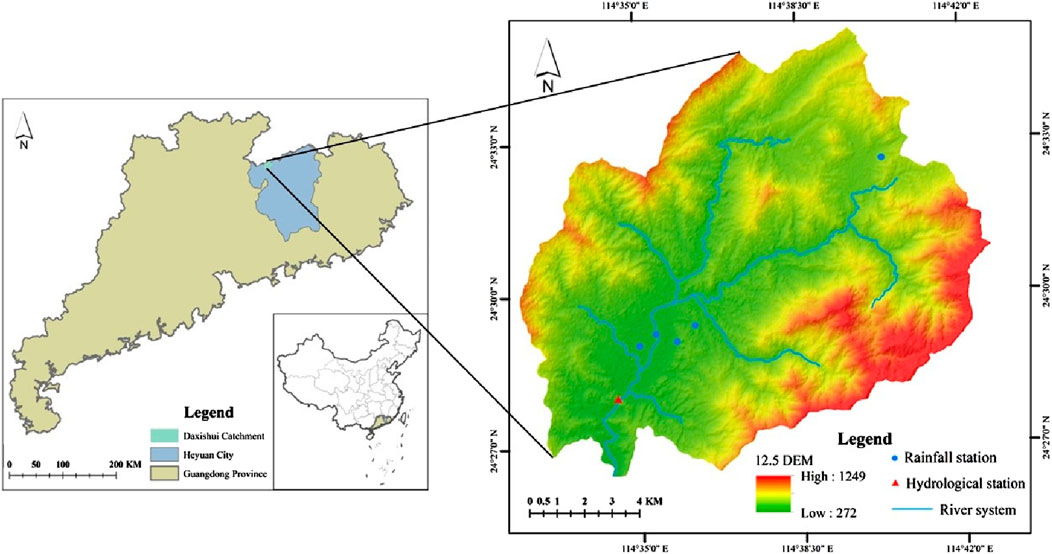
Figure 1. Location map of study area.
The data in this paper mainly include the basic data (DEM, river network and small watershed data) and monitoring station data of the Daxi River Basin, the measured precipitation and flow data from 2019 to 2023, and the EC-Earth3 model data from CMIP6 that is suitable for regional temperature and precipitation simulation in China is selected (Liu and Huang, 2020; Liu et al., 2019; Li et al., 2023; Wang et al., 2022). Including the future daily precipitation data for 2026–2,100 include historical precipitation data from 1961 to 2014, low radiative forcing scenarios under moderate development (SSP1-2.6), moderate radiative forcing scenarios under local or inconsistent development (SSP2-4.5), and high radiation forcing scenarios under high fossil fuel consumption development (SSP5-8.5) (SSP1-2.6 scenarios for EC-Earth3 model data lack precipitation data for 2,100). Firstly, the CMIP6 data were evaluated and corrected using the CN05.1 dataset (China Meteorological Forcing Dataset, version 5.1) from the Climate Change Research Center of the Chinese Academy of Sciences, along with the daily meteorological data from the corresponding historical period (1950–2014) as observation data (Hao et al., 2023; He et al., 2024). The data is a grid dataset based on the interpolation of daily precipitation and temperature data from 2,472 surface meteorological observation stations of the National Meteorological Information Center, with a resolution of 0.5°×0.5° (Kan et al., 2017). To ensure data accuracy, outliers in historical datasets were removed, and spatial interpolation methods were applied to fill missing values. Due to the different resolutions of the two datasets, spatial downscaling is required. Considering that the area of the Daxi water basin is slightly small, the basin station was selected for data processing. Furthermore, the validation of downscaled data was performed by comparing it with observed station data within the study area to ensure reliability and consistency. See Table 1 for details of the study area data.
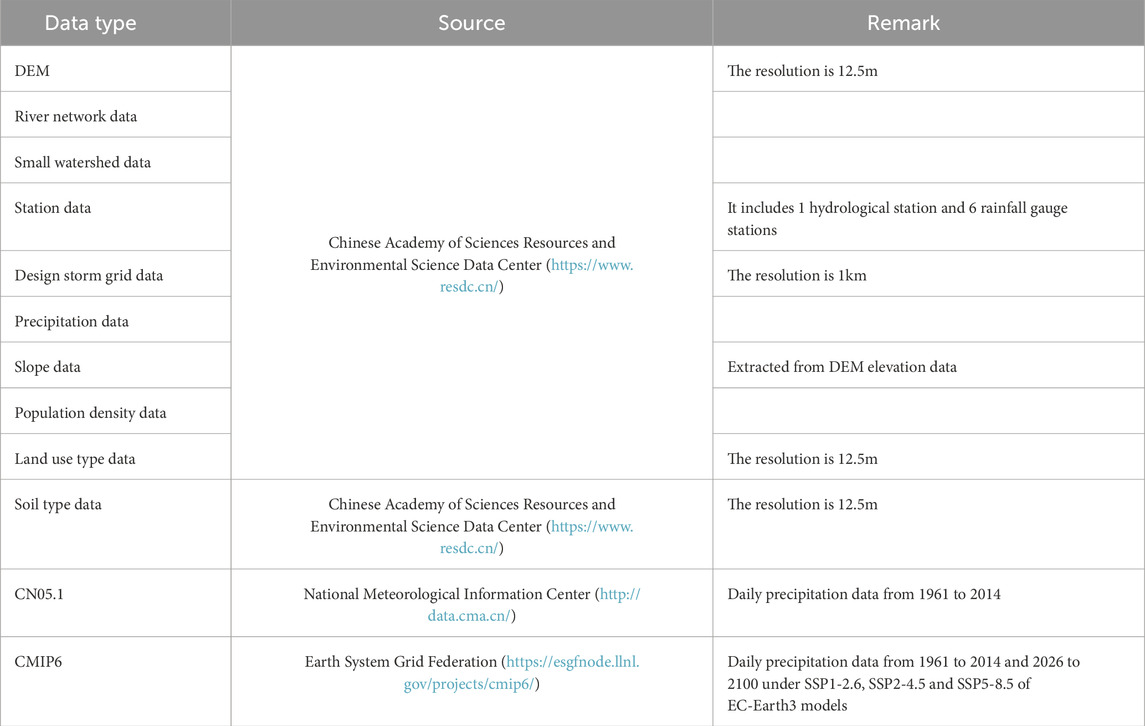
Table 1. Data source.
In this study, China Flash Flood hydrological model (CNFF) and the Coupled Routing and Excess Storage model (CREST) were selected. Based on the attributes of natural small watersheds, CNFF adopts the concept of modularization and hierarchical architecture, and takes the clusters considering the topological relationship of the basin water system, high-precision topographic and geomorphological data as the unit, and is compatible with the production and confluence characteristics of different climate types, and constructs a model library of multiple processes of the water cycle. The model is mainly aimed at the research of flash flood prevention in small watersheds, and solves the problems of nonlinear production and confluence simulation and calculation of high timeliness under the conditions of short duration and heavy precipitation. In a certain sense, CNFF is a generalized distributed hydrological model of river basins, and its hydrological units mainly include seven categories: river basins, river sections, nodes, water sources, water division, reservoirs, and depressions. The calculation process mainly includes five modules: meteorology, runoff, confluence, river flood evolution, and water conservancy facility regulation, and each module selects different algorithms according to the characteristics of the river basin. Among them, the runoff generation mainly includes vegetation interception, evapotranspiration, soil moisture, etc.
The CREST (the Coupled Routing and Excess Storage) model, jointly developed by the Remote Sensing Hydrometeorology Laboratory of the United States Weather Service and the University of Oklahoma, USA, is a grid-based distributed hydrological model, which is mainly used for global and regional real-time hydrological simulations, which can be used for multi-basin simulations while maintaining relatively high computational efficiency, and is also very suitable for small- and medium-scale watershed simulations at high resolution. The CREST model divides the study area into regular grids, and the resolution of the grid is defined by the user, and on this basis, the temporal and spatial variability of surface water and groundwater storage and energy is simulated, which can be applied to multiple scales. The model uses the variable permeability curve to calculate the runoff generation, uses the multilinear reservoir to simulate the grid-by-grid surface and groundwater confluence, and reproduces the surface and groundwater flow process by coupling the runoff generation elements and the grid-by-grid confluence structure. The model can be used for both multi-basin simulation and small- and medium-scale watershed simulation at high resolution, and has relatively high computational efficiency. The input data of the model mainly include hydrological data and basic data (such as DEM, flow direction, flow pool, slope, etc.), in which the gridded rainfall data and potential evapotranspiration (PET) are used as the driving force of the model. Output data (e.g., soil moisture, surface runoff, subsurface runoff, etc.) can be distributed output with a grid as a unit or output separately for selected study sites.
Compared to CNFF, which is designed specifically for small watersheds and excels in simulating nonlinear hydrological processes under short-duration and high-intensity precipitation events, CREST focuses more on larger-scale or long-term hydrological simulations with a higher degree of computational efficiency. The modular parameter settings of CNFF allow for detailed customization and higher accuracy in flash flood simulations, but they come with higher data and computational demands. CREST, with its grid-based structure, simplifies parameterization and is better suited for real-time applications, though it may sacrifice precision in small, topographically diverse basins.
At the same time, the Nash-Sutcliffe efficiency coefficient was selected to quantitatively evaluate the effect of hydrological simulation. The NSE is particularly suitable for assessing flash flood simulations due to its ability to compare the goodness of fit between simulated and observed discharge values over time. This metric is especially effective in identifying the degree of error during peak discharge events, which are critical in flash flood scenarios. By normalizing residual variance to observed flow variance, NSE emphasizes the performance of models in reproducing the variability of observed flows, making it a widely accepted metric in hydrology. The NSCE values can be divided into four intervals, representing four levels of hydrological simulation utility: NSCE ≤ 0.5 is poor, 0.50 < NSCE ≤ 0.65 is applicable, 0.65 < NSCE ≤ 0.75 is good, and 0.75 <NSCE ≤ 1.00 is excellent; The formula for calculating this parameter is given in Equation 1:
In the formula: Qs, i is the simulated flow rate at the time of t = i, m³/s; Qo, i is the measured flow rate at time i, m³/s; Q0 is the average measured flow rate, m³/s.
The downscaling methods of Global Climate Model (GCMs) are divided into two categories, dynamic downscaling technique and Statistical downscaling technique. The computation cost of dynamic downscaling is large, and the information processing results for some small changes are poor (Lu et al., 2022). The statistical downscaling method is simple to calculate, and the statistical characteristics at different scales often have good invariance (Maria et al., 2024), and it has a wide range of applications. Delta downscaling is a type of empirical downscaling in statistical downscaling, which mainly superimposes the historical measured data and change characteristics (relative change or absolute change) of GCMs data in the same period to the future climate scenarios of the region, so as to obtain climate data under future scenarios after downscaling and deviation correction, which is relatively simple and computationally intensive, and can reduce the simulated values to specific observation stations (Keeble et al., 2021). The algorithms for temperature and precipitation are different in the delta downscale. For precipitation, the calculation method is to divide the precipitation in the future forecast period of GCMs by the precipitation in the historical period to obtain the absolute change rate of the two. Then, the actual precipitation data of each meteorological station in the historical period is multiplied by the absolute rate of change to obtain the precipitation in the future period of the meteorological station. The formula for calculating this parameter is given in Equation 2:
In the formula,
This study introduces, evaluates, and corrects CMIP6 precipitation data, using the daily meteorological data from the CN05.1 dataset (1950–2014) as the baseline. Firstly, the study analyzes the characteristics of future precipitation changes on interannual and intramonthly scales, as well as the potential impacts of climate change on precipitation patterns. Subsequently, the CREST model was validated using observed flood data from 2019 to 2023, and a reasonable set of parameters suitable for the study basin was determined. The Nash efficiency coefficient reached the “acceptable” range, meeting the accuracy requirements of the hydrological model. Next, future daily precipitation events exceeding the 2-year return period design storm were selected, and rainfall pattern allocation was conducted to characterize different types of precipitation patterns. On this basis, the CREST model was used to calculate the corresponding flood discharge, which was then compared with the results from the CNFF. This comparison was used to predict flash flood risk changes under the future climate scenarios. The specific technical approach is shown in Figure 2. This process integrates the use of the CREST model to compute flood discharges, followed by a comparison with results from the CNFF Model. The final goal is to predict the changes in flash flood disaster risk under future climate scenarios.
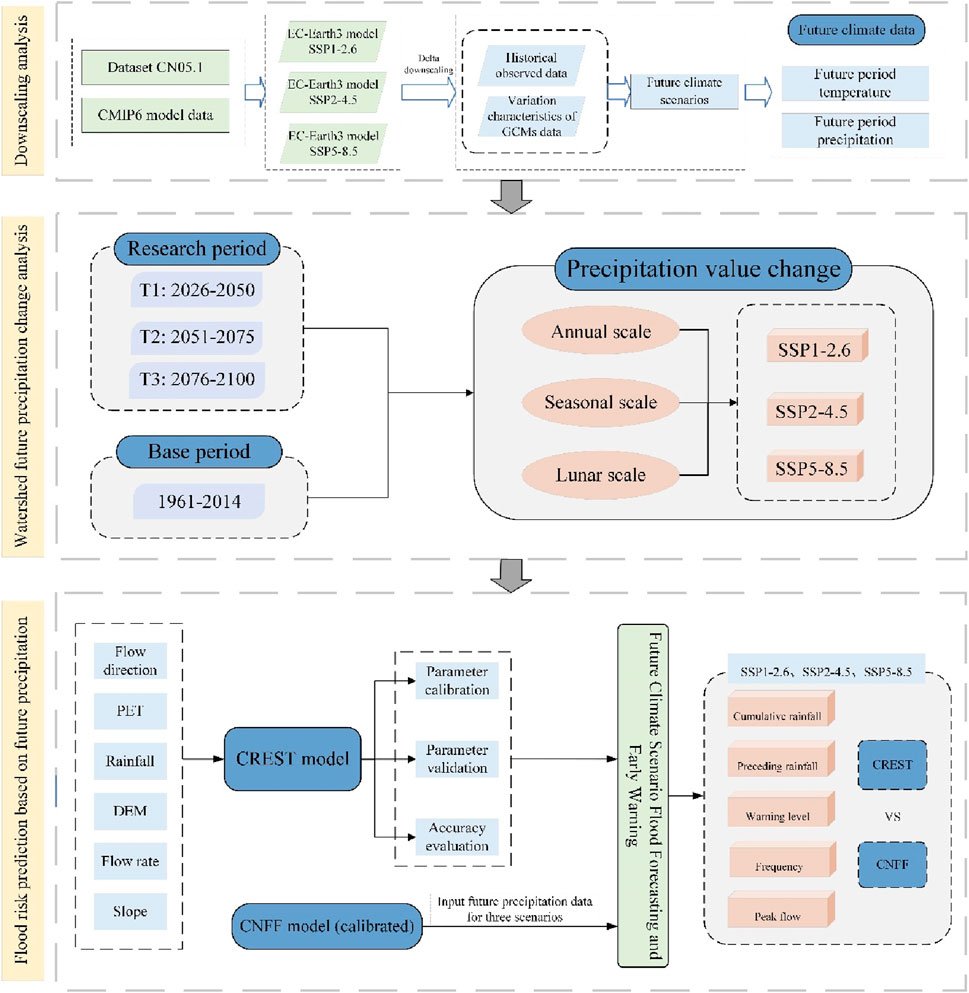
Figure 2. Research flow chart.
The average annual precipitation from 1961 to 2014 was 1717.2 mm, showing a fluctuating downward trend, and the trend rate was −12.4/10a. The annual average value of simulated precipitation was 1,488.9 mm, which was 13.3% lower than the observed value, and the trend rate was −20.6/10a. After Delta downscaling and deviation correction, the annual mean of model precipitation was 1717.1 mm, and the trend rate was −33.2/10a. The correction effect is obvious, as shown in Figure 3. Obviously, the bias-calibrated model simulations deviate from the observations with little deviation and the trend is consistent with the observations, which can be used to describe precipitation characteristics on a time scale.
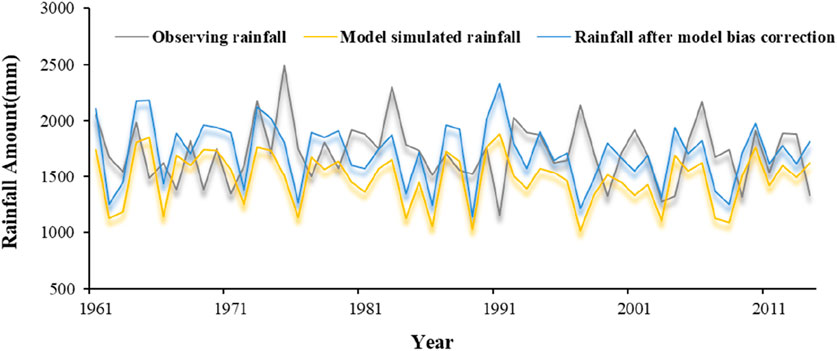
Figure 3. Annual precipitation from observations and simulations from 1961 to 2014.
In order to explore the variation characteristics of future precipitation on the annual and monthly scales under the three scenarios of climate models SSP1-2.6, SSP2-4.5 and SSP5-8.5, the study period 2026–2,100 was divided into three stages: T1 (2026–2050), T2 (2051–2075) and T3 (2076–2,100), and the changes of precipitation values in different stages under the three scenarios compared with the base period (1961–2014) were calculated.
Under the three scenarios of SSP1-2.6, SSP2-4.5 and SSP5-8.5, the average annual precipitation showed an increasing trend, and its annual average values were 1828.89 mm, 1817.60 mm and 2024.14 mm, respectively, which increased by 6.5%, 5.8% and 17.9% compared with the base period. The increase rates were 0.6 mm/10a, 19.8 mm/10a and 88.1 mm/10a, respectively. The increase of interannual precipitation was the largest under the SSP5-8.5 scenario. The increase trend of interannual precipitation was the most moderate under the SSP1-2.6 scenario, that is, the probability of future extreme precipitation under the SSP5-8.5 scenario was higher than that under the SSP2-4.5 and SSP1-2.6 scenarios, which also indicated that the high pollution concentration caused by high fossil fuel consumption led to enlarge the growth in precipitation. As shown in Figure 4, the probability of a minimum value of precipitation in the SSP1-2.6 scenario is higher than that in the SSP2-4.5 scenario. Therefore, in the next 75 years, although the precipitation increases in the SSP1-2.6 scenario compared with that in the base period is larger than that is in SSP2-4.5 scenario, the trend rate in the SSP1-2.6 scenario is smaller than that of the SSP2-4.5 scenario. SSP1-2.6. In the SSP1-2.6 scenario, there are more peaks and troughs of precipitation, while in the SSP2-4.5 scenario, the upper and lower ranges of the precipitation threshold fluctuate less, and its growth trend is relatively stable.
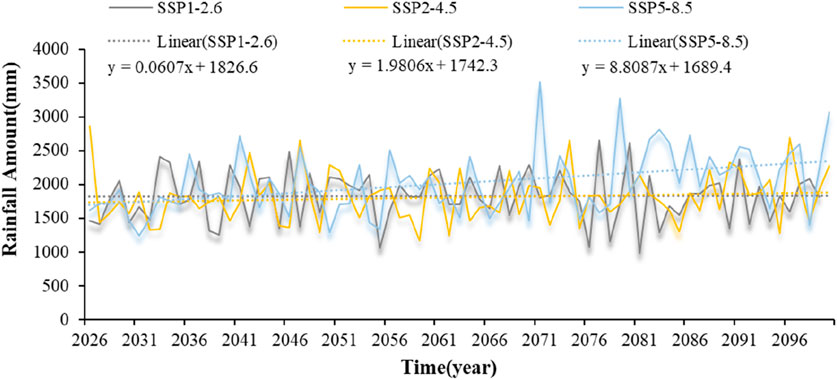
Figure 4. Future annual precipitation changes under three climate scenarios.
Figure 5 shows the monthly changes of precipitation in each period under the future scenario, and the average annual precipitation in the three stages of SSP1-2.6, SSP2-4.5 and SSP5-8.5 all showed an increasing trend, ranging from 3.3% to 32.5%. The smallest increase is in the period 2026–2050, when it is 56.4 mm under the SSP1-2.6 scenario. The SSP5-8.5 scenario had the largest increase in the 2076–2,100 period, which was 558.7 mm. In the future climate simulation data, the month with the most precipitation occurred in June during the T3 period under the SSP5-8.5 scenario, which was 519.7 mm. However, the largest monthly growth was 231.3% in November in the T1 period under the SSP2-4.5 scenario, and the precipitation in November in the other three stages showed a downward trend. Under the SSP1-2.6 scenario, the monthly precipitation in the T1 and T2 phases is mainly increased compared with the base period, and the decrease months are concentrated in November, December, January and February. The precipitation in the T3 stage is mainly decreasing, and the interannual precipitation in the T3 stage still shows an increasing trend, but compared with other stages, the increase is the smallest.
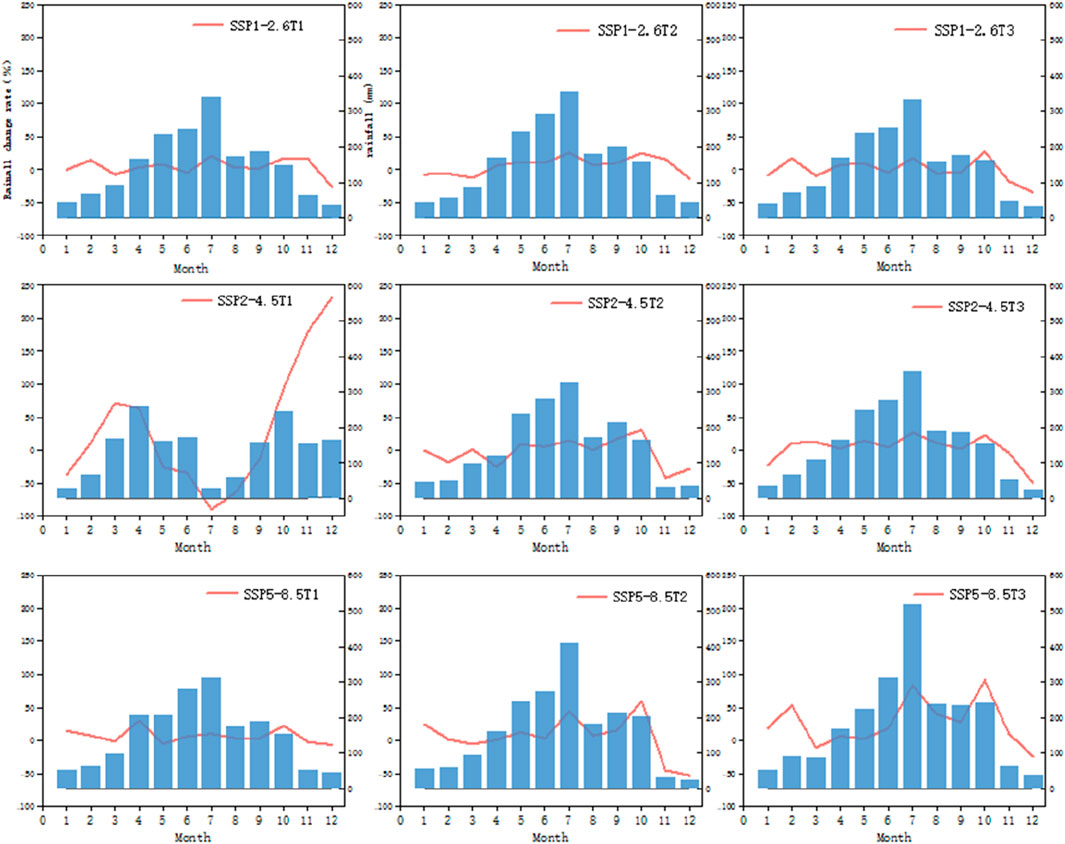
Figure 5. Monthly variation of precipitation in future periods.
Under the SSP2-4.5 scenario, the monthly precipitation fluctuates most drastically, and the precipitation fluctuation in T1 is opposite to that in T2 and T3, and the T1 stage has the largest decrease in June, which is only 30.1 mm. Under the SSP5-8.5 scenario, the precipitation fluctuation in the T1 stage is relatively flat compared with the base period, the precipitation fluctuation in the T2 and T3 stages is upward, and the increase in the T3 stage is the largest. The precipitation in the three stages is also declining in February and November. Under the three scenarios, the precipitation in September exceeded the base period, and the increase rate was more than 17.2%. In the three scenarios, the precipitation in January February in the future will decrease compared with the base period.
Figure 6 shows the seasonal changes of precipitation in each period under the future scenario. In June, July and August (summer), the precipitation decreased only in T1 under the SSP2-4.5 scenario, while the rest showed an increasing trend and the precipitation in September, October and November (autumn) showed an increasing trend. Under the SSP2-4.5 scenario, the precipitation fluctuation in T1 was the largest, and the seasons with the largest increase and decrease were in this stage, which were −60.8% in summer and 144.3% in autumn, and extreme precipitation is more likely to occur during this period. The summer sum of the three phases of SSP1-2.6 and SSP5-8.5 increases the most.
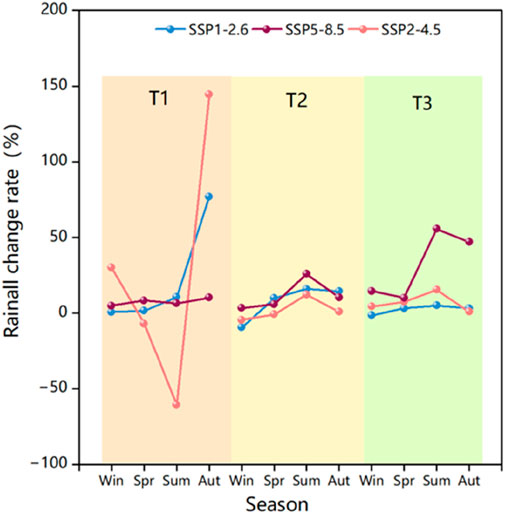
Figure 6. Seasonal changes in precipitation in future periods.
Taking the daily precipitation as the research scale, the 24-h precipitation of 2-year event (104.63 mm) or more was selected as the research object, and the precipitation was calculated according to the area of the Daxi water basin, and then the surface rainfall of the basin was obtained. The schedule of the sessions is allocated according to the maximum 1-day rainstorm pattern, and flood prediction and early warning under future climate scenarios are also carried out. According to statistics, there were 6, 7 and 35 events under the SSP1-2.6, SSP2-4.5 and SSP5-8.5 scenarios where the daily precipitation reached 2-year event. The 24-h rainfall pattern was used to distribute the rainfall, and the cumulative rainfall in the first 3 days of precipitation was calculated, and the soil moisture in the previous period was determined according to the accumulated rainfall in the previous period. In the SSP2-4.5 scenario, the 20960623 session and the 20960624 sessions will be calculated according to the same session due to the time continuity, and two peak flows will be obtained. Similarly, under the SSP5-8.5 scenario, 20710612–20710613, 20771029–20771030, 20820629–20820630-20820701 and 21000623–21000624-21000625 will be counted as the same session. Based on the design rainfall and the distribution of the maximum daily rainfall process in the region, the design flood discharges for six recurrence intervals were calculated, thereby determining the flood recurrence characteristics of the river reach. Specifically, the peak discharges for different recurrence intervals range from 120 m³/s to 1,053.3 m³/s, with a 2-year recurrence interval design flood discharge of 120 m³/s, 5-year recurrence interval at 302.2 m³/s, 10-year recurrence interval at 498 m³/s, 50-year recurrence interval at 883.8 m³/s, and 100-year recurrence interval at 1,053.3 m³/s. According to the design flood discharges in ascending order, warning levels from I to VI were assigned to the six recurrence intervals. Subsequently, the China Hydrological Model was used to simulate and predict typical flood events.
In the previous stage, based on the measured precipitation and flow data from 2019 to 2023, the parameters of the CNFF were calibrated and verified, and the average Nash coefficients were obtained at 0.79 and 0.89 in the process of model calibration and validation, so as to verify the good applicability of CNFF. Figure 7 shows the early warning analysis of flood response under future climate scenarios (SSP1-2.6 and SSP2-4.5), in which 4 of the six precipitation events under the SSP1-2.6 scenario reached the warning level, which were I., II., I., and III., respectively, and the largest flood peak flow was 20820416, with a frequency of nearly 100-year event. Under the SSP2-4.5 scenario, three of the seven precipitation events reached the warning level, which were II., II., III., respectively, and the peak flow of 20960624 session can reach 10-year event. Under the SSP5-8.5 scenario, 19 of the 35 precipitation events reached the warning level, and grades I., II., III., and IV have 8, 9, 1, and 1 game, respectively, and the peak flood flow of 21000625 session reached 20–50-year event. Overall, the frequency of precipitation in the 35 sessions ranged from 2 to 20-year event, and the maximum precipitation was the 20940827 sessions of 20-year event, about 220.6 mm. However, the peak flood flow generated by it is only close to 5-year event; The maximum peak flow is 810.5 m3/s at 21000623–21000624-21000625. In addition, if the continuous precipitation exceeds 2-year event, the frequency of the peak flood flow calculated by the same field has increased. Obviously, continuous precipitation increases the probability of flooding. The 26 flood peak flows reached the early warning level, and the floods reaching levels I and II were higher than those of III and IV, and the sensitivity of previous precipitation and early soil moisture to peak flood flow was significant. Under the scenarios of SSP1-2.6, SSP2-4.5 and SSP5-8.5, the number of sessions that reached the warning level mostly occurred in June, with a probability of 56%. In addition, the floods of 10-year event or more occurred in the T3 (1976–2,100) stage, which is consistent with the positive trend of annual precipitation change under the three scenarios. Therefore, from 2026 to 2070, there will be no 10-year flood disasters in the Daxi Water Basin, but attention should be paid to debris flows, landslides and other chain disasters caused by low-frequency floods. Under the SSP1-2.6 and SSP2-4.5 scenarios, the probability of flooding in April is higher, while in the SSP5-8.5 scenario, the probability of extreme disasters will be increased due to high pollution emissions, and the probability of flooding is much higher than that of the other two scenarios. Under the SSP5-8.5 scenario, flash flood flows triggered by extreme precipitation events can reach as high as 1,053.3 m³/s. This not only leads to flooding disasters within the watershed but may also trigger a series of secondary disasters, such as landslides and mudslides. The combination of soil saturation caused by extreme precipitation and the scouring effect of flash floods reduces the stability of mountain slopes, making landslides more likely. Meanwhile, the rapidly moving mudslides further exacerbate the destruction risk in downstream areas. These secondary disasters are often sudden and destructive, posing significant threats to transportation, infrastructure, and the safety of residents’ lives and property.
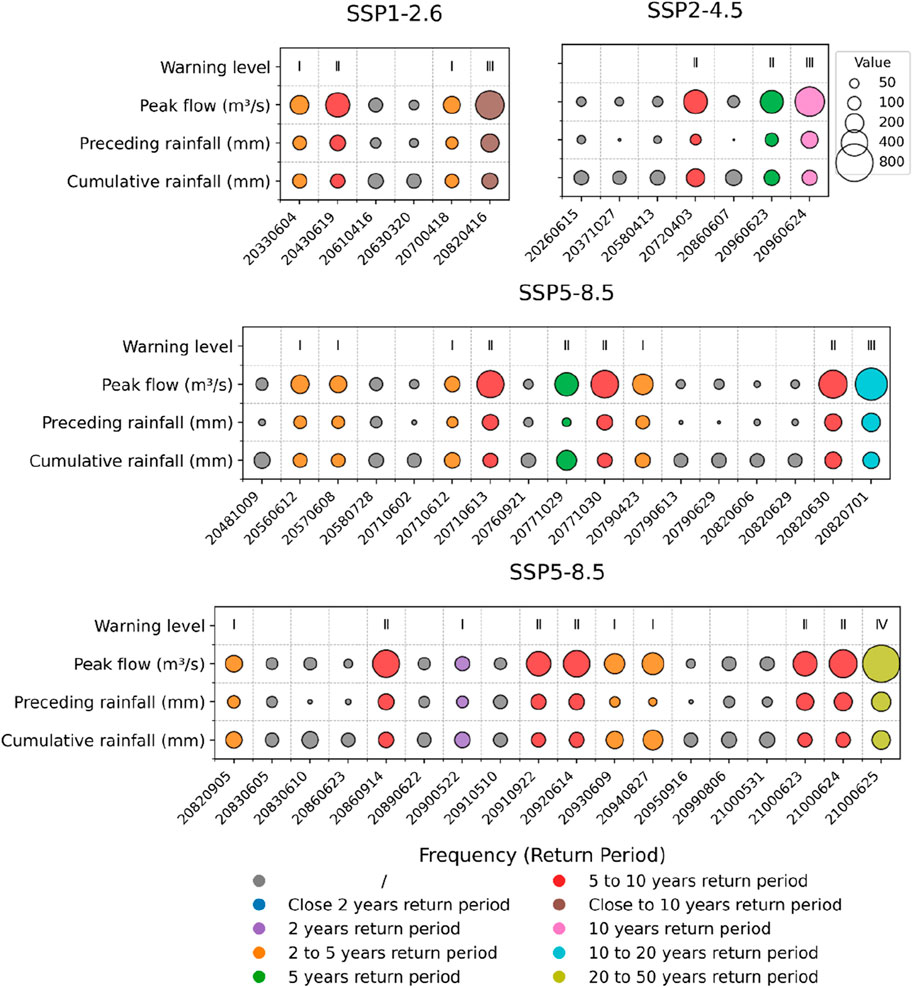
Figure 7. Analysis of flood response and early warning under future climate scenarios (SSP1-2.6、SSP2-4.5、SSP5-8.5) based on CNFF.
The river flow data and precipitation data from 2021 to 2022 were selected for simulation, and the model parameters were calibrated from 9 April 2021 to 1 July 2022 according to the time series. Figure 8 shows the continuous flow process used for calibration, the Nash coefficient is in the “applicable” range, the simulated flow is smaller than the measured flow, especially the fitting of the peak is poor, the relative deviation between the simulated flow and the measured flow is 199% at the maximum, and the minimum is 0, and the peak time is advanced, but the change trend is more consistent. Using the data from July 2 to 1 September 2022 for simulation verification, the Nash coefficient is also in the “applicable” range, and the overall trend of simulated flow is consistent with that of measured flow, but the relative error of peak flow is large (Figure 9). Based on simulation and validation, the CREST model simulates the flow trend well in the long-term series simulation of small watersheds, while the error of the peak simulation is larger.
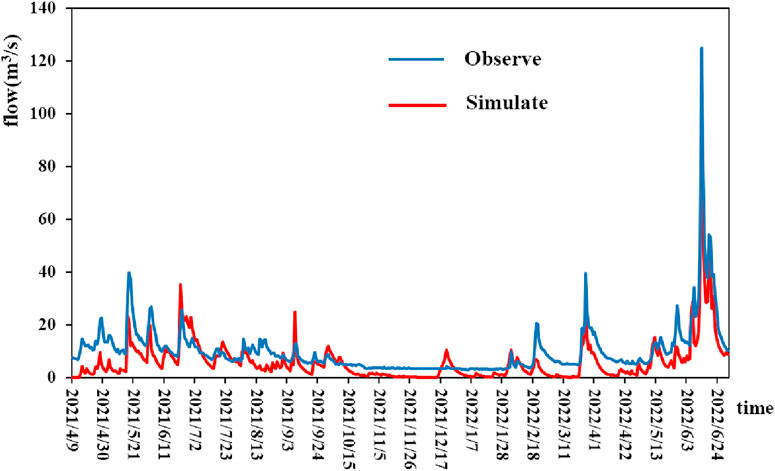
Figure 8. The continuous flow process of calibration period.

Figure 9. The continuous flow process of verification period.
Combined with the calibrated and validated CREST model, the 24-hour precipitation of 2-year event (104.63 mm) or more was selected as the research object, and then the flood prediction and early warning under future climate scenarios were carried out. As shown in Figure 10 below, under the three scenarios, there were 11 sessions with flow exceeding the 2-year event, but no session with rainfall reaching the 5-year event. Under the SSP2-4.5 scenario, the flow of precipitation exceeded 120 m3/s in two events, and the peak flow of 20720403 was the largest. Under the SSP5-8.5 scenario, nine of the 35 precipitation events reached the warning level, and the maximum precipitation was 21000625, about 231 m3/s. Under the SSP1-2.6, SSP2-4.5 and SSP5-8.5 scenarios, the probability of reaching the warning level is 23%, and most of the floods occurred in the T3 (1976–2,100) stage, which is consistent with the annual precipitation trend.
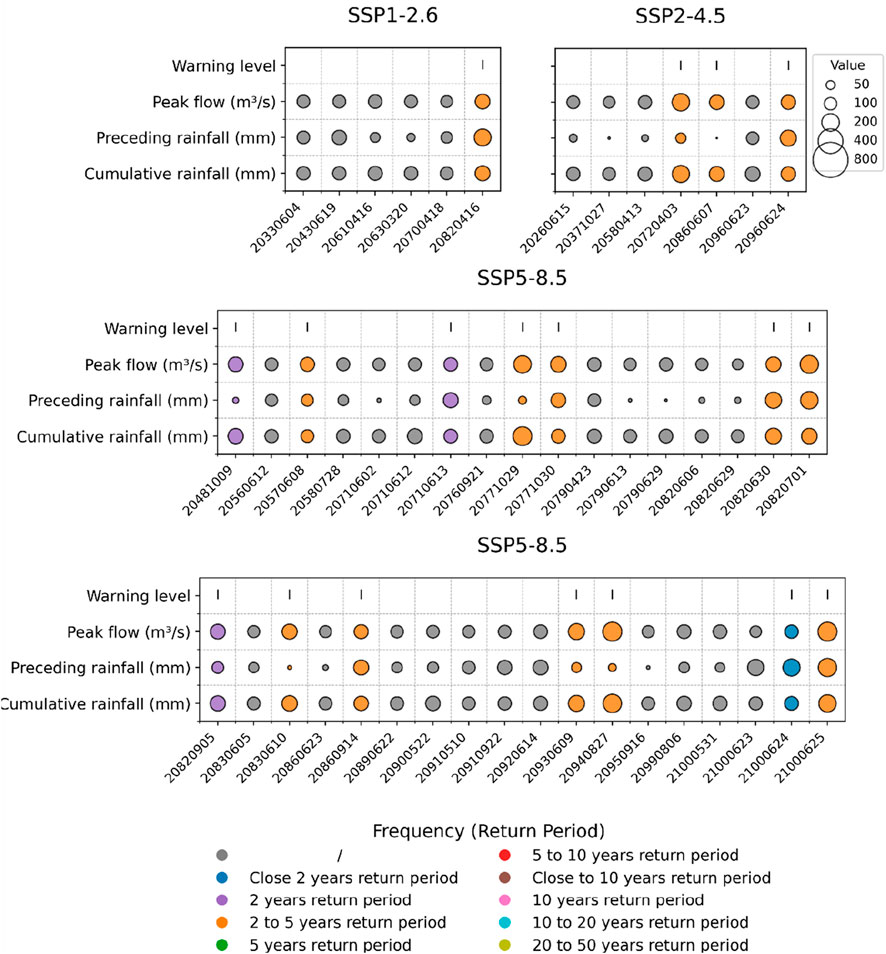
Figure 10. Analysis of flood response and early warning under future climate scenarios (SSP1-2.6、SSP2-4.5、SSP5-8.5) based on the CREST model.
Combined with the above analysis, it can be seen that in the simulation of the two hydrological models, the relative error of 12 sessions is within 20%, and the overall gap is large, whilst the flow simulation value of CNFF model is higher than that of the CREST model, with the former reaching 810.5 m3/s and the latter only 235.38 m3/s. This may be due to the fact that CNFF model focuses on the simulation of flash floods in small watersheds, which is more advantageous in the simulation of short time series. In addition, the CREST model is primarily designed for long-term series simulations, where it performs reliably in capturing the overall flow trends over extended periods. However, its ability to accurately simulate peak flow in short-term or extreme precipitation events is limited, particularly when precipitation intensity and runoff responses are more localized and rapid. The CREST model fails to fully capture the complexity of hydrological dynamics in small watersheds during extreme events, which helps explain why it underestimates peak flows and shows significant differences compared to the CNFF model, which is specifically designed for flash flood simulations in small watersheds. Therefore, while the CREST model provides reliable results in long-term trend analysis, its performance in peak flood prediction is less accurate, necessitating the use of other models or optimized calibration to obtain more accurate short-term predictions.
Accurate simulation and risk prediction of flash flood cultural processes in future scenarios are crucial for flash flood defense. Based on CMIP6 precipitation data, this paper selects two distributed hydrological models, namely, CNFF and CREST, to predict the changes of flash flood disaster risk under different climate scenarios in the future. In the analysis of future precipitation trends, the precipitation under the SSP5-8.5 scenario is higher than that under the SSP1-2.6 and SSP2-4.5 scenarios. Compared with the SSP1-2.6 scenario in the base period, the annual rainfall increase is more than that in the SSP2-4.5 scenario, but the increase is the most modest.
According to CNFF, a total of 26 flood peaks reached the early warning level, amongst which the floods reaching levels I and II were higher than those of III and IV, and the sensitivity of previous precipitation and early soil moisture to the peak flood flow was significant, and the maximum peak flood flow occurred in 21000625 times, which was 810.5 m3/s (20–50-year event).
Based on the CREST model, a total of 13 precipitation peaks reached the warning level, all of which were Level I. flood warnings, and the maximum number of simulated peak floods was 235.38 m3/s. The simulation results of the two models are quite different, and only 12 sessions have a relative error of less than 20%, which is mainly related to the model structure and data processing. Based on the results of this study, it is recommended to establish a dynamic flood early warning system in the basin, with a particular focus on enhancing monitoring and prevention efforts in June. At the same time, due to the limitations of time and data collection, multiple climate models, different downscaling methods, and high-resolution data can be used in follow-up research to further improve simulation accuracy.
The raw data supporting the conclusions of this article will be made available by the authors, without undue reservation.
QL: Conceptualization, Data curation, Formal Analysis, Investigation, Methodology, Project administration, Resources, Software, Supervision, Validation, Visualization, Writing–original draft, Writing–review and editing. NZ: Conceptualization, Data curation, Formal Analysis, Investigation, Methodology, Software, Supervision, Validation, Visualization, Writing–review and editing. LW: Conceptualization, Data curation, Formal Analysis, Investigation, Methodology, Validation, Visualization, Writing–review and editing. KY: Conceptualization, Data curation, Formal Analysis, Investigation, Methodology, Validation, Writing–review and editing. JWu: Formal Analysis, Investigation, Supervision, Validation, Writing–review and editing. JWa: Writing–review and editing. MM: Data curation, Formal Analysis, Funding acquisition, Investigation, Methodology, Project administration, Resources, Software, Supervision, Validation, Visualization, Writing–original draft, Writing–review and editing.
The author(s) declare that financial support was received for the research, authorship, and/or publication of this article. This research was supported by National Natural Science Foundation of China (42101086 and 42371086) and the Open Fund of the China Institute of Water Resources and Hydropower Research (IWHR-SKL-KF202310).
The authors declare that the research was conducted in the absence of any commercial or financial relationships that could be construed as a potential conflict of interest.
The author(s) declare that no Generative AI was used in the creation of this manuscript.
All claims expressed in this article are solely those of the authors and do not necessarily represent those of their affiliated organizations, or those of the publisher, the editors and the reviewers. Any product that may be evaluated in this article, or claim that may be made by its manufacturer, is not guaranteed or endorsed by the publisher.
Chen, C. Z., Gan, R., Feng, D. M., Yang, F., and Zuo, Q. T. (2022). Quantifying the contribution of SWAT modeling and CMIP6 inputting to streamflow prediction uncertainty under climate change. J. Clean. Prod., 364. doi:10.1016/j.jclepro.2022.132675
Dai, J., Hu, H. Z., Mao, X. M., and Zhang, J. (2023). Analysis of future climate change trends in the Shiyang River Basin based on CMIP6 multi-model projection data. Arid Zone Res. 40 (10), 1547–1562. doi:10.13866/j.azr.2023.10.02
Dong, T. Y., and Dong, W. J. (2021). Evaluation of extreme precipitation over Asia in CMIP6 models. Clim. Dyn. 57 (7-8), 1751–1769. doi:10.1007/s00382-021-05773-1
Fowler, H. J., Lenderink, G., Prein, A. F., Westra, S., Allan, R. P., Ban, N., et al. (2021). Anthropogenic intensification of short-duration rainfall extremes. Nat. Rev. Earth & Environ. 2 (2), 107–122. doi:10.1038/s43017-020-00128-6
Hao, S. J., Wang, W. C., Ma, Q., Li, C. Z., and Liu, C. J. (2023). A numerical rehearsal strategy of flash flood disaster with hydrological and hydrodynamic modelling: case study of “7·20” flash flood disaster in Wangzongdian Village, Henan Province. Water Resour. Hydropower Eng. 54 (06), 1–11. doi:10.13928/j.cnki.wrahe.2023.06.001
He, B., Li, C., Yao, Q., Wang, H., Luo, L., and Ma, M. (2024). The disaster-causing factors of the flash floods for the july 20th extreme rainstorm in henan, China. Front. Earth Sci. 12, 1438421. doi:10.3389/feart.2024.1438421
Hong, Y., Adhikari, P., and Gourley, J. J. (2013). “Flash flood,” in Encyclopedia of natural hazards (Netherlands: Springer), 324–325. doi:10.1007/978-1-4020-4399-4_136
Kan, G., Tang, G., Yang, Y., Hong, Y., Li, J., Ding, L., et al. (2017). An improved coupled routing and excess storage (CREST) distributed hydrological model and its verification in ganjiang river basin, China. Water 9 (11), 904. doi:10.3390/w9110904
Keeble, J., Hassler, B., Banerjee, A., Checa-Garcia, R., Chiodo, G., Davis, S., et al. (2021). Evaluating stratospheric ozone and water vapour changes in CMIP6 models from 1850 to 2100. Atmos. Chem. Phys. 21 (6), 5015–5061. doi:10.5194/acp-21-5015-2021
Kim, Y. H., Min, S. K., Zhang, X. B., Sillmann, J., and Sandstad, M. (2020). Evaluation of the CMIP6 multi-model ensemble for climate extreme indices. Weather Clim. Extrem., 29. doi:10.1016/j.wace.2020.100269
Li, Q., Li, Y., Zhao, L., Zhang, Z., Wang, Y., and Ma, M. (2024). Comprehensive risk assessment framework for flash floods in China. Water 16 (4), 616. doi:10.3390/w16040616
Li, X. T., Li, Z. L., and Han, R. C. (2023). Analysis of the application effects of different bias correction methods on GCM precipitation data. Hydrology 43 (03), 93–100, 117. doi:10.19797/j.cnki.1000-0852.20220060
Liu, C. J., Wen, L., Zhou, J., Guo, L., and Wei, Y. Q. (2019). Comparative analysis of hydrological models and hydrodynamic methods for calculating flash floods in small watersheds. J. China Inst. Water Resour. Hydropower Res. 17 (04), 262–270. doi:10.13244/j.cnki.jiwhr.2019.04.003
Liu, Y., and Huang, Y. (2020). Why flash floods occur differently across regions? A spatial analysis of China. Water 12 (12), 3344. doi:10.3390/w12123344
Lu, K. D., Arshad, M., Ma, X. Y., Ullah, I., Wang, J., and Shao, W. (2022). Evaluating observed and future spatiotemporal changes in precipitation and temperature across China based on CMIP6-GCMs. Int. J. Climatol. 42 (15), 7703–7729. doi:10.1002/joc.7673
Ma, J. X., Gao, H. R., and Xu, C. (2024). Characteristics of flash flood-debris flow disaster induced by the ‘23·7’ rainstorm in Hantai Village, Changping District, Beijing. Water Resour. Hydropower Eng. 55 (07), 1–18. doi:10.13928/j.cnki.wrahe.2024.07.001
Maria, B. L., Sant’anna, C. L. F., Oliveira, N. N. D., Pires, G. F., and Avila-Diaz, A. (2024). Bias correction in CMIP6 models simulations and projections for Brazil’s climate assessment. Earth Syst. Environ. 8 (1), 121–134. doi:10.1007/s41748-023-00368-8
Qiu, H. J., Su, L. L., Tang, B. Z., Yang, D., Ullah, M., Zhu, Y., et al. (2024). The effect of location and geometric properties of landslides caused by rainstorms and earthquakes. Earth Surf. Process. Landforms 49 (7), 2067–2079. doi:10.1002/esp.5816
Ridder, N. N., Pitman, A. J., and Ukkola, A. M. (2021). Do CMIP6 climate models simulate global or regional compound events skillfully? Geophys. Res. Lett. 48 (2). doi:10.1029/2020gl091152
Song, Y. H., Chung, E. S., and Shahid, S. (2021). Spatiotemporal differences and uncertainties in projections of precipitation and temperature in South Korea from CMIP6 and CMIP5 general circulation models. Int. J. Climatol. 41 (13), 5899–5919. doi:10.1002/joc.7159
Wang, W., Ju, Q., Wang, G. Q., Liu, C. S., Liu, Y. L., Hao, Z. C., et al. (2022). Applicability evaluation and application of CN05.1 gridded precipitation data in the Weihe River Basin. Hydrology 42 (06), 88–92. doi:10.19797/j.cnki.1000-0852.20210124
Wei, Y. D., Qiu, H. J., Liu, Z. J., Huangfu, W., Zhu, Y., Liu, Y., et al. (2024). Refined and dynamic susceptibility assessment of landslides using InSAR and machine learning models. Geosci. Front. 15, 101890. doi:10.1016/j.gsf.2024.101890
Wu, B., and Xin, X. G. (2019). Overview and review of the CMIP6 decadal climate prediction Project (DCPP). Adv. Clim. Change Res. 15 (5), 476–480. doi:10.1016/j.accre.2019.11.001
Wu, J. Y., Ju, Q., Liu, X. N., Lian, Z. X., Zhang, Y. Y., and Duan, Y. Q. (2023). Evaluation of CMIP6 models' capability in simulating precipitation and temperature in the Yellow River water conservation area. J. Water Resour. Hydraulic Eng. (06), 1–12. doi:10.12170/20230215001
Xu, H. W., Chen, H. P., and Wang, H. J. (2022). Future changes in precipitation extremes across China based on CMIP6 models. Int. J. Climatol. 42 (1), 635–651. doi:10.1002/joc.7264
You, Q. L., Cai, Z. Y., Wu, F. Y., Jiang, Z., Pepin, N., and Shen, S. S. P. (2021). Temperature dataset of CMIP6 models over China: evaluation, trend and uncertainty. Clim. Dyn. 57 (1-2), 17–35. doi:10.1007/s00382-021-05691-2
Zhang, C., Liao, H., Qu, J. S., Li, R., and Teng, M. X. (2023). A review of empirical studies on the socio-economic impacts of climate change. J. Beijing Inst. Technol. Soc. Sci. Ed. 25 (3), 15–25. doi:10.15918/j.jbitss1009-3370.2023.9452
Zhou, T. J., Chen, Z. M., Chen, X. L., Zuo, M., Jiang, J., and Hu, S. (2021). Interpretation of the IPCC AR6 report: future global climate—scenario-based projections and recent information. Adv. Clim. Change Res. 17 (6), 652–663. doi:10.1016/j.accre.2021.12.001
Keywords: flash flood, CREST, CMIP6, future scenario, daxi water Basin
Citation: Liu Q, Zhang N, Wang L, Yu K, Wu J, Wang J and Ma M (2025) Flash flood simulation based on distributed hydrological model in future scenarios. Front. Earth Sci. 12:1537486. doi: 10.3389/feart.2024.1537486
Received: 30 November 2024; Accepted: 20 December 2024;
Published: 14 January 2025.
Edited by:
Haijun Qiu, Northwest University, ChinaReviewed by:
Yongqiang Wang, Changjiang River Scientific Research Institute (CRSRI), ChinaCopyright © 2025 Liu, Zhang, Wang, Yu, Wu, Wang and Ma. This is an open-access article distributed under the terms of the Creative Commons Attribution License (CC BY). The use, distribution or reproduction in other forums is permitted, provided the original author(s) and the copyright owner(s) are credited and that the original publication in this journal is cited, in accordance with accepted academic practice. No use, distribution or reproduction is permitted which does not comply with these terms.
*Correspondence: Meihong Ma, bWFtaEB0am51LmVkdS5jbg==
Disclaimer: All claims expressed in this article are solely those of the authors and do not necessarily represent those of their affiliated organizations, or those of the publisher, the editors and the reviewers. Any product that may be evaluated in this article or claim that may be made by its manufacturer is not guaranteed or endorsed by the publisher.
Research integrity at Frontiers
Learn more about the work of our research integrity team to safeguard the quality of each article we publish.