- 1School of Hydraulic and Civil Engineering, Ludong University, Yantai, China
- 2Hebei Center for Ecological and Environmental Geology Research, Hebei GEO University, Shijiazhuang, China
- 3Hebei Key Laboratory of Optoelectronic Information and Geo-Detection Technology, Hebei GEO University, Shijiazhuang, China
- 4Beijing Gaoxin Municipal Engineering Technology Co., Ltd., Beijing, China
Currently, the accurate prediction of tunnel boring machine (TBM) performance remains a considerable challenge due to the complex interactions between the TBM and rock mass. In this study, the research work is based on part of a metro tunnel project that covers 2,083.94 m. The Gaussian mixture model (GMM) and K-nearest neighbor algorithm (KNN) are used to classify and predict the rock mass drillability in the TBM excavation process. Drillability indexes are introduced to cluster and classify the rock mass, including the penetration (P), field penetration index (FPI), torque penetration index (TPI), and specific energy (SE). Statistical characteristics of the drillability indexes were analyzed, and it was found that their distributions did not conform to the normal distribution, with large variation coefficients. Clustering analysis was then conducted on the TPI and FPI within the training group using the Gaussian mixture model, and six drillability categories of rock mass were classified. Subsequently, the mapping relationship between the cutterhead speed, advance speed, total advance force, and cutterhead torque in the training group and the drillability of rock mass was established based on the KNN classification model. It was revealed that when the K-value is set to 4, the model has high macro-F1, macro-P, and macro-R. Validated by the testing group data, this method has been proven to be feasible and effective. The research results indicate that this method can effectively classify and predict the drillability of tunneling surrounding rock mass in shield construction, particularly when the rock mass at the shield face is uniform and homogeneous. This provides a theoretical basis and technical support for safe and efficient shield tunneling.
1 Introduction
The tunnel boring machine (TBM) has become one of the primary methods of underground engineering construction. However, owing to the complicated geological conditions and the complexity of the TBM composition system, traditional methods such as theoretical analysis (Sanio, 1985; Rostami and Ozdemir, 1993) and numerical simulations (Guo-hui et al., 2018; Ya-dong et al., 2021) cannot meet the safety and efficiency requirements for TBM construction. So, the combined use of big operational TBM data with machine learning has become a focus of research (Hao-han et al., 2022; Jian-bin et al., 2023a; Zong-bao et al., 2024) in recent years. A large amount of data are collected during the TBM excavation process, and these data need to be preprocessed. The machine learning technique could be effective based on high-quality databases. This method mainly includes some learning algorithms such as the artificial neural network (ANN) (Armaghani et al., 2017), support vector machine (SVM) (Fattahi and Babanouri, 2017), deep neural network (DNN) (Koopialipoor et al., 2019), and random forest (RF) (Nadi and Moradi, 2019; Zhang, 2019). Certainly, these algorithms are still in continuous development (Mu-yuan et al., 2024).
Machine learning techniques have recently been applied to address various complicated and uncertain TBM excavation problems due to their strong mapping capacity in the field of underground engineering. For example, Suwansawat and Einstein (2006) proposed an approach based on the artificial neural network to predict the maximum surface settlement caused by EPB shield tunneling. Mahmoodzadeh et al. (2020) used seven intelligent methods to forecast the maximum surface settlement of an urban tunnel. Based on the Chinese code for rock mass classification, Qian-li et al. (2019) proposed the SVM model to assess the drillability of rock mass. Jun-hong et al. (2019) designed a feed-forward leave-multiple-out artificial neural network with two hidden layers to predict the geological stratum. In the field of unfavorable geological prediction, Tian-zheng et al. (2017) proposed the rock burst model using the genetic algorithms and extreme learning machine, with maximum shear stress, uniaxial compressive strength, uniaxial tensile strength, and rock elastic energy index as inputs and burst pit depth as the output. Zu-yu et al. (2020) developed a time-series forecasting method combined with a deep belief network to predict the tunnel collapse sections of the Yinsong project. In addition, Sun et al. (2018) constructed a dynamic load prediction model by RF on the basis of the integrated heterogeneous in situ data. Bo-yang et al. (2021) used a long short-term memory neural network to predict the TBM penetration rate, which was proved to be better than the recurrent neural network (RNN)-based model. Jin-hui et al. (2021) proposed and evaluated a long short-term memory model to predict the TBM performance in a real-time manner. In general, machine learning techniques have been widely used in underground engineering for surface settlement prediction, rock mass quality assessment, adverse geological forecasting, and the optimization of TBM operation parameters (Wen-tao et al., 2024; De-chun et al., 2024; Elbaz et al., 2024). There are many similar research works, but further detailed research is needed.
Rock mass quality is related to the setting of TBM excavation parameters and the safety of underground engineering construction. Rock mass classification is traditionally characterized on the basis of the geometric, mechanical, and physical properties of rock. Some well-known classification systems are widely used, such as Barton’s Q-system (Barton et al., 1974), Bieniawski’s rock mass rating (RMR) (Bieniawski, 1973), and Hoek–Brown’s geological strength index (GSI) (HOEK et al., 1995). However, due to the uncertainty of underground engineering, traditional methods have their limitations. With the development of machine learning, rock mass classification relying on machine learning is proved to be reasonable and feasible (Zhang, 2019; Zhi-jun et al., 2021). Various machine learning models for rock mass classification have been developed with higher prediction accuracy (Jian-bin et al., 2023a). Because different labels proposed by different researchers are based on a standard specified by an authority with subjective judgments, the research findings obtained from the machine learning techniques remain semi-empirical. There is still much research work to be done in the study of rock mass classification and prediction.
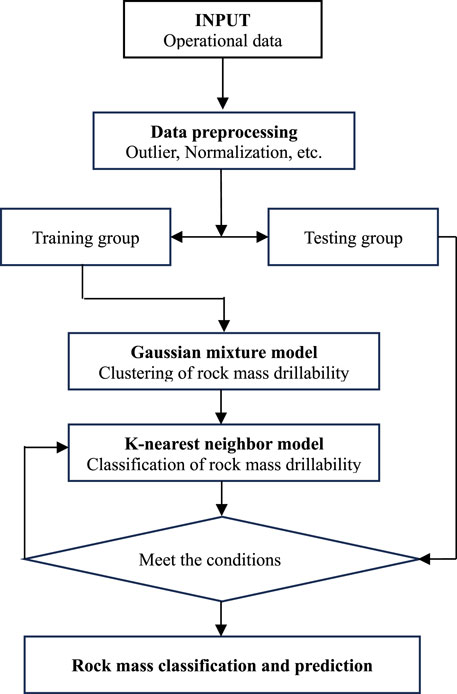
In this paper, an approach of rock mass classification and prediction is proposed based on the Gaussian mixture model and K-nearest neighbor algorithm with TBM operational data. The penetration rate (P), field penetration index (FPI), torque penetration index (TPI), and excavation specific energy (SE) were proposed as the evaluation indexes for the drillability difficulty of rock mass excavation. Then, a Gaussian mixture clustering model was established based on the FPI and TPI to analyze the clustering characteristics of TBM-excavated rock mass, resulting in the classification of rock mass drillability. Furthermore, a mapping relationship model between TBM excavation parameters and rock mass drillability indexes was established based on four basic excavation parameters, namely cutterhead speed, advance speed, total advance force, and cutterhead torque, enabling the prediction and recognition of rock mass drillability. The main components of this paper are shown as follows: Section 2 reviews the engineering project, which is a metro tunnel excavated by the EPB shield machine, and introduces the acquisition and preprocessing of big operational data. Section 3 presents theoretical methodology for rock mass classification, illustrating the GMM and KNN algorithm processes. The rock mass is clustered and classified with defined drillability indexes and is verified in Section 4. The final section summarizes the main work and conclusions of this paper.
2 Project review
2.1 Description of the project
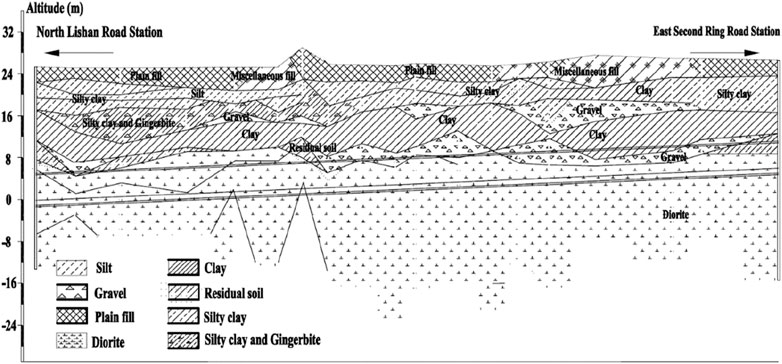
The operational data analyzed in this paper are collected from a metro tunnel project located in Shandong province, China. The tunnel links the North Lishan Road Station and East Second Ring Road Station, which has a total length of 2083.94 m. To bore this tunnel, an earth pressure balance (EPB) shield machine with an excavation diameter of 6.68 m was used. The burial depth of this tunnel ranges from 10.50 m to 24.15 m, and a part of the longitudinal geological profile of the tunnel is presented in Figure 1. Noticeably, from the ground surface to the tunnel floor, various geological layers are unevenly distributed, such as strongly and completely weathered diorite, clay, residual soil, and gravels. Some in situ geological samples are shown in Figure 2.
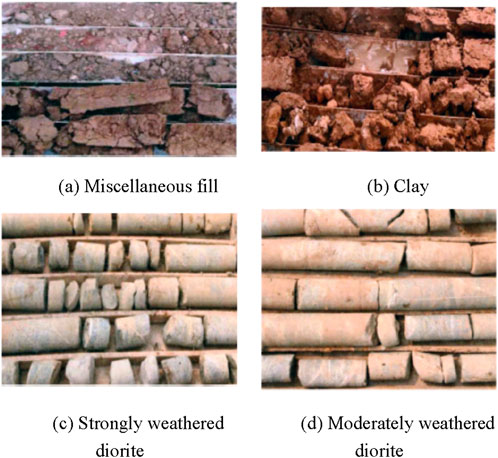
Figure 2. In situ geological samples: (A) miscellaneous fill, (B) clay, (C) strongly weathered diorite, and (D) moderately weathered diorite.
2.2 Acquisition and preprocessing of operational data
In order to study the relationship between surrounding rock mass properties and tunnel excavation parameters, the EPB machine operational data were collected from rings 823 to 873. The operational data were collected at a frequency of 1Hz, and 1,136,025 pieces of data were recorded. Four channels, namely, cutterhead speed, advance speed, total advance force, and cutterhead torque, are used in this paper to predict the rock mass classification. The raw operational data normally contain outliers and missing values, so data preprocessing is essential before machine learning work. According to the TBM data cleaning method (Zhang, 2019), the start-up and shutdown phases of the TBM operational data are removed with the outlier and missing value together, and only stable phase data are reserved. After the initial screening process, the data are divided into two parts randomly. The first 70% of the data are assumed as the training group to establish a machine learning model. The remaining 30% of the data are considered as the testing group to verify the model feasibility. The frequency distributions and statistical features of cutterhead speed, advance speed, total advance force, and cutterhead torque are shown in Figure 3. Taking cutterhead speed as an example, its maximum and minimum values are 1.56 and 1.46, respectively. The average, median, and coefficient of variation are represented by Ave, Med, and CV, respectively. It can be observed that the cutterhead speed basically remains constant at a value of 1.50. The numerical changes in advance speed and total advance force are significant. In addition, the cutterhead torque basically follows a Gaussian distribution.
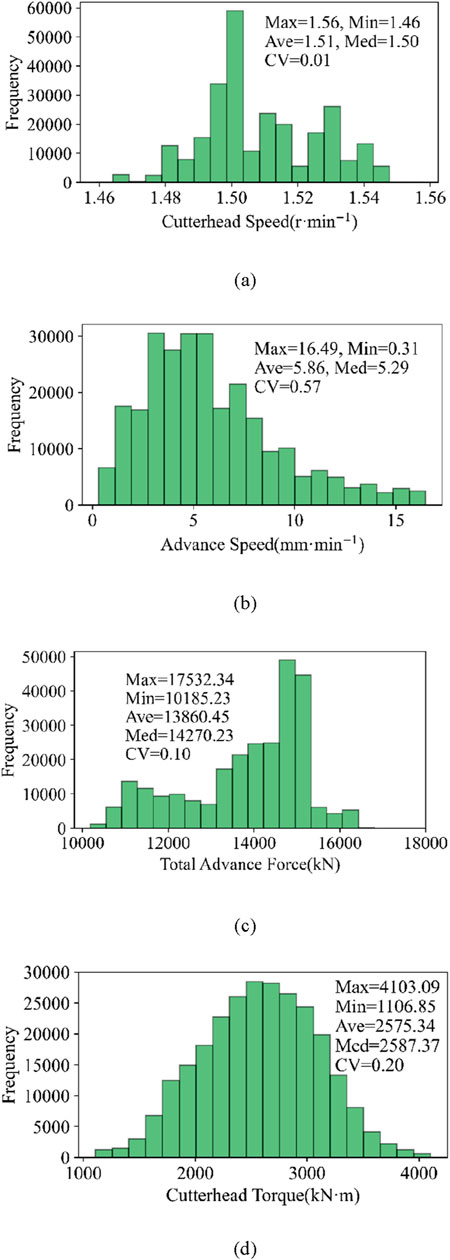
Figure 3. Frequency distributions and statistical features for the boring parameters: (A) cutterhead speed (r-min−1), (B) advance speed (mm-min−1), (C) total advance force (kN), and (D) cutterhead torque (kN m).
3 Methodology for the rock mass classification
A flowchart for the classification and prediction of rock mass drillability proposed in this paper is shown in Figure 4, and the details of each section are presented below.
3.1 Gaussian mixture model
A Gaussian mixture model (GMM), which can be regarded as an optimization of the K-Means model, is one of the most widely used clustering techniques. GMM is a new Gaussian mixture distribution obtained by linear superposition of multiple Gaussian distributions with different weights. The function is formulated in Equation 1:
where αk is the weight of the kth Gaussian distribution and satisfies the condition of
The expectation maximization (EM) algorithm is utilized to estimate the parameters of GMM. Each iteration contains two steps: the E-step and M-step. From this, Gaussian weight, mean vector, and covariance matrix are obtained. It is assumed that the observed dataset of the samples is denoted as X = (x1, x2, …, xN), and the estimated parameters in the GMM are denoted as θ = (α1, α2, …, αK, µ1, µ2, …, µK, Σ1, Σ2, …, ΣK). The variable Zjk is defined to represent that the observed data xj are drawn from the kth Gaussian distribution in the GMM, which is formulated in Equation 2.
The process can be simplified as follows:
Step 1: Initialize parameters.
Step 2: (E-step): Calculate the probability of the jth observation data drawn from the kth Gaussian distribution based on the current parameters, as given by Equation 3.
Step 3: (M-step): Calculate model parameters for a new iteration based on Equations 4–6.
where
Step 4: Repeat the calculation of the E-step and M-step until convergence.
The parameter K is the number of Gaussian distributions contained in the GMM, and it presents the categories that will be clustered. The value of K can be determined by the Bayesian information criterion (BIC) (Lorah and Womack, 2019; Yi-mei et al., 2021), as shown in Equation 7.
where n is the number of samples and L is the maximum value of the likelihood function of the cluster model.
3.2 K-nearest neighbor algorithm
The K-nearest neighbor (KNN) algorithm was first developed by Fix and Hodges (1989) and later expanded by Altman (1992). The method provides a non-parametric supervised learning approach for the classification and regression of the data being preprocessed. An object is classified by a plurality vote based on the Euclidean distances to its neighbors. Therefore, this method contains three basic key issues: the K-value, distance measurement, and voting rules. The K-value can be determined by K-fold cross-validation, in which the samples are divided into K groups and subjected to K rounds of investigation. The K-fold cross-validation method involves randomly dividing the training set into the K subsets of similar size and non-overlapping data. For different values of tuning parameters, K-1 subsets are selected to establish the model training set, and the model performance is evaluated on the remaining set. This process is repeated until all subsets have served as the validation set to assess model performance. Finally, the average of all model performances is obtained, and the optimal model under the given conditions is selected. This method is applied to a binary classifier that provides a positive or negative prediction, which can be true positive (TP), false positive (FP), true negative (TN), and false negative (FN). Precision, recall, and F1 are used to evaluate the performance for the binary classification problem (Jian-bin et al., 2023b). For multiple classification problems, the following indices are defined to evaluate classification performance.
The precision of multiple classification is defined by Equation 8.
The recall of multiple classification is defined by Equation 9.
The F1 score of multiple classification is defined by Equation 10.
where Pi is precision
4 Rock mass classification and prediction model
4.1 Rock mass drillability index
Currently, many research studies of rock mass recognition, drillability, and TBM excavation performance use penetration, field penetration index, torque penetration index, and specific energy as feature parameters (Jian-bin et al., 2023b). Taking them as references, these four drillability parameters are used for the analysis of the drillability and classification of rock mass in this paper. These four feature parameters are described as follows:
4.1.1 Penetration
where v is the cutterhead advance speed (mm·min-1) and n is the cutterhead speed (r⋅min-1).
4.1.2 Field penetration index
where F is the cutterhead total advance force (kN).
4.1.3 Torque penetration index
where T is the cutterhead torque (kN·m).
4.1.4 Specific energy
where D is the cutterhead diameter (m).
Noticeably, the greater the P is, the easier it is to excavate the rock mass. If the cutterhead total advance force and torque are small per unit penetration, indicating a low FPI and TPI, then the rock mass is more drillable. Similar to the FPI and TPI, the SE exhibits the same characteristics.
4.2 Drillability index statistical features
In order to obtain the data characteristics of the FPI, TPI, P, and SE, statistical analysis is conducted on the four drillability indexes of the training group. The frequency distributions and statistical features of these indexes are shown in Figure 5.
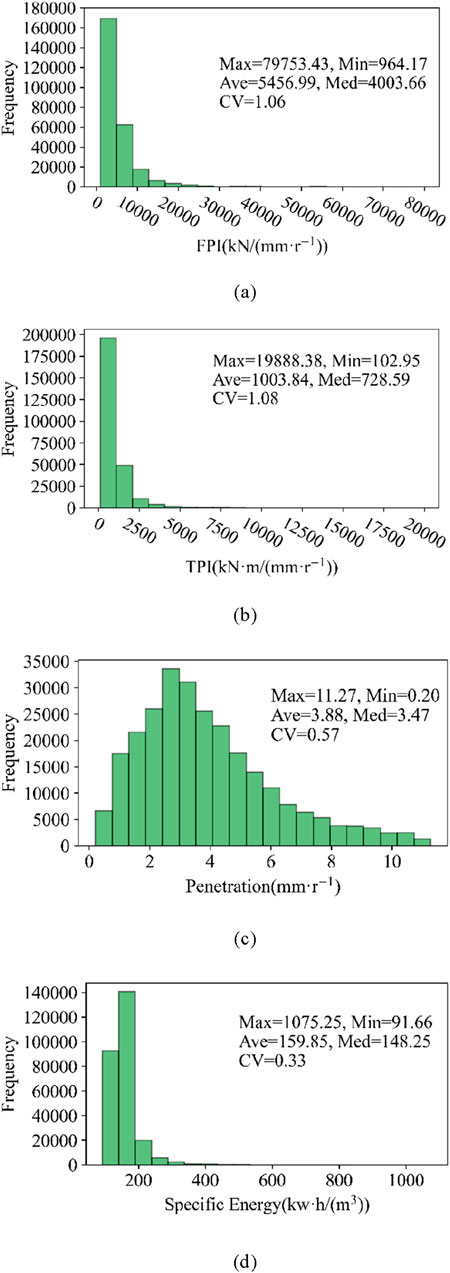
Figure 5. Frequency distributions and statistical features for the FPI, TPI, P, and SE. (A) FPI [kN/(mm r−1)]. (B) TPI [KN m/(mm r−1)]. (C) Penetration (mm r−1). (D) Specific energy [kw h/(m3)].
It can be observed that these four indexes do not meet the normal distribution, and the coefficients of variations are large. This indicates that the drillability of rock mass varies significantly and could be classified into many types for TBM excavation. When setting TBM excavation parameters, people tend to focus on the main rock categories. The problem will arise that TBM excavation parameters cannot be adjusted timely in the non-main rock mass. Therefore, classifying rock mass types is particularly important.
4.3 Drillability index regression features
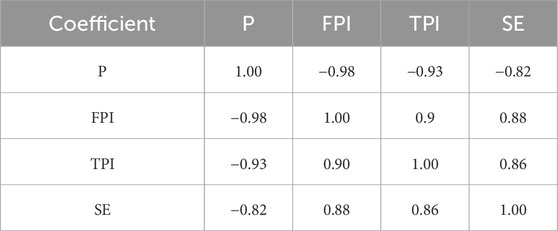
Spearman’s correlation coefficient is commonly used to evaluate the correlation relationship between two variable quantities. To illustrate the correlation between P, FPI, TPI, and SE, Spearman’s correlation coefficients of these four drillability indexes were calculated and are summarized in Table 1. Noticeably, the four drillability indexes are highly correlated.
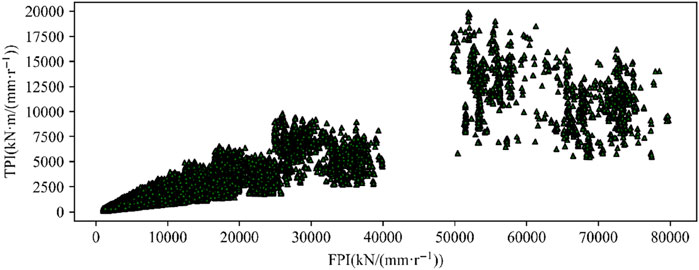
From the equations (Equations 11–13) of the P, FPI, and TPI, it can be seen that these three parameters eliminate the influence of the cutterhead speed. P can be seen as the normalized advance speed, whereas FPI and TPI can be seen as the normalized cutterhead total advance force and torque, respectively, with penetration as the normalization coefficient. The scatter plot of the training group TPI and FPI is shown in Figure 6, which indicates that there is a certain linear relationship between the two parameters.
The classic ordinary least squares (OLS) method is commonly used for the regression analysis of two variable quantities with the obvious linear relationship. The FPI and TPI are taken as the independent and dependent variables, respectively, and the OLS regression equation is shown in Equation 15. The relationship between the TPI standardized residual and independent variable FPI is shown in Figure 7. It can be observed that the TPI standardized residual increases regularly with the increase in the FPI, approximating the shape of a funnel.
4.4 Rock mass clustering model
As mentioned earlier, TPI and FPI are considered rock mass classification indexes. First, TPI and FPI are selected to mine the clustering features of rock mass drillability in the current construction environment by the GMM and realize the clustering of rock mass drillability. Second, based on the KNN classification model, the mapping relationship between the four parameters of the cutterhead speed, advance speed, total advance force, cutterhead torque, and the rock mass classification indexes is constructed.
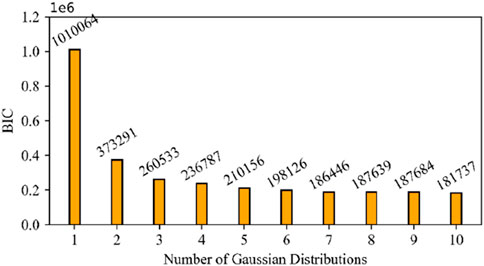
The number of Gaussian distributions, which determines the optimal categories, is identified using the Bayesian information criterion (BIC) for clustering with the GMM. The TPI and FPI of the training group are taken as input variable quantities for the GMM, and the output variable quantity is the clustered category. The range of clustering categories is 1–10. The variation in Bayesian information criterion value with the number of Gaussian distributions is shown in Figure 8. As the number of Gaussian distributions increases, the BIC value decreases. When the number of Gaussian distributions is 10, the BIC reaches its minimum. So, the optimal categories of the GMM are determined to be 10. The corresponding rock mass clustered results of GMM are shown in Figure 9. The numbers 1 to 10 represent the clustered categories, which are the drillable categories of the rock mass. It can be observed that there are differences in the sample size of different rock mass categories, indicating data imbalance for each category. Whether based on the TPI or FPI, the boundaries between each category are relatively clear.
The sample number of each category of rock mass and their percentages in the training group are counted, and the results are shown in Table 2 and Figure 10. It can be observed that the data on different rock masses are significantly imbalanced. The number of samples contained in categories 2, 4, 6, 7, and 9 is much smaller than that in other categories. The total number of samples included in categories 1, 3, 5, 8, and 10 is 257,615, accounting for 97.49% of the total training group. Noticeably, the main types of rock mass that can be excavated are the above five categories.
Based on the abovementioned analysis, the 10 rock mass categories automatically clustered by the GMM were reclassified according to rock mass drillability from small to large. Considering that categories 2, 4, 6, 7, and 9 contain relatively small sample sizes, they are classified as one category and named VI. The remaining categories are arranged in ascending order according to their drillability and named I, II, III, IV, and V. The TPI and FPI scatter plot of the training group after rock mass reclassification is shown in Figure 11.
The statistical features of cutterhead speed, advance speed, total advance force, and cutterhead torque for the six rock masses are shown in Table 3. It can be observed that the cutterhead speed remains basically unchanged in different types of rock mass, but the advance speed varies significantly. Overall, the total advance force and cutterhead torque decreases as the rock mass drillability increases, which corresponds to better classification.
4.5 Rock mass classification and prediction
On the basis of clustered rock mass by the GMM, in order to realize the recognition of rock mass drillability based on cutterhead speed, advance speed, total advance force, and cutterhead torque, the KNN classification model is used. The mapping relationship between the above four parameters and the rock mass drillability indexes is established. A KNN model is established by the training group, and then the model’s accuracy is verified by the testing group data. According to the theoretical knowledge of the KNN classification model, the distance metric of the KNN is set to Euclidean distance, and the voting rule is set to a weighted voting rule. The K-value is determined by K-fold cross-validation, and the curves of macro-F1, macro-P, and macro-R with different K-values are shown in Figure 12. It can be observed that the overall tendency of the three curves is relatively similar, with a characteristic of initially increasing and then gradually decreasing. When the K-value is set to 6, the macro-P reaches its optimal value of 0.966. Furthermore, when the K-value is set to 1 or 2, the macro-R reaches its optimal value of 0.959. When the K-value is set to 4, the optimal value of macro-F1 is 0.961, and at this time, the macro-P and macro-R reach 0.965 and 0.958, respectively. Since the K-value is determined by macro-F1, it is set to 4.
The data on the testing group are taken into the KNN classification model, and the TPI and FPI scatter plot is shown in Figure 13. It can be observed that the classification and recognition of the drillability of the rock mass in the testing group are basically consistent with those in the training group. This indicates that the feasibility of the training model is fine.
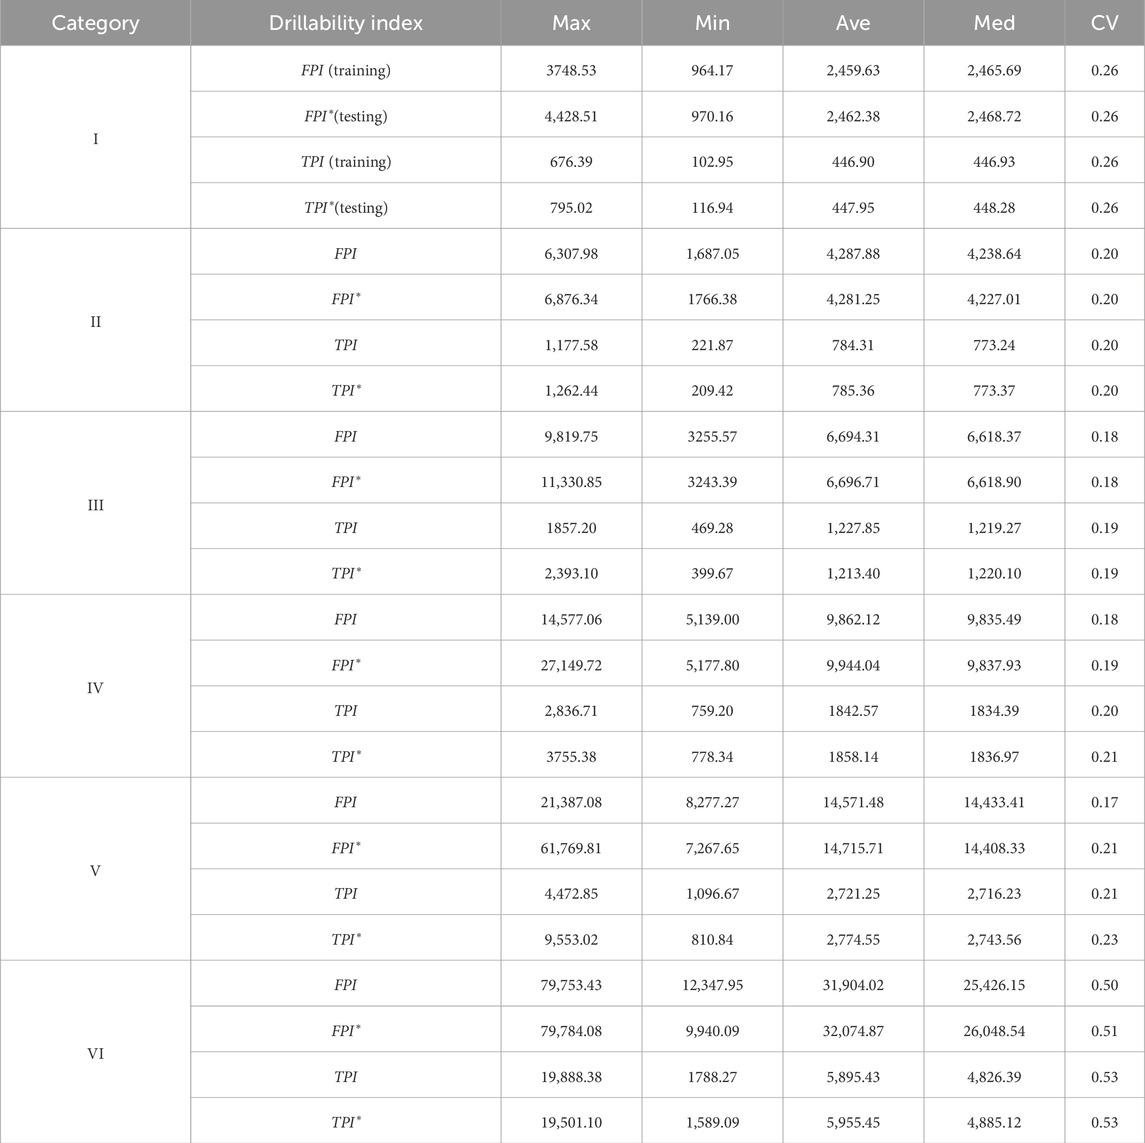
To further explore the application effect of the KNN classification model in predicting and identifying drillability of the rock mass, the statistical characteristics of the FPI and TPI for both the testing and training groups are compared. The results are shown in Table 4. It can be observed that the drillability of the rock mass of the testing group is classified by the KNN model, and the statistical characteristics of the FPI and TPI slightly differ from those of the training group. This further indicates that it is feasible to explore the complex mapping relationship between the cutterhead speed, advance speed, total advance force, and cutterhead torque in the raw boring parameters and the rock mass drillability by the KNN classification model, and the prediction effect is quite good.
5 Conclusion
Currently, when geological parameters are not easily available, rock mass classification and prediction are important and worth studying. This paper explores the feasibility of using the Gaussian mixture model and K-nearest neighbor algorithm to classify and predict the rock mass drillability in the TBM excavation process with its preprocessed operational data. The TPI and FPI are taken as rock mass classification and prediction indicators in conjunction with four raw boring parameters: cutterhead rotation speed, advance speed, total advance force, and cutterhead torque. The preprocessed operational data are divided into training and testing groups for rock mass classification. The training group data are used for rock mass clustering, whereas the testing group data are used to verify and predict the rock mass classification. The main conclusions obtained in this paper include the following:
(1) The raw operational data on shield tunneling were preprocessed, and the penetration degree P, the thrust penetration index FPI, the torque penetration index TPI, and the specific energy of tunneling SE were proposed as the evaluation indexes for the drillability difficulty of rock mass excavation. The statistical characteristics of the raw operational data and the rock drillability indexes were summarized and analyzed. Numerical changes in advance speed and total advance force were significant, and the cutterhead torque essentially followed a Gaussian distribution. The FPI and TPI did not follow the normal distribution with large coefficients of variation. Additionally, the TPI standardized residual increased regularly with the increase in the FPI, approximating the shape of a funnel.
(2) A Gaussian mixture clustering model was established based on the thrust penetration index FPI and torque penetration index TPI to analyze the clustering characteristics of TBM-excavated rock mass, and the classification of rock mass drillability was achieved. Eventually, the surrounding rock was clustered into six categories.
(3) A mapping relationship model between TBM excavation parameters including cutterhead speed, advance speed, total advance force and cutterhead torque, and rock mass drillability indexes was established based on the KNN classification model, enabling prediction and recognition of rock mass drillability. When the K-value is set to 4, this method has been proven to be feasible and effective.
(4) The research findings have identified the drillability of shield strata, providing a theoretical basis and technical support for safe and efficient tunneling with a shield. However, this model method is more suitable when the distribution of rock around the shield face is relatively uniform and single. When applied to composite strata, the predictive accuracy of this method may be limited, and its applicability requires further in-depth study.
Data availability statement
The original contributions presented in the study are included in the article/Supplementary Material; further inquiries can be directed to the corresponding authors.
Author contributions
MS: conceptualization and writing–original draft. SC: methodology and writing–review and editing. HH: software and writing–review and editing. WW: validation and writing–review and editing. KS: data curation and writing–review and editing. XL: validation and writing–review and editing.
Funding
The author(s) declare that financial support was received for the research, authorship, and/or publication of this article. This work was financially funded by the Open Project Program of Hebei Center for Ecological and Environmental Geology Research (JSYF-202304), the project (No. 51978322) supported by the National Natural Science Foundation of China, and the project (20210117) supported by Ludong University.
Conflict of interest
Authors HH, WW, and XL were employed by Beijing Gaoxin Municipal Engineering Technology Co., Ltd.
The remaining authors declare that the research was conducted in the absence of any commercial or financial relationships that could be construed as a potential conflict of interest.
Publisher’s note
All claims expressed in this article are solely those of the authors and do not necessarily represent those of their affiliated organizations, or those of the publisher, the editors, and the reviewers. Any product that may be evaluated in this article, or claim that may be made by its manufacturer, is not guaranteed or endorsed by the publisher.
References
Altman, N. S. (1992). An introduction to kernel and nearest-neighbor nonparametric regression. Am. Statistician 46 (3), 175–185. doi:10.1080/00031305.1992.10475879
Armaghani, D. J., Mohamad, E. T., Narayanasamy, M. S., Narita, N., and Yagiz, S. (2017). Development of hybrid intelligent models for predicting TBM penetration rate in hard rock condition. Tunn. Undergr. Space Technol. 63, 29–43. doi:10.1016/j.tust.2016.12.009
Barton, N., Lien, R., and Lunde, J. (1974). Engineering classification of rock masses for the design of tunnel support. Rock Mech. 6 (4), 189–236. doi:10.1007/bf01239496
Bieniawski, Z. T. (1973). Engineering classification of jointed rock masses. Civ. Engineering= Siviele Ingenieurswese (12), 335–343.
Bo-yang, G., Rui-rui, W., Chun-jin, L., Guo, X., Liu, B., and Zhang, W. (2021). TBM penetration rate prediction based on the long short–term memory neural network. Undergr. Space 6 (6), 718–731. doi:10.1016/j.undsp.2020.01.003
De-chun, L., Yi-han, L., Fan-chao, K., He, X., Zhou, A., and Du, X. (2024). A novel Bi-LSTM method fusing current and historical data for tunnelling parameters of shield tunnel. Transp. Geotech. 49, 101402. doi:10.1016/j.trgeo.2024.101402
Elbaz, K., Shui-Long, S., An-nan, Z., and Yoo, C. (2024). Reinforcement learning-based optimizer to improve the steering of shield tunneling machine. Acta Geotech. 19, 4167–4187. doi:10.1007/s11440-023-02136-4
Fattahi, H., and Babanouri, N. (2017). Applying optimized support vector regression models for prediction of tunnel boring machine performance. Geotechnical Geol. Eng. 35 (5), 2205–2217. doi:10.1007/s10706-017-0238-4
Fix, E., and Hodges, J. L. (1989). Discriminatory analysis. Nonparametric discrimination: consistency properties. Int. Stat. Review/Revue Int. Stat. 57 (3), 238–247. doi:10.2307/1403797
Guo-hui, L. I., Wen-jin, W., Zhi-juan, J., Zuo, L., Wang, F., and Wei, Z. (2018). Mechanism and numerical analysis of cutting rock and soil by TBM cutting tools. Tunn. Undergr. Space Technol. 81, 428–437. doi:10.1016/j.tust.2018.08.015
Hao-han, X., Wen-kun, Y., Jing, H. U., Zhang, Y. P., Jing, L. J., and Chen, Z. Y. (2022). Significance and methodology: preprocessing the big data for machine learning on TBM performance. Undergr. Space 7 (4), 680–701. doi:10.1016/j.undsp.2021.12.003
Hoek, E., Kaiser, P. K., and Bawden, W. F. (1995). Support of underground excavations in hard rock. Rotterdam, Netherlands: Balkema.
Jian-bin, L. I., Zu-yu, C., Xu, L. I., Jing, L. J., Zhang, Y. P., Xiao, H. H., et al. (2023a). Feedback on a shared big dataset for intelligent TBM Part I: feature extraction and machine learning methods. Undergr. Space 11, 1–25. doi:10.1016/j.undsp.2023.01.001
Jian-bin, L. I., Zu-yu, C., Xu, L. I., Jing, L. J., Zhang, Y. P., Xiao, H. H., et al. (2023b). Feedback on a shared big dataset for intelligent TBM Part II: application and forward look. Undergr. Space 11, 26–45. doi:10.1016/j.undsp.2023.01.002
Jin-hui, L., Peng-xi, L., Dong, G., Li, X., and Chen, Z. (2021). Advanced prediction of tunnel boring machine performance based on big data. Geosci. Front. 12 (1), 331–338. doi:10.1016/j.gsf.2020.02.011
Jun-hong, Z., Mao-lin, S., Gang, H., Song, X., Zhang, C., Tao, D., et al. (2019). A data-driven framework for tunnel geological type prediction based on TBM operating data. IEEE Access 7, 66703–66713. doi:10.1109/ACCESS.2019.2917756
Koopialipoor, M., Tootoonchi, H., Armaghani, D. J., Tonnizam Mohamad, E., and Hedayat, A. (2019). Application of deep neural networks in predicting the penetration rate of tunnel boring machines. Bull. Eng. Geol. Environ. 78 (8), 6347–6360. doi:10.1007/s10064-019-01538-7
Lorah, J., and Womack, A. (2019). Value of sample size for computation of the Bayesian information criterion (BIC) in multilevel modeling. Behav. Res. methods 51 (1), 440–450. doi:10.3758/s13428-018-1188-3
Mahmoodzadeh, A., Mohammadi, M., Daraei, A., Farid Hama Ali, H., Kameran Al-Salihi, N., and Mohammed Dler Omer, R. (2020). Forecasting maximum surface settlement caused by urban tunneling. Automation Constr. 120, 103375. doi:10.1016/j.autcon.2020.103375
Mu-yuan, S., Ming-hui, Y., Gao-zhan, Y., Chen, W., and Lyu, Z. (2024). Artificial intelligence driven tunneling-induced surface settlement prediction. Automation Constr. 168, 105819. doi:10.1016/j.autcon.2024.105819
Nadi, A., and Moradi, H. (2019). Increasing the views and reducing the depth in random forest. Expert Syst. Appl. 138, 112801. doi:10.1016/j.eswa.2019.07.018
Qian-li, Z., Zhen-yu, L., and Jian-rong, T. (2019). Prediction of geological conditions for a tunnel boring machine using big operational data. Automation Constr. 100, 73–83. doi:10.1016/j.autcon.2018.12.022
Rostami, J., and Ozdemir, L. (1993). A new model for performance prediction of hard rock TBM//Proceedings of the Rapid Excavation and Tunneling Conference. Boston, 793–809.
Sanio, H. P. (1985). Prediction of the performance of disc cutters in anisotropic rock. Int. J. Rock Mech. Min. Sci. & Geomechanics Abstr. 22 (3), 153–161. doi:10.1016/0148-9062(85)93229-2
Sun, W., Mao-lin, S., Chao, Z., Zhao, J., and Song, X. (2018). Dynamic load prediction of tunnel boring machine (TBM) based on heterogeneous in-situ data. Automation Constr. 92, 23–34. doi:10.1016/j.autcon.2018.03.030
Suwansawat, S., and Einstein, H. H. (2006). Artificial neural networks for predicting the maximum surface settlement caused by EPB shield tunneling. Tunn. Undergr. space Technol. 21 (2), 133–150. doi:10.1016/j.tust.2005.06.007
Tian-zheng, L. I., Yong-xin, L. I., and Xiao-li, Y. (2017). Rock burst prediction based on genetic algorithms and extreme learning machine. J. Central South Univ. 24 (9), 2105–2113. doi:10.1007/s11771-017-3619-1
Wen-tao, S., Yan, L., Huan-wei, W., Qiu, Y., Chen, C., and Gao, X. (2024). Prediction method of longitudinal surface settlement caused by double shield tunnelling based on deep learning. Sci. Rep. 14, 908. doi:10.1038/s41598-023-49096-z
Ya-dong, X., Jie, Z., Liu, C., Shadabfar, M., and Zhang, J. (2021). Rock fragmentation induced by a TBM disc-cutter considering the effects of joints: a numerical simulation by DEM. Comput. Geotechnics 136, 104230. doi:10.1016/j.compgeo.2021.104230
Yi-mei, W., Hui, L., Peng, S., Ze-chun, H., and Lin-lin, W. (2021). Short-term power forecasting method of wind farm based on Gaussian Mixture Model clustering. Automation Electr. Power Syst. 45 (7), 37–43. doi:10.7500/AEPS20200616005
Zhang, P. (2019). A novel feature selection method based on global sensitivity analysis with application in machine learning-based prediction model. Appl. Soft Comput. 85, 105859. doi:10.1016/j.asoc.2019.105859
Zhi-jun, W., Ru-lei, W., Zhao-fei, C., and Liu, Q. (2021). Real-time rock mass condition prediction with TBM tunneling big data using a novel rock-machine mutual feedback perception method. J. Rock Mech. Geotechnical Eng. 13 (6), 1311–1325. doi:10.1016/j.jrmge.2021.07.012
Zong-bao, F., Jing-yi, W., Wen, L., Wu, X., and Zhao, P. (2024). Data-driven deformation prediction and control for existing tunnels below shield tunneling. Eng. Appl. Artif. Intell. 138, 109379. doi:10.1016/j.engappai.2024.109379
Keywords: tunnel boring machine, rock mass classification, operational data mining, Gaussian mixture model, K-nearest neighbor
Citation: Sun M, Chen S, He H, Wang W, Song K and Lin X (2024) Classification and prediction of rock mass drillability for a tunnel boring machine based on operational data mining. Front. Earth Sci. 12:1518844. doi: 10.3389/feart.2024.1518844
Received: 30 October 2024; Accepted: 03 December 2024;
Published: 23 December 2024.
Edited by:
Chong Xu, Ministry of Emergency Management, ChinaReviewed by:
Jiaqi Guo, Henan Polytechnic University, ChinaMingchao Li, Tianjin University, China
Xin Huang, Anhui University of Science and Technology, China
Peng He, Shandong University of Science and Technology, China
Copyright © 2024 Sun, Chen, He, Wang, Song and Lin. This is an open-access article distributed under the terms of the Creative Commons Attribution License (CC BY). The use, distribution or reproduction in other forums is permitted, provided the original author(s) and the copyright owner(s) are credited and that the original publication in this journal is cited, in accordance with accepted academic practice. No use, distribution or reproduction is permitted which does not comply with these terms.
*Correspondence: Song Chen, Y2hlbm5zb25nZ0AxNjMuY29t; Huafei He, c3VuX3l0dUAxNjMuY29t
 Mingshe Sun1
 Song Chen