- PetroChina Daqing Oilfield Co., Ltd., Daqing, China
Digital rocks constructed from micro-CT image at a single-resolution face limitations in accurately identifying the entire pore space and mineral components of tight sandstones, due to their high content of nanoscale pores and clay. Consequently, the porosity values derived from such digital rocks are significantly lower compared to those obtained through laboratory measurements, resulting in discrepancies between the measured and calculated petrophysical properties. This study introduces a multi-scale digital rock modeling method by integrating three-dimensional micro-CT images acquired at two distinct resolutions and two-dimensional SEM images. Plunger-shaped core samples and their corresponding sub-samples were scanned at resolutions of 13.99 μm/voxel and 2.99 μm/voxel, respectively. The scale-invariant feature transform (SIFT) image registration technique was employed to accurately align the two sets of grayscale CT images. Correlation curves between the grayscale value in low-resolution CT images and various mineral contents were established based on the aligned regions, and utilized to construct multi-scale digital rock models. Intragranular pores, unresolvable by the micro-CT images, were identified using SEM imaging, enabling the incorporation of fine-scale features into the models. The resulting multi-scale digital rock models exhibited bulk porosity values that closely matched laboratory helium porosity measurements. Additionally, the elastic moduli calculated by the differential effective medium (DEM) model and the finite element method (FEM) demonstrated good correspondence with experimental results. These results validate the proposed multi-scale digital rock modeling method as an effective approach for accurately characterizing the porosity and mineral components of tight sandstone reservoirs.
1 Introduction
In modern society, the demand for fossil fuels continues to grow, while reserves of conventional oil and gas are gradually depleting. Consequently, the exploration and development of unconventional oil and gas resources have become increasingly important within the petroleum industry. In recent years, the production of oil and gas from unconventional resources has experienced significant growth (Tong et al., 2018; Wang et al., 2016). Among unconventional reservoirs, tight sandstone reservoirs are one of the major reservoirs for unconventional gas resources. Their pore structures and physical properties are crucial for effective reservoir development (Guo et al., 2022; Li et al., 2017; Wang et al., 2017; Yin et al., 2017). However, tight sandstones are typically characterized by complex pore structures, a broad pore size distribution, and low porosity and permeability. These characteristics present significant challenges for conventional petrophysical experimental techniques when attempting to accurately determine their pore structure features and physical properties (Zhang et al., 2017).
Methods for measuring the porosity of low-permeability rock cores can be broadly classified into two categories: laboratory-based direct measurement techniques and indirect methods based on various downhole testing techniques. Laboratory techniques primarily include mercury intrusion porosimetry (MIP) and nitrogen gas adsorption (N2GA). MIP functions on the principle that mercury, as a non-wetting liquid, infiltrates pores under applied pressure (Abell et al., 1999). However, this method risks damaging the pore structure, particularly in smaller pores, as mercury infiltration requires higher pressures (Clarkson and Marc Bustin, 1996). In contrast, N2GA offers greater accuracy but is limited in its capacity to detect pores larger than 200 nm due to the experimental mechanism and sample size constraints. Indirect methods mainly predict core porosity from logging data, such as electrical imaging and sonic logging data (Alizadeh et al., 2015; Close et al., 2009; Newberry et al., 1996; Tixier et al., 1959; Yamada et al., 2013). Laboratory porosity measurements are not only time-consuming and costly but may also cause irreversible damage to the samples. Indirect methods are heavily dependent on the accuracy of the logging data and require a multitude of parameters. Variability in geological environments across different regions may further introduce uncertainties into these methods, affecting the reliability of these methods. Moreover, these traditional methods provide only average characteristics of the pore structure, lacking the capability to accurately delineate the microscopic features of the core pores. This limitation hampers their ability to comprehensively characterize the complexity of low-permeability rocks.
Digital rock technology, which digitizes actual rock cores using high-resolution imaging techniques such as X-ray computed tomography (CT) and scanning electron microscopy (SEM), offers an alternative approach. This technology provides detailed microscopic structural information at the pore scale, enabling the application of advanced numerical algorithms to simulate rock physics experiments. These simulations can effectively analyze the response of physical properties in rock samples. Digital rock technology simplifies the research process, reduces costs and time, enhances result repeatability, and avoids destructive testing of physical samples. It addresses challenges associated with measuring and quantitatively analyzing rock physical parameters, thereby overcoming the inherent limitations of conventional experimental techniques. In recent years, digital rock technology has become a pivotal tool for pore structure analysis and investigation of rock physical properties. Researchers have developed a variety of methods for constructing three-dimensional (3D) digital rock models, primarily focusing on direct modeling utilizing 3D CT images and reconstruction methods based on two-dimensional (2D) images (Bin et al., 2013; Hazlett, 1997; Liu et al., 2023; Liu et al., 2014; Quiblier, 1984; Wu et al., 2004; Yin et al., 2019; Zhao et al., 2007).
However, the unique characteristics of tight sandstones, such as low porosity, low permeability, wide pore size distribution, and high clay content, may lead to inaccuracies in structure modeling when utilizing digital rock technology based on single-resolution CT scanning. These limitations often lead to significant discrepancies between numerical simulation results and experimental data. To address this issue, this study presents a multi-scale digital rock modeling method that integrates 3D micro-CT images acquired at different resolutions with nanoscale 2D images obtained via SEM. Using the constructed multi-scale digital rock, we calculated the porosity and elastic moduli of tight sandstone samples. The calculated results exhibit good agreement with the laboratory measurements, suggesting that the multi-scale digital rock model provides an accurate depiction of the porosity and mineral components of actual tight sandstones.
2 Samples and experimental measurements
To evaluate the performance of the multi-scale digital rock modeling method proposed in this study, two tight sandstone cores from Changqing Oilfield were selected for digital rock construction and elastic moduli calculations. These core samples, which are plunger-shaped and labeled as N1 and N2, have a diameter of 24.5 mm and were initially subjected to low-resolution CT scanning. To facilitate the construction of a multi-scale digital rock, a cylindrical sub-sample with a diameter of 5 mm was extracted from each original core sample for higher-resolution CT scanning. Figure 1 presents a schematic diagram and photographs of the test sample, illustrating the extraction of the smaller cylindrical sub-sample from the larger core.

Figure 1. (A) Schematic diagram illustrating the extraction of a 5 mm diameter cylindrical subsample from a 24.5 mm diameter plunger core sample. (B) Photographs of the N1 core sample and its sub-samples.
To assess the accuracy of the proposed multi-scale 3D digital rock modeling method, laboratory measurements were performed to characterize various properties of the core samples. Helium porosity measurements yielded values of 11.75% for the N1 core and 12.17% for the N2 core. Acoustic properties of the cores were also measured. When saturated with water, the longitudinal wave velocities were 4,217.6 m/s for the N1 core and 4,327.8 m/s for the N2 core, and the corresponding shear wave velocities were 2,551.8 m/s and 2,235.8 m/s, respectively. XRD experiments were conducted to analyze mineral contents, with the results presented in Table 1. These results indicate that the mineral components and their content of the two cores are similar, with the clay content in the N2 core being slightly higher than that in the N1 core, which is similar to the difference in porosities, demonstrating that the clay pores play a significant role in contributing the overall porosity.
3 Multi-scale 3D digital rock modeling method
3.1 Multi-resolution images
Imaging techniques used in digital rock modeling commonly include X-ray CT, SEM, focused ion beam scanning electron microscopy (FIB-SEM), etc. In this study, X-ray CT imaging was employed to construct 3D digital rock models. X-ray CT imaging is a non-destructive testing technology widely utilized in medical and industrial applications. The penetration of X-rays through an object causes attenuation, the extent of which depends on the material’s properties, such as thickness and density. CT scans of cores taken from different angles generate attenuation maps (Dunsmuir et al., 1991), which are processed using reconstruction algorithms to produce 3D grayscale images. The grayscale values of pixels in these images correspond to the degree of X-ray attenuation, accurately reflecting the spatial distribution of different components.
Tight sandstone core samples and their sub-samples were imaged using CT scans of different resolutions. Initially, CT imaging with a resolution of 13.99 μm/voxel was performed on two original tight sandstone core samples. After extracting sub-samples from the original cores, high-resolution (2.99 μm/voxel) CT imaging was conducted on the small sub-samples. The 3D CT images had a resolution of 1,920 × 1,920 × 1,536 voxels. Figure 2 shows the CT scan slice images for both N1 and N2 samples at the different resolutions, highlighting the level of detail achieved at each scanning resolution. To identify micropores beyond the resolution limit of CT scanning, broad ion beam scanning electron microscopy (BIB-SEM) with a resolution of 5 nm/pixel was employed. Furthermore, to create a 2D image of the core surface with a large field of view, the MAPS image stitching technique was utilized. This technique involves combining multiple high-resolution SEM images to form a single, expansive image (Lemmens and Richards, 2013). The resulting MAPS image was of a considerable size, measuring 105,000 × 106,000 pixels, which provides a detailed and expansive view of the core’s surface.
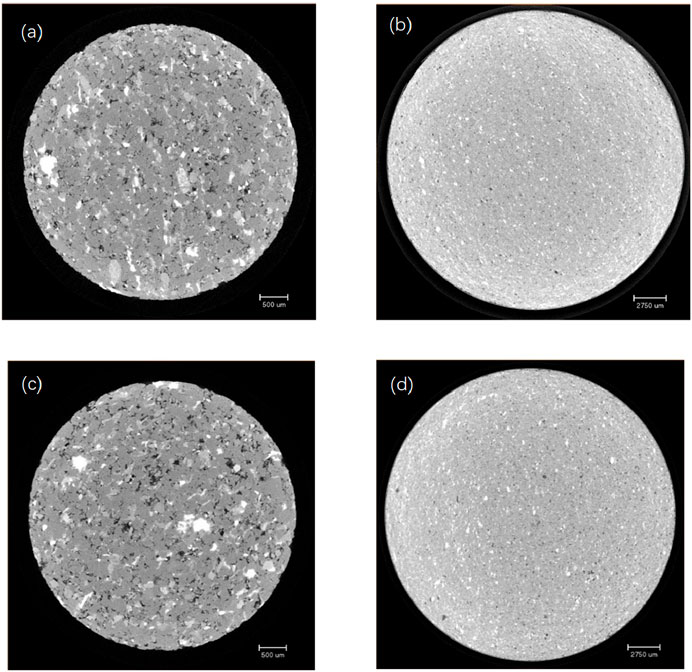
Figure 2. High-resolution (2.99 μm/voxel) CT scan slice images of the (A) N1 and (C) N2 sub-samples. Low-resolution (13.99 μm/voxel) CT images of the (B) N1 and (D) N2 origin samples.
3.2 Image registration method
Image registration techniques aim to establish correspondence between corresponding positions in two different images through various operations such as rigid transformation, similarity transformation, affine transformation, projection transformation, and polynomial transformation. This technology is widely applied in medical image processing, image analysis, remote sensing fusion, and computer vision.
Image registration methods can be broadly categorized into information-based registration and feature-based registration. Grayscale-based registration methods, which rely on the grayscale features of two images, have been extensively studied. The principle of this approach involves using the grayscale value information at each position for alignment. Because images typically contain vast amounts of grayscale data, this method requires substantial computational resources and often results in prolonged registration times. Furthermore, because the two images may not be captured simultaneously or with the same equipment, variations in grayscale information can significantly reduce the success rate of registration. In contrast, feature-based image registration methods offer lower computational requirements and faster processing speeds, effectively enhancing both the efficiency and accuracy of registration. Algorithms such as the Harris corner detection, Moravec algorithm, and scale-invariant feature transform (SIFT) have been developed to support feature-based image registration.
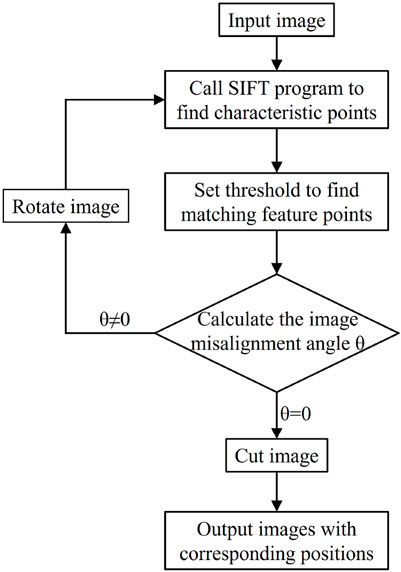
In this study, the SIFT algorithm was employed for image registration, a method based on feature points. This method was first introduced by Lowe at the International Conference on Computer Vision in 1999 (Lowe, 1999). SIFT algorithm is based on the scale space and ensures invariance to image translation, rotation, scaling, and even affine transformations. The algorithm represents image information across various scales using a Difference of Gaussian (DOG) pyramid and identifies key points by detecting extrema in the DOG images. The precise locations and scales of these key points are determined using an optimization algorithm, which also eliminates points with poor responses or edge responses, thereby yielding the image’s feature points. By calculating the magnitude and orientation of gradients around the feature points, an orientation is assigned, ensuring the feature points remain invariant to scale and rotation. Local image information around each feature point is then used to generate distinctive descriptors, further enhancing the accuracy of feature matching. The positional information of matching feature points allows the calculation of the matching region between two images. Corresponding sections of images with varying resolutions can be aligned through operations such as rotation and cropping. These functions can be implemented using the open-source program “siftdemoV4” developed by Lowe (1999), Lowe (2004). Figure 3 illustrates the flowchart of the image registration process, detailing each step in the procedure.
3.3 Microporosity of mineral component
Based on the geometry of pores in the core samples, pore spaces can be categorized into intergranular pores, intragranular pores, intercrystalline pores, and cracks. CT imaging is capable of identifying large pores located between particles of various components in the core. However, it cannot resolve micropores due to its resolution limitation (Liu and Ostadhassan, 2017). Therefore, incorporating microporosity associated with different mineral components reflects the objective reality, thereby enabling a more accurate estimation of core porosity.
Nano-resolution 2D MAPS imaging enables identifying pore types and their spatial locations. Small pore clusters within the feldspar, quartz or calcite grains are classified as dissolved pores, while larger pore clusters located between quartz, albite, and feldspar grains are categorized as intercrystalline pores. Clusters of small pores surrounded by clay minerals are identified as clay-dominated micropores. Statistical analysis of various pore types observed in the MAPS image facilitates the calculation of microporosity with each mineral component. The corresponding data are presented in Table 2.
3.4 Associated image segmentation
Coarse-scale digital rocks feature lower resolution, with each voxel potentially representing multiple mineral components. In contrast, fine-scale digital rocks offer more precise information but may lack broader representativeness due to their limited sample size. Consequently, an effective strategy for rock physics research involves integrating digital rocks at both scales and performing upscaling operations to bridge the discrepancies between scales.
Based on the scale relationship between the two resolutions in CT imaging, each voxel in the coarse-scale digital rock corresponds to a 5 × 5 × 5 voxel grid in the fine-scale digital rock. Utilizing this relationship, the proportions of mineral components within each voxel can be extracted. By statistically analyzing all voxels with the same grayscale value in the coarse-scale digital rock, the average content of each mineral component can be determined, enabling the calculation of the mineral component proportions represented by that grayscale value. By using a program to perform traversal statistics, a correlation curve between grayscale values and the mineral component proportions in the coarse-scale digital rock was generated (Figure 4). This curve establishes a direct mapping between image grayscale information and mineral component proportions.
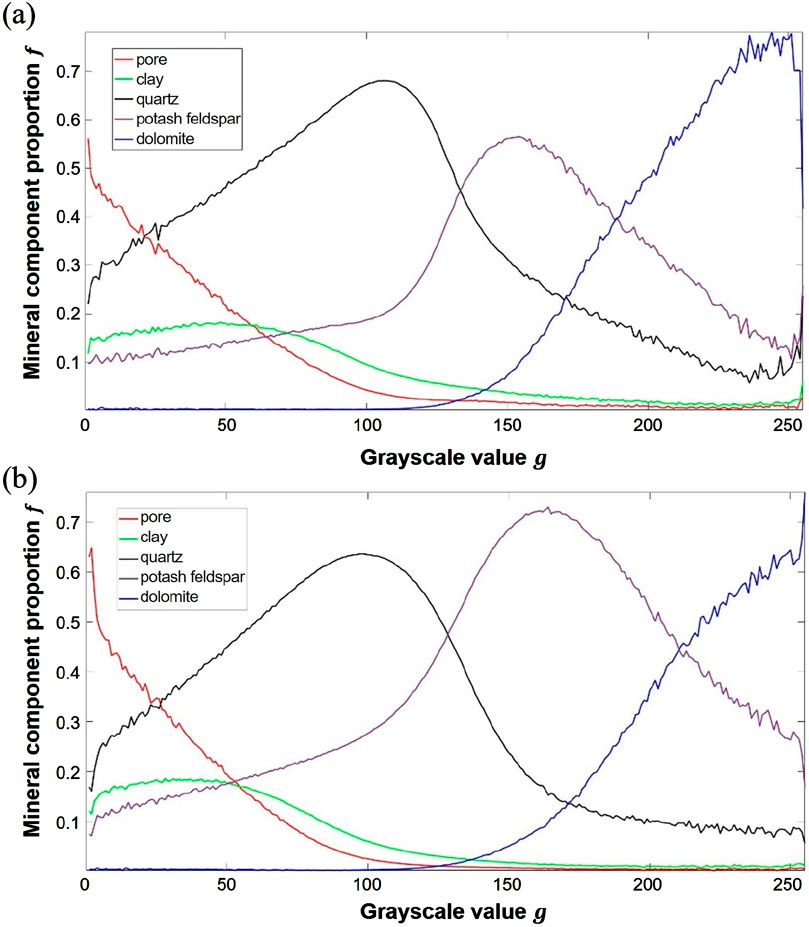
Figure 4. The correlation curves between grayscale value and mineral component proportion in the coarse-scale digital rocks of (A) N1 and (B) N2 based on low resolution CT grayscale images.
The porosity of each voxel in the coarse-scale digital rock is calculated using the formula:
where
3.5 Elastic modulus calculation
The complexity of multi-component tight sandstone digital rocks, coupled with the inclusion of microporosity, makes the conventional single-mineral-component method for calculating the elastic modulus no longer applicable. To address this limitation, we developed an integrated approach that combines the differential effective medium (DEM) model with the finite element method (FEM). Figure 5 illustrates the step-by-step flowchart of the proposed calculation methodology.

Figure 5. Flowchart of elastic modulus calculation method for upscaled digital rock based on the combination of DEM and FEM.
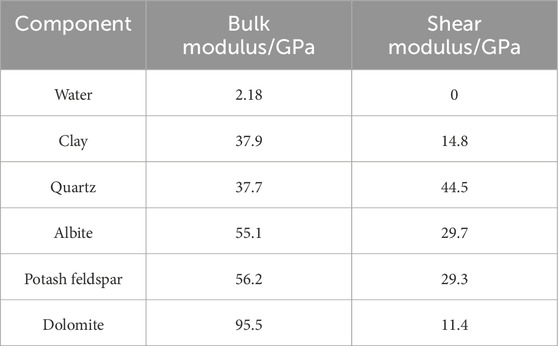
In this study, CT imaging was utilized to segment the core into five distinct components: pores, clay, quartz (albite), potash feldspar, and dolomite. This segmentation is crucial for accurately modeling the rock’s physical properties. The coarse-scale digital rock is represented by an 8-bit grayscale image consisting of 256 distinct grayscale values. The equivalent elastic modulus for each of these grayscale values was obtained using two-step DEM calculation process. In the first DEM step, each mineral component, assumed to be in its pure solid state, was designated as the matrix, with micropores incorporated to compute the component’s equivalent elastic modulus (Berryman, 1980). The elastic moduli for pure mineral component were determined using the data in Table 3. Additionally, since the sound velocity measurements were conducted under water-saturated conditions, the elastic properties of water were considered during the addition of the pores. In the second DEM step, different components were sequentially added based on the correlation curve, enabling the calculation of the equivalent elastic modulus corresponding to each grayscale value, which represents different mineral mixtures. Following the DEM calculations, the FEM was applied to compute the overall elastic moduli of the coarse-scale digital rock. The employed FEM program is developed by Garboczi (1998). This program uses a hexahedral mesh with voxels as elements and has been validated for accuracy in multiple studies (Arns et al., 2005; Arns et al., 2002).
4 Results and discussions
4.1 Image registration
Figure 6 displays the registration images for CT images at varying resolutions, generated using the SIFT registration program. The figure reveals both correctly matched points and instances of mismatched points. These mismatched points can be corrected through manual intervention.
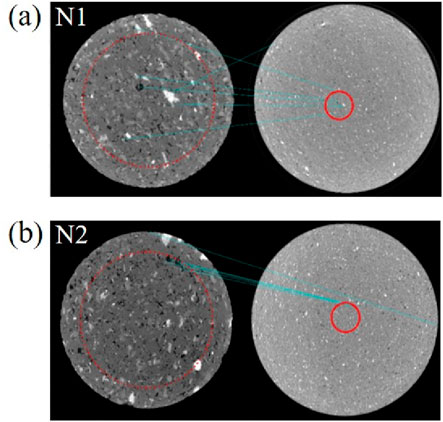
Figure 6. Registration images of and core samples (A) N1 and (B) N2 at different resolutions, with high-resolution images on the left and corresponding low-resolution images on the right. The blue line indicates the matching points.
Once accurate registration information is obtained, the 3D images are adjusted through rotation, and corresponding cube images at different resolutions are extracted. Figures 7A, B present 3D comparison images of the N1 and N2 cores, respectively. The double arrows in these figures indicate corresponding feature points, demonstrating the precise alignment of the images across different resolutions.
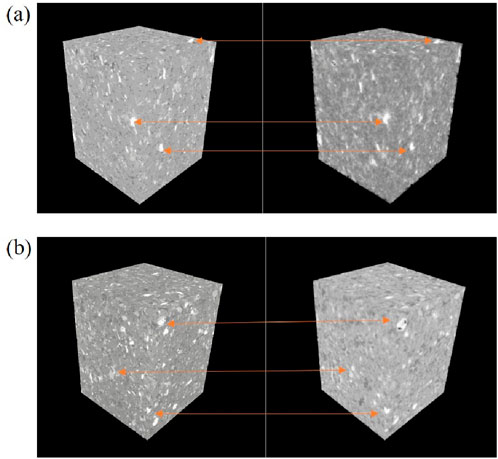
Figure 7. 3D images of and core samples (A) N1 and (B) N2 at different resolutions, with high-resolution images on the left and corresponding low-resolution images on the right. The double arrows indicate corresponding feature points.
4.2 Porosities
Core porosity is a crucial parameter for estimating reservoir oil and gas reserves as well as productivity. It represents one of the most important petrophysical characteristic in oilfield exploration and development. Generally, higher porosity in the reservoir cores correlates with greater oil and gas reserves and easier extraction. Enhancing the precision of core porosity calculations provides valuable guidance for the exploitation and development of oil and gas fields.
Table 4 presents the calculated porosity for the different digital rock models. For the single-scale N1 digital rock, porosities are 1.5% at 13.99 μm/voxel resolution and 5.7% at 2.99 μm/voxel resolution, while for the N2 core, the corresponding values are 0.5% and 2.3%, respectively. In the multi-scale and multi-component models, incorporating microporosity results in porosities of 11.13% for N1 and 12.94% for N2, compared to 3.43% and 5.11% without considering microporosity. These results suggest that porosities derived from single-scale resolutions deviate significantly from experimental measurements, highlighting the limitations of such calculations in fully characterizing the pore structures of core samples.
Significantly, incorporating the microporosity of mineral components produces porosity estimates that closely match experimental gas porosities. The calculated porosity errors for the N1 and N2 rock cores are 5.28% and 6.33%, respectively, compared to experimental porosities. This highlights the substantial contribution of micropores to total porosity in tight sandstone cores. The use of multi-scale digital rocks for porosity calculations demonstrates improved accuracy, thereby enhancing the reliability of the results.
Jin et al. (2018) constructed a digital rock model using CT images with a resolution of 0.7 μm/voxel and introduced component microporosity to calculate core porosity, achieving an error margin within 5.20%. The accuracy of porosity calculations at a single-resolution digital rock depends on image resolution, with higher-resolution images yielding more precise results. In our study, despite using a maximum CT image resolution of 2.99 μm/voxel, which is significantly lower than the 0.7 μm/voxel used by Jin et al., the maximum calculation error is 6.33%, comparable to the reported 5.20%. This result suggests that establishing an upscaled digital rock model effectively reduces the resolution requirements while maintaining high calculation accuracy.
4.3 Elastic moduli
Based on the constructed multi-scale digital rock, the proportions of various mineral components in the low-resolution images can be accurately quantified. Table 5 provides a comparative analysis of the N2 core’s XRD experimental data and the corresponding statistical results derived from the multi-scale digital rock model. Since the differentiation of components in X-ray CT images relies on variations in voxel grayscale values, minerals that exhibit minimal differences in grayscale value may be aggregated into a single phase, even though they represent distinct components.

Table 5. Mineral components and contents of the N2 core sample from XRD measurements and the digital rock method.
Table 5 demonstrates that the mineral component analysis derived from correlation-based segmentation closely aligns with the XRD experimental data, although a notable disparity exists between the measurements for dolomite and siderite. This disparity is primarily attributed to misalignment during the image registration process, which disproportionately affects minerals with low abundance that are primarily distributed as discrete points within the core, rendering them more sensitive to registration inaccuracies.
Table 6 presents the elastic moduli results from the simulations based on the multi-scale digital rocks compared with the experimental measurements. The calculated elastic moduli exhibit good agreement with the experimental data, validating the accuracy of the multi-scale digital rock model. These results confirm that the constructed model effectively captures the distribution characteristics of minerals and pores within the core, providing a reliable modeling method for further digital rock physics research.

Table 6. Results of elastic moduli from the simulation based on the multi-scale digital rock method and the experimental measurements.
In unconventional oil and gas reservoirs, such as tight sandstones and shales, the reservoir rocks often exhibit a high degree of heterogeneity. Traditional digital rock technology, which relies on single-resolution imaging, faces challenges in balancing field of view and image resolution. In recent years, multi-scale digital rock technology, which employs various resolutions and imaging techniques, has made significant progress. Walls et al. (2017) compared multi-scale digital rocks using SEM imaging at different resolutions, demonstrating that multi-resolution imaging significantly improves pore identification accuracy. Islam et al. (2019) conducted multi-scale imaging and numerical simulations on the permeability of heterogeneous carbonate rocks, establishing porosity-permeability curves and analyzing resolution impacts on porosity calculations. Liu et al. (2017) explored the pore characteristics of rock samples through fractal theory, revealing that pore complexity and fractal dimensions increase with magnification.
In the multi-scale digital rock techniques, upscaling methods have been developed to correlate data across scales effectively, enabling comprehensive analysis of core properties. These methods include the overlay method, representative elementary volume (REV), and integration of multiple computational approaches. The overlay method allows for the refinement of images and is commonly used in the upscaling construction of pore models. Yao et al. (2015) constructed multi-scale pore network models using different resolution SEM images and the Markov Chain-Monte Carlo method. The REV method involves partitioning the core to ensure that each section has similar properties, thus achieving upscaling from high to low resolution. Sun et al. (2019) proposed an upscaling porosity method using REV selection across CT-scanned samples. Suhrer et al. (2020) obtained multiple REVs based on image complexity to achieve upscaling modeling. The integration of multiple computational methods utilizes the differences in scale between different computational methods. Ning et al. (2016) combined molecular dynamics (MD) and lattice Boltzmann methods to achieve nanoscale-to-microscale fluid transport simulations.
In this study, a two-step upscaling process was used to calculate the equivalent elastic moduli for the FEM simulations. Nano-resolution SEM data provided micro-porosity insights, integrated into mineral components. The precise registrations of high- and low-resolution CT images provide the relationship between mineral component proportions and grayscale value in the coarse-scale digital rocks, thereby obtaining the equivalent elastic moduli of each voxel. This approach maintains computational accuracy while significantly improving efficiency. It is noteworthy that due to the high sensitivity of the elastic modulus to porosity and mineral components, this upscaling method is particularly suitable for elastic modulus calculations. However, for flow characteristics and electrical properties, which depend on pore connectivity, fine-scale structural information loss during upscaling may impact the result accuracy, warranting further investigation.
5 Conclusion
This study introduces a method for constructing multi-scale digital rocks by integrating 3D micro-CT images at two different resolutions and 2D SEM-MAPS images. SIFT image registration was applied to align high- and low-resolution CT images, establishing a correlation curve between grayscale values in low-resolution images and mineral component proportions. To capture the microporosity of mineral components not identified by micro-CT, nanoscale SEM-MAPS scanning was employed. Using the correlation curve, microporosity of mineral components and low-resolution CT images, the multi-scale digital rocks were constructed. This multi-scale modeling method successfully produced digital rock models that accurately represent the porosity and minerals’ content of tight sandstones. An upscaling method by calculating the equivalent elastic moduli of voxels of different greyscale value based on DEM theory was utilized and the FEM simulation was deployed to calculate the elastic moduli of the cores. The porosities and simulated elastic moduli of the multi-scale digital rocks exhibited good agreement the experimental data. These results confirm that the constructed model effectively captures the distribution characteristics of minerals and pores within the core, which helps to improve the efficiency and accuracy of subsequent rock physics simulation researches.
Data availability statement
The original contributions presented in the study are included in the article/supplementary material, further inquiries can be directed to the corresponding author.
Author contributions
HW: Conceptualization, Data curation, Formal Analysis, Investigation, Methodology, Resources, Supervision, Validation, Visualization, Writing–original draft, Writing–review and editing. XY: Conceptualization, Data curation, Methodology, Writing–review and editing. CZ: Supervision, Validation, Visualization, Writing–review and editing. JXY: Data curation, Methodology, Investigation, Writing–review and editing. JQY: Supervision, Validation, Visualization, Writing–review and editing. KX: Supervision, Visualization, Writing–review and editing.
Funding
The author(s) declare that no financial support was received for the research, authorship, and/or publication of this article.
Conflict of interest
Authors HW, XY, CZ, JnY, JaY, and KX were employed by PetroChina Daqing Oilfield Co., Ltd.
Generative AI statement
The author(s) declare that no Generative AI was used in the creation of this manuscript.
Publisher’s note
All claims expressed in this article are solely those of the authors and do not necessarily represent those of their affiliated organizations, or those of the publisher, the editors and the reviewers. Any product that may be evaluated in this article, or claim that may be made by its manufacturer, is not guaranteed or endorsed by the publisher.
References
Abell, A. B., Willis, K. L., and Lange, D. A. (1999). Mercury intrusion porosimetry and image analysis of cement-based materials. J. Colloid Interface Sci. 211, 39–44. doi:10.1006/jcis.1998.5986
Alizadeh, M., Movahed, Z., and Junin, R. B. (2015). Porosity analysis using image logs. Environ. Sci. 10, 326–337. doi:10.1016/S1876-3804(13)60042-7
Arns, C., Bauget, F., Sakellariou, A., Senden, T. J., Sheppard, A. P., Sok, R. M., et al. (2005). Digital core laboratory: petrophysical analysis from 3D imaging of reservoir core fragments. Petrophysics-The SPWLA J. Form. Eval. Reserv. Descr. 46, 260–277.
Arns, C. H., Knackstedt, M. A., Pinczewski, W. V., and Garboczi, E. J. (2002). Computation of linear elastic properties from microtomographic images: methodology and agreement between theory and experiment. Geophysics 67 (5), 1396–1405. doi:10.1190/1.1512785
Berryman, J. G. (1980). Long-wavelength propagation in composite elastic media II: ellipsoidal inclusions. J. Acoust. Soc. Am. 86, 1820–1831. doi:10.1121/1.385172
Bin, B., Rukai, Z., Songtao, W., Wenjing, Y., Gelb, J., Gu, A., et al. (2013). Multi-scale method of Nano (Micro)-CT study on microscopic pore structure of tight sandstone of Yanchang Formation, Ordos Basin. Petroleum Explor. Dev. 40, 354–358. doi:10.1016/S1876-3804(13)60042-7
Clarkson, C. R., and Marc Bustin, R. (1996). Variation in micropore capacity and size distribution with composition in bituminous coal of the Western Canadian Sedimentary Basin: implications for coalbed methane potential. Fuel 75, 1483–1498. doi:10.1016/0016-2361(96)00142-1
Close, D., Cho, D., Horn, F., and Edmundson, H. (2009). The sound of sonic: a historical perspective and introduction to acoustic logging. CSEG Rec. 34, 34–43.
Dunsmuir, J. H., Ferguson, S. R., D’Amico, K. L., and Stokes, J. P. (1991). X-ray microtomography: a new tool for the characterization of porous media. SPE Annu. Tech. Conf. Exhib. SPE-22860. doi:10.2118/22860-MS
Garboczi, E. J. (1998). Finite element and finite difference programs for computing the linear electric and elastic properties of digital images of random materials. Gaithersburg: National Institute of Standards and Technology.
Guo, W., Dong, C., Lin, C., Wu, Y., Zhang, X., and Liu, J. (2022). Rock physical modeling of tight sandstones based on digital rocks and reservoir porosity prediction from seismic data. Front. Earth Sci. 10, 932929. doi:10.3389/feart.2022.932929
Hazlett, R. (1997). Statistical characterization and stochastic modeling of pore networks in relation to fluid flow. Math. Geol. 29, 801–822. doi:10.1007/BF02768903
Islam, A., Faisal, T. F., Chevalier, S., Jouini, M. S., and Sassi, M. (2019). Multi-scale experimental and numerical simulation workflow of absolute permeability in heterogeneous carbonates. J. Petroleum Sci. Eng. 173, 326–338. doi:10.1016/j.petrol.2018.10.031
Jin, Z., Wang, F., Guo, C., He, Z. L., and Wang, X. L. (2018). A calculation method for the effective electrical properties of rocks based on digital core technology. Geophys. Geochem. Explor. 42, 1280–1288. doi:10.11720/wtyht.2018.0175
Lemmens, H., and Richards, D. (2013). 4 Multiscale imaging of shale samples in the scanning electron Microscope. Am. Assoc. Petroleum Geol. Mem. 102, 27–35. Electron Microscopy of Shale Hydrocarbon Reservoirs. doi:10.1306/13391702M1023582
Li, D., Wei, J., Di, B., Ding, P., and Shuai, D. (2017). The effect of fluid saturation on the dynamic shear modulus of tight sandstones. J. Geophys. Eng. 14, 1072–1086. doi:10.1088/1742-2140/aa7179
Liu, K., and Ostadhassan, M. (2017). Multi-scale fractal analysis of pores in shale rocks. J. Appl. Geophys. 140, 1–10. doi:10.1016/j.jappgeo.2017.02.028
Liu, L., Yao, J., Imani, G., Sun, H., Zhang, L., Yang, Y., et al. (2023). Reconstruction of 3D multi-mineral shale digital rock from a 2D image based on multi-point statistics. Front. Earth Sci. 10, 1104401. doi:10.3389/feart.2022.1104401
Liu, X., Wang, J., Ge, L., Hu, F., Li, C., Li, X., et al. (2017). Pore-scale characterization of tight sandstone in Yanchang Formation Ordos Basin China using micro-CT and SEM imaging from nm-to cm-scale. Fuel 209, 254–264. doi:10.1016/j.fuel.2017.07.068
Liu, X., Zhu, H., and Liang, X. (2014). Digital rock physics of sandstone based on micro-CT technology. Chin. J. Geophys. 57, 1133–1140. doi:10.6038/cjg20140411
Lowe, D. G. (1999). “Object recognition from local scale-invariant features,” in Proceedings of the Seventh IEEE International Conference on Computer Vision, Kerkyra, Greece, 20-27 September 1999, 1150–1157 vol.2. doi:10.1109/ICCV.1999.790410
Lowe, D. G. (2004). Distinctive image features from scale-invariant keypoints. Int. J. Comput. Vis. 60, 91–110. doi:10.1023/B:VISI.0000029664.99615.94
Newberry, B., Grace, L., and Stief, D. (1996). Analysis of carbonate dual porosity systems from borehole electrical images. Permian Basin oil and gas recovery Conf., 123–129. doi:10.2118/35158-MS
Ning, Y., He, S., Liu, H., Wang, H., and Qin, G. (2016). “Upscaling in numerical simulation of shale transport properties by coupling molecular dynamics simulation with lattice Boltzmann method,” in SPE/AAPG/SEG unconventional resources technology conference (San Antonio, TX: URTec). URTEC-2459219. doi:10.15530/URTEC-2016-2459219
Quiblier, J. (1984). A new three-dimensional modeling technique for studying porous media. J. Colloid Interface Sci. 98, 84–102. doi:10.1016/0021-9797(84)90481-8
Suhrer, M., Nie, X., Toelke, J., and Ma, S. (2020). “Upscaling method for obtaining primary drainage capillary pressure and resistivity index with digital rock physics,” in International petroleum technology conference (Dhahran, Saudi Arabia: IPTC). doi:10.2523/IPTC-20035-ABSTRACT
Sun, H., Belhaj, H., Tao, G., Vega, S., and Liu, L. (2019). Rock properties evaluation for carbonate reservoir characterization with multi-scale digital rock images. J. Petroleum Sci. Eng. 175, 654–664. doi:10.1016/j.petrol.2018.12.075
Tixier, M., Alger, R., and Doh, C. (1959). Sonic logging. Trans. AIME 216, 106–114. doi:10.2118/1115-G
Tong, X., Zhang, G., Wang, Z., Wen, Z., Tian, Z., Wang, H., et al. (2018). Distribution and potential of global oil and gas resources. Petroleum Explor. Dev. 45, 779–789. doi:10.1016/S1876-3804(18)30081-8
Walls, J., Davalos, G., and Weinreich, M. (2017). “Integration and comparison of multi-scale digital rock analysis with bulk rock porosity and LECO TOC within multiple Appalachian basin formations,” in SPE/AAPG/SEG unconventional resources technology conference (Austin, TX: URTEC). (pp. URTEC-2697890). doi:10.15530/urtec-2017-2697890
Wang, H., Ma, F., Tong, X., Liu, Z., Zhang, X., Wu, Z., et al. (2016). Assessment of global unconventional oil and gas resources. Petroleum Explor. Dev. 43, 925–940. doi:10.1016/S1876-3804(16)30111-2
Wang, Y., Agostini, F., Skoczylas, F., Jeannin, L., and Portier, É. (2017). Experimental study of the gas permeability and bulk modulus of tight sandstone and changes in its pore structure. Int. J. Rock Mech. Min. Sci. 91, 203–209. doi:10.1016/j.ijrmms.2016.11.022
Wu, K., Nunan, N., Crawford, J. W., Young, I. M., and Ritz, K. (2004). An efficient Markov chain model for the simulation of heterogeneous soil structure. Soil Sci. Soc. Am. J. 68, 346–351. doi:10.2136/sssaj2004.3460
Yamada, T., Quesada, D., Etchecopar, A., Le Nir, I., Delhomme, J.-P., Russel-Houston, J., et al. (2013). Revisiting porosity analysis from electrical borehole images: integration of advanced texture and porosity analysis. SPWLA Annu. Logging Symp.
Yao, J., Hu, R., Wang, C., and Yang, Y. (2015). Multiscale pore structure analysis in carbonate rocks. Int. J. Multiscale Comput. Eng. 13 (1), 1–9. doi:10.1615/IntJMultCompEng.2014010500
Yin, H., Zhao, J., Tang, G., Zhao, L., Ma, X., and Wang, S. (2017). Pressure and fluid effect on frequency-dependent elastic moduli in fully saturated tight sandstone. J. Geophys. Res. Solid Earth 122, 8925–8942. doi:10.1002/2017JB014244
Yin, X., Zheng, Y., Zong, Z., and Lin, L. (2019). Estimation of reservoir properties with inverse digital rock physics modeling approach. Chin. J. Geophys. 62 (2), 720–729. doi:10.6038/cjg2019L0385
Zhang, L., Lu, S., Xiao, D., and Li, B. (2017). Pore structure characteristics of tight sandstones in the northern Songliao Basin, China. Mar. Petroleum Geol. 88, 170–180. doi:10.1016/j.marpetgeo.2017.08.005
Keywords: digital rock, image registration, multi-scale, correlation segmentation, porosity, elastic modulus
Citation: Wang H, Yang X, Zhou C, Yan J, Yu J and Xie K (2025) Constructions of multi-scale 3D digital rocks by associated image segmentation method. Front. Earth Sci. 12:1518561. doi: 10.3389/feart.2024.1518561
Received: 28 October 2024; Accepted: 18 December 2024;
Published: 08 January 2025.
Edited by:
Huaimin Dong, Chang’an University, ChinaReviewed by:
Weichao Yan, Ocean University of China, ChinaHaitao Wang, Chongqing University of Science and Technology, China
Copyright © 2025 Wang, Yang, Zhou, Yan, Yu and Xie. This is an open-access article distributed under the terms of the Creative Commons Attribution License (CC BY). The use, distribution or reproduction in other forums is permitted, provided the original author(s) and the copyright owner(s) are credited and that the original publication in this journal is cited, in accordance with accepted academic practice. No use, distribution or reproduction is permitted which does not comply with these terms.
*Correspondence: Haiyan Wang, aGFpeWFud2FuZzc3MzJAMTYzLmNvbQ==
 Haiyan Wang
 Xuefeng Yang
