 Shuran Meng
 Dunyu Lv1,2*
- 1Institute of Hydrogeology and Environmental Geology, Chinese Academy of Geological Sciences, Shijiazhuang, China
- 2Key Laboratory of Quaternary Chronology and Hydrological-Environment Evolution, China Geological Survey, Shijiazhuang, China
- 3Geological and Environmental Exploration Institute, Shaanxi Geological and Mineral Sixth Geological Team Co. Ltd., Xi’an, China
- 4School of Engineering, China University of Geosciences (Wuhan), Wuhan, China
In recent years, geological disasters on loess fill slopes have occurred from time to time, which has attracted widespread attention. In order to deeply understand its deformation and failure laws and promote the disaster prevention and mitigation work, this paper takes remolded loess as the research object, systematically explores the effects of three different stress paths (conventional triaxial compression test (CTC), triaxial compression test with constant average principal stress (TC), and triaxial compression test with reduced confining pressure (RTC)) on its mechanical properties, and observes and analyzes its microstructural characteristics by scanning electron microscopy (SEM). The results show that the soil is strain hardening under the CTC path, while it is strain weak hardening under the TC and RTC paths. In the order of CTC, TC, and RTC paths, the shear strength and volume shrinkage of the soil are reduced in turn, and its deformation has both shear reduction and shear expansion plastic deformation. In the order of CTC, TC, and RTC paths, the degree of particle crushing decreases in turn and the pore content increases in turn. It is inferred that in the initial deformation of loess under loading, the soil is compressed and compacted, and its strength is improved to a certain extent. As the loading continues to increase, the deformation rate increases steadily, and the soil deformation develops gradually, which is mainly axial compression deformation, while the lateral bulging deformation is small until it is destroyed. For the deformation behavior in the form of lateral unloading, the soil is maintained in a relatively stable state at the beginning, and the deformation is very small. When the lateral constraint is reduced to a critical state, the structure is completely unstable, and the deformation develops rapidly in a short time until it is destroyed. This study is of great significance for reducing the occurrence of geological disasters on fill slopes in loess areas.
1 Introduction
Loess is a soil that has been slowly deposited over a long period of about 2.6 million years since the Quaternary Period. It covers about 10% of the world’s land area, and its geographical distribution is very regular, mainly in northwest China, most of Europe, central and western Australia, central United States, and Argentina (as shown in Figure 1) (Xu et al., 2007). Loess is rich in minerals such as calcium and iron, and is easy to store water and cultivate, so its distribution area is known as the world’s “wheat belt” (Leng, 2014; Song et al., 2017; Li et al., 2024).

Figure 1. Distribution map of loess around the world (according to Wikipedia).
The main components of loess are structural units composed of mineral monomers and their aggregates and condensates, cement formed by chemical reactions between clay particles and soluble salt solutions and organic matter, and pores between particles (Cheng et al., 2021). Its main characteristics that distinguish it from other soils are: the skeleton particle morphology is mainly aggregates and agglomerates; the particle size is generally less than 0.25 mm, and the content of powder particles (particle size of 5–50 μm) is more than 60 wt%; the structure is loose and porous, with a porosity of up to 30 vol%, with large pores on the microscopic level and water channels on the macroscopic level; it has obvious collapsibility, and its structure is quickly destroyed after being infiltrated by water, resulting in significant sinking deformation (Qiu et al., 2024). Therefore, loess is called “the most erodible soil on earth” and is prone to geological disasters such as ground fissures, landslides, and ground subsidence (Peng et al., 2014; Chen et al., 2024). Among them, the loess accumulation thickness in the Loess Plateau of China is large, and the rainfall is small and concentrated in time, so its geological environment is particularly fragile and geological disasters occur frequently (Zhu et al., 2017; Zhang et al., 2024). Besides, the disturbance of the water-bearing conditions of the geological body by human activities (such as irrigation) or the change of the stress state (such as filling, excavation, vibration, etc.) are also the main causes of loess disasters (Tang et al., 2024; Qin et al., 2024). In particular, the large number of fill slopes generated by human activities are most likely to cause geological disasters.
At present, the research on the instability process and mechanism of loess landfill is mainly macroscopic qualitative analysis (Shi and Jiang, 2000; Wang et al., 2003; Liu, 2007; Liu and Huang, 2007; Wang et al., 2008). The study of stress distribution and deformation behavior of soil by conventional triaxial test have showed that its landslide mechanism is mainly that the subsequent construction engineering loading and/or natural phenomena such as rainfall and snowfall break the mechanical balance of the original slope (Sun et al., 2009; Gao et al., 2013; Wu, 2015; Yu et al., 2023; Yao et al., 2024). In order to further explore the disaster mechanism of loess landfill, it is necessary not only to examine its current stress state, but also to consider its loading history and stress path, so as to better understand its volume strain, radial deformation, and microstructural changes (Peng et al., 2016; Weng et al., 2024; Wang et al., 2024). For example, Li et al. proposed an image-based two-phase data-driven framework for detecting and segmenting landslide regions using satellite images and found that the framework produced more accurate segmentation of loess landslides compared with the other tested benchmarking algorithms (Li et al., 2022). In their further work, they proposed a loess landslide segmentation and measurement framework based on deep learning and found that the proposed framework outperformed all the other algorithms tested in terms of segmentation accuracy and boundary errors (Li et al., 2023).
The stress path is the trajectory of the maximum shear stress in space when the sample changes from one stress state to another. For example, based on the uniqueness of the effective stress intensity index, Pan et al. used the test results of triaxial compression and elongation tests to derive the expression of the undrained total stress intensity index of saturated normally consolidated clay under different stress paths, and used it to guide the engineering practice (Pan et al., 1997). In addition, during the excavation of foundation pits, the bottom uplift and side bulging of the soil under unloading conditions are different from those of simple vertical loading. Therefore, conventional parameters cannot be simply used to calculate the deformation degree of the soil, but it is necessary to consider the experimental method of stress path (Song et al., 2022). When studying the deep foundation pit excavation projects, He et al. used hyperbolic forms to simulate its nonlinear elastic behavior and found that its elastic modulus was different from that of conventional triaxial tests (Zhou, 2003). When analyzing the soil of foundation pit excavation projects, Zhang et al. used the equal pressure consolidation axial loading tests and the consolidation lateral unloading tests, respectively, and found that the latter was closer to the measured data, proving that it was affected by the stress path (Zhang et al., 2004). When solving the soil pressure problem, the influence of strength index parameters and stress path should be taken into account: the passive soil pressure could be understood as that the vertical stress remained unchanged while the horizontal stress increased to the limit state; and the active soil pressure was that the vertical stress remained unchanged while the horizontal stress decreased to the limit state. Shi et al. designed a stress path test using a triaxial apparatus to restore the active and passive destruction process of the soil, and combined with the stress-strain relationship of the test results, derived the formula for the change of soil pressure with strain, and found that the active soil pressure calculated by it was closer to the actual test process than the passive soil pressure (Shi et al., 2005).
This study intends to carry out triaxial test research on different stress paths based on the actual stress state changes and the distribution characteristics of remolded loess samples (Fu et al., 2024; Liu et al., 2024). By analyzing the strength characteristics, axial deformation, volume change, etc. of the soil under different stress paths, and combining the changes in microstructure, the disaster process and mechanism of loess landfill under different stress environments will be explored.
2 Experimental part
2.1 Sample collection and measurement of its basic properties
The experimental loess sample was taken from the section L2 of the Dongfeng landslide in the southern plateau of Jingyang, Shaanxi Province, China, which is a typical loess area in China. Its natural moisture content was about 16 wt%, and its natural and dry densities were about 1.70 and 1.45 g cm−3, respectively (Duan et al., 2016). The particle size distribution obtained by using the Bettersize2000 laser particle size distribution analyzer is shown in Figure 2 and Table 1. It can be seen that the maximum particle size is about 161.1 μm and the minimum particle size is about 0.58 μm. Among them, the particle size less than 75 μm accounts for about 97.59 wt%. According to the Chinese standard “Engineering Classification Standard for Soil, GB/T 50145-2007″, this sample belongs to fine-grained soil. It can be seen from the particle size gradation curve in Figure 2 that the particle sizes corresponding to the accumulated percentage contents of 10%, 30%, and 60% are 2.9 μm, 11.2 μm, and 25.8 μm, respectively. From Table 1, it can be seen that the contents of clay particles and powder particles are relatively high.
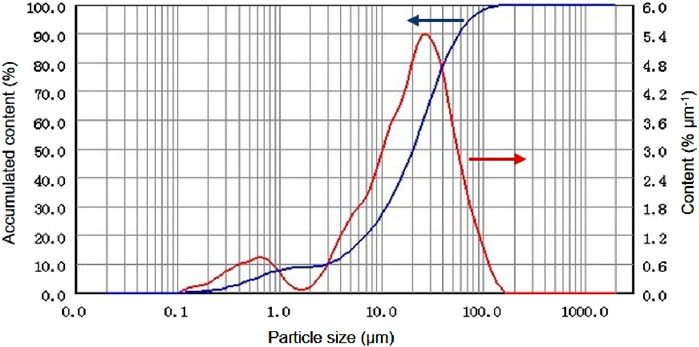
Figure 2. Particle size distribution curve of natural loess sample.

Table 1. Classification and weight proportion of loess sample according to particle size.
2.2 Sample preparation
The test sample was remolded loess with the controlled moisture content as the same as the original natural sample. First, the collected loess was dried and crushed, and then passed through a 2 mm sieve. The sieved fine particles of dry soil were mixed with distilled water according to the moisture content. Then the layered static pressure method was used to prepare the samples and control the dry densities of the samples. The inner diameter of the mold sleeve used was 70 mm and the height was 150 mm. At the same time, a baffle with the same inner diameter but a height of 50 mm and a piston with an outer diameter of 70 mm and a height of 200 mm were configured to control the height of each layer of the compacted soil samples. A reaction frame and jack were used to statically press the soil samples in three layers. The height of the first two layers was 50 mm, and they were statically pressed for 30 min, respectively. After compaction, the burrs on the soil surface were scraped off. The height of the last layer was 40 mm, and the static pressure time was 60 min. After the final compaction was completed, the sample was pushed out with a jack. Finally, it was trimmed into a sample with a diameter of 50 mm and a height of 100 mm, and stored in a moisturizing dish for later use.
2.3 Instruments and working principles
The stress path tests were to achieve shear failure of the same soil by different loading methods, and explore the differences in its deformation and strength characteristics by examining the stress-strain change processes. Considering that the loading and excavation of the loess fill slope can be understood as the loading and unloading process of the soil, it is necessary to design different stress paths to simulate the effects of human engineering activities on soil deformation and destruction.
In this study, we used the stress path triaxial apparatus produced by Wykeam Farrance Company, United States. Its fully automatic stress path triaxial (AUTOTRAIX) test system included a real-time control (RTC) system, an ATD test data acquisition system, a pressure controller, an automatic volume change tester, a double-layer triaxial pressure chamber, a TRITECH triaxial loading frame, and a computer and test software (as shown in Figure 3). Its working principle is that the RTC system controls the triaxial test equipment, the confining pressure and back pressure controllers, the axial pressure loading device, etc. through the test base plate. The RTC system could provide tests for multiple modules such as unsaturated soil and stress path. The ATD data acquisition system realized the sensor calibration, test parameter setting and adjustment, test commands, and real-time data reading and recording by connecting displacement sensors and pressure sensors. The inner and outer chambers of the double-layer triaxial pressure chamber were connected to the confining pressure controller with airless water as the pressure transmission medium, ensuring that the pressures of the inner and outer pressure chambers were consistent during the working process, thereby ensuring the accuracy of the sample volume measurement. There were two pressure controllers, which controlled the confining pressure and back pressure, respectively. They included a water pressure source and a volume change instrument. The maximum output pressure could reach 3,500 kPa, and could apply linear increasing or cyclic pressure. The axial pressure loading device could lift or lower the base of the pressure chamber, thereby realizing the stress-controlled and strain-controlled axial compression or decompression shearing of the soil sample. The automatic volume change tester was connected to the data acquisition system and could provide an electronic signal proportional to the amount of water flowing through the instrument. It included a pressure chamber and a piston sealed in the chamber. Among them, the piston was connected to a 25 mm displacement sensor, and its displacement was proportional to the volume of water in the calibration chamber. The maximum capacity of the pressure chamber was 100 mL, which was connected to the pressure controller and the confining pressure chamber (or sample). The top cap of the sample and the pressure rod were vacuumed to eliminate the influence of the confining pressure in the vertical direction, thereby realizing the axial unloading or stretching process of the sample. The pressure rod was connected to a pressure sensor and placed inside the pressure chamber.
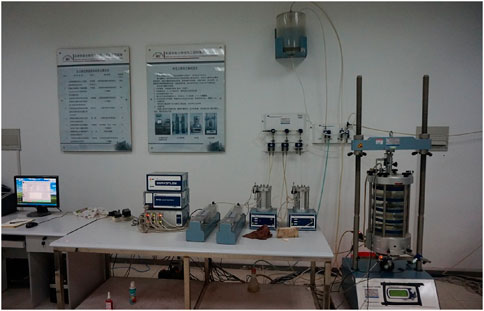
Figure 3. Wykeam Farrance stress path triaxial instrument used in this work.
2.4 Test scheme
First, the remolded loess samples were subjected to isotropic consolidation. When the pore water pressure dissipated and the volume variable tended to be stable (generally the consolidation time was about 24 h), the consolidation was considered to be complete. A consolidation and drainage triaxial shear test with stress-controlled loading was performed, with a loading rate of 10 kPa h−1 and an unloading rate of 50 kPa h−1. Because the sample was generally destroyed when the axial strain reached about 15%, the end condition of this test was preset to be 20% axial strain. As shown in Figure 4, there are three compression tests with different stress paths: (1) conventional triaxial compression test (CTC), including monotonic loading test and cyclic loading test, with initial consolidation pressure of 100 kPa, 200 kPa, and 300 kPa, respectively, for a total of 6 groups of tests; (2) triaxial compression test (TC) with average principal stress p as a constant, including monotonic loading test and cyclic loading test, with initial consolidation pressure of 100 kPa, 200 kPa, and 300 kPa, respectively, for a total of 6 groups of tests; (3) triaxial compression with reduced pressure test (RTC), with the initial consolidation pressure of 200 kPa, 300 kPa, and 400 kPa, respectively, due to the large test error of volume strain at a lower confining pressure level, for a total of 3 groups of tests. Among them, the cyclic loading test was carried out with the shear stress q value as the reference standard, and unloading was carried out when it reached 50 kPa, 100 kPa, and 150 kPa, respectively. It should be noted that in the actual test, in the TC monotonic loading test with a consolidation pressure of 100 kPa, when q reached 110 kPa, the sample was close to failure, so the q value of the corresponding cyclic loading test unloading point was reduced to 30 kPa, 60 kPa, and 90 kPa, respectively. In the CTC monotonic loading test under a confining pressure of 100 kPa, when q reached 170 kPa, the sample was close to failure, so the q value of the corresponding cyclic loading test unloading point was reduced to 40 kPa, 80 kPa, and 120 kPa, respectively. Table 2 lists the details of the compression test schemes for three different stress paths.
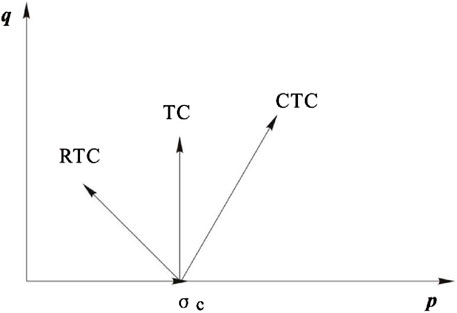
Figure 4. The q-p schematic diagram of compression tests for three different stress paths.
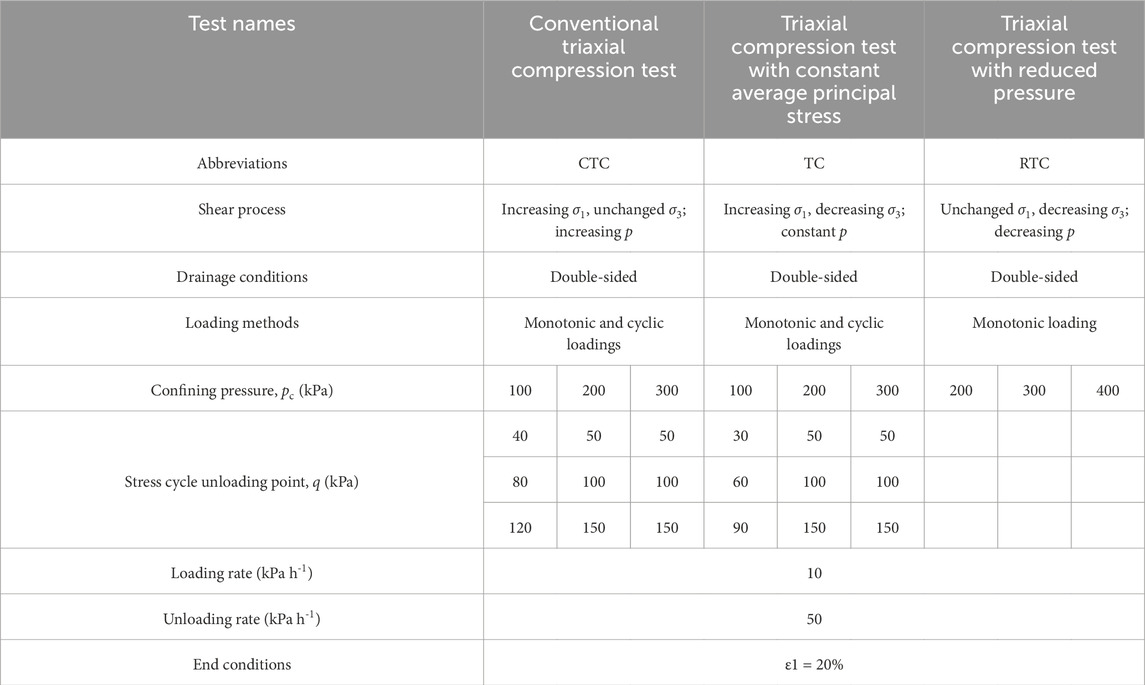
Table 2. Summary of details of compression test schemes for three different stress paths.
2.5 Experimental data processing
According to the effective stress principle of saturated soil, the total stress on any plane in the saturated soil can be divided into two parts: effective stress and pore water pressure. The change of effective stress controls the deformation strength of the soil. The relationship is:
where, σ′ is the effective stress, σ is the total stress in the soil, and u is the pore water pressure. For unsaturated soil, the pores are filled with water and air. When considering effective stress, it is necessary to introduce the concept of matrix suction, which is the difference between pore water pressure and pore air pressure.
In this study, when conducting consolidation drainage (exhaust) shear tests on the unsaturated remolded loess, a slower shear rate of 10 kPa h−1 was used. No significant increase in pore water pressure was found during the test. Therefore, the total stress was used instead of the effective stress to analyze the stress-strain and strength characteristics in the data processing. The average principal stress p and deviatoric stress q were used to describe the stress state of remolded loess with the expressions as follows:
When ε1, ε3, εv, and εs represent the axial strain, the radial strain, the volumetric strain, and the shear strain, respectively, then,
where, Δh is the height change of the sample during the shear process, hc is its height after consolidation, ΔV is its volume change during the shear process in the confining pressure chamber, and Vc is its volume after consolidation.
Under triaxial stress conditions, σ2 = σ3, ε2 = ε3, so the εv can be expressed as:
and the εs is:
During the test, the total volume of the internal pressure chamber remained unchanged, and the volume shrinkage or volume expansion of the sample was compensated by connecting the confining pressure controller to the pressure chamber, and this compensation amount could be measured by the confining pressure volume transformer. Based on this, the drainage (water inflow) amount of the confining pressure chamber during the test was the volume expansion (volume shrinkage) amount of the sample.
In addition, two parts of correction need to be made for the ΔV:
(1) Considering the volume correction of the loading rod. During the test, the bottom of the loading frame lifts the pressure chamber as a whole by Δhi, the top of the loading rod maintains a fixed height, and the lower end extends into the pressure chamber by Δhi. The loading rod diameter, φ, is 25 mm, so the lift of Δhi will cause the drainage volume of the confining pressure chamber to be Vhi (cc), which can be calculated according to Vhi = -πφ2Δhi/4 = −0.491Δhi. In this way, the volume change correction value affected by the loading rod is considered as ΔV1 = -Vhi.
(2) Considering the volume correction of variable confining pressure. In the TC and RTC stress path tests with changing confining pressure, the pressure controller controls the increase (decrease) of the confining pressure by charging (discharging) airless water. For every increase in confining pressure, Δσc (kPa), the corresponding amount of water ΔVσc needs to be compensated to the confining pressure chamber through the pressure controller. In the range of 50–400 kPa, the relationship between the two can be simplified as ΔVσc = 0.03Δσc. In this way, the volume correction value of variable confining pressure is considered as ΔV2 = -Vσc. Among them, Δσc = 0, in the CTC test.
The volume change can be expressed as follows based on the above two correction results:
where, ΔV represents the actual volume change of the sample, and ΔVc represents the measured volume change of the confining pressure transformer.
2.6 Observation of microstructure
EDAX scanning electron microscope (SEM) was used to observe the microstructure of samples after different stress path tests. First, the remolded loess samples before the test and the loess samples sheared by CTC, TC, and RTC paths under 300 kPa consolidation confining pressure were selected and cut into rectangular blocks of 10 × 10 × 20 mm3 size. Then, they were pre-frozen for 24 h and placed in a vacuum freeze dryer for vacuum drying. After that, the samples were broken open to expose the fresh cross section as the observation surface, and they were glued to the copper observation table for the test with conductive glue. Before observation, they were sprayed with gold to coat the surface with a conductive metal film, as shown in Figure 5. When the samples were placed in the SEM observation room for observation, singular points were avoided and representative parts were selected for observation. The acquired pictures were analyzed and processed using LEICA QWin software to obtain the morphology and size characteristics of the particles and pores on the soil surface and their proportions.
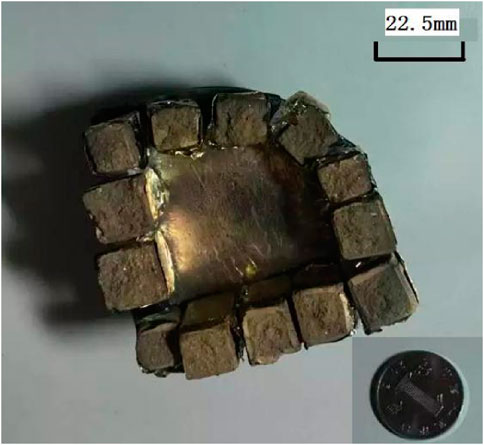
Figure 5. Remolded soil samples with gold plating on the surface before SEM observation.
3 Results and discussion
Compared with the original loess, the structure of remolded loess is more uniform and the particle size difference is smaller, but the bonding between particles is destroyed, so the structural strength is lost (Shi et al., 2005). This study mainly examined the strength and deformation properties of remolded loess, and the strength was mainly the shear strength, that was, the ultimate ability to resist shear failure. The shear strength of loess was divided into two parts: cohesion and friction. The former depended on the Coulomb force, cementation force, and van der Waals force generated by the physical and chemical effects between particles, while the latter depended on the friction generated by the relative movement between particles. One point that loess is different from ideal materials is that shear force does not produce volume changes for the former, but produces volume changes for the latter.
3.1 Stress-strain characteristics
Figure 6 shows the test curves of different stress paths (CTC, TC, and RTC) of consolidation drainage of remolded loess samples under different initial confining pressures (100 kPa, 200 kPa, 300 kPa, and 400 kPa, respectively), including the relationship between q and ε1 under cyclic loading conditions, the relationship between q and ε1 under monotonic loading conditions, and the relationship between q and p under monotonic loading conditions. It can be seen that the stress-strain relationship curves of the remolded loess samples under the three stress paths have similar trends: the q increases with the increase of ε1, but the rate of increase gradually decreases and eventually tends to 0, that is, q tends to be stable and no peak point appears. The samples under the RTC and TC paths show weak strain hardening, while the samples under the CTC path show strain hardening. For the same stress path, as the initial consolidation confining pressure increases, the deformation modulus of the sample increases, and when the same q value is reached, the ε1 of the sample under low confining pressure is higher than that under high confining pressure, that is, the sample shows compressive hardening. For the same initial confining pressure, the relationship of the tangent slope in the initial stage is RTC > TC > CTC, and the test curve of RTC tends to be flat first, followed by the TC and CTC curves. In the early stage of deformation, when the sample’s ε1 is less than 2%, the q required by the CTC stress path is the smallest, followed by the TC path, and the RTC path is the largest. As the deformation further develops until failure, the q of the CTC path is the largest, followed by the TC and RTC paths.
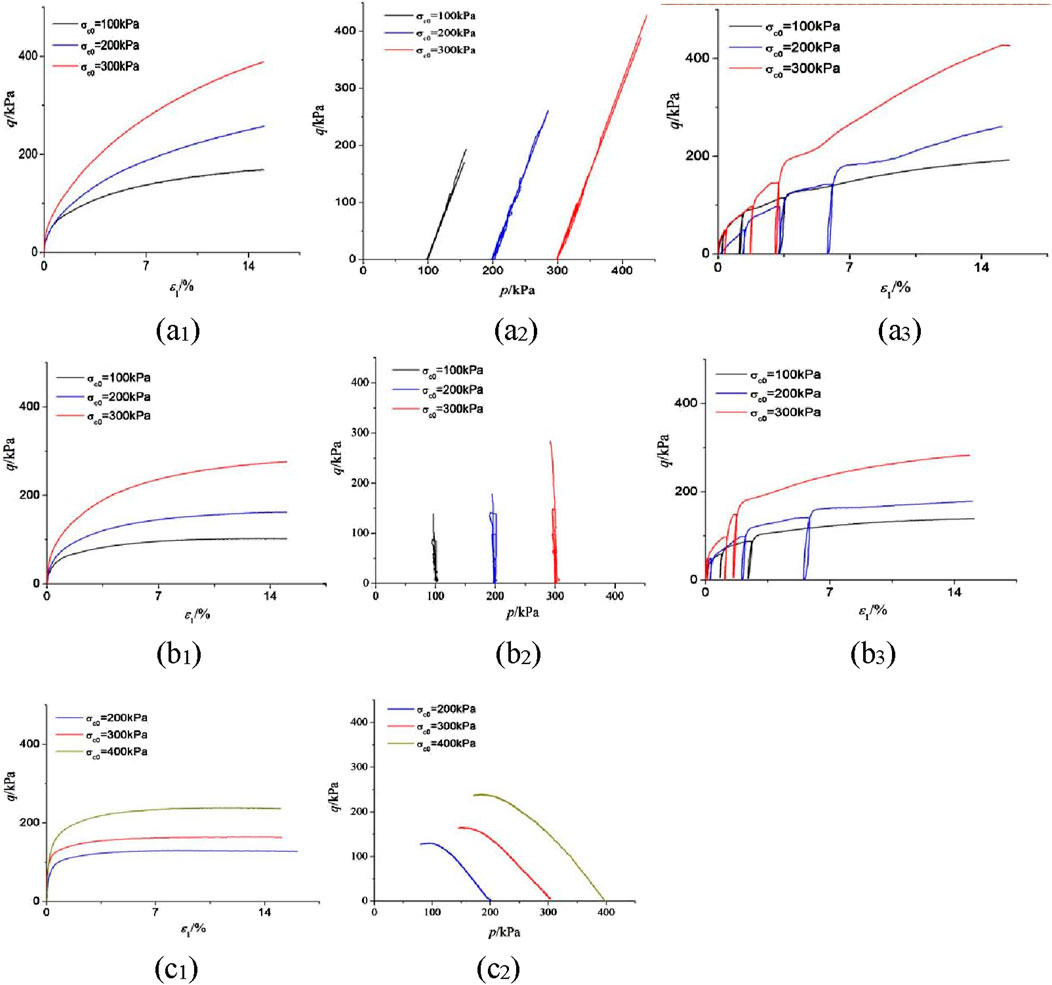
Figure 6. Test curves of different stress paths [CTC (A), TC (B), and RTC (C)] of remolded loess samples under different initial consolidation confining pressures: the relationship between q and ε1 under monotonic loading conditions (subscript 1), the relationship between q and p (subscript 2), and the relationship between q and ε1 under cyclic loading conditions (subscript 3).
Comparing the stress-strain relationship curves of monotonic loading and cyclic loading in the same test in Figure 6, it can be seen that the sample has an obvious hysteresis loop during the cyclic process: the curve drops steeply at the beginning of unloading, and the unloading curve gradually becomes gentle as q decreases. When loading again, the curve changes from steep to gentle. According to the elastic-plastic theory, after loading and then unloading, the sample cannot be completely restored to the original deformation state even if it is restored to the initial stress state before loading. Therefore, the total strain ε includes the recoverable elastic strain εe and the irrecoverable plastic strain εp:
In the experiments, it was found that when ε1 was lower than 0.5%, the strain could not be completely restored after unloading, indicating that when the q was first applied to the sample, the axial deformation already included the plastic deformation, but the elastic deformation was dominant. With the increase of ε1, the hysteresis loop gradually widened, and although the elastic deformation also gradually increased, its proportion gradually decreased.
The above phenomenon can be explained as the p constrains the sample when it deforms along different paths from the same initial conditions. Under the RTC path with decreasing p, the constraint effect of stress on the sample gradually decreases, resulting in greater plastic deformation, thus entering the yield state earlier. As the deformation develops until the sample reaches failure, the confining pressure of the RTC and TC paths decreases, and the constraint effect of external force on the sample gradually decreases, so that the inter-particle friction required to overcome a certain strain is reduced. Therefore, a larger deformation is produced under a lower q, and the shear stress required to reach the failure point is smaller. Figure 7 shows the spatial path of ε1 produced by the sample under different stress states at the same initial consolidation confining pressure of 300 kPa. The influence of p and q on ε1 can be intuitively seen.
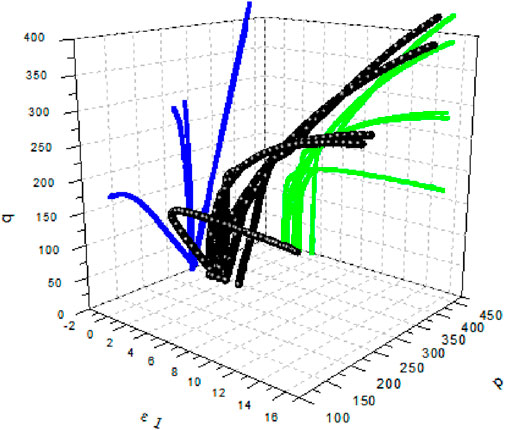
Figure 7. Stress path diagram of the sample in the three-dimensional space of q-p-ε1 under the initial consolidation confining pressure of 300 kPa.
3.2 Volumetric strain characteristics
Figure 8 shows the test curves of different stress paths (CTC, TC, and RTC) of remolded loess samples under different initial consolidation confining pressures, including the relationship between εv and ε1, the relationship between p and εv, and the relationship between q and εv. It can be seen that for the same stress path, the relationship curves between εv and ε1 of samples with different consolidation confining pressures are similar. Among them, εv shows a nearly linear growth with the increase of ε1 under the CTC path, the slope of the curve of the TC path gradually decreases, and the initial slope of the curve of the RTC path is larger, but the rate of gradual decrease of the slope is faster and tends to be flat earlier. Under the same stress path, the volume shrinkage of the sample increases with the increase of the initial consolidation confining pressure, which reflects the drainage, exhaust, and compaction effects of the confining pressure. In terms of the relationship between p and εv and the relationship between q and εv, unlike the ideal material where only p changes the volume and q only changes the shape, both p and q of the remolded loess sample change the volume. The relationship curves of p and εv under the three stress paths are close to linear, but the CTC path increases (shear expansion), while the TC and RTC paths decrease (shear contraction).
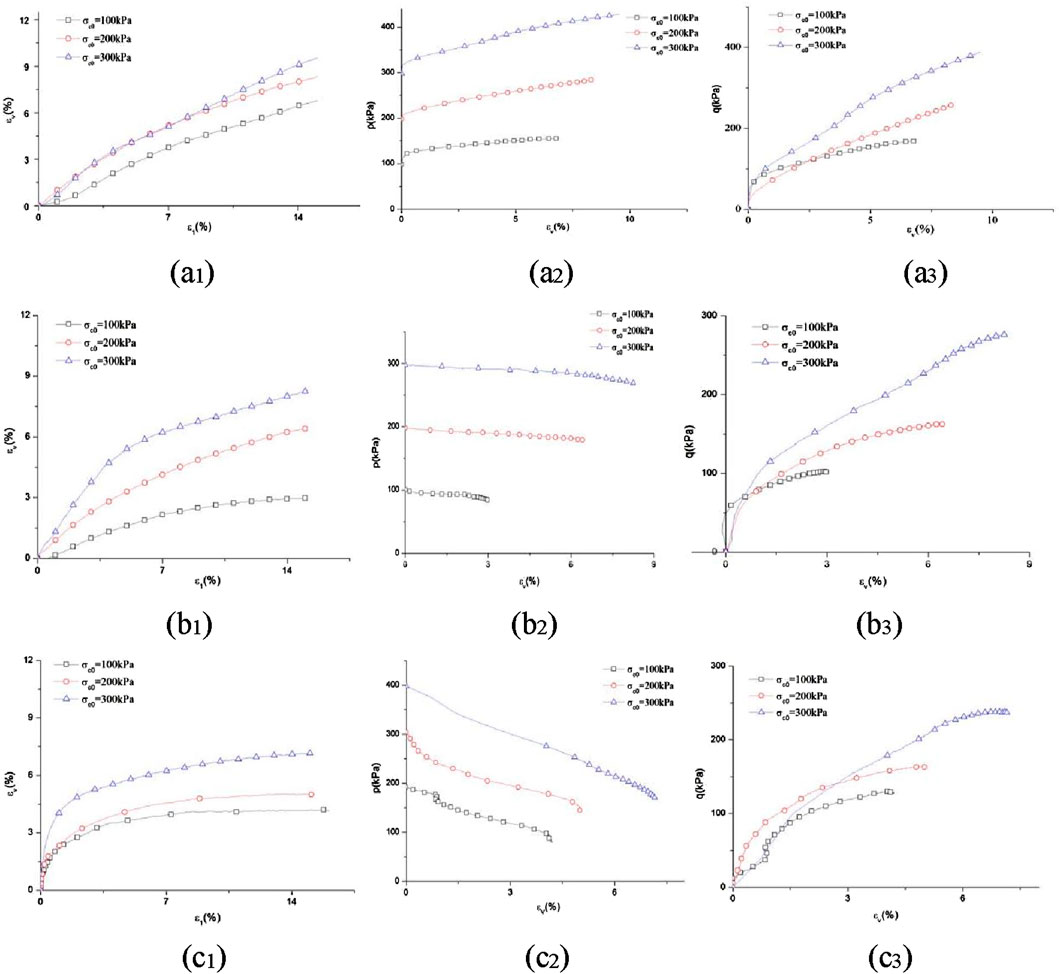
Figure 8. Test curves of different stress paths [CTC (A), TC (B), and RTC (C)] of remolded loess samples under different initial consolidation confining pressures: the relationship between εv and ε1 (subscript 1), the relationship between p and εv (subscript 2), and the relationship between q and εv (subscript 3).
Figure 9 shows the relationship curves of q, ε1, and εv over time in the CTC path of the remolded loess sample under different initial consolidation confining pressures (100 kPa, 200 kPa, and 300 kPa, respectively). It can be seen that in the stress cycle of loading-unloading-reloading under low confining pressure, the volume strain of the sample is shrinkage. When the confining pressure is higher and q is larger, the sample deformation tends to the characteristic of “volume shrinkage during loading and volume expansion during unloading”. The reason is that a higher consolidation confining pressure corresponds to a denser shape, and unloading is equivalent to removing part of the constraints, so the volume behaves as “rebound”. The volume strain curve of Figure 9C shows a certain hysteresis. In addition, it can be seen from Figure 9 that before q reaches the previous loading level, the deformation rate of the sample is very low. After reaching the previous loading level, the deformation rate increases significantly if the sample is continuously loaded, and the closer the sample is to failure, the higher the deformation rate.
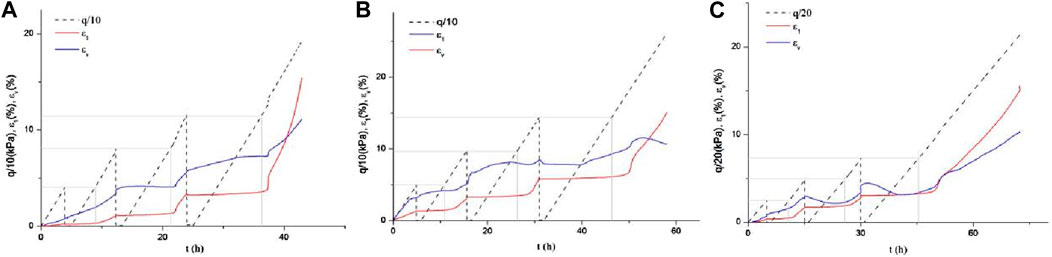
Figure 9. Relationship curves of q, ε1 and εv over time in the CTC path of the remolded loess sample under different initial consolidation confining pressures: 100 kPa (A), 200 kPa (B), and 300 kPa (C).
3.3 Strength analysis
Referring to the Chinese national standard “Soil Testing Code SL237-1999″, this study uses the (σ1 - σ3) peak point of the stress-strain curve as the failure point. If the (σ1 - σ3) has no peak, the (σ1 - σ3) corresponding to the ε1 of 15% is used as the failure strength value, qf.
Figure 10 shows the failure state line of the remolded loess sample in different stress paths, the failure principal stress line under monotonic loading, and the failure principal stress line under cyclic loading. As can be seen from Figure 10A, the curve trends of the sample reaching the failure state through different stress paths are similar. For the same stress path, as the initial consolidation confining pressure increases, the sample’s failure strength increases. The reason is that the confining pressure has a “constraint” effect on the sample, compacting it, and making the bite effect between particles stronger, so the friction that needs to be overcome to destroy it is greater. For the same initial consolidation confining pressure, the sample failure strength in the CTC path is the highest, followed by the TC path, and the lowest in the RTC path. The reason is that compared with the CTC path, the confining pressure in the TC and RTC paths is constantly decreasing, and the constraint effect on the sample is weakened, so that the normal stress applied to the contact surface between particles is reduced, and the friction required to overcome the deformation is lower. For the same path, the failure strength of the sample cyclic loading is higher than that of monotonic loading. This is because the cyclic loading process mainly occurs in the range of ε1 of 0%–6%, and its shear stress qs = 50% qf. In this way, the shear strength of the sample is higher when cyclic loading and unloading is performed in a lower strain range.
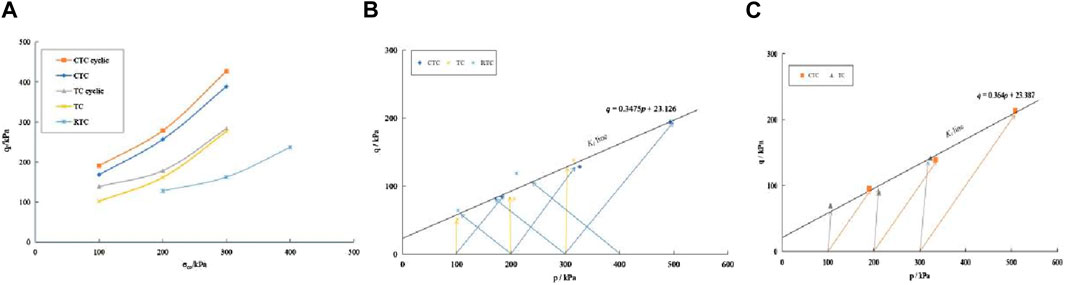
Figure 10. Failure state line (A), failure principal stress line under monotonic loading (B), and failure principal stress line under cyclic loading (C) of remolded loess samples in different stress paths.
Figures 10B, C shows the stress state points (p, q) when the sample reaches failure under different stress paths, where p = 0.5 (σ1 + σ3), q = 0.5 (σ1 - σ3), which correspond to the fitting of the failure principal stress lines Kf of the monotonic loading and cyclic loading stress paths. The shear strength index c and φ can be calculated as shown in Table 3.
where, α is the slope of the Kf line, and a is its intercept.
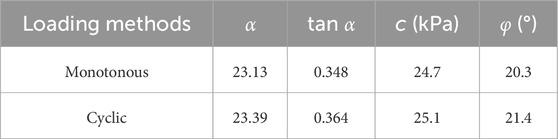
Table 3. Shear strength index of remolded loess under different loading methods.
From Table 3, it can be seen that for samples in the same initial state, there are differences in the shear strength index under different loading methods, which shows that different force processes have a certain influence on the arrangement and contact relationship between sample particles. Compared with monotonic loading, the cyclic loading path still has relative movement and rearrangement of particles during unloading, which can achieve a more stable state. In addition, the shear force needs to overcome more friction work to deform the soil, which is manifested as an increase in the internal friction angle ϕ; the difference in cohesion c can explain that the sample is continuously squeezed during cyclic loading, so the number of particle contact points per unit area increases.
3.4 Microstructure analysis
Figure 11 shows the cross-sectional and longitudinal SEM images of the original sample of remolded loess and the samples after different stress paths (CTC, TC, and RTC). It can be seen that the original sample has larger diameter particles, aggregates formed by cementation during the remodeling process, and secondary cementation attached to the particles, and the distribution of particles and pores is relatively uniform. The particle crushing degree of the sample after the RTC path is low, and some larger particles are intact and have larger pores. The particle crushing degree of the sample after the TC path is slightly higher, and a small number of particles are intact and have smaller pores. The particle crushing degree of the sample after the CTC path is higher, and large particles that are sheared and crushed and their sliding can be seen, and the particles are closely arranged and the pore content is lower.
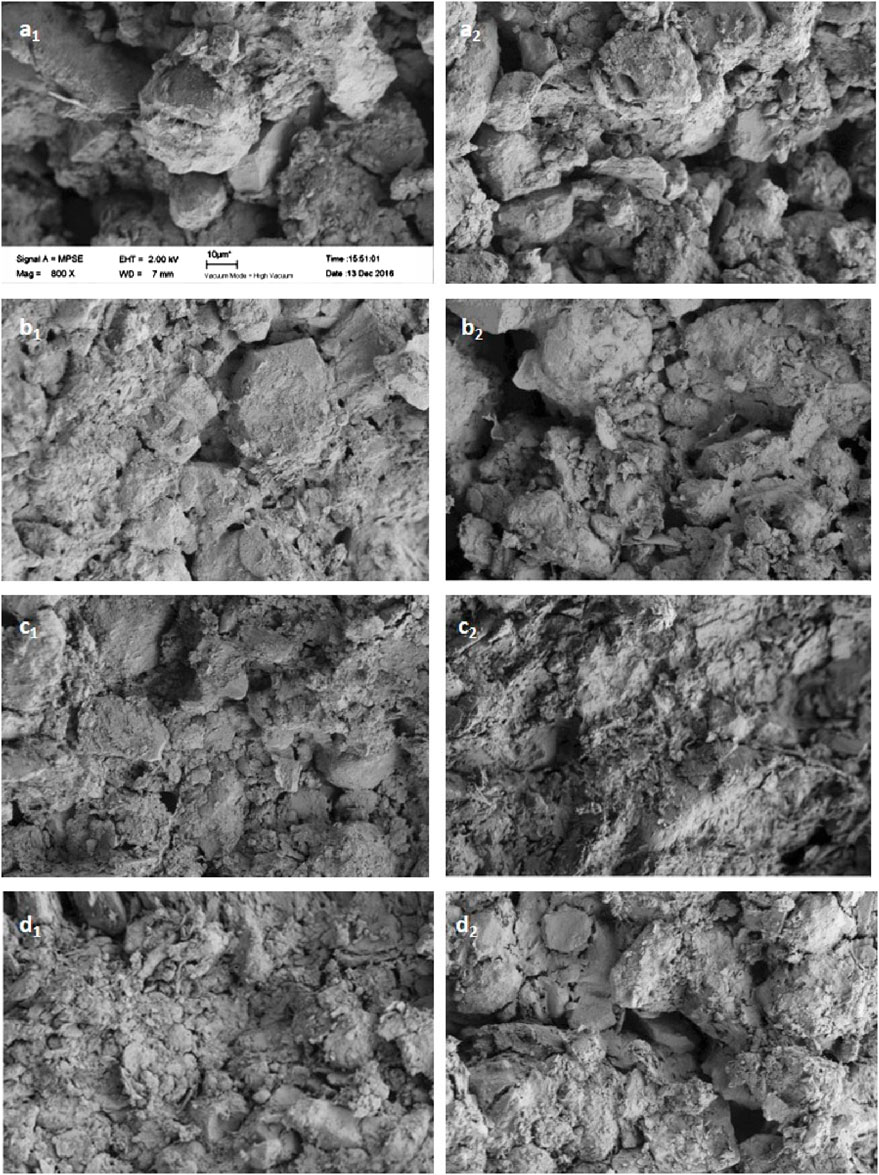
Figure 11. SEM images of the cross section (subscript 1) and longitudinal section (subscript 2) of the original remolded loess sample (A) and the samples after different stress paths [RTC (B), TC (C), and CTC (D)] tests (the scale of all figures is the same as that of part a1).
The plastic deformation of the sample is caused by the sliding and crushing of particles. Under the action of equal external forces p in all directions of isotropic compression, the particles are displaced and some particles are squeezed into the original pores. In principle, the direction in which particles slide under shear force is consistent with the direction of shear stress. However, due to the different shapes and irregular arrangement of particles, the movement direction of each particle is not fixed. Therefore, the movement of particles under shear causes the deformation of the sample to include both contraction and expansion trends. When the former is dominant, the macroscopic manifestation is volume reduction. Otherwise, it is the volume expansion. When unloading, only the particles that cause volume expansion are partially restored, so the macroscopic manifestation is volume contraction. When loading again, before reaching the previous level of shear stress, the sample is in a relatively stable form at this stress level, and there is little relative movement. Therefore, the volume change rate at this stage is very low and the volume change is very small. When the shear stress loaded again exceeds the previous level, the particles begin to undergo new relative movement, which is manifested as an increase in the volume change rate at a macroscopic level.
Figure 12 shows the porosity and morphology of the original remolded loess sample and the samples after different stress paths (CTC, TC, and RTC) tests. Among them, the porosity is obtained by analyzing the SEM images. It can be seen that the porosity and the volume of the sample are in the following order: original sample > RTC > TC > CTC. The sample after the RTC path test has a plastic shear band, and the lateral bulging deformation is the most obvious, but its volume shrinkage is the smallest.
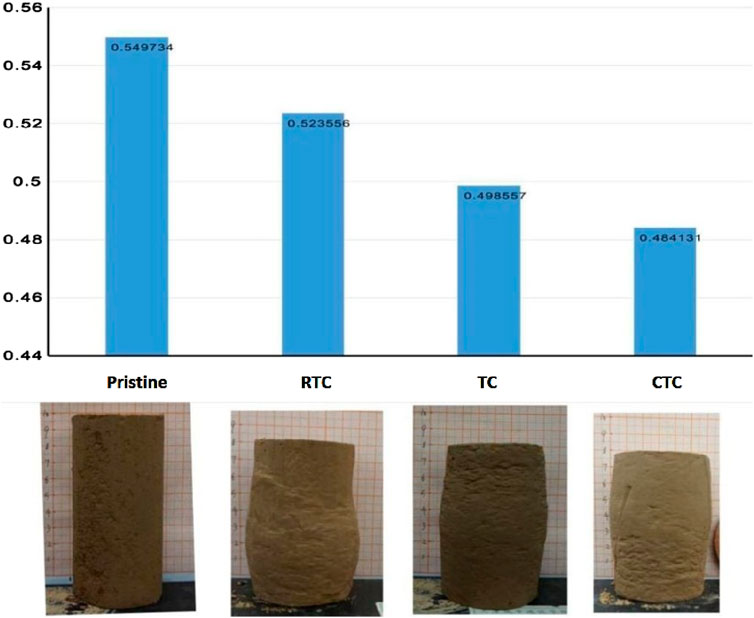
Figure 12. The porosity (upper row) and morphology (lower row) of the original remolded loess sample and the samples after different stress paths (CTC, TC, and RTC) tests.
4 Conclusion
This study first tested the basic physical indicators of the original loess samples, prepared the remolded loess samples with the same moisture content and dry density, carried out triaxial shear tests with different stress paths, obtained the stress-strain, volume strain, and other test curves, and analyzed the changing trends of sample deformation and strength under different stress paths and different initial consolidation confining pressures. In addition, the catastrophic mechanical behavior of the samples was explored by observing the microstructure of the samples. The main conclusions are as follows:
(1) The stress-strain curve of the remolded loess samples was affected by the loading path mode. It was strain hardening under the CTC path, and weak strain hardening under the TC and RTC paths. The samples showed volume shrinkage under different paths, and CTC > TC > RTC. For the same stress path, the volume shrinkage increased with the increase of initial confining pressure.
(2) The shear strength of the remolded loess samples was related to the stress level of the confining pressure. The shear strength under the same initial consolidation confining pressure was: CTC > TC > RTC.
(3) Under cyclic loading conditions, the principal stress difference when remolded loess reached failure was higher than that under monotonic loading, and the volume shrinkage of the soil increased during cyclic loading. In the loading-unloading-reloading cycle at a lower stress level, the remolded loess showed a volume shrinkage during both loading and unloading, while at a higher stress level, it tended to show the “elastic” characteristics of volume shrinkage during loading and volume expansion during unloading.
(4) From a microscopic perspective, after different stress path tests, the degree of particle crushing decreased and the porosity increased in the order of CTC, TC, and RTC.
Based on the above, the catastrophic mechanical behavior of loess can be summarized as follows. Under loading, in the early stage of deformation, the soil is compressed and compacted, the contact between particles is more sufficient, the deformation increases slowly, and the strength of the soil is improved to a certain extent. As the load continues to increase, the particles are continuously sheared to form shear bands, the nearby particles produce relative slip, the deformation rate increases steadily, the axial compression deformation is the main deformation, the lateral bulging deformation is small, the soil deformation to failure develops gradually, and the greater the external force constraint, the slower the deformation development of the loess. For the deformation process of lateral unloading, at the initial stage of unloading, the soil is maintained in a relatively stable state, with a small amount of compression deformation perpendicular to the unloading direction. In the later stage, when the lateral constraint is reduced to a critical state, a plastic shear crack zone appears inside the soil, the structure becomes unstable and damaged, the axial and radial deformations of the soil develop rapidly in a short period of time, and the deformation rate increases rapidly. The deformation and damage process of the soil tends to show that the deformation of the soil develops slowly in the early stage for a long time, and then a sudden deformation and damage occurs after reaching the critical state. This study could have great significance for preventing and reducing the occurrence of geological disasters on fill slopes in loess areas.
Finally, it should be noted that considering the complexity and non-uniformity of loess structure, as well as the spatial differences in its mechanical properties, our selection of the remolded loess with specific moisture content and dry density in this work has certain limitations. In addition, the three stress paths selected in this work are not comprehensive enough compared to actual working conditions. The future research could further investigate the loess samples with different moisture contents, as well as consider other different and more complex stress paths.
Data availability statement
The original contributions presented in the study are included in the article/supplementary material, further inquiries can be directed to the corresponding authors.
Author contributions
SM: Writing–original draft. DL: Writing–review and editing. RL: Writing–original draft. MY: Writing–original draft. JZ: Writing–original draft.
Funding
The author(s) declare that financial support was received for the research, authorship, and/or publication of this article. The Fundamental Research Funds for Central Public Welfare Research Institutes, CAGS (SK202206) and the China Geological Survey Program (DD20211309).
Conflict of interest
Author RL was employed by Shaanxi Geological and Mineral Sixth Geological Team Co. Ltd.
The remaining authors declare that the research was conducted in the absence of any commercial or financial relationships that could be construed as a potential conflict of interest.
Generative AI statement
The author(s) declare that no Generative AI was used in the creation of this manuscript.
Publisher’s note
All claims expressed in this article are solely those of the authors and do not necessarily represent those of their affiliated organizations, or those of the publisher, the editors and the reviewers. Any product that may be evaluated in this article, or claim that may be made by its manufacturer, is not guaranteed or endorsed by the publisher.
References
Chen, Y., Li, P., Wang, Y., and Li, J. (2024). Unraveling the mystery of water-induced loess disintegration: a comprehensive review of experimental research. Sustainability 16 (6), 2463. doi:10.3390/su16062463
Cheng, Z., Su, C., Zheng, Z., Zhuang, L., Wang, L., and Wang, E. (2021). Grain size characteristics and genesis of the muxing loess in the muling-xingkai plain, northeast China. J. Groundw. Sci. Eng. 9 (2), 152–160.
Duan, Z., Peng, J., and Leng, Y. (2016). Physical and mechanical properties of Q_2 loess in southern Jingyang, China. China: Journal of Chang'an University (Natural Science Edition, 60–66. (In Chinese).
Fu, Y., Cao, Y., Kong, J., Jia, Z., Mu, J., Wang, J., et al. (2024). The dynamic characteristics of saturated remolded loess under cyclic load. Earthq. Res. Adv. 4 (2), 100235. doi:10.1016/j.eqrea.2023.100235
Gao, J., Yu, H., Dai, W., and Li, K. (2013). Study on failure mode of loess fill slope and sediment scouring. People's Yangtze River (S2), 83–85. (In Chinese).
Leng, Y. (2014). Deformation strength characteristics of saturated-unsaturated remolded loess. China: Chang'an University. (In Chinese).
Li, H., He, Y., Xu, Q., Deng, J., Li, W., and Wei, Y. (2022). Detection and segmentation of loess landslides via satellite images: a two-phase framework. Landslides 19 (3), 673–686. doi:10.1007/s10346-021-01789-0
Li, H., He, Y., Xu, Q., Deng, J., Li, W., Wei, Y., et al. (2023). Sematic segmentation of loess landslides with STAPLE mask and fully connected conditional random field. Landslides 20 (2), 367–380. doi:10.1007/s10346-022-01983-8
Li, P., Kou, X., Wang, Y., and Niu, L. (2024). Building a more sustainable Chinese Loess Plateau. J. Earth Sci. 35 (1), 283–287. doi:10.1007/s12583-024-1970-3
Liu, C. (2007). New understanding of the cause mechanism of Badu landslide on Nanning-Kunming Railway. Hydrogeology Eng. Geol. (5), 1–5. (In Chinese).
Liu, X., Huang, G., Qin, Z., and Miao, X. (2024). Shear behaviour of loess under varied drainage conditions subjected to monotonic and cyclic loads. Soil Dyn. Earthq. Eng. 177, 108397. doi:10.1016/j.soildyn.2023.108397
Liu, Y., and Huang, Q. (2007). Experiment on deformation mechanism of loess slope under simulated loading. J. Earth Sci. Environ. (2), 183–187. (In Chinese).
Pan, X., Pan, L., and Luo, S. (1997). “Effect of stress path on φCU of normally consolidated saturated clay,” in Dam observation and geotechnical testing, 25–27. (In Chinese).
Peng, J., Lin, H., Wang, Q., Zhuang, J., Cheng, Y., and Zhu, X. (2014). Key issues and innovative ideas in the study of geological hazards in loess. J. Eng. Geol. 22 (4), 684–691. (In Chinese).
Peng, J., Wu, D., Duan, Z., Tang, D., Cheng, Y., Che, W., et al. (2016). Disaster characteristics and mechanism of loess landslides induced by typical human engineering activities. J. Southwest Jiaot. Univ. (5), 971–980. (In Chinese).
Qin, Y., Chen, Y., Lai, J., Qiu, J., Wang, Z., Tong, L., et al. (2024). Failures in loess slope-tunnel system: an overview of trigging sources, acting mechanism and mitigation strategies. Eng. Fail. Anal. 158, 107996. doi:10.1016/j.engfailanal.2024.107996
Qiu, J., Liu, D., Zhao, K., Lai, J., Wang, X., Wang, Z., et al. (2024). Influence spatial behavior of surface cracks and prospects for prevention methods in shallow loess tunnels in China. Tunn. Undergr. Space Technol. 143, 105453. doi:10.1016/j.tust.2023.105453
Shi, B., and Jiang, H. (2000). CT study on the development process of cracks in soil under external force. Chin. J. Geotechnical Eng. (5), 537–541. (In Chinese).
Shi, J., Lei, G., Ai, Y., and Song, X. (2005). Triaxial test study on stress path of soil pressure variation law. Rock Soil Mech. (11), 1700–1704. (In Chinese).
Song, C., Han, G., Wang, P., Shi, Y., and He, Z. (2017). Hydrochemical and isotope characteristics of spring water discharging from Qiushe Loess Section in Lingtai, northwestern China and their implication to groundwater recharge. J. Groundw. Sci. Eng. 5 (4), 364–373. doi:10.26599/jgse.2017.9280036
Song, C., Liu, M., Dong, Q., Lin, Z., Wang, P., Chen, H., et al. (2022). Variation characteristics of CO2 in a newly-excavated soil profile, Chinese Loess Plateau: excavation-induced ancient soil organic carbon decomposition. J. Groundw. Sci. Eng. 10 (1), 19–32.
Sun, S., Liu, C., and Kong, H. (2009). Formation mechanism and stability analysis of Banyanshan No. 2 Middle School landslide. Sci. Technol. Inf. (16), 84–85. (In Chinese).
Tang, K., Liu, D., Xie, S., Qiu, J., Lai, J., Liu, T., et al. (2024). Analysis of loess water migration regularity and failure response of tunnel structure under rainfall environment. Bull. Eng. Geol. Environ. 83 (6), 251–322. doi:10.1007/s10064-024-03715-9
Wang, G., Zhang, Y., Wen, H., and Chen, H. (2003). Deformation characteristics and cause analysis of Daheba ancient landslide. J. Chongqing Jianzhu Univ. (5), 1–4. (In Chinese).
Wang, J., Wei, X., and Xue, Q. (2008). Formation mechanism and disaster analysis of Yangya landslide in Yan'an, Shaanxi, China. Geol. Bull. (8), 1230–1234. (In Chinese).
Wang, Y., Hu, W., Sun, H., Zhao, Y., Zhang, P., Li, Z., et al. (2024). Soil moisture decline in China’s monsoon loess critical zone: more a result of land-use conversion than climate change. Proc. Natl. Acad. Sci. 121 (15), e2322127121. doi:10.1073/pnas.2322127121
Weng, X., Hou, L., Hu, J., and Zhou, R. (2024). An elastoplastic constitutive model for unsaturated loess with internal structure. Acta Geotech. 19 (6), 3603–3619. doi:10.1007/s11440-023-02102-0
Wu, Di (2015). Study on loess landslide triggered by engineering load. China: Chang'an University. (In Chinese).
Xu, Z., Lin, Z., and Zhang, M. (2007). Chinese loess and loess landslides. Chin. J. Rock Mech. Eng. 26 (7), 1297–1312. (In Chinese).
Yao, M., Chen, H. ’e., Li, H., Wang, Q., Han, Y., Yu, Q., et al. (2024). Stress ratio sensitivity - a novel parameter for evaluating the shearing-based structural characteristic of loess. Bull. Eng. Geol. Environ. 83 (1), 18. doi:10.1007/s10064-023-03527-3
Yu, G., Wang, Q., Zhu, L., and Zhang, X. (2023). Regulation of vegetation pattern on the hydrodynamic processes of erosion on hillslope in Loess Plateau, China. J. Groundw. Sci. Eng. 11 (1), 4–19. doi:10.26599/jgse.2023.9280002
Zhang, W., Wang, B., and Zhang, F. (2004). Influence of stress path on deformation of foundation pit engineering. Rock Soil Mech. (6), 964–966. (In Chinese).
Zhang, Y., Wang, A., Ma, K., Zhang, M., Meng, X., Zhu, K., et al. (2024). Geomorphic understanding of loess landslides activity on the loess tableland: a case study in the Bailu Tableland, China. Catena 234, 107641. doi:10.1016/j.catena.2023.107641
Zhou, D. (2003). Experimental study on soil deformation during excavation and unloading. J. Shandong Inst. Archit. Eng. (3), 15–18. (In Chinese).
Keywords: remolded loess, stress path, deformation characteristics, catastrophic mechanical behavior, fill slope
Citation: Meng S, Lv D, Liu R, Yu M and Zhang J (2025) The formation mechanism of geological disasters on loess fill slopes revealed by the deformation characteristics of remolded loess under different stress paths. Front. Earth Sci. 12:1512248. doi: 10.3389/feart.2024.1512248
Received: 16 October 2024; Accepted: 23 December 2024;
Published: 13 January 2025.
Edited by:
Giovanni Martinelli, National Institute of Geophysics and Volcanology, Section of Palermo, ItalyReviewed by:
Huajin Li, Chengdu University, ChinaHaowen Guo, Chinese Academy of Sciences (CAS), China
Copyright © 2025 Meng, Lv, Liu, Yu and Zhang. This is an open-access article distributed under the terms of the Creative Commons Attribution License (CC BY). The use, distribution or reproduction in other forums is permitted, provided the original author(s) and the copyright owner(s) are credited and that the original publication in this journal is cited, in accordance with accepted academic practice. No use, distribution or reproduction is permitted which does not comply with these terms.
*Correspondence: Dunyu Lv, bHZkdW55dUBtYWlsLmNncy5nb3YuY24=