- 1Aerospace Information Research Institute, Chinese Academy of Sciences, Beijing, China
- 2Gengdan Institute, Beijing University of Technology, Beijing, China
- 3Faculty of Geography, Tianjin Normal University, Tianjin, China
- 4National Institute of Natural Hazards, Ministry of Emergency Management of China, Beijing, China
- 5IEM Holding., Ltd., Wuxi, China
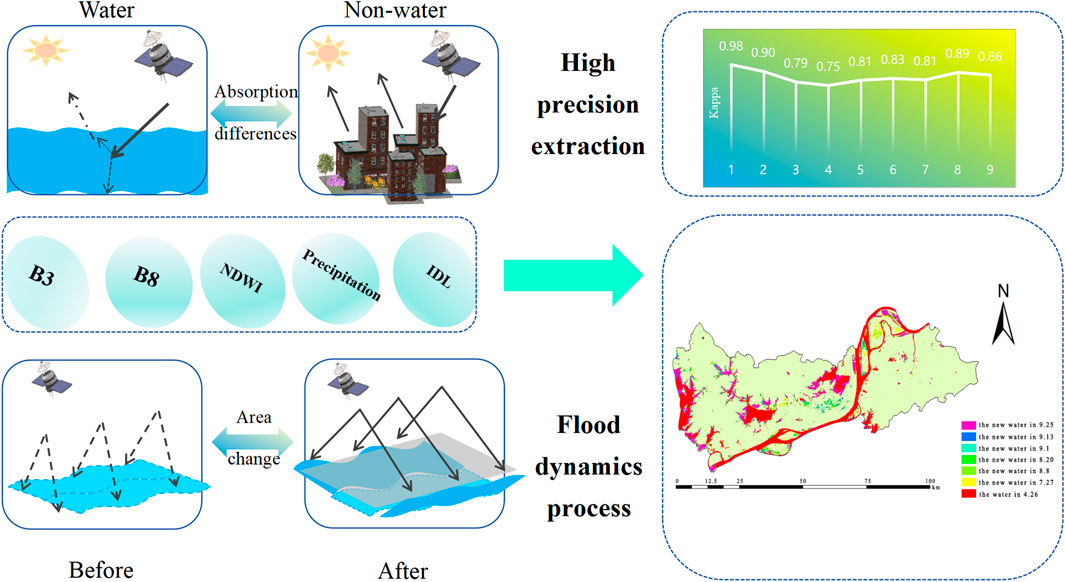
Introduction: Effective monitoring and evaluation of floodwaters are essential for disaster prevention and mitigation. The flood inundation range can be obtained by using traditional simulation methods, but these methods still have shortcomings. This work proposes an optimization method for traditional methods.
Methods: This study aims to introduce an effective solution for the rapid and accurate extraction of flood inundation areas, emphasizing the enhancement of extraction speed and dynamic monitoring throughout the flood event. The solution uses a normalized difference water index (NDWI), a refined threshold method, and a filtering process for microwave (radar) images. Sentinel-1 SAR (Synthetic Aperture Radar) and Sentinel-2 MSI (Multi-spectral Image) images served as the primary data sources. The Sentinel-2 images were preprocessed to extract pre-flood water bodies, while the Sentinel-1 SAR images were processed using the proposed filtering method to identify post-flood inundation areas.
Results: The application and validation of this framework are demonstrated through the case of the 2020 flood event in Tongling, Anhui Province. The framework’s performance was validated through comparison with ground truth data, yielding high kappa accuracies of 98% for optical images and 89% for Synthetic Aperture Radar. The findings highlight the framework’s ability to capture high-accuracy changes in flood inundation areas and to characterize the dynamic process of flood inundation area changes.
Discussion: This study contributes to the field by enhancing the extraction speed and scope of water bodies from SAR images and improving the quality of microwave remote sensing data processing. It offers valuable insights for emergency rapid response and situational awareness in the context of extreme weather events and associated flood disasters.
Highlights
1. Constructing an accurate and effective algorithm for flood inundation.
2. Mapping flood extents by combining Sentinel-1 SAR and Sentinel-2 MSI images.
3. Identifying the distribution of flood risks at different levels.
4. Analysis the flood extent area changes and its driving factors.
1 Introduction
With the advent of global warming and human interference, extremely heavy rainfall has become a frequent occurrence, often resulting in destructive and extensive flood disasters (Tellman et al., 2021; Nkwunonwo et al., 2020; Czajkowski et al., 2018). According to statistics from the Chinese Ministry of Water Resources and the National Disaster Reduction Center, between 1991 and 2022, an average of approximately 2020 people perished or were reported missing annually due to flood disasters, incurring an average annual economic loss of 160.4 billion yuan. This has had a significant impact on the country’s economic and social development (Liang et al., 2023; Wu et al., 2021; Xia et al., 2017). Therefore, scientifically addressing flood disasters, dynamically monitoring floods in near real-time and at a high-frequency and finely analyzing the spatiotemporal evolution patterns before and after floods are crucial for flood prevention and disaster reduction.
Remote sensing technology, leveraging the distinct spectral characteristics of geographic features, excels in obtaining spatial information about large water bodies and enables fully automatic flood monitoring. Typically, the location and area of water bodies are determined by constructing models in the near-infrared band. Commonly utilized methods include the water body index method, single-band threshold method, supervised classification method, support vector machine method (Li et al., 2020; Nguyen et al., 2023) and various algorithm-based approaches (Wang et al., 2022; Lv et al., 2022). Characterized by its timeliness and cost-effectiveness, routine detection often involves using satellite remote sensing to extract water information for applications such as water resource surveys, land use, river and lake monitoring, reservoir monitoring, flood inundation analysis and emergency monitoring. The evolution of remote sensing water body extraction has transitioned from initial manual visual interpretation to the integration of spectral and spatial information (Song and Xu, 2019). The focus has shifted from objectively interpreting water bodies to enhancing the efficiency of extracting flood disaster information, with automated high-precision extraction primarily based on automatic classification according to the spectral characteristics of land features, thereby improving the accuracy of water body extraction (Zhu et al., 2024a). It focuses on addressing challenges like slow extraction speed and poor quality of optical images caused by thick cloud (Nanehkaran et al., 2022; Nanehkaran et al., 2023a; Nanehkaran et al., 2023b).
Optical and radar remote sensing are the primary data sources for flash flood research. Optical remote sensing provides detailed information and facilitates data acquisition through various high-precision extraction techniques (Li et al., 2020). However, it is susceptible to interference from adverse weather conditions, particularly rain. Notably, combining the hybrid water body index model (CIWI) and the single-channel thresholding method is also an approach that can extract water bodies with high accuracy and low interference of noise shadows in the extraction results (Zheng et al., 2020). This method can generate high-resolution images, discerning between different land features, including the scattering information from building shadows and water bodies, which is crucial for delineating flood inundation areas. In addition, the automatic extraction method of water bodies combined with GIS data integrated with visible remote sensing and the method based on the change of upper limit have results (Sui et al., 2016; Chen et al., 2019). Despite improvements in the accuracy of flood inundation mapping from optical remote sensing, weather conditions, particularly rain, continue to pose significant challenges.
The advantage of radar remote sensing lies in its robust penetration through clouds and fog, unaffected by weather conditions, with the capability to operate continuously under all weather conditions, directly extracting water body ranges under adverse weather conditions (Zhu et al., 2024b; Nanehkaran Y A et al., 2022). Its drawback is the lower extraction accuracy and the relatively cumbersome processing involved. The band threshold method is a prevalent technique for processing radar remote sensing images to delineate flood inundation areas. Cao and Liu, (2006) applied this method to extract water body extents from ASAR data. Furthermore, various approaches, including the Otsu algorithm, object-oriented methods, U-Net, and the H-FCM algorithm, have shown high accuracy in flood inundation mapping. For instance, Rahman and Thakur, (2018) employed time-series Synthetic Aperture Radar (SAR) images combined with density slicing to precisely delineate flood inundation areas. Tiwari et al. (2020) successfully extracted the flood-affected region in Kerala using the Otsu algorithm on Sentinel-1 SAR data. Wang et al. (2021) assessed the comparative accuracy of the object-oriented, U-Net, and Otsu methods for water body extraction using Sentinel-1 SAR images. Pan et al. (2022) introduced a method leveraging the KECA algorithm for feature extraction, thereby enhancing robustness. Wang et al. (2023) suggested the use of a multi-branch dual-contrast learning model to enhance image classification accuracy. These techniques have further improved the robustness and accuracy of feature extraction and image classification in flood mapping.
The SAR processing and analysis involve data input, multi-view processing, filtering, geocoding or radiometric calibration, water body extraction, and post-processing of results (Qiu et al., 2022; Wei et al., 2024). The extraction of flood inundation from SAR images is mainly based on the difference in the strength of the backscattered microwave signals from the ground surface, identifying the flood inundation range. However, the method of extracting water bodies using SAR images has garnered increased attention. For example, Wang et al. (2020) proposed the H-FCM algorithm, integrating river positions extracted from optical remote sensing images into post-flood SAR images, thereby improving detection accuracy. Radar remote sensing, which actively emits microwaves, is not hindered by weather conditions and possesses strong penetration through obstacles, thus enhancing the accuracy of water body extraction (Qingsheng et al., 2022). Consequently, the integration of radar remote sensing and optical remote sensing images, along with the combination of SAR data and intelligent water body extraction algorithms to delineate flood inundation ranges, has progressively become a focal point of research. In addition, the method of integrating machine learning models with INSAR technology, along with DEM data at the best resolution, is also of significant importance for reducing risks such as landslides in various locations (Ahangari Nanehkaran et al., 2022; Cemiloglu et al., 2023; Mao et al., 2024)
In summary, scholars both domestically and internationally have achieved substantial success in extracting flood inundation ranges using remote sensing technology. However, there is a paucity of analysis regarding the extraction speed and dynamic changes throughout the entire flood process. Additionally, the extraction of water bodies from microwave (radar) remote sensing images necessitates a vast amount of data. Utilizing the filtering processing provided by the ENVI 5.3 platform is time-consuming and demands high computer hardware specifications. The absence of filtering processing can impair the accuracy of water body extraction. Therefore, the objective of this study is to employ optical remote sensing to extract the pre-flood water body range as a reference. This study will concentrate on the dynamic changes in the flood inundation area, propose a filtering processing method based on microwave (radar) remote sensing images and construct and validate a framework for extracting flood inundation ranges based on a comprehensive water index method and threshold method. In this study, the validity of the model was verified using Tongling as the study area and using what data for the 2020 flood. The research outcomes are expected to enhance the speed and scope of water body extraction from SAR images, improve the quality of filtering processing for microwave (radar) remote sensing data and offer a reference for disaster early warning and situational awareness prompted by extreme weather events.
2 Study area and data
2.1 Study area
Tongling located in the south-central part of Anhui Province and downstream of the Yangtze River, covering the latitude between 30°38′N and 31°09′N and the longitude of 117°04′E and 118°09′E (Figure 1). It is characterized by a monsoon climate with hot and rainy summers, high rainfall and increased runoff (Ye et al., 2024). For the Yangtze River in Tongling, its flood season typically occurred in July and August. The leading to significant variations in annual river runoff and frequent flooding disasters. Furthermore, Tongling’s flat terrain, small elevation differences and slow water flow contribute to its susceptibility to flood retention and flooding disasters (Qi, 2015). In July 2020, due to the inflow from the upper reaches of the Yangtze and continuous heavy rainfall, the water level in Tongling rose rapidly. The entire flood process started in July and lasted for about 2 months until early September. By July 7, the water level in the Tongling section of the Yangtze River had exceeded the warning level, resulting in a continuous expansion of the flooded area. On July 17, the second flood of 2020 formed in the upper reaches of the Yangtze River. By the end of July and early August, the water levels in the rivers, lakes and reservoirs in Tongling gradually receded and the flood control level was reduced from level one to level two, leading to a gradual decrease in the flooded area. By the end of August, due to several consecutive sunny days, the flood in Tongling gradually receded. Figure 1B illustrates some of the details of the development-peak-recession scenarios for the Copperopolis 2020 flood, in relation to changes in the corresponding emergency response measures.
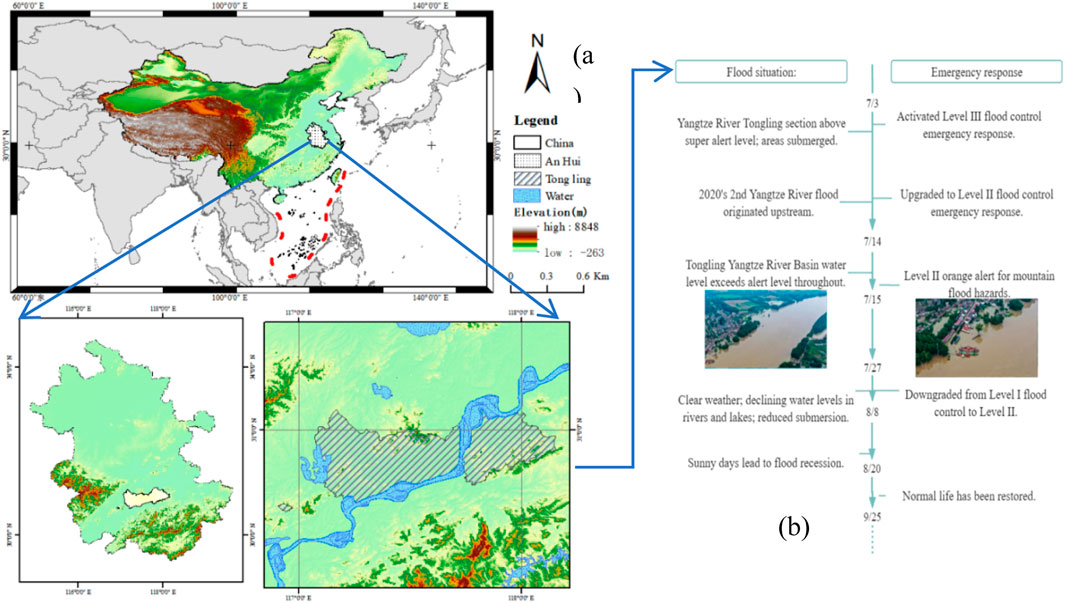
Figure 1. (A): Geographic location of Tongling; (B) the flooding process (Image from China Emergency Information Network (“https://cneb.gov.cn/” and https://www.emerinfo.cn/).
2.2 Data sources
The study concentrated on a significant flood event that took place in Tongling, Anhui Province in July 2020. To capture flood extents, the Sentinel-2 MSI images before flood disaster and Sentinel-1 SAR images after flood disaster were collected. The SAR images recorded water inundation extents at eight time points. The detailed information of each dataset was outlined in Table 1. The Sentinel-1 data originated from the European Space Agency (ESA) and consisted of Ground Range Detected (GRD) Level-1 data, featuring VH polarization and operating in Interferometric Wide Swath (IW) mode. These radar data had been subjected to multi-view and geocoding corrections, which rendered geographic registration unnecessary. The Sentinel-2 data, also provided by ESA, existed in the form of unprocessed Level-1C data products that had undergone systematic geometric correction. Meanwhile, high resolution images from Google Earth platform were utilized. These were obtained from the Resource and Environment Science Data Platform of the Chinese Academy of Sciences (https://www.resdc.cn/). Heavy rainfall process data from Anhui Meteorological Bureau, Water Conservancy Yearbook.
The preprocessing of optical images primarily relies on the Sen2Cor plugin within the Sentinel Application Platform (SNAP), developed by the European Space Agency. This process includes radiometric correction, geometric terrain correction, noise removal, and transformation of backscattering coefficient images. The Sen2Cor module within SNAP is specifically invoked for atmospheric correction, and the corrected data is then resampled to a 10 m resolution using ArcMap. For SAR data, the SARscape plugin of the ENVI5.3 platform is utilized for microwave image preprocessing, which involves multi-view processing, single-image filtering, data enhancement, and geo-correction. These steps are essential for the extraction and analysis of flood inundation areas. The analysis was further enhanced by the incorporation of ground truth data, which included a diverse range of terrains and urban settings. This inclusion was essential for ensuring the representativeness and accuracy of the study. High-resolution imagery and field survey data were also integrated to substantiate the findings and provide a comprehensive basis for validation. These additions are crucial for the robustness of the study’s conclusions and for meeting the rigorous standards of academic research. The determination of thresholds was carefully calibrated to clearly distinguish water bodies from non-water bodies in the images, utilizing a variety of data sources to ensure the precision and reliability of the results.
3 Methodology
3.1 Building a framework for flood extraction
This study processed radar images from multiple revisit cycles post-disaster, including correcting the radar remote sensing water body range and removing permanent water bodies, and then the actual flooded areas were obtained. Utilizing GIS for visualization operations, the flooded areas from multiple periods and the initially obtained optical remote sensing reference are composited to obtain dynamic information on the changes in flooded areas. This paper initiates the process by normalizing rivers, lakes, reservoirs and other water bodies, amassing a dataset of 1,058 water body sample points and 579 non-water body sample points for verification purposes. Integrating these with pre-existing ground truth samples, the classification accuracy was ascertained using the confusion matrix method. Taking the major flood event in Tongling, Anhui in 2020 as an example, water bodies are first extracted from Sentinel-2 satellite optical remote sensing images. After calibration and correction using the Sen2Cor plugin, the permanent water body range is obtained using SNAP resampling and the NDWI index. Water bodies are then extracted based on Sentinel-1 SAR images. For the Sentinel-1 SAR images, filtering and correction work was conducted using the SARscape plugin. The filtering operation in IDL environment is performed. The arithmetic mean smoothing filter was used to derive a threshold from the differences between water and land bands. In this way, a distributed water body extraction model is developed to dynamically obtain the flooded area by excluding permanent water bodies. This framework will extract water bodies before and after flood disaster in Tongling, using Sentinel-2 images and Sentinel-1 SAR images, respectively. Finally, accuracy validation of kappa coefficient was calculated. The specific methodology is described in Figure 2.
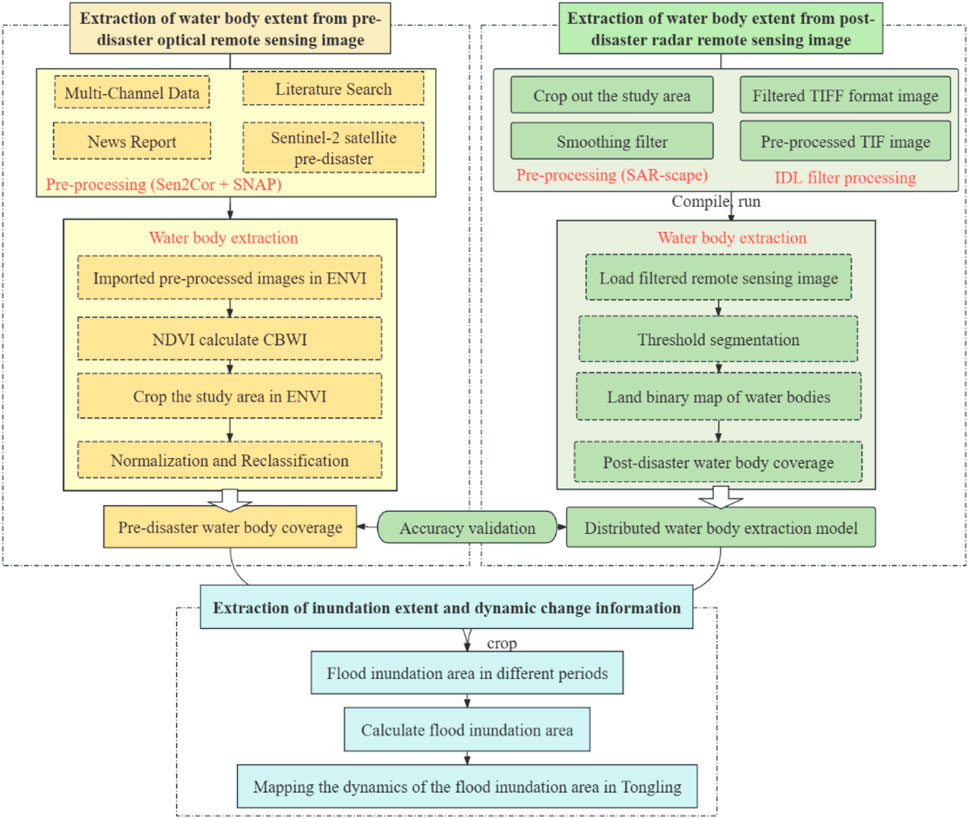
Figure 2. Flood inundation extraction framework based on comprehensive water body index method and threshold method.
3.2 Key methods
The Normalized Difference Water Index (NDWI) was employed to identify water bodies. The NDWI was calculated using the Formula 1:
where Green represents the green band of Sentinen-2 images; NIR represents the near-infrared band of Sentinen-2 images. This process allowed for the minimization of vegetation’s influence and the enhancement of water features in the images.
IDL was employed for its user-friendly nature and its established role in geographic remote sensing data processing. This study primarily utilizes IDL (Interactive Data Language) for processing SAR from radar remote sensing. Utilizing IDL’s built-in smooth function to apply smoothing filtering algorithms to the radar images. Recognizing that the brightness of objects in the images corresponded to the echo intensity, which was determined by the radar’s backscatter coefficient. Employing a threshold segmentation method to differentiate water bodies, which typically exhibit lower backscatter coefficients and thus appear darker, from non-water bodies. Applying a specific formula to calculate the backscatter coefficient using a threshold (M) that distinguishes water bodies from non-water bodies in the image. Identifying the threshold M by experimenting with different values and using the formula to determine the backscatter coefficient for water bodies. Segmenting colors based on established thresholds to clearly differentiate water bodies from non-water bodies in the images. The specific Formula 2 is as follows:
where
3.3 Water body and flood inundation extraction in the framework
In the study, integration of Sentinel-2 satellite imagery was utilized, focusing on bands B3 and B8 to process and extract water bodies. The methodology incorporated filtering techniques to mitigate noise, followed by normalization and reclassification in ArcGIS10.6. Pixels with values below the threshold of 0.15 were classified as water bodies, while those exceeding this value were categorized as non-water areas. This approach facilitated the clear delineation of the extent of permanent water bodies. Subsequently, processing of radar remote sensing data was executed using the IDL programming language, which included a smoothing function to refine the microwave image data. As shown in Figure 3. A smoothing filter algorithm was applied to reduce the impact of objects with strong edges, enhancing the precision of water body extraction. The distribution data of water bodies within the target area were obtained through band thresholding and IDL filtering. Further refinement of flood inundation area extraction was carried out in ArcGIS, following georeferencing and projection correction. The presence of permanent water bodies, such as the Yangtze River and Tianjing Lake, was accounted for by utilizing Sentinel-2 satellite data as a base layer. This step was essential for the accurate exclusion of these features from the Sentinel-1 satellite SAR data. The area of inundation for each period was determined by calculating pixel counts from the attribute table of the flood inundation range, providing a comprehensive analysis of flood dynamics within the study area.
4 Results
4.1 Water body extraction results
4.1.1 The water body extraction distribution
In this study, a methodology was developed to delineate water bodies and gather their distribution data within the target area. Band thresholding and IDL filtering methods were employed to process the satellite imagery, enabling the extraction of water body extents and the identification of flood inundation areas. The spatial distribution of water bodies was mapped using Sentinel-2 satellite optical data, which provided high-resolution green and near-infrared bands essential for the Normalized Difference Water Index (NDWI) calculation.
Figure 4D displays the outcome of processing with the IDL language program. When compared to Figure 4C, which shows the image before the application of the smoothing function, it is evident that the post-filtering image exhibits a smoother and more continuous visual effect. The disturbances and noise at the edges are significantly reduced, resulting in a clearer image that is more conducive to interpretation and analysis. The smoothing filter algorithm implemented in IDL has proven effective in optimizing microwave image data, thus laying a solid foundation for further analysis and applications. Figure 5 presents the flood inundation areas after geographic registration and projection correction. The manuscript describes the variations in water body extents in Tongling City across different dates, as shown in Figures 5A–H. These figures provide a detailed account of the changes in water body distribution over time, highlighting the dynamic nature of flood inundation and the factors influencing it.
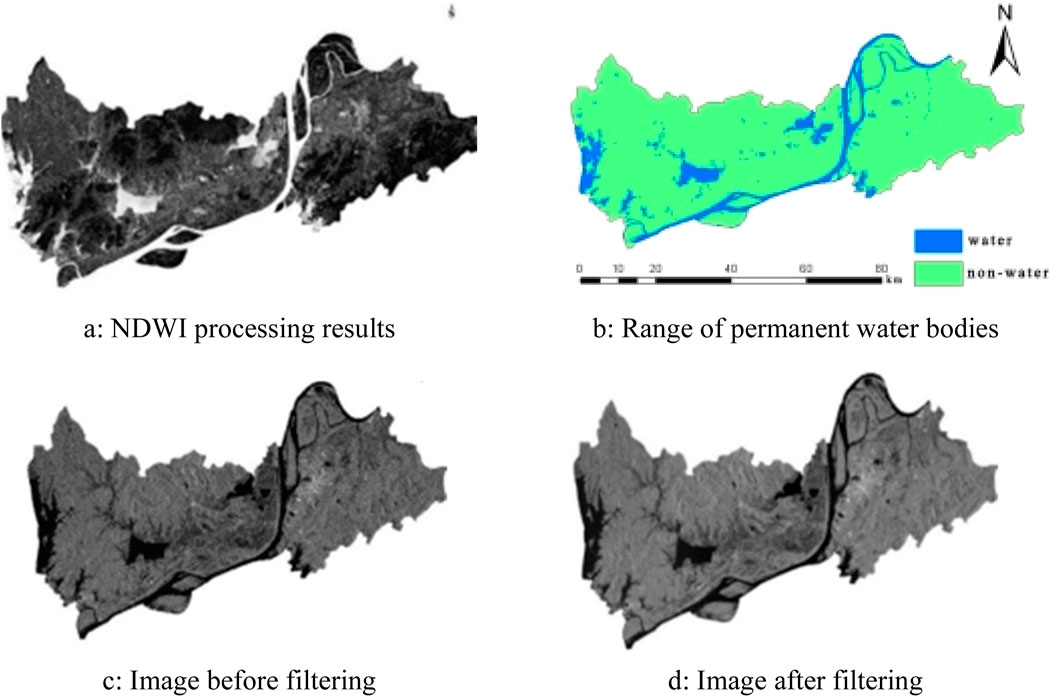
Figure 4. IDL algorithm based remote sensing image smoothing filtering processing results (A): NDWI processing results; (B) Range of permanent water bodies; (C) Image before filtering (D) Image after filtering).
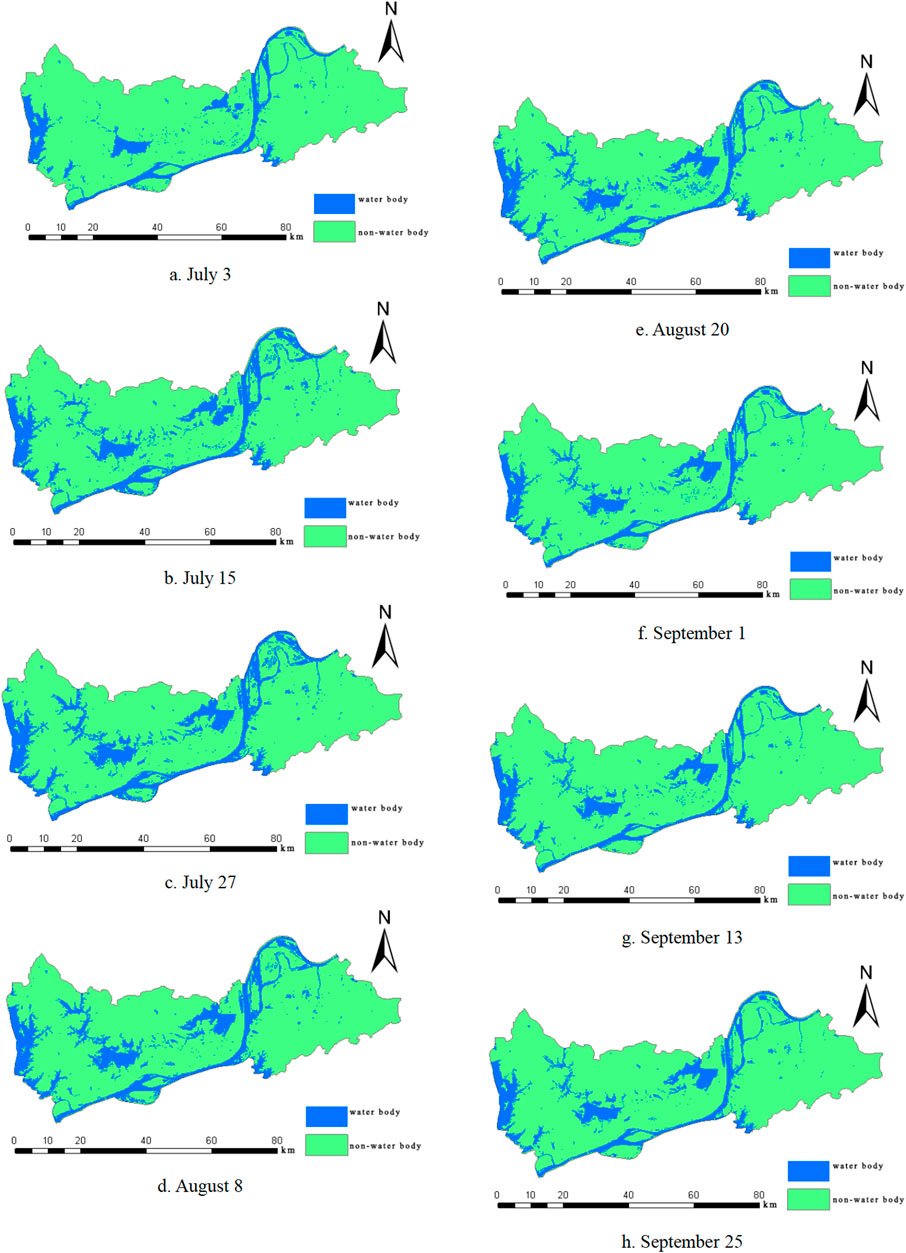
Figure 5. The water body extraction distribution in Tongling from July to September 2020. (A) July 3, (B) July 15, (C) July 27, (D) August 8, (E) August 20 (F) September 1, (G) September 13, (H) September 25.
Furthermore, the study examines the influence of permanent water bodies, such as the Yangtze River and Tianjing Lake, on the extent of flood inundation. To account for these factors, water extraction data from Sentinel-2 satellite images were utilized as a reference map. This map was instrumental in excluding permanent water bodies from the Sentinel-1 satellite SAR data, which allowed for the accurate mapping of flood inundation areas for each respective period. Figure 5 illustrates the results of this process, showcasing the refined delineation of flood inundation areas, free from the influence of permanent water bodies. This approach ensures that the flood risk assessment is based on accurate and up-to-date spatial data, providing valuable insights for flood risk management and mitigation strategies.
It also examines the influence of permanent water bodies, including the Yangtze River and Tianjing Lake, on the extent of flood inundation. To this end, water extraction data from Sentinel-2 satellite images is utilized as a reference map. This map facilitates the exclusion of permanent water bodies from the Sentinel-1 satellite SAR data, thereby enabling the accurate mapping of flood inundation areas for each respective period, as demonstrated in Figure 5.
4.2 Extraction accuracy for flood
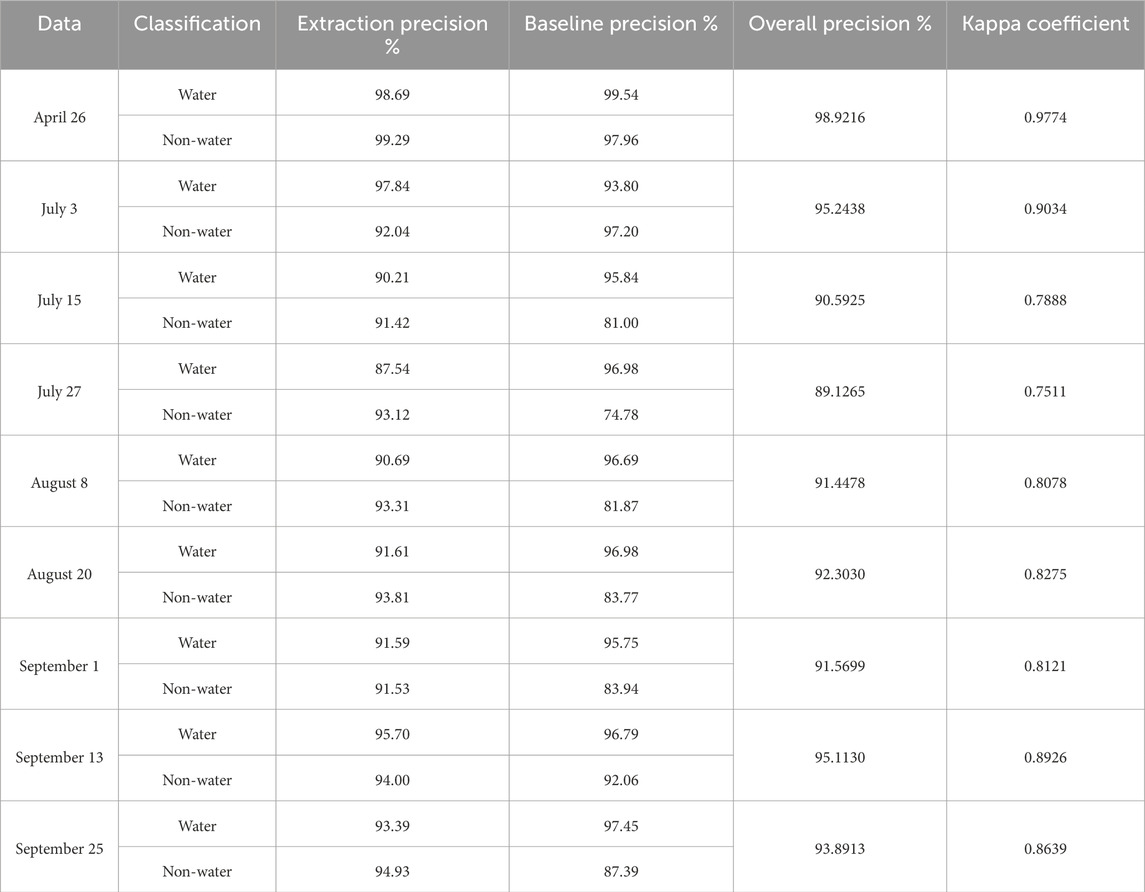
This paper embarked on a meticulous process, beginning with the normalization of rivers, lakes, reservoirs, and other water bodies. A comprehensive dataset was compiled, comprising 1,058 water body sample points and 579 non-water body sample points, all meticulously gathered for verification. These samples were harmoniously integrated with existing ground truth data, and the classification accuracy was meticulously determined using the confusion matrix method. The outcomes of this analysis are meticulously detailed in Table 2.
The results of this rigorous evaluation are compelling: the method proposed in this study has achieved a water body extraction accuracy that exceeds 80%, with a baseline extraction accuracy that impressively surpasses 87%. Remarkably, the overall accuracy not only meets but exceeds expectations, reaching 89%, and the Kappa coefficient, a critical measure of precision and reliability, impressively exceeds 0.75.
Upon a meticulous analysis of the classification accuracy data presented, it becomes evident that the precision rates for both water and non-water classifications are exceptionally high, signifying a robust extraction process. The water body extraction precision varies, with a low of 87.54% recorded on July 27 and a peak of 98.69% on April 26. Similarly, the baseline precision for water bodies follows a comparable trend, with the highest value noted on the same date (April 26) at 99.54%. For non-water body extraction, precision rates consistently remain above 90%, with the exception of the July 15 measurement, which temporarily dips to 81.00%. The overall precision percentages, reflecting the combined accuracy of both classifications, are equally remarkable, ranging from a low of 89.12% on July 27 to a high of 98.92% on April 26. These figures demonstrate the method’s high accuracy and consistency over time. The slight decrease in precision for both water and non-water classifications on July 15 and July 27 is an anomaly that may warrant further investigation.
The Kappa coefficients, which measure the agreement between observed and expected classifications, are substantial across all dates. The lowest value, 0.7511, was recorded on July 27, while the highest, an impressive 0.9774, was noted on April 26. A Kappa coefficient above 0.8 typically indicates strong agreement, suggesting that the classification method employed is not only reliable but also consistently effective for all the dates under consideration.
4.3 Spatiotemporal variation characteristics of flood inundation areas
The spatial distribution of flood inundation is extracted using multi-temporal data from Sentinel-1 and Sentinel-2, capturing dynamic information on flood changes over time. Extent of inundation is the extent of change in the area of a water body before and after a flood event. As illustrated in Figure 6. A detailed analysis of the flooded areas in Tongling throughout 2020 revealed a distinct pattern in the flood event’s progression.
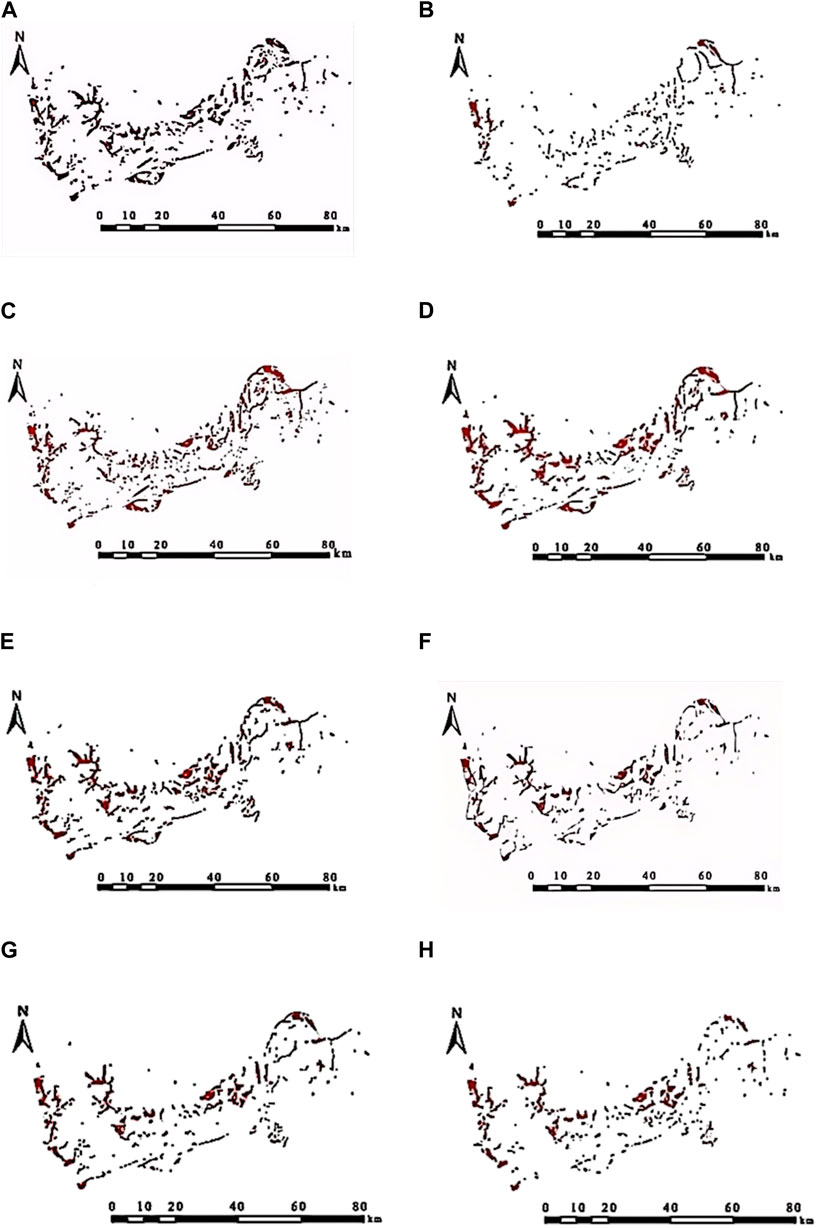
Figure 6. Flood inundation range variation chart. (A) July 3, (B) July 15, (C) July 27, (D) August 8,(E) August 20, (F) September 1, (G) September 13, (H) September 25.
During the flood, the period of rising water was comparatively shorter than the period of receding water. The smallest observed flooded area was approximately 15 km2on July 3, while the largest extent of flooding, around 230 km2, was recorded around July 27. The area affected by flooding expanded prior to July 27 and subsequently contracted. From late August through September, the flooded area oscillated around 98 km2, indicating a stabilization phase. The temporal characteristics of the affected area can be summarized as follows:
On July 27, there was a significant increase in the flooded area due to heavy rainfall and swift inflow from the upstream Yangtze River, which overwhelmed the flood discharge capacity. The inundation began in the Yangtze River section and progressively spread to the northern and northeastern parts of the region, peaking on July 27. Post-July 27, the flooded area started to diminish as the rainfall subsided and water levels in rivers and lakes dropped. Soil moisture saturation also resulted in reduced infiltration and a slower recession of water bodies. Although the flooded area in the Yangtze River section of Tongling began to recede, the overall reduction was minimal. From September 1, there was a marked decrease in the flooded area, which by September 25 had reduced to less than half of its maximum extent. This reduction aligns with the implementation of flood response measures and flood prevention efforts by Tongling authorities.
4.4 Dynamic changes in flooded areas
The high-risk areas affected by the flood mainly include the banks of the Yangtze River, Baitu Lake, Baidang Lake, Fengsha Lake and Chenyao Lake in the northern and central parts of Tongling, with the eastern region less affected and the rest of the areas basically unaffected by the flood. Although the flood mainly concentrated along the banks of the major rivers and lakes, combined with the statistical chart of the flooded areas at different time phases, this heavy rainfall still caused a large area to be submerged. The flood mainly occurred from early July to the end of August, lasting for nearly 2 months, belonging to the critical period of flood prevention known as the upstream in July, downstream in August. In September, the numerical value of the flooded area began to fluctuate and some seasonal water bodies may have become permanent water bodies. At this time, the entire flood process has ended. Therefore, based on July 27, near the peak of the flooded area, dynamic maps of the flooded areas during the rising and receding periods of the flood were drawn, as shown in Figures 7A, B.

Figure 7. Dynamic process of flood inundation extent in Tongling (A): Flood rise period (B): Flood receding period.
Further analysis of the trend of the flood is provided below. Considering the weather conditions: from early July to the July 27, rainfall continued, leading to the growth period of the flooded area. During this time, the water levels of rivers and lakes rose rapidly and the flooded area mainly concentrated on the northern and western foothills. From the end of July to early August was the stable period of the flooded area. Due to occasional light to moderate rain, the flooded area remained large until August 8. The main reason for the inundation in the northern and western regions was the diversion of ridges to gentle terrain. From the end of August to September 1, the weather was clear, marking the unstable period of the flooded area, with water levels gradually decreasing around the northern and western foothills. After September is the period of flood recession and post-disaster reconstruction. During this time, except for the northern and western foothills, where water accumulation may become permanent due to topography, the other areas generally returned to pre-disaster levels. The rate of decline in water level in the Tongling section of the Yangtze River main stream was greater than that in the northern and western regions. It can be seen that the water level rose rapidly in the early stage and after measures such as downstream flood discharge, it also decreased rapidly. The duration of flooding was longer, mainly concentrated in the foothills of the western and northern regions. Based on the above research, it is suggested that the management strategy of Tongling in the future should focus on strengthening embankments of rivers, lakes and other water bodies before the summer flood season on July 27, after July 27, attention should be paid to dredging work around the lakes at the foothills of the northern and western sides and improving the drainage system in the central urban area to ensure rapid flood discharge and restoration of production and life.
5 Discussion
In this study, a method for identifying flood ranges using SAR, enhanced through filter improvements via the IDL programming language, is developed. This paper constructs a framework to extracting flood inundation areas from Sentinel-2 images in green and NIR bands and Sentinel-1 SAR images, employing a comprehensive water index method and threshold method. Focusing on Tongling in Anhui Province, which endured severe flooding in 2020, this paper utilizes Sentinel-2 optical images pre-flood and Sentinel-1 radar images post-flood to extract water volumes for the area.
The specific results captured detailed spatiotemporal dynamics of the flood inundation areas in Tongling, demonstrating the method’s reliability to record changes over time with good accuracy. Compared with actual data, the framework achieves an accuracy rate of 98% for optical images and 89% for SAR, which well meets the goal of accurately delineating flood inundation areas. This highlights the method’s potential for timely and precise flood monitoring across different regions and scenarios. However, some limitations of this method are observed, such as a slight decrease in the classification accuracy of water and non-water areas on July 15 and July 27. This issue may be attributed to environmental uncertainties, such as variations in image quality, seasonal changes, or difficulties in distinguishing water from similar features under certain conditions.
In future studies, flood inundated areas mapping could incorporate additional remote sensing data sources or integrate machine learning algorithms to improve classification accuracy. Testing the framework under diverse geographical and climatic conditions will provide valuable insights into its universality and robustness. The capture of dynamic change information in this paper also represents an exploratory step towards flood management in small watersheds under urbanization development. Future research may concentrate on real-time data processing to expedite the response of disaster management and warning systems.
6 Conclusion
This paper takes Tongling, severely affected by the major flood disaster in Anhui Province in 2020, as the research area. This study constructs a framework for extracting flood inundation areas from optical image data in bands Green and NIR using a comprehensive water index method and threshold method. This study utilizes Sentinel-2 optical images obtained prior to the flood in Tongling, Anhui Province and Sentinel-1 radar images post-flood occurrence for water extraction. Finally, the flood inundation range and dynamic change information of Tongling, Anhui Province, are obtained. The conclusions are as follows:
(1) The framework has achieved accuracy in water body extraction, with rates exceeding 98% for optical images and over 89% for SAR. The high precision rates and Kappa coefficients are a testament to the classification method’s reliability in differentiating between water and non-water bodies.
(2) An accurate depiction of the affected area distribution in Tongling was achieved. From July 3 to September 13, the average affected area in Tongling was approximately 126 km2. The central region was the most impacted, followed by the northern region, whereas the eastern region incurred the least damage.
(3) The spatial distribution analysis revealed that the western part of Tongling was more severely affected by the floods than the eastern part, with the Yangtze River section serving as a dividing line. The higher-risk areas were predominantly concentrated in the central and northeastern parts of Tongling.
Data availability statement
The original contributions presented in the study are included in the article/supplementary material, further inquiries can be directed to the corresponding author.
Author contributions
QT: Conceptualization, Formal Analysis, Resources, Writing–review and editing. LL: Formal Analysis, Writing–original draft, Writing–review and editing. SL: Project administration, Writing–review and editing. LX: Writing–original draft, Writing–review and editing. KS: Validation, Writing–review and editing. SW: Software, Writing–review and editing. DW: Funding acquisition, Methodology, Writing–review and editing.
Funding
The author(s) declare that financial support was received for the research, authorship, and/or publication of this article. This work was supported by the key research and development plans in Yunnan Province for the “Green governance and development technical research and application demonstration in Chishui River Basin” (grant number 202203AC100001).
Conflict of interest
Author KS was employed by IEM Holding., Ltd.
The remaining authors declare that the research was conducted in the absence of any commercial or financial relationships that could be construed as a potential conflict of interest.
Publisher’s note
All claims expressed in this article are solely those of the authors and do not necessarily represent those of their affiliated organizations, or those of the publisher, the editors and the reviewers. Any product that may be evaluated in this article, or claim that may be made by its manufacturer, is not guaranteed or endorsed by the publisher.
References
Ahangari Nanehkaran, Y., Pusatli, Y., Chengyong, J., Chen, J., Cemiloglu, A., Azarafza, M., et al. (2022). Application of machine learning techniques for the estimation of the safety factor in slope stability analysis. Water 14 (22), 3743. doi:10.3390/w14223743
Cao, Y., and Liu, C. (2006). Application of EnviSat ASAR data in water monitoring. Geogr. Geogr. Inf. Sci. 2006 (02), 13–15. doi:10.3969/j.issn.1672-0504.2006.02.004
Cemiloglu, A., Zhu, L., Bakheet Mohammednour, A., Azarafza, M., and Yaser, A. N. (2023). Landslide susceptibility assessment for maragheh county, Iran, using the logistic regression algorithm. Land 12 (7), 1397. doi:10.3390/land12071397
Chen, C., He, X., Fu, J., and Chu, Y. (2019). Remote sensing information extraction of farmland flood inundation based on cap transformation. J. Wuhan Univ. Inf. Sci. Ed. 44 (10), 1560–1566. doi:10.13203/j.whugis20140460
Czajkowski, J., Engel, V., Martinez, C., Mirchi, A., Watkins, D., Sukop, M. C., et al. (2018). Economic impacts of urban flooding in South Florida: potential consequences of managing groundwater to prevent saltwater intrusion. Sci. Total Environ. 621, 465–478. doi:10.1016/j.scitotenv.2017.10.251
Li, D., Wu, B., Chen, B., Xue, Y., and Zhang, Y. (2020). Review of water body information extraction based on satellite remote sensing. J. Tsinghua Univ. Sci. Technol. 60 (2), 147–161. doi:10.16511/j.cnki.qhdxxb.2019.22.038
Liang, L. W., Chen, M., and Cheng, J. (2023). Enhance China’s urban flood resilience. Science 381, 1295. doi:10.1126/science.adk1100
Lv, S., Meng, L., Edwing, D., Xue, S., Geng, X., and Yan, X.-H. (2022). High-performance segmentation for flood mapping of HISEA-1 SAR remote sensing images. Remote Sens. 14, 5504. doi:10.3390/rs14215504
Mao, Y., Li, Y., Teng, F., Sabonchi, A. K. S., Azarafza, M., and Zhang, M. (2024). Utilizing hybrid machine learning and soft computing techniques for landslide susceptibility mapping in a drainage basin. Water 16 (3), 380. doi:10.3390/w16030380
Nanehkaran, A., Jin, C., Chen, J., Ahmed, C., Azarafza, M., Reza, D., et al. (2022). Application of machine learning techniques for the estimation of the safety factor in slope stability analysis. Water 14 (22), 3743. doi:10.3390/w14223743
Nanehkaran, Y. A., Chen, B., Ahmed, C., Chen, J., Anwar, S., Derakhshani, M. A. &R., et al. (2023a). Riverside landslide susceptibility overview: leveraging artificial neural networks and machine learning in accordance with the united nations (UN) sustainable development goals. Water 15 (15), 2707. doi:10.3390/w15152707
Nanehkaran, Y. A., Zhu, L., Chen, J., and Mohammad, A. &o Y. (2022). Application of artificial neural networks and geographic information system to provide hazard susceptibility maps for rockfall failures. Environ. Earth Sci. 81 (19), 475. doi:10.1007/s12665-022-10603-6
Nanehkaran, Y. A., Zhu, L., Jin, C., Chen, J., Anwar, S., Derakhshani, M. A. &R., et al. (2023b). Comparative analysis for slope stability by using machine learning methods. Appl. Sci. 13 (3), 1555. doi:10.3390/app13031555
Nguyen, T., Hoang, A., Pham, T., Tran, T., et al. (2023). Flash flood hazard mapping using landsat-8 imagery, ahp, and gis in the ngan sau and ngan pho river basins, north-central vietnam. Sustainability 16 (2), 57–67. doi:10.24057/2071-9388-2022-117
Nkwunonwo, U. C., Whitworth, M., Baily, B., et al. (2020). A review of the current status of flood modelling for urban flood risk management in the developing countries. Sci. Afr. 7, e00269. doi:10.1016/j.sciaf.2020.e00269
Pan, B., Jiao, R., Wang, J., Han, Y., and Hang, H. (2022). “SAR image registration based on KECA-SAR-SIFT operator,” in 2022 2nd International Conference on Computer Science, Electronic Information Engineering and Intelligent Control Technology (CEI), Nanjing, China, 23-25 Sept. 2022 (IEEE), 114–119. doi:10.1109/CEI57409.2022.9950203
Qi, W. (2015). A study of rainstorm circulation typing and potential forecasting in Tongling. Tongling Meteorol. Bur. Anhui Prov. China, 2015.
Qingsheng, M., Shanshan, X., Jinkun, Y., Yang, Y., Yulong, L., and Xuan, Y. (2022). Application of long short-term memory neural network in Xiamen storm surge forecast. J. Ocean Univ. China 52 (09), 10–19. doi:10.16441/j.cnki.hdxb.20210167
Qiu, H. *, Zhu, Y., Zhou, W., Sun, H., He, J., and Liu, Z. (2022). Influence of DEM resolution on landslide simulation performance based on the Scoops3D model. Geomatics, Nat. Hazards Risk 13 (1), 1663–1681. doi:10.1080/19475705.2022.2097451
Rahman, M. R., and Thakur, P. K. (2018). Detecting, mapping and analysing of flood water propagation using synthetic aperture radar (SAR) satellite data and GIS: a case study from the Kendrapara District of Orissa State of India. Egypt. J. Remote Sens. Space Sci. 21 (Suppl. 1), S37–S41. doi:10.1016/j.ejrs.2017.10.002
Song, L., and Xu, Z. (2019). Research progress on the coupled hydrodynamic model of urban torrential rain and waterlogging. J. Beijing Normal Univ. Nat. Sci. 55 (05), 581–587. doi:10.13203/j.whugis20140460
Sui, H., Chen, G., Hu, C., and Song, Z. (2016). Integration of optical remote sensing images and GIS data for water body segmentation, registration, and extraction method. J. Wuhan Univ. Inf. Sci. Ed. 41 (09), 1145–1150. doi:10.13203/j.whugis20140460
Tellman, B., Sullivan, J. A., Kuhn, C., Kettner, A. J., Doyle, C. S., Brakenridge, G. R., et al. (2021). Satellite imaging reveals increased proportion of population exposed to floods. Nature 596, 80–86. doi:10.1038/s41586-021-03695-w
Tiwari, V., Kumar, V., Matin, M. A., Thapa, A., Ellenburg, W. L., Gupta, N., et al. (2020). Flood inundation mapping-Kerala 2018; Harnessing the power of SAR, automatic threshold detection method, and Google Earth Engine. PLOS ONE 15 (8), e0237324. doi:10.1371/journal.pone.0237324
Wang, J., Tian, S., Feng, X., Zhang, B., Wu, F., and Wang, C. (2023). “Dual contrastive learning model for representation learning and background debiasing in SAR object classification,” in 2023 SAR in big data era (BIGSARDATA) (Beijing, China: IEEE), 1–4. doi:10.1109/BIGSARDATA59007.2023.10294715
Wang, J., Wang, S., Wang, F., Zhou, Y., Ji, J., Xiong, Y., et al. (2021). Research on flood extraction method based on Sentinel-1 SAR data. Disaster Stud. 36 (04), 214–220. doi:10.3969/j.issn.1000-811X.2021.04.035
Wang, J., Wang, S., Wang, F., Zhou, Y., Wang, Z., Ji, J., et al. (2022). FWENet: a deep convolutional neural network for flood water body extraction based on SAR images. Int. J. Digital Earth 15 (1), 345–361. doi:10.1080/17538947.2021.1995513
Wang, Z., Li, G., and Jiang, X. (2020). Flood area detection method based on fusion of optical and SAR remote sensing images. J. Radar 9 (03), 539–553. doi:10.12000/JR19095
Wei, Y., Qiu, H. *, Liu, Z., Huangfu, W., Zhu, Y., Liu, Y., et al. (2024). Refined and dynamic susceptibility assessment of landslides using InSAR and machine learning models. Geosci. Front. 15, 101890. doi:10.1016/j.gsf.2024.101890
Wu, J., Chen, F., and Chen, X. (2021). Research on the spatiotemporal evolution characteristics and correlations of global natural disasters from 1900 to 2018. Resour. Environ. Yangtze River Basin 30 (04), 976–991. doi:10.11870/cjlyzyyhj202104020
Xia, J., Zhang, Y., Xiong, L., Wang, L., and Yu, Z. (2017). Opportunities and challenges of the Sponge City construction related to urban water issues in China. Sci. China Earth Sci. 60, 652–658. doi:10.1007/s11430-016-0111-8
Ye, Y., Qin, Y., Yu, R., and Wu, Q. (2024). Optimization of Chinese land spatial pattern in the transformation process of resource-based cities: a case study in Tongling City, China. Sci. Rep. 14, 6092. doi:10.1038/s41598-024-53546-7
Zheng, F., Li, P., and Han, L. (2020). Research on urban water body extraction method based on high-resolution satellite imagery. J. Henan Univ. Nat. Sci. 50 (02), 213–220. doi:10.13203/j.whugis20140460
Zhu, Y., Qiu, H. *, Liu, Z., Ye, B., Tang, B., Li, Y., et al. (2024a). Rainfall and water level fluctuations dominated the landslide deformation at Baihetan Reservoir, China. J. Hydrology 642, 131871. doi:10.1016/j.jhydrol.2024.131871
Keywords: flood, inundation extraction, remote sensing images, tongling, sentinel-1 SAR images, sentinel-2 MSI images
Citation: Teng Q, Luo L, Li S, Xing L, Shao K, Wang S and Wang D (2024) A framework for flood inundation extraction based on microwave and optical remote sensing images. Front. Earth Sci. 12:1511834. doi: 10.3389/feart.2024.1511834
Received: 15 October 2024; Accepted: 07 November 2024;
Published: 02 December 2024.
Edited by:
Haijun Qiu, Northwest University, ChinaCopyright © 2024 Teng, Luo, Li, Xing, Shao, Wang and Wang. This is an open-access article distributed under the terms of the Creative Commons Attribution License (CC BY). The use, distribution or reproduction in other forums is permitted, provided the original author(s) and the copyright owner(s) are credited and that the original publication in this journal is cited, in accordance with accepted academic practice. No use, distribution or reproduction is permitted which does not comply with these terms.
*Correspondence: Dacheng Wang, d2FuZ2RjQGFpcmNhcy5hYy5jbg==
†These authors have contributed equally to this work and share first authorship
 Qizhi Teng1,2†
 Dacheng Wang
