- 1Nanjing Center, China Geological Survey, Nanjing, China
- 2Institute of Geomechanics, Chinese Academy of Geological Sciences, Beijing, China
- 3Observation and Research Station of Geological Disaster in Baoji, Ministry of Natural Resources, Baoji, Shaanxi Province, China
- 4Technology Innovation Center for In-situ Stress, Ministry of Natural Resources, Beijing, China
- 5Water Supply and Soil and Water Conservation Technology Department, Zaozhuang Urban and Rural Water Affairs Development Center, Zaozhuang, China
Introduction: This work employs a coupled evaluation model that integrates deterministic coefficients with the Analytic Hierarchy Process to conduct a comprehensive assessment of geological disaster susceptibility in Shenzhen Town, Ninghai County.
Methods: Cascading geological disasters induced by typhoons and rainfall in the southeast coastal area of China are a major concern and cause huge losses of life and property every year. To effectively prevent and mitigate such disasters, it is necessary to evaluate the susceptibility of geological disasters. Taking geological disasters in Shenzhen Town, Ninghai County as the research object, eight influencing factors in terms of topographic and geomorphological conditions, engineering geological conditions, and human activities were selected based on the geographic information platform (GIS) in this work. The coupling model of the certainty factor model and analytic hierarchy process method was used to evaluate the susceptibility of geological hazards in the study area.
Results: The evaluation results illustrate that the coupling model can accurately and objectively assess the susceptibility of geological hazards in this region, with a high evaluation accuracy of 80.8%. The susceptibility is greatly affected by slope, stratigraphic lithology, and human activities. The areas with extraordinarily high and high susceptibility were identified in the northwestern part of the study, where the ignimbrite is exposed in the steep topography.
Discussion: The research method provides a reference for evaluating the susceptibility of geological hazards in the southeastern coastal region of China, and the evaluation results can provide recommendations for decision-making on disaster prevention and mitigation in this region.
1 Introduction
The southeastern coastal areas of China are frequently struck by typhoons every year, and the ensuing torrential rainfall generally induces cascading geological hazards in this region (Li et al., 2021; Han et al., 2022; Chang et al., 2023). The storm brought by Typhoon Morakot in 2009 led to the average rainfall reaching 350 mm in the Ninghai mountain area of Ningbo City. Long-term continuous rainstorms caused more than 100 landslides in mountainous villages and towns in Ninghai County, such as Sangzhou, Huangtan, Shenzhen Town, and Chalu Town. In 2023, Typhoon Dusurei and Typhoon Kanu caused cascading landslides in Ninghai County, and cascading landslides resulted in severe traffic tie-ups.
Geological hazard susceptibility assessment is an essential part of disaster prevention and mitigation and land use, which refers to the evaluation of the likelihood of geological hazards in a particular area (Wang et al., 2020; Zhang et al., 2022; Huang et al., 2020; Huang et al., 2024a; Huang et al., 2024b). In recent years, a series of studies on evaluation methods of geological hazards have been conducted by many researchers, including the Analytic Hierarchy Process, the Information Value Method, the Fuzzy Comprehensive Evaluation Method, the Certain Factors Method, the Delphi Method, the Weight of Evidence Method, the Logistic Regression Model, the Support Vector Machine Method, the Coefficient of Variation Method, and the Contributing Weight Model (Sun et al., 2018; Zhao D. et al., 2021; Wen et al., 2022; Jia and Chen, 2024; Huang et al., 2024c). With the convenience of data acquisition, the improvement of computing power, and the increasingly sophisticated model evaluation algorithms, machine learning has become more widely applied in the evaluation of geological hazard susceptibility, such as the gradient boosting trees, the artificial neural networks, the decision trees, the random forests (Huang et al., 2024d; Shao et al., 2023; Wu et al., 2024; Devkota et al., 2013; Yang et al., 2024; Catani et al., 2013; Dou et al., 2019; Zhou et al., 2021; Wu et al., 2021; Chen et al., 2017). In practical applications, researchers often adopt a combination weighting method to improve the scientificity and accuracy of geological hazard evaluations due to the advantage of combining multiple evaluation methods and avoiding the limitation of the single evaluation method. A coupling method of the Information Value Model and Scoops 3D was applied to obtain accurate evaluation results on the susceptibility of geological hazards along the Guizhou-Chongqing pipeline (Yu et al., 2024). A detailed susceptibility assessment on a county scale was conducted, adopting the coupling model of the Analytic Hierarchy Process and the Coefficient of Determination Method (AHP-CF) (Zhao et al., 2021b). The geological hazard susceptibility in the Three Gorges Reservoir area was evaluated through the coupling model of weighted information value and iterative self-organization clustering (Chen et al., 2021). A coupling model of the Information Value Method and the Logistic Regression Model was employed to evaluate the geological hazard susceptibility in the Manas River Basin of Xinjiang and Wu Yuan County in Jiangxi Province (Bi et al., 2022; Huang et al., 2023). These combination weighting methods significantly improve the credibility and accuracy of the evaluation results. However, there are few relevant studies on geological hazards around the southeastern coastal areas of China. It is necessary to evaluate the vulnerability of rainfall-induced geological hazards based on the coupling model. In this study, the coupling model of the Analytic Hierarchy Process (AHP) and the Certain Factors Method (CF) was adopted to evaluate the susceptibility of geological hazards in the Shenzhen Town of Ninghai county, applying the GIS spatial analysis platform and SPSS software. In this process, factors, including geological and environmental conditions, formation mechanisms of geological hazards, and human activities, were comprehensively considered (Sun et al., 2024). The results of this work can provide technical support for land-use planning, social development strategies, geological disaster prevention, and early warning systems in the region. Furthermore, they offer theoretical guidance and technical references (An et al., 2024) for evaluating geological disaster susceptibility in other township-level areas along the southeastern coast.
2 Overview of study area
Ningbo City is located northeast of Zhejiang Province, adjacent to the East China Sea. Geomorphologically, it belongs to the low mountain and hilly area, with a higher elevation in the southwest and a lower elevation in the northeast (Figure 1). The exposed strata comprise the Cretaceous volcanic sedimentary rock series, with sparsely exposed Lower Jurassic volcanic rocks and Upper Neogene basalt. Shenzhen Town belongs to the subtropical monsoon climate, which features abundant rainfall and sunshine. The average annual precipitation is generally 1,600–1800 mm, with rainfall mainly concentrated during the plum rain period from May to June and the typhoon period from August to October. The precipitation from May to October accounts for about 70% of annual rainfall. Rivers and streams are densely distributed (Figure 1).
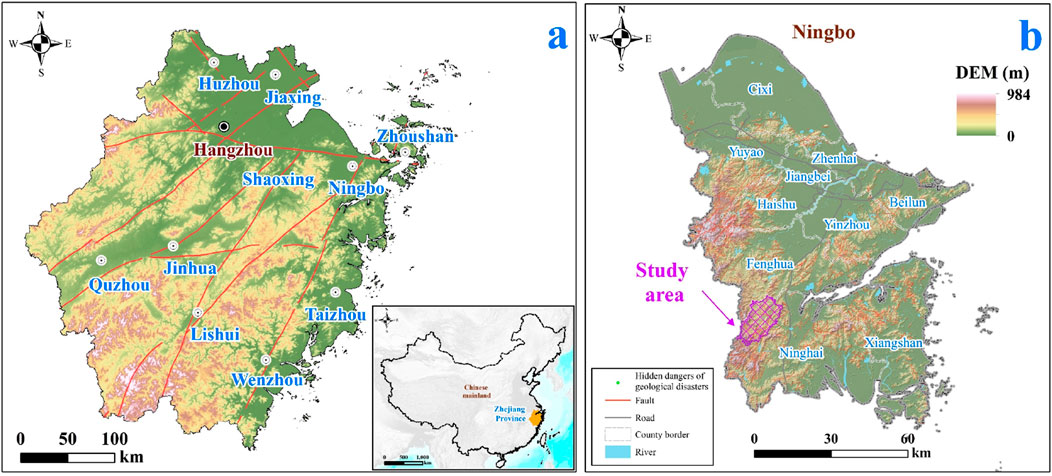
Figure 1. Location of the study area. (A) Location map of Zhejiang Province; (B) Location of the study area.
Controlled by topographic, geological, hydrological and climatic factors, geological hazards in Ningbo City are generally characterized by small scale, cascading occurrence and uneven spatial distribution. They are classified as channelized and hillslope landslides (Schneider et al., 2008) (Figures 2A, B). The composition of sliding mass is relatively simple in general, and silty clay or silty clay with gravel is commonly observed in the sliding area. The sliding mass in the volcanic rock is mainly composed of fully weathered layers. The thickness of the landslide mass generally ranges from 1 to 5 m, and the volume is mostly below several thousand cubic meters, with small ones only tens of cubic meters (Figures 2C, D) (Han et al., 2023).
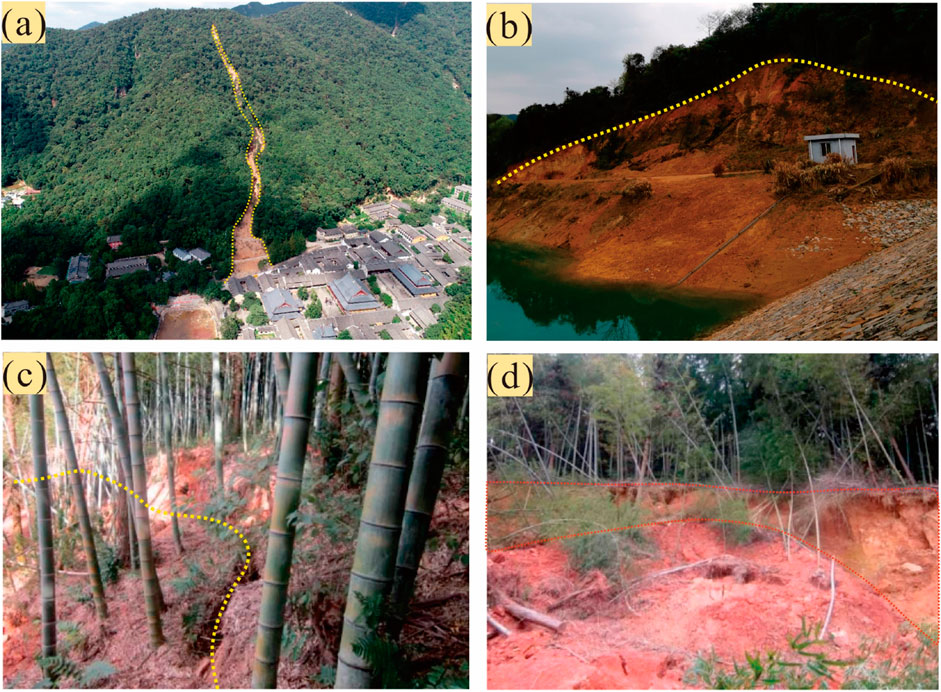
Figure 2. Characteristics of typical geological hazards in Ningbo. (A) Channelized landslide; (B) Hillslope landslide; (C) Exposed scarp due to mass movement; (D) Shallow sliding mass.
Spatially, geological hazards in the study area often occur in the low mountain and hilly areas in the western and southern regions. Yuyao City and Fenghua District register the largest number of geological disasters, with 158 and 112, respectively. Followed by Yinzhou District, Ninghai County, and Xiangshan County, the number of l geological hazards is 97, 70, and 66, respectively. The number of geological hazards in Cixi City and Beilun District was 54 and 51, respectively. Geological hazards in Haishu District and Jiangbei District are relatively underdeveloped, with 25 and 10 geological hazards, respectively. Chronologically, due to the rapid economic development and the increase in human engineering activities, the impact of artificial destruction of the geological environment on the development of geological disasters has become increasingly serious. The number of geological hazards has shown an increasing trend from 2006 to 2013, although the phenomenon of anomalous peaks in interannual variability occurred (mainly in 2005, 2012, 2013, and 2019). Affected by the rainstorms resulting from Typhoon “Fitter” in 2013 and Typhoon “Lekima” in 2019, cascading geological disasters have been triggered by rainstorms in this region (Figure 3A). In terms of the distribution of geologic hazards during the year, geological hazards in this area mainly occur during the flood season from June to September, with a strong correlation with the cumulative average monthly precipitation distribution. Among them, the geologic hazards in October and December are mainly due to the impact of a single extreme weather event (Figure 3B).
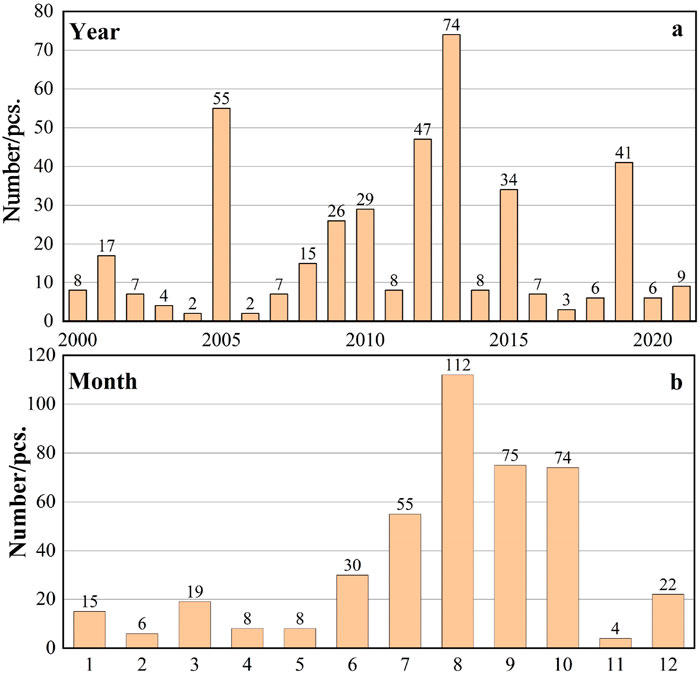
Figure 3. Statistical map of inter-annual and monthly distribution of historical geological hazards in Ningbo City (A) Yearly distribution charts; (B) Monthly distribution charts.
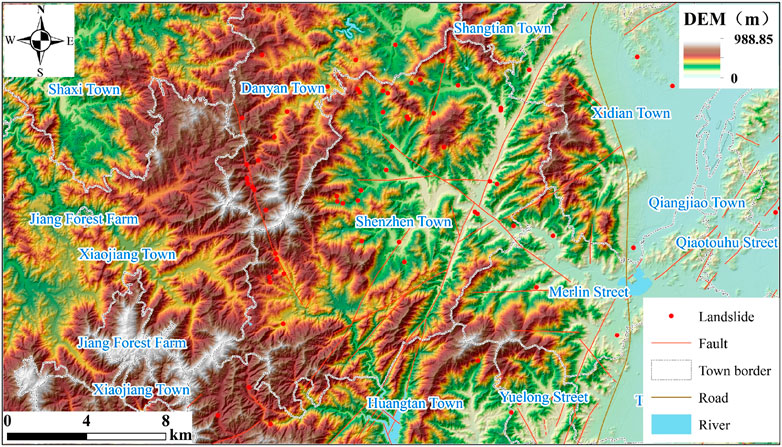
This study centers on Shenzhen Town, a region notable for its high incidence of geological hazards, to conduct an in-depth susceptibility assessment of geological hazards at the town level. Given its unique geological features and the frequent occurrence of geological disasters, Shenzhen Town serves as an essential site for this research. In our assessment, we will consider a comprehensive range of factors, including topography, climate, geological characteristics, vegetation cover, and soil types. This multifaceted approach will enable us to systematically evaluate the various geological hazards present in the area, ensuring a thorough understanding of the underlying risk factors. The distribution of geological hazards within the study area is depicted in Figure 4. This figure clearly delineates the occurrence of different types of geological hazards and illustrates their relationships with the surrounding environment. By visualizing these spatial patterns, we aim to provide valuable insights into the factors influencing geological hazard susceptibility in Shenzhen Town, ultimately contributing to more effective disaster prevention and mitigation strategies.
3 Evaluation method of geological hazard susceptibility
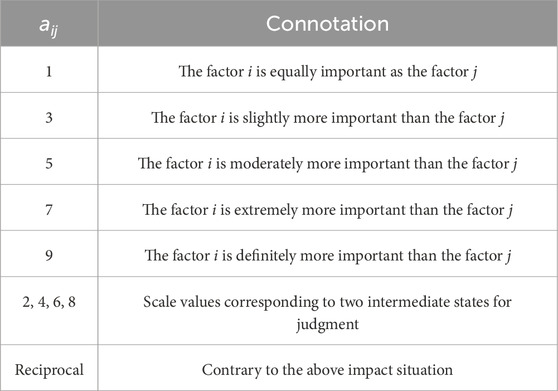
Based on field geological surveys and the application of the GIS platform, the coupling model of certain factors (CF) and analytic hierarchy process (AHP) was applied to evaluate the susceptibility of geological hazards in Shenzhen Town, Ninghai County. By reflecting the degree of contribution of different element sections in the hazard factors, the certain factors model can solve the sensitivity problem of different characteristic values within the evaluation factors on susceptibility. However, it cannot determine the relative weight among the impact factors (Equation 1). The Analytic Hierarchy Process (AHP) has advantages in calculating the relative weight among impact indicators. According to the hierarchical relationship, the target layer A is constrained by the constraint factor layer B, and each constraint factor layer Bi is constrained by several secondary factor layers Ci. The factors in each layer are compared pairwise based on the pre-set scale of 1–9 (Table 1). According to the prescribed scale quantification, a judgment matrix is constructed to calculate the weights of each factor. The comprehensive weight is determined according to the principle of maximum weight to determine the optimal solution. However, this model cannot effectively solve the sensitivity problem of different characteristic values of evaluation factors on susceptibility. Therefore, it can simultaneously compensate for both models’ shortcomings in replacing the artificial spatial information quantification process in the Analytic Hierarchy Process with the probability quantification values obtained from the specific factor model.
In Equation 1, PPa is the conditional probability of geological hazards occurring in impact factor classification a, which is defined as the ratio of the number of geological hazard points developed in impact factor classification a to the area of the impact area of impact factor classification a. PPS the prior probability of geological hazard events occurring, which is the ratio of the total number of geological hazard points in the study area to the total area of the study area. The value range of CF belongs to [-1, 1], and the positive value or negative value represents the high certainty or low certainty of geological hazard occurrence in the study area.
The certain factors (CF) model captures the contribution of different factor intervals to hazard formation, addressing the sensitivity of feature values within individual evaluation factors to susceptibility. However, it cannot determine the relative weights between factors. In contrast, the Analytic Hierarchy Process (AHP) excels at calculating relative weights, particularly in areas with limited samples, but it struggles to account for the influence of varying feature values within factors on susceptibility. By replacing the subjective quantification of spatial information in AHP with the probability values generated by the CF model, the shortcomings of both methods are mitigated. This approach resolves challenges related to determining factor weights and merging heterogeneous data, resulting in more accurate and reliable susceptibility assessments. The study considers the interactions between factors, constructs a judgment matrix, and calculates their weights, integrating them seamlessly. The coupling of the AHP and CF models will greatly enhance the precision of geological disaster susceptibility evaluations in the study area.
3.1 Slope unit division
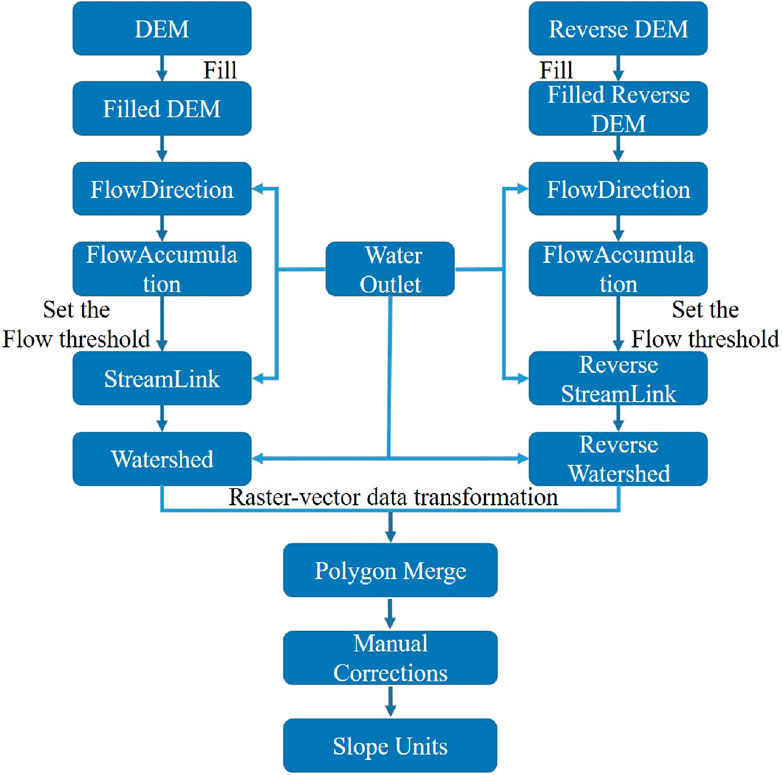
Slope is the primary terrain and landform unit for landslide occurrence. Compared with traditional grid units, slope units can comprehensively reflect the influence of terrain conditions such as slope, aspect, and elevation difference, improving consistency with actual terrain and landform. The slope structure is the same as hydrogeological conditions, of which the evaluation factors can reflect essential characteristics. Slope units can reflect terrain relief, geological environmental conditions, and the actual development status of landslides. The evaluation results are more reasonable and accurate than grid units due to containing a larger number of geological hazard points in a smaller area (Liu et al., 2018; Liu et al., 2023; Tian et al., 2019). The evaluation index system has a significant difference between gully-type debris flow and slope-type debris flow. The study area was dominated by slope-type debris flow. Considering the development mechanism of typhoon storm-type geological hazards in the study area, the slope unit was selected to evaluate the susceptibility of collapse, landslide, and slope-type debris flow in Shenzhen Town. Slope unit division was completed based on the numerical elevation model (DEM) using the hydrological analysis module in ArcGIS software (Figure 5). Ridge and valley lines were extracted from depression-free positive and negative terrain. The resulting catchment and inverse catchment basins were merged, with any unreasonable units manually adjusted using Digital Orthophoto Map (DOM) data. This process produced slope units defined by drainage and watershed lines. Ultimately, the study area was divided into 2,577 slope units, with the smallest area being 0.01 km2, the largest being 0.56 km2, and the average being 0.068 km2. In the subsequent susceptibility assessment, we employed the “To Raster” tool in ArcGIS to convert the defined slope units into raster data. For each slope unit, the raster values were derived by calculating the average of all raster cells contained within that unit. This method ensures that the characteristics of each slope unit are accurately represented in the resulting raster dataset.
3.2 Selection and classification of evaluation factors
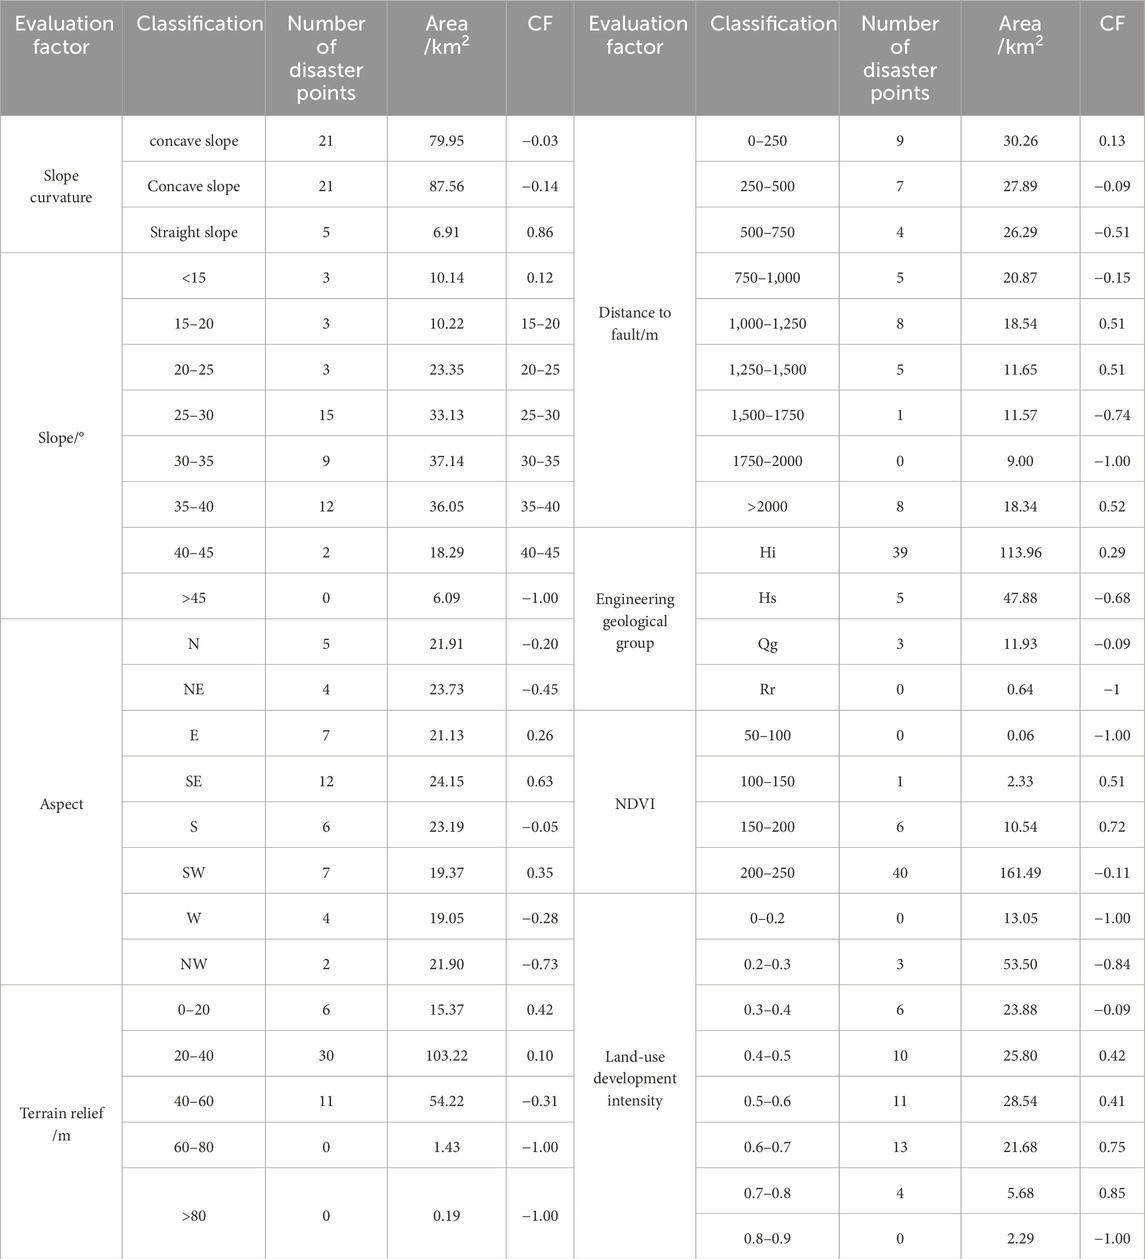
According to the background and conditions of geological hazards in the southeastern coastal areas, eight evaluation factors, including slope curvature, slope, aspect, terrain relief, distance to fault, engineering geological groups, normalized difference vegetation index, and land-use development intensity, were selected to conduct a susceptibility evaluation of geological hazards in Shenzhen Town. The quantitative value of the indicator is determined according to the contribution of the graded indicators of each evaluation factor to the vulnerability to geologic hazards (Table 2). The relationship between landslide distribution and different factors is shown in Figure 6, and the grading chart for each evaluation factor is shown in Figure 7.
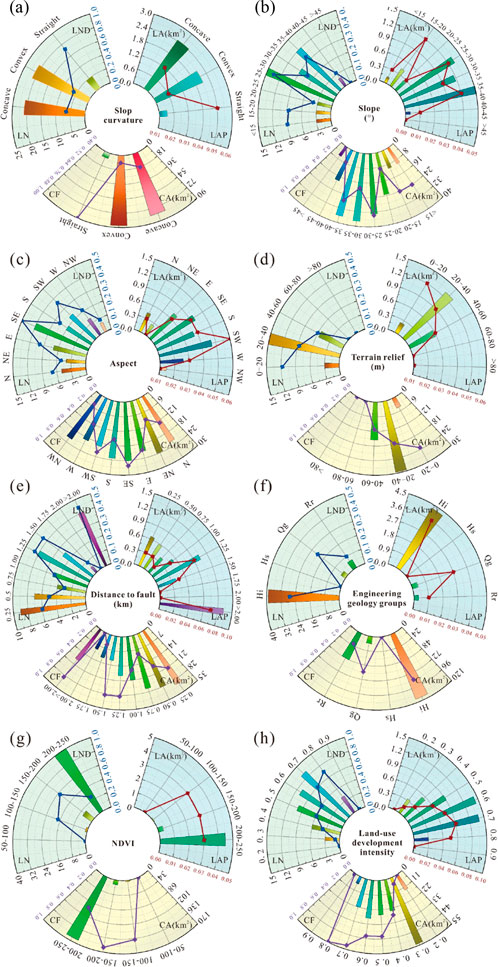
Figure 6. The relationship between landslide distribution and different factors. LN is landslide number, LND is landslide number density, LA is landslide area, LAP is land-slide area percentage, CA is classification area and CF is certainty coefficient. (A) Slope curvature; (B) Slope; (C) Aspect; (D) Terrain relief; (E) Distance to fault; (F) Engineering geological groups; (G) NDVI; (H) Land-use development intensity.
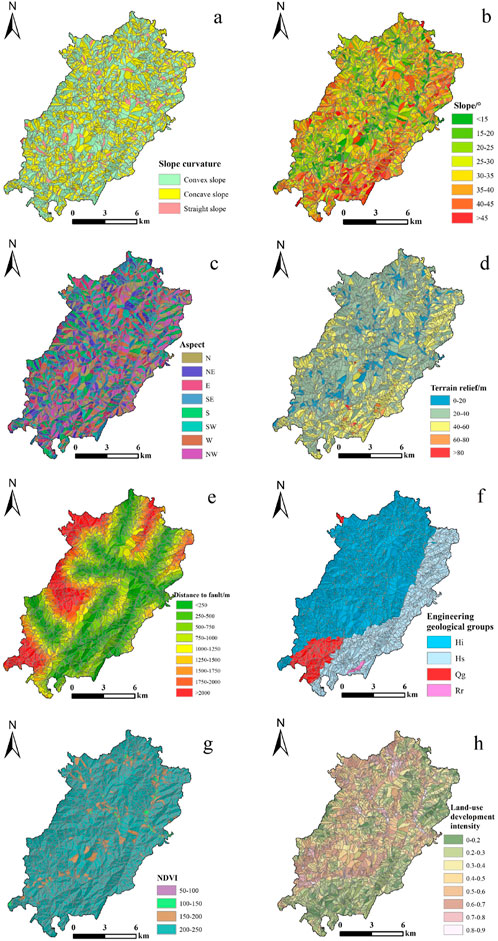
Figure 7. Evaluation factor Classification of geological disasters (A) Classification of slope curvature; (B) Classification of slope; (C) Classification of aspects; (D) Classification of terrain relief; (E) Classification of distance to fault; (F) Classification of engineering geological groups; (G) Classification of NDVI; (H) Classification of land-use development intensity.
3.2.1 Slope curvature
The slope curvature plays a crucial role in influencing surface water convergence, infiltration, groundwater movement, and the gravitational distribution within the slope’s rock and soil layers. This makes slope morphology a key indicator in assessing susceptibility to geological hazards. Concave slopes tend to collect rainwater, promoting significant deep infiltration, which can weaken the strength of the underlying rock and soil. This process increases the risk of landslides and mudflows. Conversely, convex slopes usually have a gentler gradient at the rear, facilitating greater water infiltration, while the steep front section provides limited resistance to sliding. This combination elevates the likelihood of collapses and landslides. Linear slopes allow rainwater to predominantly drain as surface runoff. Under moderate gradients, these slopes tend to maintain relative stability, as the runoff reduces water retention and infiltration, thereby decreasing the risk of geological hazards.
The DEM was processed through the GIS platform to extract surface curvature and obtain slope curvature value. The slope curvature was reflected by the curvature value of the slope, where −0.1<curvature<0.1 was a straight slope; Curvature<−0.1 was a concave slope; If the curvature was greater than 0.1, it was a convex slope. The con-vex slope had the largest area in the research area, followed by the concave slope, and the straight slope had the smallest area. Their areas were 87.56 km2, 79.95 km2, and 6.91 km2, respectively. Convex slopes had the highest CF value and were more prone to geological disasters (Figure 6A). The distribution of slope curvature is shown in Figure 7A.
3.2.2 Slope
The slope (gradient) plays a critical role in determining the types and mechanisms of slope failure. It primarily influences the occurrence of geological hazards by affecting internal seepage and stress distribution within the slope. Statistical data indicate that landslides predominantly occur on slopes with gradients between 20° and 45°. In contrast, slopes steeper than 45° are more prone to collapses rather than landslides, while slopes with gradients less than 20° seldom experience landslides. A 10 m × 10 m grid was generated from the DEM, and the average slope within the slope unit was taken as the slope value. To reduce subjective influence, the slope was divided into eight levels: <15°, 15°–20°, 20°–25°, 25°–30°, 30°–35°, 35°–40°, 40°–45°, and >45°. According to statistical analysis and certain factor methods, the slope range was mainly concentrated in steep slopes of 30°–40°, accounting for 41.96% of the total area. The CF values were relatively high in the slope ranges of 30°–35° and 35°–40° (Figure 6B). The distribution of slope is shown in Figure 7B.
3.2.3 Aspect
The slope aspect leads to differences in weathering degree, affecting the thickness and distribution of weathered layers and significantly impacting slope stability. During the typhoon season, the southeastern coastal regions are primarily affected by winds from the east and southeast, which have a considerable impact on the windward slopes. A grid layer was generated by dividing the slope direction into eight directions: N (337.5°–22.5°), NE (22.5°–67.5°), E (67.5°–1,125°), SE (112.5°–157.5°), S (157.5°–202.5°), SW (202.5°–247.5°), W (247.5°–292.5°), and NW (292.5°–337.5°). According to statistical data analysis, the distribution of aspects in the region was relatively uniform, and geological hazards mainly developed in four aspects: E, SE, S, and SW, accounting for 68.09%. This was related to the geographical location along the coast of the area, which was the direction of typhoon landfall and was more conducive to geological disasters, resulting in the CF value being higher than other intervals (Figure 6C). The distribution of aspects is shown in Figure 7C.
3.2.4 Terrain relief
The terrain relief is the difference between the extreme elevation values of slope units, which determines the intensity and impact range of geological hazards (Wu et al., 2022). In areas of significant topographic relief, the presence of numerous cutting surfaces enhances the likelihood of landslides. These local terrain features create optimal conditions for the acceleration and deceleration of landslide events, exerting a considerable influence on their dynamics. Consequently, in regions characterized by substantial elevation changes, both the distance traveled and the speed of landslide movement can be significantly affected. To reduce the influence of subjective factors, the elevation difference was divided into five levels of equal spacing: 0–20 m, 20–40 m, 40–60 m, 60–80 m, and >80 m. The maximum CF value was 0.42 between 0 and 20 m; Next is 20–40 m, with a CF value of 0.10 (Figure 6D). The distribution of terrain relief is shown in Figure 7D.
3.2.5 Distance to fault
Fault structures are closely related to the development of geological hazards. Rock masses within fault zones become highly fragmented due to tectonic activity, establishing essential conditions that facilitate the occurrence of landslides. This fragmentation is particularly pronounced in active fault zones, where frequent historical tectonic movements have weakened the rock, significantly reducing its mechanical strength. Consequently, regions along active fault zones are especially susceptible to geological disasters. The shortest distance between the slope unit and the fault was used as the evaluation index, and the equidistant intervals were divided into nine levels: 0–250 m, 250–500 m, 500–750 m, 750–1,000 m, 1,000–1,250 m, 1,250–1,500 m, 1,500–1,750 m, 1,750–2,000 m, and>2,000 m. Most slopes were less than 1,000 m away from the fault, and geological hazards were most developed within a range of 25 m from the fault (Figure 6E). The distribution of distance to fault is shown in Figure 7E.
3.2.6 Engineering geology groups
Engineering geological groups are the carriers of geological hazard development, determining the intensity of geological hazard development (Lara and Sepúlveda, 2010). Loose accumulation layers and highly weathered strata possess a loose structure, limited resistance to weathering, and reduced mechanical strength. When influenced by water, their properties can undergo significant changes, rendering them particularly vulnerable to landslides. There were four engineering geological groups developed in the area, namely the rock formation dominated by hard blocky fused tuff (Hi), the rock formation dominated by relatively hard blocky-layered tuffaceous sedimentary clastic rocks (Hs), the acidic rock formation dominated by hard blocky granite (Qg), and the acidic rock formation dominated by hard blocky rhyolite (Rr). The slope unit rock groups mainly comprised Hi and Hs, accounting for 65.34% and 27.45% of the total area; 23 and 24 disaster points existed, respectively. The CF value showed that Qg was most prone to geological disasters, with a CF value of 0.343. Next was Hif, with a CF value of 0.23 (Figure 6F). The distribution of engineering geology groups is shown in Figure 7F.
3.2.7 Normalized difference vegetation index (NDVI)
The Vegetation plays a vital role in the development of geological hazards. When a typhoon rainstorm occurs in the southeast coastal area, the wind acts on the slope through shrubs such as bamboo and provides sliding force for the hill through “lever-age”, thus increasing the frequency of geological disasters (Sun et al., 2022). In the study area, regions lacking vegetation cover are predominantly composed of hard rock formations, which significantly reduces their susceptibility to geological hazards. According to the NDVI value in the research area, the value was divided into four intervals of 50–100, 100–150, 150–200, and 200–250. The NDVI was mainly between 200 and 250, with the most geological hazards (Figure 6G). The distribution of NDVI is shown in Figure 7G.
3.2.8 Land-use development intensity
Geological hazards are closely related to irrational human engineering activities. Human activities, such as slope cutting and road construction, often create steep, exposed surfaces that significantly enhance the risk of landslides. Construction on slopes adds weight to the slope mass, increasing downslope forces and further elevating the potential for geological hazards. Additionally, agricultural irrigation promotes water infiltration into the soil, weakening the slope’s internal structure and amplifying its instability, thereby increasing the likelihood of slope failure. According to the current land application situation in Shenzhen Town, Ninghai County, the land application was divided into eight categories: construction land, paddy fields, dry land, grassland, garden land, bamboo forest land, shrub forest land, and tree forest land. Based on the intensity of human engineering activities, each land-use type was assigned a corresponding development intensity index (Table 3). Among them, the development intensity index with a larger CF value was 0.7–0.8 and 0.6–0.7, which were 0.85 and 0.75, respectively (Figure 6H). The distribution of land-use development intensity is shown in Figure 7H.
4 Susceptibility analysis of geological hazard
4.1 Evaluation result
A hierarchical structure was constructed based on the AHP principles and impact fac-tors of geological hazard (Figure 8).
To ensure the efficiency and accuracy of model construction, it is essential to conduct a correlation analysis of the eight factors. The Spearman’s correlation analysis was used to assign weights to evaluation factors. This method ranks two variable data and solves the correlation coefficient using rank difference. The larger the absolute value, the greater the correlation. The calculation formula is as follows (Equation 2):
In this equation, ρ is the Spearman rank correlation coefficient, di is the rank difference of the sorted variables, and n is the number of samples.
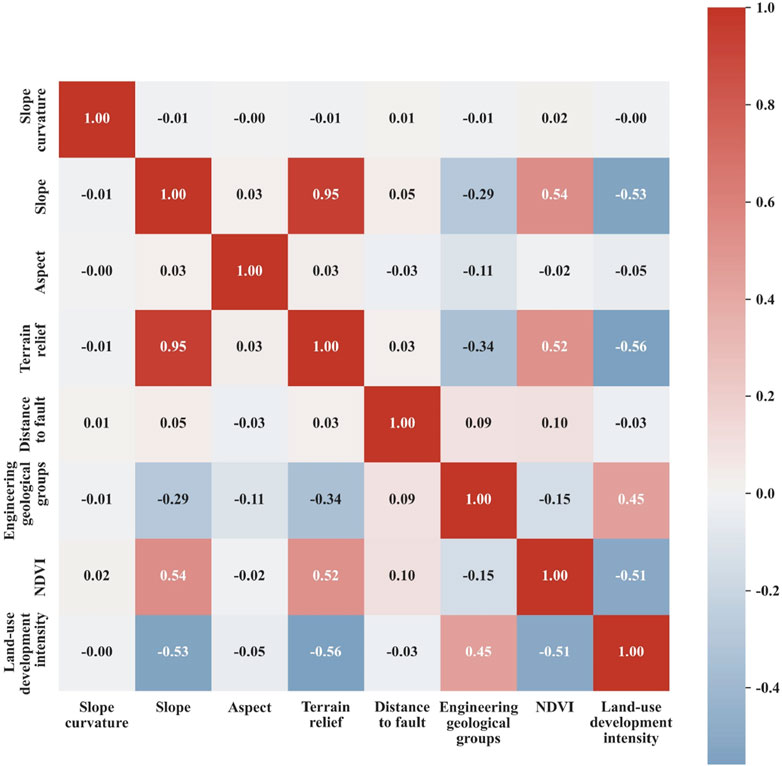
The Spearman correlation results of eight evaluation factors (Figure 9) indicate that the correlation between slope gradient and terrain undulation is 0.95, indicating a strong positive correlation between these two factors. The correlation between terrain undulation and human activity intensity is −0.56, indicating a strong negative correlation between the two factors. The correlation between the slope gradient and normalized vegetation index was 0.54, indicating a strong positive correlation between the two factors.
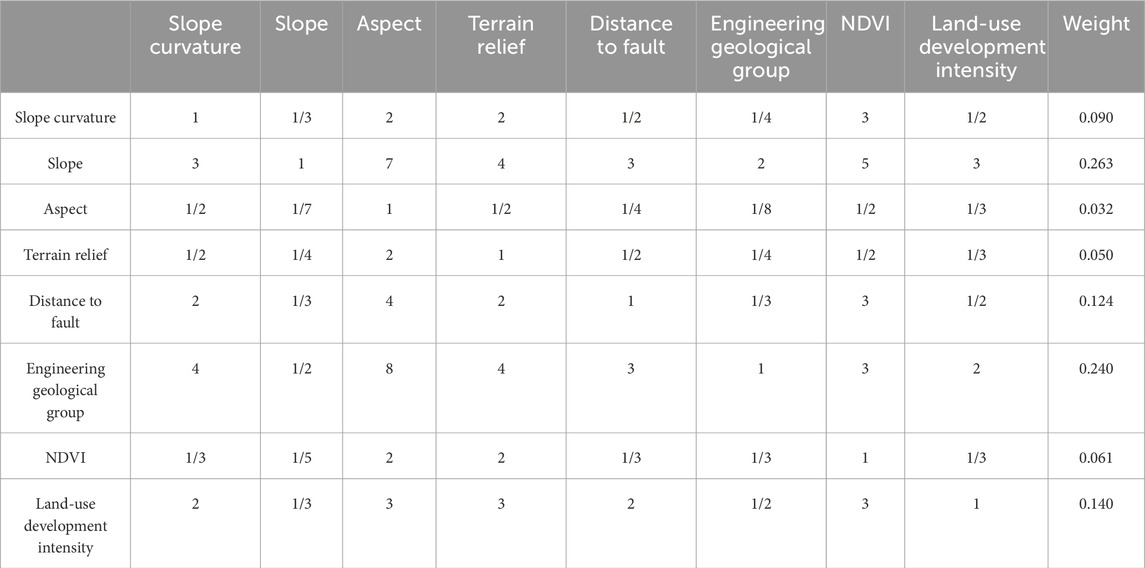
Based on the correlation analysis of eight evaluation factors, a judgment matrix was established to solve the weights of each factor (Table 4) and organically combine each factor to evaluate its susceptibility. The mathematical model for comprehensive evaluation based on the AHP-CF model is (Equation 3):
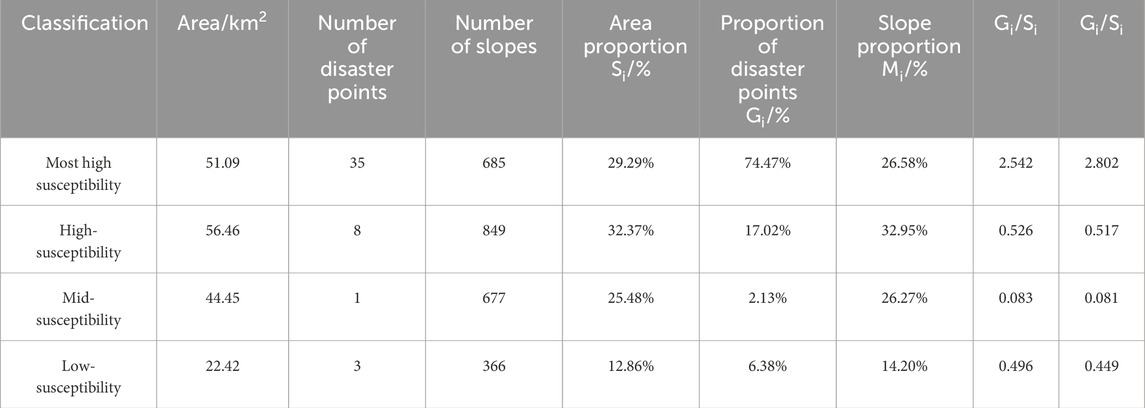
According to the comprehensive evaluation model, the CF values of 8 layers were superimposed to obtain the total CF value of each slope unit, namely the slope geological hazard susceptibility index. The natural interruption method was used to divide the susceptibility of slope geological hazards into four levels: the most-high susceptibility zone, high susceptibility zone, medium susceptibility zone, and low susceptibility zone (Figure 10). The highly susceptible area covers an area of 51.09 km2, mainly distributed in the northwest of Shenzhen Town, including Chiao Village, Zhekengzhang Village, Zhekengdai Village, Lingxu Village, accounting for 29.29% of the total area. There are 35 geological hazard points, accounting for 74.47% of the total quantity. The high-risk area covers an area of 56.46 km2, mainly distributed in villages such as Dacai Village, Qingtan Village, and Konghengshan Village, accounting for 32.37% of the total area. Eight geological hazard points account for 17.02% of the total quantity. The mid-susceptibility area covers an area of 44.45 km2, mainly distributed on the west and south sides of Shenzhen Village, the north side of Nanxi Village, and the southeast side of Changyang Village, accounting for 25.48% of the total area. One geological hazard point accounts for 2.13% of the total quantity. The low-risk area covers an area of 22.42 km2, mainly distributed on the northeast side of Shenzhen Village, the south side of Longgong Village, Nanxi Forest Farm, and other areas, accounting for 12.86% of the total area. Three geological hazard points have been identified, accounting for 6.38% of the total quantity.
4.2 Verification of geological hazard vulnerability assessment results
The evaluation results were inspected from two aspects: rationality and accuracy. The rationality of evaluation results was verified by the distribution of geological hazard points in various prone areas, and the receiver operating characteristic curve (ROC) was used to verify the accuracy of evaluation results.
According to the inspection results of the geological hazard-prone zones in Shenzhen Town (Table 5), the disaster points in the highest susceptibility areas have the highest proportion; the percentage of disaster points in each level of the prone regions (Gi) and the percentage of the area of each prone areas to the total area of the study area (Si) decreased with the decrease of susceptibility levels. The ratio of slopes in each susceptibility level to the total quantity of slopes in the study area (Mi) decreases with the decrease in susceptibility levels. Applying the coupling model to Shenzhen’s geological hazard-prone zoning results is reasonable.
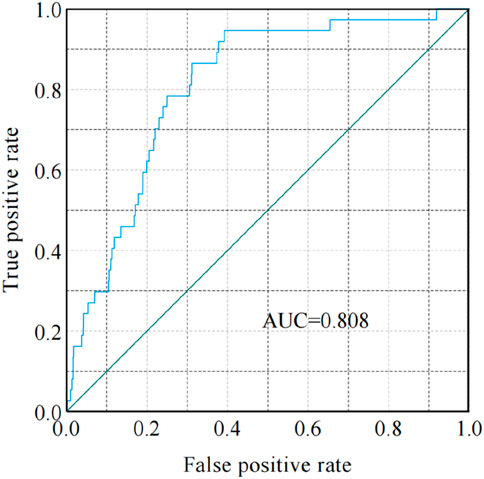
In the accuracy verification of geological hazard susceptibility evaluation, the receiver operating characteristic curve (ROC) verification method was mainly used (Yang et al., 2024). The ROC curve is a graphical method for evaluating the effectiveness of classification, where the horizontal axis represents the false positive rate (also known as 1-specificity), and the vertical axis represents the true positive rate (also known as sensitivity). The area under the curve (AUC) is often used to evaluate the accuracy of the model, and the larger the AUC value, the higher the accuracy of the model. The evaluation index was normalized and imported into SPSS 27 software to draw the ROC curve (Figure 11), where the vertical axis sensitivity was the proportion of correctly predicted units with geological hazards, and the horizontal axis specificity was the proportion of correctly predicted units without geological hazards. The AUC value calculated using SPSS software was 0.808, indicating that the CF and AHP coupling model can accurately and objectively evaluate the susceptibility of geological hazards in Shenzhen Town, Ninghai County.
5 Conclusion
(1) Comprehensively considering the formation mechanism of typhoon-rainfall-induced geological disasters, based on the CF value of 8 impacted factors, including slope curvature, slope, aspect, terrain relief, distance to fault, engineering geological groups, NDVI, and land-use development intensity, the slope, engineering geological groups, and land-use development intensity had a greater impact on the susceptibility of geological hazards in the study area. Under the effect of rainfall, geo-logical hazards were more likely to occur in the melting tuff area with larger slopes and frequent human activities.
(2) The evaluation results indicated that most high-susceptibility zones and high-susceptibility zones in Shenzhen were distributed in a northeast-southwest direction, and are significantly affected by the lithology and slope of the strata. They were mainly distributed in the northwest of the study area, including Chi’ao Village, Zhek-eng Zhang Village, Zhekeng Dai Village, and Lingxu Village, accounting for 61.7% of the total area; The low- susceptibility zones were mainly distributed in the middle and low mountain areas in the northeast and south, accounting for 12.9% of the total area. The evaluation results indicated that most high-susceptibility zones and high-susceptibility zones in Shenzhen were distributed in a northeast-southwest direction and are significantly affected by the lithology and slope of the strata. They were mainly distributed northwest of the study area, including Chiao Village, Zhekengzhang Village, Zhekengdai Village, Lingxu Village, accounting for 61.7% of the total area. The low-susceptibility zones were mainly distributed in the middle and low mountain areas in the northeast and south, accounting for 12.9% of the total area.
(3) The CF model can solve the sensitivity of different characteristic values to susceptibility in evaluating factors. The AHP model can combine expert experience to determine the weight of influencing factors. It can effectively solve the problem of determining the weight of geological hazard influencing factors by combining the deterministic coefficient model with the analytic hierarchy process model. The results of rationality and accuracy tests showed that the evaluation results of the coupling model were consistent with the actual occurrence of geological hazards, with a model accuracy of 80.8%, and can accurately, objectively, and reasonably evaluate the susceptibility of geological hazards in the study area.
Data availability statement
The raw data supporting the conclusions of this article will be made available by the authors, without undue reservation.
Author contributions
SaH: Methodology, Writing–original draft. RL: Data curation, Writing–original draft. SjH: Methodology, Writing–review and editing. QS: Methodology, Writing–review and editing. TZ: Data curation, Software, Writing–review and editing.
Funding
The author(s) declare that financial support was received for the research, authorship, and/or publication of this article. This work was financially supported by the China Geological Survey (DD20221742) and the National Natural Science Foundation of China (42207234).
Acknowledgments
The authors are grateful for the endeavor devoted by the editor and reviewers, and their useful comments and advice are highly appreciated.
Conflict of interest
The authors declare that the research was conducted in the absence of any commercial or financial relationships that could be construed as a potential conflict of interest.
Publisher’s note
All claims expressed in this article are solely those of the authors and do not necessarily represent those of their affiliated organizations, or those of the publisher, the editors and the reviewers. Any product that may be evaluated in this article, or claim that may be made by its manufacturer, is not guaranteed or endorsed by the publisher.
References
An, P., Yong, R., Wang, C., Jia, S., and Fang, K. (2024). Utilizing crowdsourced data for timely investigation of catastrophic landslide accidents: a case study of the coal mine collapse in inner Mongolia, China. Bull. Eng. Geol. Environ. 83 (9), 354. doi:10.1007/s10064-024-03848-x
Bi, J., Xu, P., Song, S., and Ding, R. (2022). Assessment of the susceptibility to geological hazards in the Manas River Basin based on the coupling information value-logistic regression model. J. Eng. Geol. 30 (5), 1549–1560. doi:10.13544/j.cnki.jeg.2022-0327
Catani, F., Lagomarsino, D., Segoni, S., and Tofani, V. (2013). Landslide susceptibility estimation by random forests technique: sensitivity and scaling issues. Nat. Hazard 13, 2815–2831. doi:10.5194/nhess-13-2815-2013
Chang, Z., Huang, F., Huang, J., Jiang, S. H., Liu, Y., Meena, S. R., et al. (2023). An updating of landslide susceptibility prediction from the perspective of space and time. Geosci. Front. 14 (5), 101619. doi:10.1016/j.gsf.2023.101619
Chen, W., Xie, X., Wang, J., Pradhan, B., Hong, H., Bui, D., et al. (2017). A comparative study of logistic model tree, random forest, and classification and regression tree models for spatial prediction of landslide susceptibility. Catena 151, 147–160. doi:10.1016/j.catena.2016.11.032
Chen, X., Ni, H., Li, M., Tian, K., Song, Z., and Gao, Y. (2021). Geo-hazard susceptibility evaluation based on weighted information value model and ISODATA cluster. J. Catastrophology 36 (02), 71–78. doi:10.3969/j.issn.1000-811X.2021.02.013
Devkota, K. C., Regmi, A. D., Pourghasemi, H. R., Yoshida, K., Pradhan, B., Ryu, I. C., et al. (2013). Landslide susceptibility mapping using certainty factor, index of entropy and logistic regression models in GIS and their comparison at Mugling-Narayanghat road section in Nepal Himalaya. Nat. Hazards. 65, 135–165. doi:10.1007/s11069-012-0347-6
Dou, J., Yunus, A. P., Bui, D. T., Merghadi, A., Sahana, M., Zhu, Z., et al. (2019). Assessment of advanced random forest and decision tree algorithms for modeling rainfall-induced landslide susceptibility in the Izu-Oshima Volcanic Island, Japan. Sci. Total Environ. 662, 332–346. doi:10.1016/j.scitotenv.2019.01.221
Han, S., Hui, S., Sun, Q., Zhang, S., Shi, L., Zhang, Y., et al. (2023). Research on ecological restoration technology of high-steep slopes of abandoned mines based on geological safety evaluation. East China Geol. 44 (2), 216–227. doi:10.16788/j.hddz.32-1865/p.2023.02.010
Han, S., Liu, M., Wu, J., Zhang, S., Sun, Q., and Zhang, T. (2022). Risk assessment of slope disasters induced by typhoon-rainfall in the southeast coastal area, China: a case study of the Shiyang north slope. J. Geomechanics 28 (04), 583–595. doi:10.12090/j.issn.1006-6616.2021168
Huang, F., Cao, Z., Jiang, S., Zhou, C., Huang, J., and Guo, Z. (2020). Landslide susceptibility prediction based on a semi-supervised multiple-layer perceptron model. Landslides 17 (12), 2919–2930. doi:10.1007/s10346-020-01473-9
Huang, F., Li, R., Catani, F., Zhou, X., Zeng, Z., and Huang, J. (2024c). Uncertainties in landslide susceptibility prediction: influence rule of different levels of errors in landslide spatial position. J. Rock Mech. Geotechnical Eng. 16, 4177–4191. doi:10.1016/j.jrmge.2024.02.001
Huang, F., Mao, D., Jiang, S.-H., Zhou, C., Fan, X., Zeng, Z., et al. (2024a). Uncertainties in landslide susceptibility prediction modeling: a review on the incompleteness of landslide inventory and its influence rules. Geosci. Front. 15, 101886. doi:10.1016/j.gsf.2024.101886
Huang, F., Teng, Z., Yao, C., Catani, F., Chen, W., Huang, J., et al. (2024d). Uncertainties of landslide susceptibility prediction: influences of random errors in landslide conditioning factors and errors reduction by low pass filter method. J. Rock Mech. Geotechnical Eng. 16 (1), 213–230. doi:10.1016/j.jrmge.2023.11.001
Huang, F., Xiong, H., Jiang, S.-H., Yao*, C., Fan, X., Catani, F., et al. (2024b). Modelling landslide susceptibility prediction: a review and construction of semi-supervised imbalanced theory. Earth-Science Rev. 250, 104700. doi:10.1016/j.earscirev.2024.104700
Huang, X., Wu, Z., Ding, D., Li, X., Shi, Z., Zhu, M., et al. (2023). Evaluation of geological disaster susceptibility based on information-logistic regression model in the Wuyuan county, Jiangxi province. J. East China Univ. Technol. Nat. Sci. 46 (3), 259–268. doi:10.3969/j.issn.1674-3504.2023.03.006
Jia, L., and Chen, S. (2024). Geological hazard susceptibility evaluation based on AHP and GIS in zhouqu county, gansu. Northwest Geol. 57 (01), 23–33. doi:10.12401/j.nwg.2023094
Lara, M., and Sepúlveda, S. A. (2010). Landslide susceptibility and hazard assessment in San Ramón Ravine, Santiago de Chile, from an engineering geological approach. Environ. Earth Sci. 60 (6), 1227–1243. doi:10.1007/s12665-009-0264-5
Li, T., Lee, G., and Kim, G. (2021). Case study of urban flood inundation—impact of temporal variability in rainfall events. Water 13 (23), 3438. doi:10.3390/w13233438
Liu, R., Luo, S., Xu, Y., Li, G., and Gou, X. (2023). Geological hazard vulnerability assessment in Ebian County based on geographic information system and slope unit. Sci. Technol. Eng. 23 (18), 7678–7685. doi:10.12404/j.issn.1671-1815.2023.23.18.07678
Liu, S., Hu, C., Hu, C., Cao, L., and Li, W. (2018). The geological hazards susceptibility assessment based on CF model-AHP. J. Anhui Normal Univ. Nat. Sci. (6), 575–582. doi:10.14182/j.cnki.1001-2443.2018.06.011
Schneider, H., Schwab, M., and Schlunegger, F. (2008). Channelized and hillslope sediment transport and the geomorphology of mountain belts. Int. J. earth Sci. 97, 179–192. doi:10.1007/s00531-006-0164-9
Shao, D., Ye, H., Wang, J., Zhou, J., Jiao, Y., and Sha, J. (2023). Evaluation of the susceptibility of geological disasters based on machine learning averaging. J. Yunnan Univ. Nat. Sci. Ed. 45 (03), 653–665. doi:10.7540/j.ynu.20220109
Sun, L., Zhang, H., Qiu, C., Yang, Z., Zhang, C., Zhang, B., et al. (2024). Temporal variability of influence factors weights and rainfall thresholds of geological hazards in Ningbo City. East China Geol. 45 (2), 218–227. doi:10.16788/j.hddz.32-1865/p.2024.02.007
Sun, Q., Zhang, T., Wu, J., Han, S., and Zhao, Y. (2022). Promoting effect of vegetation on the landslide induced by typhoon rainstorm. Geol. Surv. China 9 (4), 66–73. doi:10.19388/j.zgdzdc.2022.04.08
Sun, Q., Zhang, T., Wu, J., and Wang, H. (2018). Landslide risk assessment of the Longxi river basin based on GIS and AHP. East China Geol. 39 (03), 227–233. doi:10.16788/j.hddz.32-1865/P.2018.03.009
Tian, S., Zhang, S., Tang, Q., Fan, X., and Han, P. (2019). Comparative study of landslide susceptibility assessment based on different evaluation units. J. Nat. Disasters 28 (6), 137–145. doi:10.13577/j.jnd.2019.0615
Wang, H., Wu, J., Zhang, T., Sun, Q., and Li, Y. (2020). Dynamic assessment of geohazard susceptibility based on the SHALSTAB model. East China Geol. 41 (01), 88–95. doi:10.16788/j.hddz.32-1865/P.2020.01.011
Wen, X., Fan, X., Chen, L., and Liu, S. (2022). Susceptibility assessment of geological disasters based on an information value model: a case of Gulin County in Southeast Sichuan. Bull. Geol. Sci. Technol. 41 (2), 290–299. doi:10.19509/j.cnki.dzkq.2022.0054
Wu, J., Sun, Q., Zhang, T., Zhu, Y., Han, S., and Zhao, Y. (2022). Research for the correlation between relief amplitude and landslides: a case study of Lishui City. East China Geol. 43 (2), 235–244. doi:10.16788/j.hddz.32-1865/P.2022.02.011
Wu, L., Yin, K., Zeng, T., Liu, S., and Liu, Z. (2024). Evaluation of geological disaster susceptibility of transmission lines under different grid resolutions. Bull. Geol. Sci. Technol. 43 (1), 241–252. doi:10.19509/j.cnki.dzkq.tb20220307
Wu, R., Hu, X., Mei, H., He, J., and Yang, J. (2021). Spatial susceptibility assessment of landslides based on random forest: a case study from Hubei section in the Three Gorges Reservoir area. Earth Sci. 46 (1), 321–330. doi:10.3799/dqkx.2020.032
Yang, L., Cui, Y., Xu, C., and Ma, S. (2024). Application of coupling physics–based model TRIGRS with random forest in rainfall-induced landslide-susceptibility assessment. Landslides 21, 2179–2193. doi:10.1007/s10346-024-02276-y
Yu, W., Li, X., Zheng, L., Kong, J., Shao, Q., Xiong, H., et al. (2024). Evaluation of the susceptibility to geological hazards based on the information-Scoops3D joint model. J. Disaster Prev. Mitig. Eng. (3), 649–659. doi:10.13409/j.cnki.jdpme.20230303003
Zhang, S., Sun, P., Zhang, Y., Ren, J., and Wang, H. (2022). Hazard zonation and risk assessment of a debris flow under different rainfall condition in wudu District, gansu province, northwest China. Water 14, 2680. doi:10.3390/w14172680
Zhao, D., Lancuo, Z., Hou, G., Xu, C., and Li, W. (2021a). Assessment of geological disaster susceptibility in the hehuang valley of qinghai province. J. Geomechanics 27 (01), 83–95. doi:10.12090/j.issn.1006-6616.2021.27.01.009
Zhao, Y., Ni, H., Wu, J., Sun, Q., Zhang, T., and Liu, M. (2021b). Evaluation of geological hazard vulnerability based on AHP-CF model: take Shiyang Town of Taishun County as an example. East China Geol. 42 (1), 66–75. doi:10.16788/j.hddz.32-1865/p.2021.01.008
Keywords: geological hazard, susceptibility assessment, APH-CF model, typhoon and rainfall, southeast China
Citation: Han S, Li R, Hui S, Sun Q and Zhang T (2024) Susceptibility assessment of geological hazards in Shenzhen Town, Ninghai county based on the APH-CF model. Front. Earth Sci. 12:1494898. doi: 10.3389/feart.2024.1494898
Received: 11 September 2024; Accepted: 30 October 2024;
Published: 18 November 2024.
Edited by:
Faming Huang, Nanchang University, ChinaReviewed by:
Pengju An, Ningbo University, ChinaJianquan Ma, Xi’an University of Science and Technology, China
Teng-To Yu, National Cheng Kung University, Taiwan
Copyright © 2024 Han, Li, Hui, Sun and Zhang. This is an open-access article distributed under the terms of the Creative Commons Attribution License (CC BY). The use, distribution or reproduction in other forums is permitted, provided the original author(s) and the copyright owner(s) are credited and that the original publication in this journal is cited, in accordance with accepted academic practice. No use, distribution or reproduction is permitted which does not comply with these terms.
*Correspondence: Ran Li, MTMyNjE1NTMzMDZAMTYzLmNvbQ==
 Shuai Han1
 Ran Li