 Jingna Guo
 Qi Zhang
 Qiang Li4,5*
- 1School of Applied Mathematics, Chengdu University of Information Technology, Chengdu, Sichuan, China
- 2Beijing Research Institute of Uranium Geology, China National Nuclear Corporation, Beijing, China
- 3CAEA Innovation Center for Geological Disposal of High-Level Radioactive Waste, China National Nuclear Corporation, Beijing, China
- 4State Key Laboratory of Intelligent Construction and Healthy Operation and Maintenance of Deep Underground Engineering, China University of Mining and Technology, Xuzhou, Jiangsu, China
- 5School of Mechanics and Civil Engineering, China University of Mining and Technology, Xuzhou, China
- 6China Institute of Nuclear Industry Strategy, China National Nuclear Corporation, Beijing, China
Introduction: Gas migration in low-permeability buffer materials is a crucial aspect of nuclear waste disposal. This study focuses on Gaomiaozi bentonite to investigate its behavior under various conditions.
Methods: We developed a coupled hydro-mechanical model that incorporates damage mechanisms in bentonite under flexible boundary conditions. Utilizing the elastic theory of porous media, gas pressure was integrated into the soil's constitutive equation. The model accounted for damage effects on the elastic modulus and permeability, with damage variables defined by the Galileo and Coulomb–Mohr criteria. We conducted numerical simulations of the seepage and stress fields using COMSOL and MATLAB. Gas breakthrough tests were also performed on bentonite samples under controlled conditions.
Results: The permeability obtained from gas breakthrough tests and numerical simulations was within a 10% error margin. The experimentally measured gas breakthrough pressure aligned closely with the predicted values, validating the model's applicability.
Discussion: Analysis revealed that increased dry density under flexible boundaries reduced the damage area and influenced gas breakthrough pressure. Specifically, at dry densities of 1.4 g/cm³, 1.6 g/cm³, and 1.7 g/cm³, the corresponding gas breakthrough pressures were 5.0 MPa, 6.0 MPa, and 6.5 MPa, respectively. At a dry density of 1.8 g/cm³ and an injection pressure of 10.0 MPa, no continuous seepage channels formed, indicating no gas breakthrough. This phenomenon is attributed to the greater tensile and compressive strengths associated with higher dry densities, which render the material less susceptible to damage from external forces.
1 Introduction
With the increasing depletion of energy sources, such as coal and oil, people are becoming increasingly concerned about the development of nuclear energy. The large amount of radioactive waste generated by nuclear power plants poses a potential threat to environmental protection. For the disposal of nuclear waste, most countries internationally adopt deep geological repositories as the preferred strategy for the long-term management of high-level radioactive waste (Cui et al., 2023; Cui et al., 2022; Chen et al., 2014). The main idea of this plan is to solidify nuclear waste and bury it deep in the stable strata 500–1,000 m underground. The disposal strategy generally adopted a multi-barrier structure, comprising radioactive waste solidification, waste containers, buffer materials, and surrounding rocks from inside to outside, as shown in Figure 1. The buffer materials should have high expandability and extremely low permeability. However, over time, the decomposition of microorganisms, the corrosion of metal cans, or the radiation effects of water and organic matter will produce gas, and the gas pressure will continue to increase. The increase in gas pressure will accelerate the migration of nuclides through the engineering barrier, which has a significant impact on the safety and stability of the entire disposal repository.
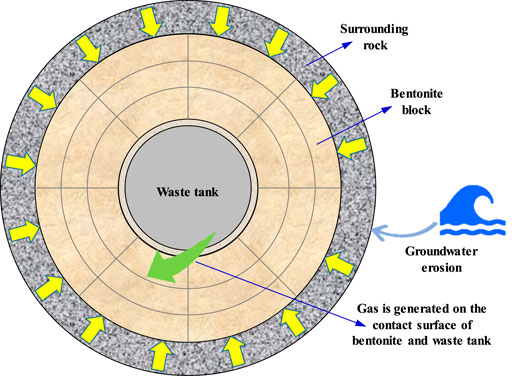
Figure 1. Repository of the multi-barrier structure (Guo et al., 2022; Guo J. N. et al., 2024).
Scholars generally believe that there are four main mechanisms for gas migration in buffer materials (Senger et al., 2018; Guo and Fall 2019; Feyyisa et al., 2019; Guo et al., 2022; Guo J. N. et al., 2024): 1) dissolution and diffusion of gases in pore water; 2) water–gas two-phase flow; 3) pore expansion control flow stage; and 4) macro-fracture flow control. Currently, there is some debate among domestic scholars regarding the gas migration mechanisms in bentonite. Some scholars believe that gas migration is mainly controlled by the two-phase flow effect, while others believe that it is controlled by the dilatancy effect. Many studies (Xu et al., 2017; Xu et al., 2015; Graham et al., 2016; Cuss et al., 2014) have shown that the gas migration mechanism is mainly affected by factors such as boundary conditions, dry density, and interface properties. Some scholars (Xu et al., 2017; Xu et al., 2015) believe that gas migration is mainly controlled by the two-phase flow under rigid boundary conditions, and it is mainly controlled by the dilatancy effect under flexible boundary conditions. Some scholars (Davy et al., 2008; Alzamel et al., 2022) believe that gas passing through bentonite mainly occurs along the interface between the bentonite sample and the pressure chamber. The above studies mostly used experimental methods, and few scholars have established mathematical models for the gas migration process.
In the initial models (Ortiz et al., 1996; Gerard et al., 2008; Graham et al., 2016; Liu et al., 2021), only two-phase flow effects were considered, without considering the coupling between the stress and seepage fields. These scholars believed that a gas breakthrough would occur when the injected gas pressure exceeded the critical capillary pressure. Some other scholars (Xu et al., 2013; Nguyen and Le, 2014; Alonso et al., 2012; Ye et al., 2014; Tawara et al., 2014; Zhang et al., 2024; Radeisen et al., 2024) considered the influence of gas injection on the intrinsic permeability of the soil and established a coupled hydro-mechanical model considering the two-phase flow. These models mainly used two methods: one was to establish a piecewise function between the intrinsic permeability and gas pressure and the other was to establish a piecewise function between the intrinsic permeability and the elastic–plastic strain. The aforementioned researchers primarily focused on the impact of gas pressure and plastic strain on the gas migration process in the soil and derived the evolution laws of gas flow and saturation. However, they encountered limitations in characterizing the discrete distribution of gas flow pathways.
With the increase in gas pressure, the pore size of the soil is likely to gradually increase, potentially resulting in the development of macroscopic fractures. To simulate the development of fracture channels, some scholars (Senger et al., 2006; Olivella and Alonso, 2008; Alonso et al., 2012) have introduced conceptual models, with the most commonly used one being the embedded fracture model, which has been introduced into conventional coupled hydro-mechanical models. These scholars embedded some discrete fractures in the model in advance and considered the impact of gas pressure on the size of the fracture, as well as the effect of the size of the fracture on intrinsic permeability. These models used two types of elements: fracture and matrix elements. The permeability of fracture elements was mainly determined by the fracture size and deformation, while the permeability of matrix elements was determined by the porosity. Consequently, these models were essentially controlled by strain, and the initial embedding of cracks was hypothetical, failing to simulate the actual process of pore expansion. To more accurately simulate the real process of gas breakthrough and pore path expansion in the porous medium, a coupled hydro-mechanical model for gas migration in bentonite was established. This model considered the impact of soil damage on soil deformation and gas flow during the gas injection process and described the differences in the stress–strain association before and after damage. Combined with the secondary development of MATLAB and COMSOL, the actual evolution of pore expansion pathways within bentonite during the gas injection process was simulated. The dry density has a significant impact on the permeability, damage variable, and strength of bentonite. Finally, the variation law of pore path expansion within bentonite was analyzed under flexible boundaries.
2 A coupled hydro-mechanical model considering the damage of bentonite
2.1 Deformation equations of bentonite
Taking into account the effect of pore pressure within bentonite, the relationship between the stress and strain could be expressed as shown in Equation 1 (Zhang et al., 2018a; Zhang et al., 2018b; Zhang et al., 2019; Shi et al., 2023a; Shi et al., 2023b; Shi et al., 2023c).
where
The geometric equation for the deformation of bentonite could be expressed as Equation 2.
where
The equilibrium differential equation of bentonite under external loading could be expressed as Equation 3.
where
Combining Equation 1 and Equation 3, the Navier–Stokes Equation 4 could be obtained as follows:
Equation 4 is the deformation control equation for bentonite.
2.2 Governing equations of gas flows
The continuity equation for gas flow in bentonite could be expressed as Equation 5:
where m is the mass of the gas passing through a unit volume of bentonite, t is the time,
Assuming that the flow of gas within bentonite obeyed Darcy’s law, the seepage velocity could be expressed by Equation 6.
where
Assuming that the pores in bentonite were always filled with water, we obtain
where
where the compressibility coefficient of the fluid could be expressed as
Substituting Equation 6 and Equation 9 into Equation 5, Equation 10 could be obtained.
2.3 Damage model of bentonite
Common methods for representing the heterogeneity of rock and soil include the digital image and the probability density method. Digital image analysis is a method that uses computer software to convert image information into microstructural information of geotechnical materials. The probability density method assumes that the parameters of geotechnical materials satisfy a certain probability density function to characterize their heterogeneity. The probability density functions commonly used to characterize the heterogeneity of geotechnical materials include the Weibull distribution, normal distribution, log-normal distribution, gamma distribution, and beta distribution. Some scholars (Tang et al., 2002; Wong et al., 2006) have concluded through experiments that the Weibull distribution function was most suitable for characterizing the heterogeneity of geotechnical materials. It was assumed that the elastic modulus and permeability of bentonite obeyed the Weibull distribution, and its distribution density could be expressed as Equation 11.
where
In the high-level waste repository, gas continues to accumulate, resulting in a steady rise in gas pressure. If the total stress on the bentonite remains constant, the soil may transition from a compressive to a tensile state when the pore pressure reaches a certain value, potentially leading to tensile failure. When the stress state of the unit satisfies the maximum tensile stress criterion (12), it is considered to have undergone tensile failure. Tensile failure obeys the Galileo criterion, and its threshold function is expressed as shown in Equation 12.
where
In addition, shear failure may also occur in bentonite. When the Mohr–Coulomb criterion (13) is satisfied, it is considered that shear failure has occurred. Shear failure obeys the Coulomb–Mohr criterion, and its threshold function is expressed as shown in Equation 13.
where
Since the tensile strength of bentonite is usually an order of magnitude lower than its uniaxial compressive strength, the tensile failure of the element will be judged preferentially.
Figure 2 shows a typical stress–strain curve of a rock mass under uniaxial compression. It could be observed that the elastic modulus remains unchanged before the rock mass reaches the stage of failure. When the stress state experienced by the rock mass reached the maximum tensile stress or the Mohr–Coulomb criterion, the rock mass began to fail. In this stage, a power function was used to characterize the stress–strain relationship of the rock mass in order to describe the evolution law of the elastic modulus as damage varies.
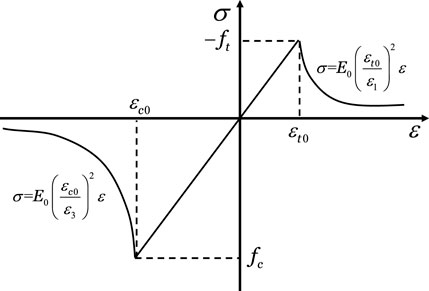
Figure 2. Stress–strain curve of the rock mass under uniaxial stress conditions.
Taking into account both tensile and shear failure modes, the damage variable D (Guo J. N. et al., 2024; Yang et al., 2007) is expressed by Equation 14.
where
The elastic modulus decreases after bentonite failure, which could be expressed by Equation 15.
Equations 14, 15 represent the damage model for bentonite.
The initiation and expansion of cracks in the process of bentonite failure resulted in changes in its permeability. Many experiments have shown that the permeability increased exponentially with the damage variable (Zhang et al., 2018a; Zhang et al., 2018b; Zhang et al., 2019). Permeability can be calculated using Equation 16.
where
3 Calculation of the coupled hydro-mechanical model considering damage
3.1 Soil configuration and boundary conditions
In order to verify the applicability of numerical methods, the geometry of bentonite is modeled as a circular plate with a diameter of 2
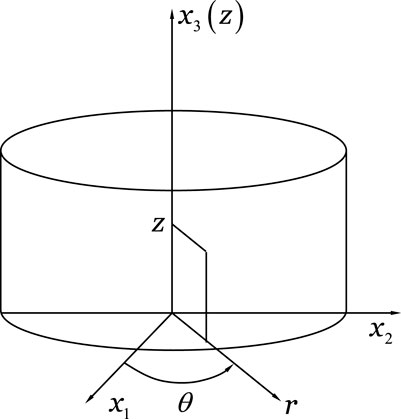
Figure 3. Soil configuration.
In the rectangular coordinate system
In the cylindrical coordinate system
In the indoor permeability test, the circumferential displacement and stress changes in the bentonite sample were minimal. Thus, the coupled hydro-mechanical model could be simplified to a two-dimensional axisymmetric model. The 2D geometry mode of bentonite under confining pressure boundary conditions is shown in Figure 4.
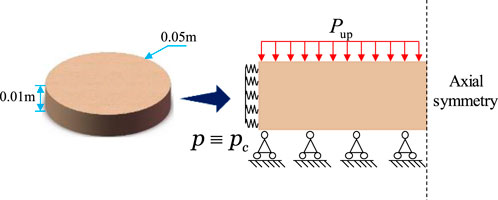
Figure 4. 2D geometry mode of soil under confining pressure.
The boundary conditions at the top are expressed in Equation 19.
where Pup is the pressure in the inlet,
The boundary conditions at the bottom are expressed by Equation 20.
where
where
3.2 Computational method
In this study, the model development, parameter assignment, and numerical solution were accomplished by combining MATLAB programming with COMSOL software. The state of the element is determined based on the established failure criterion, which is used to update the corresponding physical parameters. The gas pressure is incrementally applied utilizing a stepwise loading technique. An iterative method is applied in the calculation, which results in the evolution process of the element under the load. The primary procedural steps are outlined below.
(1) A geometric model is built, and the geometry is divided into a series of units. The initial mechanical parameters and boundary conditions on the element are set.
(2) The numerical calculation of the coupled hydro-mechanical model is carried out using COMSOL, and the stress and strain results of the element are extracted.
(3) COMSOL determines whether the element is damaged based on a program written in MATLAB.
(4) After updating the mechanical parameters of the unit, calculations are performed again using COMSOL. The results of the mechanical parameters before and after the update are compared. If new damage occurs, steps (3)–(4) are repeated; otherwise, proceed to step (5).
(5) The initial gas pressure is set to 0.1 MPa, the differential was 0.1 MPa, and the final value was 10.0 MPa. Steps (2)–(4) are repeated until the cracks penetrate through the sample.
3.3 Model validation and analysis
3.3.1 Gas breakthrough test
The research object of this paper was Gaomiaozi bentonite. The diameter of the sample was 50.06 mm, the height was 10.09 mm, and the dry density was 1.7 g/cm3. After the sample was prepared, a water injection saturation experiment was conducted on the sample first, and then a gas breakthrough experiment was carried out. The task consists of the following steps: 1) the sample was placed in a triaxial load cell. We determined that the confining pressure for bentonite should be set to 7.0 MPa based on actual ground stresses, the swelling force of bentonite when saturated, and the results of multiple tests and maintained it for 24 h. 2) The water injection pressure was set to 1.0 MPa. The water injection time was set to 15 days to ensure that the bentonite was fully saturated. 3) After saturation with water injection, the gas breakthrough test was conducted. The primary gas pressure was set to 1.0 MPa, with a gradient of 1.0 MPa, until gas breakthrough occurred. The test principle of permeability under the confining pressure boundary condition is shown in Figure 5.
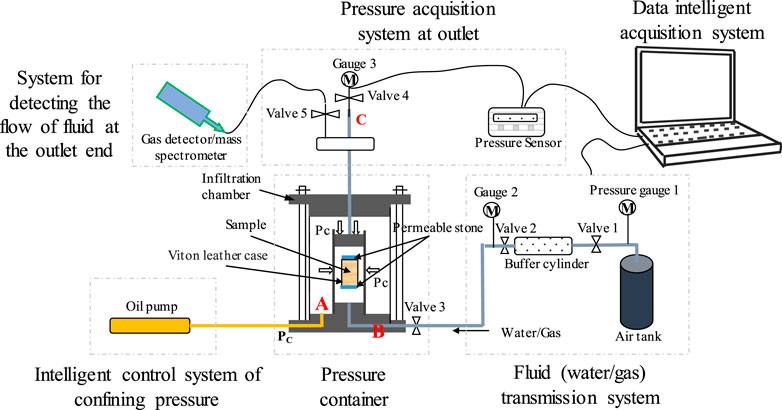
Figure 5. Schematic diagram of the permeability test system (Guo et al., 2022; Guo J. S. et al., 2024).
Due to the low permeability of water-saturated bentonite, the permeability was calculated based on the pressure changes at both ends of the sample (Wu et al., 2020; Wu et al., 2022; Wu et al., 2024). The equation for calculating bentonite permeability (Guo et al., 2022; Guo J. S.et al., 2024) is expressed as Equation 22.
where A is the cross-sectional area of the sample; Pdown and Pup are the pressures in the outlet and inlet, respectively; Vb is the volume of the gas cylinder (
3.3.2 Example analysis
Utilizing the coupled hydro-mechanical model considering damage presented in Section 2, the changes in seepage path and permeability in bentonite subjected to a confining pressure of 7.0 MPa and a dry density of 1.7 g/cm3 were obtained. Subsequently, the model’s applicability was confirmed by comparing numerical simulation outcomes with experimental data. The basic mechanical parameters of bentonite used in the numerical model are shown in Table 1.
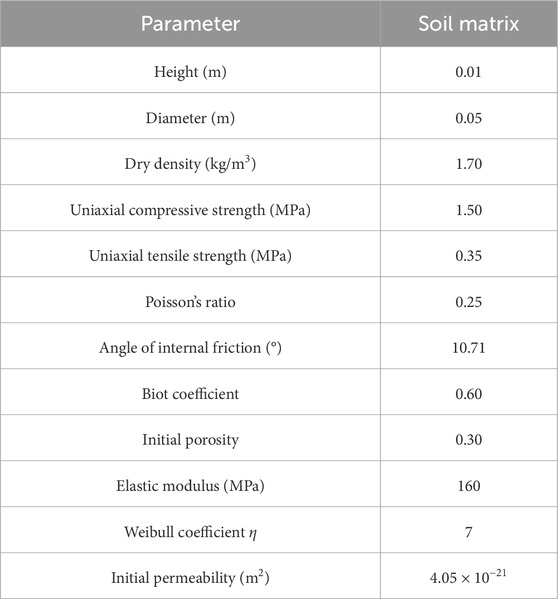
Table 1. Basic mechanical parameters of bentonite.
The gas injection pressure was applied in a step-by-step loading way, commencing at 0.1 MPa with an incremental step of 0.1 MPa, culminating at a final pressure of 7.0 MPa. The computation duration for each pressure stage was set at 7.2 h. The cloudy pictures of bentonite damage evolution and permeability under different injection pressures are shown in Figure 6.
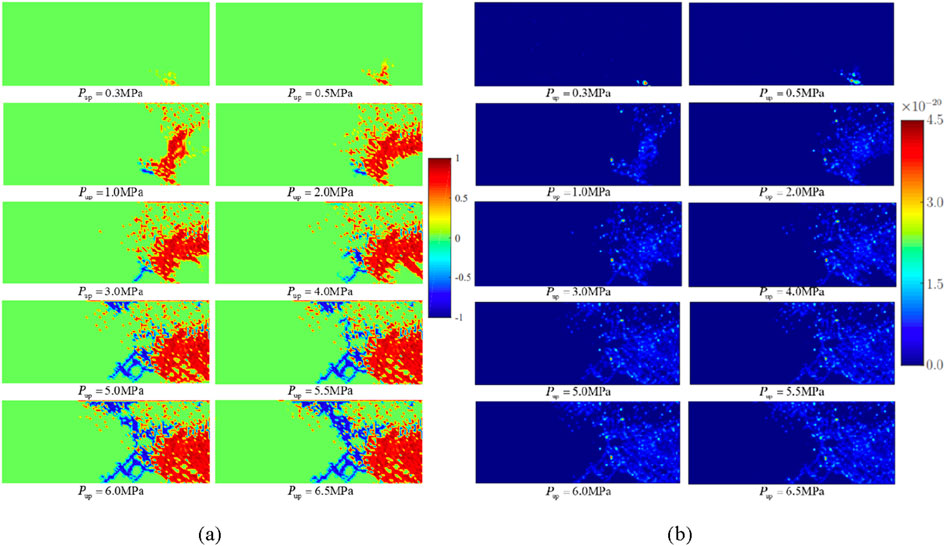
Figure 6. Cloud map of bentonite damage evolution and permeability under a dry density of 1.7 g/cm3. (A) Damage evolution. (B) Permeability.
The area of the model was calculated based on the height and diameter of bentonite. The damage area was calculated through the following steps: 1) the number of damaged meshes was calculated through numerical computation. 2) The ratio of the number of damaged meshes to the total number of meshes was calculated. The area of the damage was calculated by multiplying the above ratio by the total area of the model. The area of damage at different gas injection pressures is shown in Figure 7.
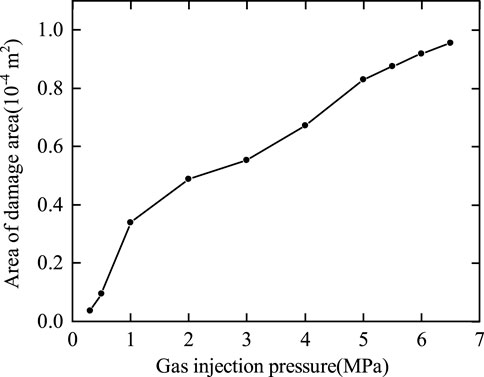
Figure 7. Area of the damage.
As shown in Figures 6, 7, 1) when the gas injection pressures were 0.3 MPa and 0.5 MPa, shear damage started to occur at the bottom of the model. 2) During the stage of gas injection pressure from 1.0 MPa to 4.0 MPa, the tensile damage began to appear, and shear damage extended rapidly toward the axisymmetric boundary on the right. 3) During the gas injection pressure phase ranging from 5.0 MPa to 6.0 MPa, tensile damage rapidly propagated from the top to the bottom of the bentonite. 4) As the gas injection pressure increased from 6.0 MPa to 6.5 MPa, tensile cracks spread throughout the bentonite, forming the primary percolation channels. The results indicated that at low gas injection pressures, the bentonite predominantly experienced shear failure under the confining pressure, which led to a reduction in effective stress. With an increase in gas injection pressure, tensile damage became increasingly evident, eventually extending into continuous percolation channels. When the gas injection pressure reached 6.0 MPa, a continuous seepage channel formed within the bentonite, indicating that the gas breakthrough pressure was 6.0 MPa. As the pores expanded, the permeability of the soil mass continuously increased. When the confining pressure was 7.0 MPa and the dry density was 1.7 g/cm3, the permeability was calculated through numerical simulation and the gas breakthrough experiment, and the error between the two is shown in Table 2.
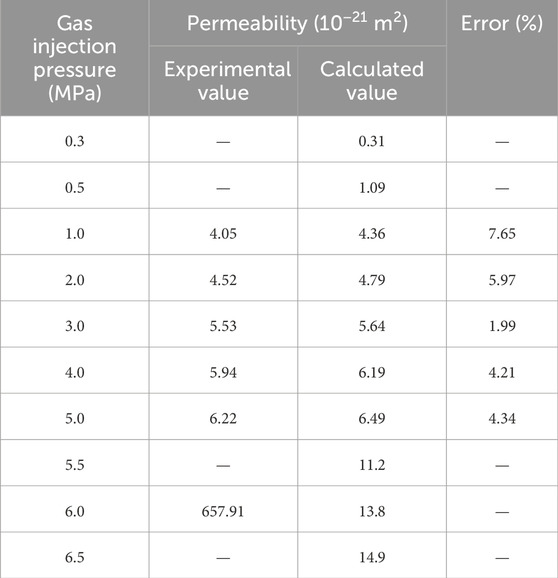
Table 2. Experimental values, calculated values, and errors of permeability at a dry density of 1.7 g/cm3.
As given in Table 2, before the gas breakthrough occurred, the error between the permeability obtained from the numerical calculation and that obtained from the gas breakthrough experiment was within 10%. The gas breakthrough pressure obtained from numerical simulations and gas breakthrough experiments was the same, which verified the rationality and applicability of the model. However, there is a significant difference between the calculated and experimental values of permeability when a continuous seepage channel is formed. In numerical simulations, the occurrence of the gas breakthrough is determined by assessing whether the pores at the upper and lower bounds of the soil are connected. During the experimental process, the continuous flow of pore water in the soil causes the pores within the bentonite to close and open at times, making the internal changes within the bentonite very complex. In numerical simulations, the effect of pore water flow on the closure of pores within the bentonite has not been considered. As the pores expand, the permeability of the soil mass continuously increases. Therefore, there is a significant difference between the permeability calculated by numerical simulations and that measured experimentally at the time of gas breakthrough.
4 The bentonite damage law changed with dry density
The dry density of bentonite was a key parameter in determining the permeability of bentonite, and some scholars (Zhang et al., 2012; Zhang et al., 2014; Chen et al., 2016; Radeisen et al., 2023) suggested that the dry density of bentonite should be controlled to be between 1.4 g/cm³ and 1.8 g/cm³. Higher dry densities result in increased stress exerted on the waste container by the bentonite, potentially causing damage to the waste container and reducing the sealing of the high-level waste repository. Conversely, a lower dry density meant a lower swelling pressure of bentonite, leading to a lower degree of filling in the gap between bentonite and the waste container, which also affected the sealing of the high-level waste repository. According to the above reasons, the damage evolution law of bentonite under the dry densities of 1.4 g/cm³, 1.6 g/cm³, and 1.8 g/cm³ was analyzed using the method of coupled simulation of multiple physical fields Section 2. Mechanical parameters at different dry densities (Zheng et al., 2022; Dong et al., 2023; Zhu et al., 2023) are shown in Table 3.
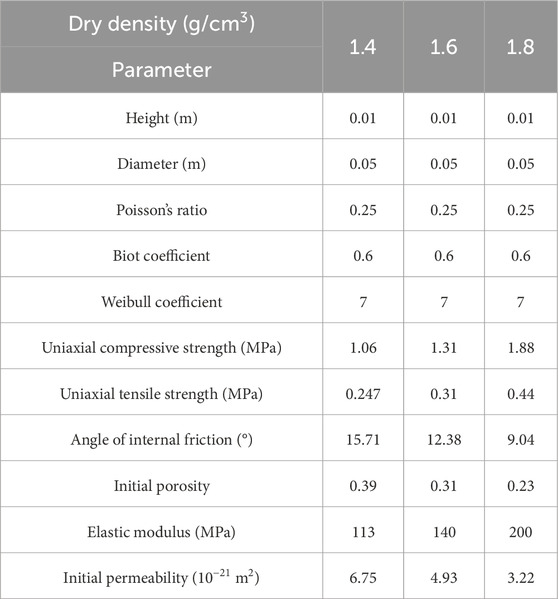
Table 3. Mechanical parameters at different dry densities.
When the dry density of bentonite was 1.4 g/cm3, the initial gas injection pressure was 0.1 MPa, with an incremental increase of 0.1 MPa, reaching a final pressure of 6.0 MPa. The cloudy pictures of bentonite damage evolution under different injection pressures are shown in Figure 8.
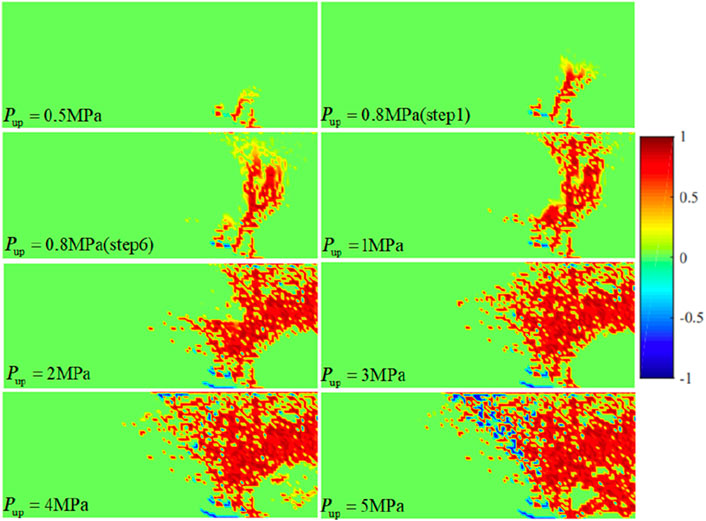
Figure 8. Cloud map of bentonite damage evolution at a dry density of 1.4 g/cm3.
As shown in Figure 8, 1) when the gas injection pressure was 0.5 MPa, shear damage began to appear at the bottom of the model. The total damage areas were 6.86 × 10⁻⁶ m2 during these phases. 2) When the gas injection pressure was 0.8 MPa, the shear damage rapidly extended to the upper regions, while discrete tensile damages began to appear at the bottom of the model. It was calculated eight times under this pressure. The total damage areas were 3.9 × 10⁻⁵ m2. 3) When the gas injection pressure was 1.0 MPa, the upper and lower boundaries of the soil almost expanded into connected seepage channels. The total damage area was 4.28 × 10⁻⁵ m2. 4) When the gas injection pressures ranged from 2.0 MPa to 4.0 MPa, shear damage extended rapidly to the axisymmetric boundary on the right. The total damage areas were 6.11 × 10⁻⁵ m2, 7.4 × 10⁻⁵ m2, and 8.82 × 10⁻⁵ m2. 5) When the gas injection pressures were 5.0 MPa, the tensile damage expanded significantly. The total damage area was 1.05 × 10⁻⁴ m2. When the dry density of bentonite was 1.4 g/cm³, the main damage that occurred in bentonite was shear damage. The main cause of this result was that the lower the dry density, the lower the compressive strength of bentonite, making it more susceptible to shear failure under a certain confining pressure. When the gas injection pressure was 5.0 MPa, a continuous seepage channel formed within bentonite. When the dry density of bentonite was 1.6 g/cm3, the initial gas injection pressure was 0.1 MPa, with an incremental increase of 0.1 MPa, reaching a final pressure of 8.5 MPa. The cloudy pictures of bentonite damage evolution under different injection pressures are shown in Figure 9.
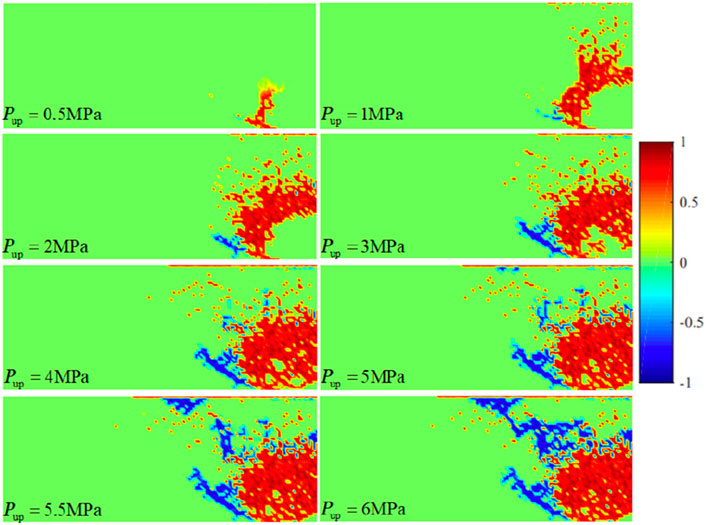
Figure 9. Cloud map of bentonite damage evolution at a dry density of 1.6 g/cm3.
As shown in Figure 9, 1) when the gas injection pressure was 0.5 MPa, shear damage began to appear at the bottom of the model. The total damage areas were 8.66 × 10⁻⁶ m2 during these phases. 2) When the gas injection pressures ranged from 1.0 MPa to 4.0 MPa, shear damage extended rapidly to the axisymmetric boundary on the right, and tensile damage started to occur at the bottom of the model. However, the propagation of tensile damage was relatively slow. The total damage areas were 3.62 × 10⁻⁵ m2, 5.33 × 10⁻⁵ m2, 5.94 × 10⁻⁵ m2, and 7.19 × 10⁻⁵ m2. 3) When the gas injection pressures ranged from 5.0 MPa to 6.0 MPa, the propagation of shear damage became slower, and tensile damage started to occur at the top of the model. With the increase in gas injection pressure, tensile damage has expanded significantly. When the gas injection pressure was 6.0 MPa, the upper and lower ends of the soil expanded, forming a continuous seepage path, indicating that the gas breakthrough pressure was 6.0 MPa. The total damage areas were 8.61 × 10⁻⁵ m2, 9.09 × 10⁻⁵ m2, and 9.44 × 10⁻⁵ m2.
When the dry density of bentonite was 1.8 g/cm3, the initial gas injection pressure was 0.1 MPa, with an incremental increase of 0.1 MPa, reaching a final pressure of 10.0 MPa. The cloudy pictures of bentonite damage evolution under different injection pressures are shown in Figure 10.
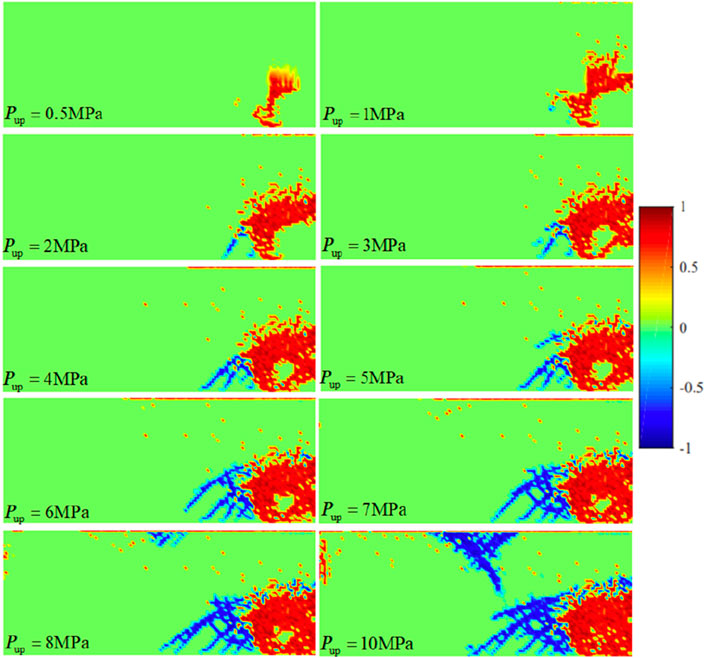
Figure 10. Cloud map of bentonite damage evolution at a dry density of 1.8 g/cm3.
As shown in Figure 10, 1) when the gas injection pressure was 0.5 MPa, a large area of shear damage began to appear at the bottom of the model, with the total damage areas amounting to 1.34 × 10⁻⁵ m2 during these phases. 2) As the gas injection pressure ranged from 1.0 MPa to 7.0 MPa, shear damage rapidly extended to the right-hand axisymmetric boundary, and tensile damage initiated. With the increase in gas injection pressure, the area of shear damage increased, and the tensile damage expanded to the lower portion of the model. The total damage areas were 2.14 × 10⁻⁵ m2, 2.73 × 10⁻⁵ m2, 3.43 × 10⁻⁵ m2, 3.82 × 10⁻⁵ m2, 4.12 × 10⁻⁵ m2, 4.73 × 10⁻⁵ m2, and 5.18 × 10⁻⁵ m2. 3) When the gas injection pressures ranged from 8.0 MPa to 10.0 MPa, the propagation of shear damage slowed down significantly, while tensile damage began to propagate rapidly, and new instances of tensile damage started to appear at the upper part of the model. The total damage areas were 5.90 × 10⁻⁵ m2 and 8.15 × 10⁻⁵ m2. No connected seepage path was formed within bentonite until the gas injection pressure reached 10.0 MPa. The main cause of this result was that the greater the dry density, the greater the tensile and compressive strength of bentonite, thereby reducing its susceptibility to damage from external forces. We investigate the effects of dry density on bentonite damage, and the variation curve of damage with dry density is shown in Figure 11.
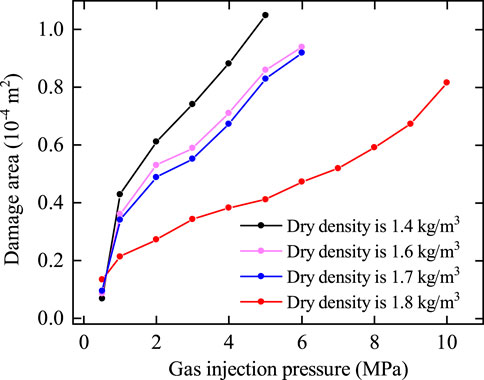
Figure 11. Variation curve of damage with dry density.
From Figures 8–11, it could be observed that 1) the greater the dry density, the smaller the area of damage to the bentonite at the same gas injection pressure. 2) When the dry density was 1.4 g/cm³ and 1.6 g/cm³, the bentonite was prone to shear failure, while at a dry density of 1.7 g/cm³ and 1.8 g/cm³, the bentonite was prone to tensile failure. The primary reason for this outcome is the inverse relationship between dry density and compressive strength of bentonite: the lower the dry density, the lower the compressive strength, which renders the bentonite more susceptible to shear failure under specific confining pressures. 3) At dry densities of 1.4 g/cm³, 1.6 g/cm³, and 1.7 g/cm³, the corresponding gas breakthrough pressures were 5.0 MPa, 6.0 MPa, and 6.5 MPa, respectively. When the dry density was 1.8 g/cm³ and the injection pressure reached 10.0 MPa, no continuous seepage channels formed within the bentonite, indicating that a gas breakthrough had not occurred. From the research findings, with the increase in dry density, it was inferred that the damage area of bentonite was smaller and the gas breakthrough pressure was greater. This is because higher dry densities enhance bentonite’s tensile and compressive strengths, making it more resistant to damage from external forces.
5 Conclusion
The coupled governing equations for the seepage and stress fields of bentonite were established based on the theory of porous media. Considering the heterogeneity of bentonite, the Weibull distribution function effectively describes the initial permeability and elastic modulus of bentonite. Additionally, the damage variable of bentonite was defined based on the maximum tensile-strain criterion and Mohr–Coulomb criterion. The damage theory was applied to characterize the enhancement of the permeability and the reduction of the elastic modulus due to damage. The numerical solution of the coupled hydro-mechanical model was calculated using COMSOL and MATLAB software. The model’s applicability and rationality were confirmed by comparing results of numerical simulation with those of gas breakthrough tests. Finally, the impact of dry density on damage area, seepage path, and gas breakthrough pressure was analyzed. The main conclusions were as follows:
(1) When the confining pressure was 7.0 MPa and the dry density was 1.7 g/cm3, shear damage predominantly occurred within the model at low gas injection pressures. As the gas injection pressure increased, shear damage rapidly extended to the axisymmetric boundary on the right. When the injection gas pressure is greater than 5.0 MPa, tensile damage rapidly extends from the top to the bottom of bentonite. When the gas injection pressures were 6.0 MPa and 6.5 MPa, the tensile damage became increasingly evident, eventually forming continuous percolation channels. The gas breakthrough pressure, as determined by both numerical simulation and gas breakthrough experiments, was consistent, thereby validating the model’s rationality and applicability.
(2) The evolution law of damage exhibited similar patterns across varying dry densities. When the dry density was 1.4 g/cm3, bentonite primarily caused shear damage, with only a few discrete instances of tensile damage. When the dry density was 1.6 g/cm3, shear damage mainly occurred in the model at low gas injection pressures. As the gas injection pressure increased, shear damage rapidly extended to the right-hand axisymmetric boundary. When the injection pressure surpassed a certain threshold, the upper and lower ends of the soil expanded into a connected seepage path. However, at a dry density of 1.8 g/cm3, no connected seepage path was formed within bentonite until the gas injection pressure reached 10.0 MPa. The primary reason for this outcome is that higher dry densities correspond to greater tensile and compressive strengths in bentonite, thereby reducing its susceptibility to damage under external forces.
(3) The damage area to bentonite decreases with increasing dry density at a given gas injection pressure. At dry densities of 1.4 g/cm³, 1.6 g/cm³, and 1.7 g/cm³, the corresponding gas breakthrough pressures were 5.0 MPa, 6.0 MPa, and 6.5 MPa, respectively. Notably, at a dry density of 1.8 g/cm³, even when the injection pressure reached 10.0 MPa, no continuous seepage channels formed within the soil, indicating that gas breakthrough had not yet occurred. The main cause of this result was primarily attributed to the fact that higher dry densities enhance the tensile and compressive strengths of bentonite, thereby reducing its vulnerability to damage from external forces.
Data availability statement
The original contributions presented in the study are included in the article/supplementary material, further inquiries can be directed to the corresponding authors.
Author contributions
JG: data curation, formal analysis, methodology, and writing–original draft. QZ: data curation, formal analysis, software, and writing–review and editing. QL: data curation and writing–review and editing. ML: data curation and writing–review and editing. ZC: supervision and writing–review and editing. JC: data curation, formal analysis, and writing–review and editing. ZT: data curation, formal analysis, and writing–review and editing.
Funding
The author(s) declare that financial support was received for the research, authorship, and/or publication of this article. The authors declare that this research was supported by the following funds: China Atomic Energy Authority (CAEA) through the Geological Disposal Program; Scientific Research Foundation of CUIT (No. KYTZ2022142, No. 2023ZX001, No. 202410621322).
Acknowledgments
The authors are grateful for the support of the Scientific Research Foundation of CUIT (No. KYTZ2022142), the Sichuan National Applied Mathematics Center—Chengdu University of Information Technology, the Institute of Applied Mathematics for Intelligent Systems (No.2023ZX001), and the College Students Innovations Special Project funded by the Chengdu University of Information Technology (No.202410621322).
Conflict of interest
Authors QZ and ML were employed by China National Nuclear Corporation.
The remaining authors declare that the research was conducted in the absence of any commercial or financial relationships that could be construed as a potential conflict of interest.
Publisher’s note
All claims expressed in this article are solely those of the authors and do not necessarily represent those of their affiliated organizations, or those of the publisher, the editors, and the reviewers. Any product that may be evaluated in this article, or claim that may be made by its manufacturer, is not guaranteed or endorsed by the publisher.
References
Alonso, J., Navarro, V., and Calvo, B. (2012). Flow path development in different CO2 storage reservoir scenarios: a critical state approach. Eng. Geol. 127 (2), 54–64. doi:10.1016/j.enggeo.2012.01.001
Alzamel, M., Haruna, S., and Fall, M. (2022). Saturated hydraulic conductivity of bentonite-sand barrier material for nuclear waste repository: effects of physical, mechanical thermal and chemical factors. Environ. earth Sci. 81 (81-7), 223. doi:10.1007/s12665-022-10358-0
Chen, L., Liu, Y. M., Wang, J., Cao, S. F., Xie, J. L., Ma, L. K., et al. (2014). Investigation of the thermal-hydro-mechanical (THM) behavior of GMZ bentonite in the China-Mock-up test. Eng. Geol. 172 (8), 57–68. doi:10.1016/j.enggeo.2014.01.008
Chen, Y. G., Jia, L. Y., Niu, L. H., Ye, W. M., Chen, B., and Cui, Y. J. (2016). Effect of dry density and pH on the diffusion behavior of lanthanum incompacted Chinese GMZ bentonite. J. radioanalytical Nucl. Chem. 310 (3), 1303–1310. doi:10.1007/s10967-016-4972-5
Cui, L. Y., Ye, W. M., Wang, Q., Chen, Y. G., Chen, B., and Cui, Y. J. (2022). Insights into gas migration in saturated GMZ bentonite using the RCP technique. Eng. Geol. 303, 106646. doi:10.1016/j.enggeo.2022.106646
Cui, L. Y., Ye, W. M., Wang, Q., Chen, Y. G., and Cui, Y. J. (2023). A model for describing advective and diffusive gas transport through initially saturated bentonite with consideration of temperature. Eng. Geol., 323. doi:10.1016/j.enggeo.2023.107215
Cuss, R. J., Harrington, J. F., Noy, D. J., Graham, C. C., and Sellin, P. (2014). Evidence of localised gas propagation pathways in a field-scale bentonite engineered barrier system; results from three gas injection tests in the large scale gas injection test (Lasgit). Appl. Clay Sci. 102 (12), 81–92. doi:10.1016/j.clay.2014.10.014
Davy, C. A., Skoczylas, F., Lebon, P., and Dubois, T. (2008). Gas migration properties through a bentonite/argillite interface. Appl. Clay ence 42 (4), 639–648. doi:10.1016/j.clay.2008.05.005
Dong, X. X., Chen, Y. G., Ye, W. M., and Wang, Q. (2023). Modeling of water retention behavior of densely compacted Gaomiaozi bentonite based on pore structure evolution. Eng. Geol. 313, 106977. doi:10.1016/j.enggeo.2022.106977
Feyyisa, J. L., Daniels, J. L., Pando, M. A., and Ogunro, V. O. (2019). Relationship between breakthrough pressure and contact angle for organo-silane treated coal fly ash. Environ. Technol. and Innovation 14, 100332. doi:10.1016/j.eti.2019.100332
Gerard, P., Charlier, R., Barnichon, J. D., and Su, K. (2008). Numerical modelling of coupled mechanics and gas transfer around radioactive waste in Long-Term Storage. J. Theor. Appl. Mech. 38 (1–2), 25–44.
Graham, C. C., Harrington, J. F., and Sellin, P. (2016). Gas migration in pre-compacted bentonite under elevated pore-water pressure conditions. Appl. Clay Sci. 132-133, 353–365. doi:10.1016/j.clay.2016.06.029
Guo, G., and Fall, M. (2019). Modelling of preferential gas flow in heterogeneous and saturated bentonite based on phase field method. Comput. Geotechnics 116 (5), 103206–206. doi:10.1016/j.compgeo.2019.103206
Guo, J. N., Liu, J. F., Zhang, Q., Cao, S. F., and Chen, Z. Q. (2022). Gas migration properties through saturated bentonite considering the interface effect. Geomechanics Geophys. Geo-Energy Geo-Resources 8 (2), 66–23. doi:10.1007/s40948-022-00370-w
Guo, J. N., Zhang, Q., Chen, L., Cao, S. F., Xie, J. L., Li, Q., et al. (2024). A coupled fluid-mechanical interaction model for controlled gas migration mechanism by dilatancy effect in saturated bentonite. Geomechanics Geophys. Geo-Energy Geo-Resources 9 (1), 119–121. doi:10.1007/s40948-023-00647-8
Guo, J. S., Ma, L. Q., Liu, Z. G., and Wang, S. C. (2024). The influence of mining stress paths on rock damage and permeability. Environ. Earth Sci. 83 (10), 307. doi:10.1007/s12665-024-11639-6
Liu, J. F., Cao, X. L., Ni, H. Y., Zhang, K., Ma, Z. X., Ma, L. K., et al. (2021). Numerical modeling of water and gas transport in compacted GMZ bentonite under constant volume condition. Geofluids 2021, 1–16. doi:10.1155/2021/4290426
Nguyen, T., and Le, A. (2014). Simultaneous gas and water flow in a damage-susceptible bedded argillaceous rock. Can. Geotechnical J. 52 (1), 18–32. doi:10.1139/cgj-2013-0457
Olivella, S., and Alonso, E. E. (2008). Gas flow through clay barriers. Géotechnique 58 (3), 157–176. doi:10.1680/geot.2008.58.3.157
Ortiz, L., Impey, M., and Einchomb, S. (1996). Characterization of gas flow in boom clay, a low permeability plastic rock, fluid flow through fractures in argillaceous formations. Switzerland: NEA/EC Workshop June. Available at: https://www.osti.gov/etdeweb/biblio/640383.
Radeisen, E., Shao, H., Hesser, J., Naumov, D., Wang, W., and Kolditz, O. (2024). Modelling of preferential gas flow in saturated bentonite using a bimodal, strain-dependent pore model. Appl. clay Sci., 249. doi:10.1016/j.clay.2023.107232
Radeisen, E., Shao, H., Jürgen, H., Kolditz, O., Xu, W., and Wang, W. (2023). Simulation of dilatancy-controlled gas migration processes in saturated bentonite using a coupled multiphase flow and elastoplastic H2 M model. J. Rock Mech. Geotechnical Eng. 15 (4), 803–813. doi:10.1016/j.jrmge.2022.05.011
Senger, R., Enachescu, C., Doe, T., and Frieg, B. (2006). “Design and analysis of a gas threshold pressure test in a low permeability clay formation at andra's underground research laboratory, bure (France),” in proceedings, tough symposium [C]. Berkeley, California: Lawrence Berkeley National Laboratory.
Senger, R., Romero, E., and Marschall, P. (2018). Modeling of gas migration through low-permeability clay rock using information on pressure and deformation from fast air injection tests. Transp. Porous Media 123 (3), 563–579. doi:10.1007/s11242-017-0962-5
Shi, H., Chen, W., Zhang, H., and Lei, S. (2023b). A novel obtaining method and mesoscopic mechanism of pseudo-shear strength parameter evolution of sandstone. Environ. Earth Sci. 82, 60. doi:10.1007/s12665-023-10748-y
Shi, H., Chen, W., Zhang, H., Song, L., Ming, Li, Wang, M., et al. (2023a). Dynamic strength characteristics of fractured rock mass. Eng. Fract. Mech. 292, 109678. doi:10.1016/j.engfracmech.2023.109678
Shi, H., Zhang, H., Chen, W., Song, L., and Li, M. (2023c). Pull-out debonding characteristics of rockbolt with prefabricated cracks in rock: a numerical study based on particle flow code. Comput. Part. Mech. 11, 29–53. doi:10.1007/s40571-023-00607-9
Tang, C. A., Tham, L. G., Lee, P. K. K., Yang, T., and Li, L. (2002). Coupled analysis of flow, stress and damage (FSD) in rock failure. Int. J. Rock Mech. Min. Sci. 39 (4), 477–489. doi:10.1016/s1365-1609(02)00023-0
Tawara, Y., Hazart, A., Mori, K., Tada, K., Shimura, T., Sato, S., et al. (2014). Extended two-phase flow model with mechanical capability to simulate gas migration in bentonite. Geol. Soc. Lond. Spec. Publ. 400 (1), 545–562. doi:10.1144/sp400.7
Wong, T., Wong, R. H. C., Chau, K. T., and Tang, C. (2006). Microcrack statistics, Weibull distribution and micromechanical modeling of compressive failure in rock. Mech. Mater. 38 (7), 664–681. doi:10.1016/j.mechmat.2005.12.002
Wu, J. Y., Jing, H. W., Gao, Y., Meng, Q. B., Yin, Q., and Du, Y. (2022). Effects of carbon nanotube dosage and aggregate size distribution on mechanical property and microstructure of cemented rockfill. Cem. Concr. Compos. 127, 104408. doi:10.1016/j.cemconcomp.2022.104408
Wu, J. Y., Jing, H. W., Yin, Q., Yu, L. Y., Meng, Q. B., and Li, S. C. (2020). Strength prediction model considering material, ultrasonic and stress of cemented waste rock backfill for recycling gangue. J. Clean. Prod. 276, 123189. doi:10.1016/j.jclepro.2020.123189
Wu, J. Y., Wong, H. S., Zhang, H., Yin, Q., Jing, H. W., and Ma, D. (2024). Improvement of cemented rockfill by premixing low-alkalinity activator and fly ash for recycling gangue and partially replacing cement. Cem. Concr. Compos. 145, 105345. doi:10.1016/j.cemconcomp.2023.105345
Xu, L., Ye, W. M., and Ye, B. (2017). Gas breakthrough in saturated compacted GaoMiaoZi (GMZ) bentonite under rigid boundary conditions. Can. Geotechnical J. 54 (8), 1139–1149. doi:10.1139/cgj-2016-0220
Xu, L., Ye, W. M., Ye, B., Chen, B., Chen, Y. G., and Cui, Y. J. (2015). Investigation on gas migration in saturated materials with low permeability. Eng. Geol., 197. doi:10.1016/j.enggeo.2015.08.019
Xu, W. J., Shao, H., Hesser, J., Wang, W., Schuster, K., and Kolditz, O. (2013). Coupled multiphase flow and elasto-plastic modelling of in-situ gas injection experiments in saturated claystone (Mont Terri Rock Laboratory). Eng. Geol. 157, 55–68. doi:10.1016/j.enggeo.2013.02.005
Yang, T. H., Liu, J., Zhu, W. C., Elsworth, D., Tham, L. G., and Tang, C. A. (2007). A coupled flow-stress-damage model for groundwater outbursts from an underlying aquifer into mining excavations. Int. J. Rock Mech. and Min. Sci. 44 (1), 87–97. doi:10.1016/j.ijrmms.2006.04.012
Ye, W. M., Xu, L., Chen, B., Chen, Y. G., Ye, B., and Cui, Y. J. (2014). An approach based on two-phase flow phenomenon for modeling gas migration in saturated compacted bentonite. Eng. Geol. 169 (2), 124–132. doi:10.1016/j.enggeo.2013.12.001
Zhang, H. Y., Cui, S. L., Zhang, M., and Jia, L. Y. (2012). Swelling behaviors of GMZ bentonite–sand mixtures inundated in NaCl–Na 2SO4 solutions. Nucl. Eng. Des. 242 (1), 115–123. doi:10.1016/j.nucengdes.2011.10.042
Zhang, M., Zhang, H. Y., Zhou, L., Wang, B. M., and Wang, S. J. (2014). Hydro-mechanical analysis of GMZ bentonite-sand mixtures in the water infiltration process as the buffer/backfill mixture in an engineered nuclear barrier. Appl. clay Sci. 97-98 (8), 115–124. doi:10.1016/j.clay.2014.05.016
Zhang, Q., Ma, D., Liu, J. F., Wang, J. H., Li, X. B., and Zhou, Z. L. (2019). Numerical simulations of fracture propagation in jointed shale reservoirs under CO2 fracturing. Geofluids 2019, 1–13. doi:10.1155/2019/2624716
Zhang, Q., Ma, D., Liu, J. F., Zhang, K., and Fan, Z. Q. (2018b). Numerical studies on the failure process of heterogeneous rock material with preexisting fracture under uniaxial compression. Adv. Civ. Eng. 2018, 1–12. doi:10.1155/2018/9203549
Zhang, Q., Ma, D., Wu, Y., and Meng, F. F. (2018a). Coupled thermal− gas− mechanical (TGM) model of tight sandstone gas wells. J. Geophys. Eng. 15 (4), 1743–1752. doi:10.1088/1742-2140/aabab4
Zhang, Z., Ni, X. Q., and He, W. Y. (2024). Homogenization of a granular bentonite material upon saturation: an analysis based on pore structure evolutions. Environ. earth Sci. 83 (1), 16.1–16.13. doi:10.1007/s12665-023-11305-3
Zheng, X., Li, X., and Xu, Y. (2022). Study on the shear strength and micro-structure of Gaomiaozi bentonite under chemical conditions in a repository. Environ. Earth Sci. 81 (13), 1–11. doi:10.1007/s12665-022-10461-2
Keywords: reposition of nuclear waste, coupled hydro-mechanical model considering damage, expansion of microcrack paths, dry density, bentonite
Citation: Guo J, Zhang Q, Li Q, Li M, Chen Z, Chen J and Tang Z (2024) Study on the coupled hydro-mechanical model of gas-induced dilation effects in bentonite. Front. Earth Sci. 12:1478054. doi: 10.3389/feart.2024.1478054
Received: 09 August 2024; Accepted: 30 September 2024;
Published: 17 October 2024.
Edited by:
Hao Shi, Anhui University of Science and Technology, ChinaReviewed by:
Chaojun Fan, Liaoning Technical University, ChinaBing Qin, Army Logistic Academy, China
Copyright © 2024 Guo, Zhang, Li, Li, Chen, Chen and Tang. This is an open-access article distributed under the terms of the Creative Commons Attribution License (CC BY). The use, distribution or reproduction in other forums is permitted, provided the original author(s) and the copyright owner(s) are credited and that the original publication in this journal is cited, in accordance with accepted academic practice. No use, distribution or reproduction is permitted which does not comply with these terms.
*Correspondence: Qi Zhang, emhhbmdxaTQyOEAxMjYuY29t; Qiang Li, dGIxODAzMDAwMWI0QGN1bXQuZWR1LmNu;