- 1China First Metallurgical Construction Group, Wuhan, China
- 2School of Resources and Environmental Engineering, Wuhan University of Science and Technology, Wuhan, China
Introduction: The presence of water significantly reduces the mechanical strength of rocks and induces various engineering geological hazards. The water weakening coefficient Kp is used to quantify this effect, defined as the ratio of wet uniaxial compressive strength to the dry value.
Methods: A comprehensive physico-mechanical test was conducted on fifteen sandstones under dry and saturated conditions to predict the water weakening coefficient using easily obtainable physical parameters. Multiple linear regression was employed to establish the relationship between these parameters and the saturated water weakening coefficient.
Results: The saturated water weakening coefficient decreases with increasing porosity and increases with higher Primary wave velocity (P-wave velocity). Rocks with higher porosity but lower P-wave velocity typically absorb more water. The P-wave velocity and clay mineral content were identified as the best predictors of the saturated water weakening coefficient (R2 = 0.82). Unsaturated water weakening coefficients at any water saturation level were well estimated using a previous exponential function.
Discussion: The roles of different clay minerals and P-wave velocity in the water weakening process of rocks are comprehensively discussed. This study enhances the understanding of the water weakening mechanism and provides an improved evaluation model for the water weakening coefficient of sandstones using physical parameters.
1 Introduction
Sandstone, as a kind of typical sedimentary rock, is widely distributed on the earth’s surface and is often used as construction material due to its good cementation capacity and easy accessibility (Sun and Zhang, 2019). However, in rock engineering fields, sandstone inevitably comes into contact with water. The presence of water significantly reduces its mechanical properties, leading to geological disasters such as pillar instability (Lafrance et al., 2016), landslides (Song et al., 2018) and tunnel collapse (Yang et al., 2020). Additionally, most sandstones contain clay minerals. When these minerals absorb water, the resulting uneven stress distribution caused by the swelling of clay minerals will induce the deterioration of sandstones (Shen, 2014; Yuan et al., 2014). Therefore, it is essential to comprehensively investigate the strength change in sandstone after absorbing water in order to provide mechanical parameters for the safe design of rock engineering projects in water-prone areas.
Over the past few decades, extensive research has been conducted on the strength loss of sandstone from dry to saturated conditions. Hawkins and McConnell (1992) claimed that the maximum uniaxial compressive strength (UCS) loss at the fully saturated condition exceeded 70% after testing 35 sandstone samples. They held that the water weakening degree was primarily controlled by the mineral composition, particularly the content of quartz and clay minerals. Erguler and Ulusay (2009) further investigated the water weakening process of clay-bearing sandstones. The UCS of sandstones decreased by more than 90% after absorbing water. Tomor et al. (2024) investigated the reduction in UCS of sandstones under different moisture levels. They tested thirty-four UK Darney sandstone samples under six moisture conditions and evaluated moisture gain and loss over time. For 77 sandstones reviewed in the literature, UCS loss ranged up to 45% between oven-dry and saturated conditions, with an average loss of 20%. Wong et al. (2016) comprehensively summarized the variation of mechanical properties for different types of rocks exposed to water. They claimed that not only the strength but also the stiffness of rocks were reduced by the presence of water. Huang et al. (2022c) measured the UCS of four clay-bearing sandstones containing different water contents. The UCS of these sandstones decreased significantly when the water saturation increased from 0 to a critical water saturation, approximately 60%∼80%, however, the reduction of UCS was not remarkable beyond this critical saturation. Li et al. (2019) also held that the strength of siltstones decreased from dry to saturated conditions. They concluded that the hydration of clay minerals reduced the cohesion of samples, and the hydrolysis of quartz in the crack tip region promoted the subcritical crack propagation during the loading process. In contrast, Reviron et al. (2009) found that water had no significant effect on the strength of sandstones composed almost entirely of quartz and lacking clay minerals. Chen et al. (2017) proposed that the reduction in strength and elastic modulus of siltstone after water absorption was caused by the dissolution of cementing minerals and subsequent increasing of distance between hard particles. Cai et al. (2019) addressed that a high expansion stress would arise due to the swelling of clay minerals, which should be responsible for the propagation of existing micro-cracks and generation of new cracks. Lu et al. (2017) discussed the roles of critical saturation and clay mineral content in the water weakening effect of sandstones by using Computed tomography (CT), in which it was found that the montmorillonite had a much larger adverse effect on the internal structure and mechanical properties than low swelling clay minerals, such as kaolinite and chlorite. Siegesmund et al. (2003) investigated the damage mechanisms of water-saturated sandstone using X-ray diffraction (XRD), Cation exchange capacity (CEC), and Scanning electron microscope (SEM) experimental methods. They concluded that the intracrystalline swelling of expandable clay minerals and intercrystalline or osmotic swelling are the primary causes of damage to the sandstone. It can be concluded that the presence of water will cause the UCS reduction, and clay minerals have a significant influence on the water weakening degree of sandstones. However, the quantification relationship between the mineral component and UCS loss of sandstones after absorbing water is not fully built.
Traditional mechanical tests are time-consuming and laborious, therefore, some physical parameters by non-destructive test methods are usually adopted to estimate the UCS of rocks (Huang et al., 2022a; 2022b). Table 1 has summarized previous evaluation functions of UCS by using physical parameters in recent years. It can be found that the UCS increases with increasing the P-wave velocity and density, however, it decreases with increasing the porosity and water content. In addition, the sedimentary and mudstone with more clay mineral contents have a relatively smaller UCS according to predicted equations proposed by Gokceoglu et al. (2009) and Iyare et al. (2021). It illustrates that many physical parameters have significant influences on the UCS of rocks, including the P-wave velocity, density, porosity, clay mineral content and water content. In Table 1, the linear function, power function and exponential function are the most widely used functions to estimate UCS. However, most of the evaluation equations in Table 1 only use one physical parameter. The determination of the best subset of physical parameters to accurately predict the water weakening coefficient of sandstones after absorbing water need further study. In addition, the contribution of clay minerals to the water weakening degree is also not clear.
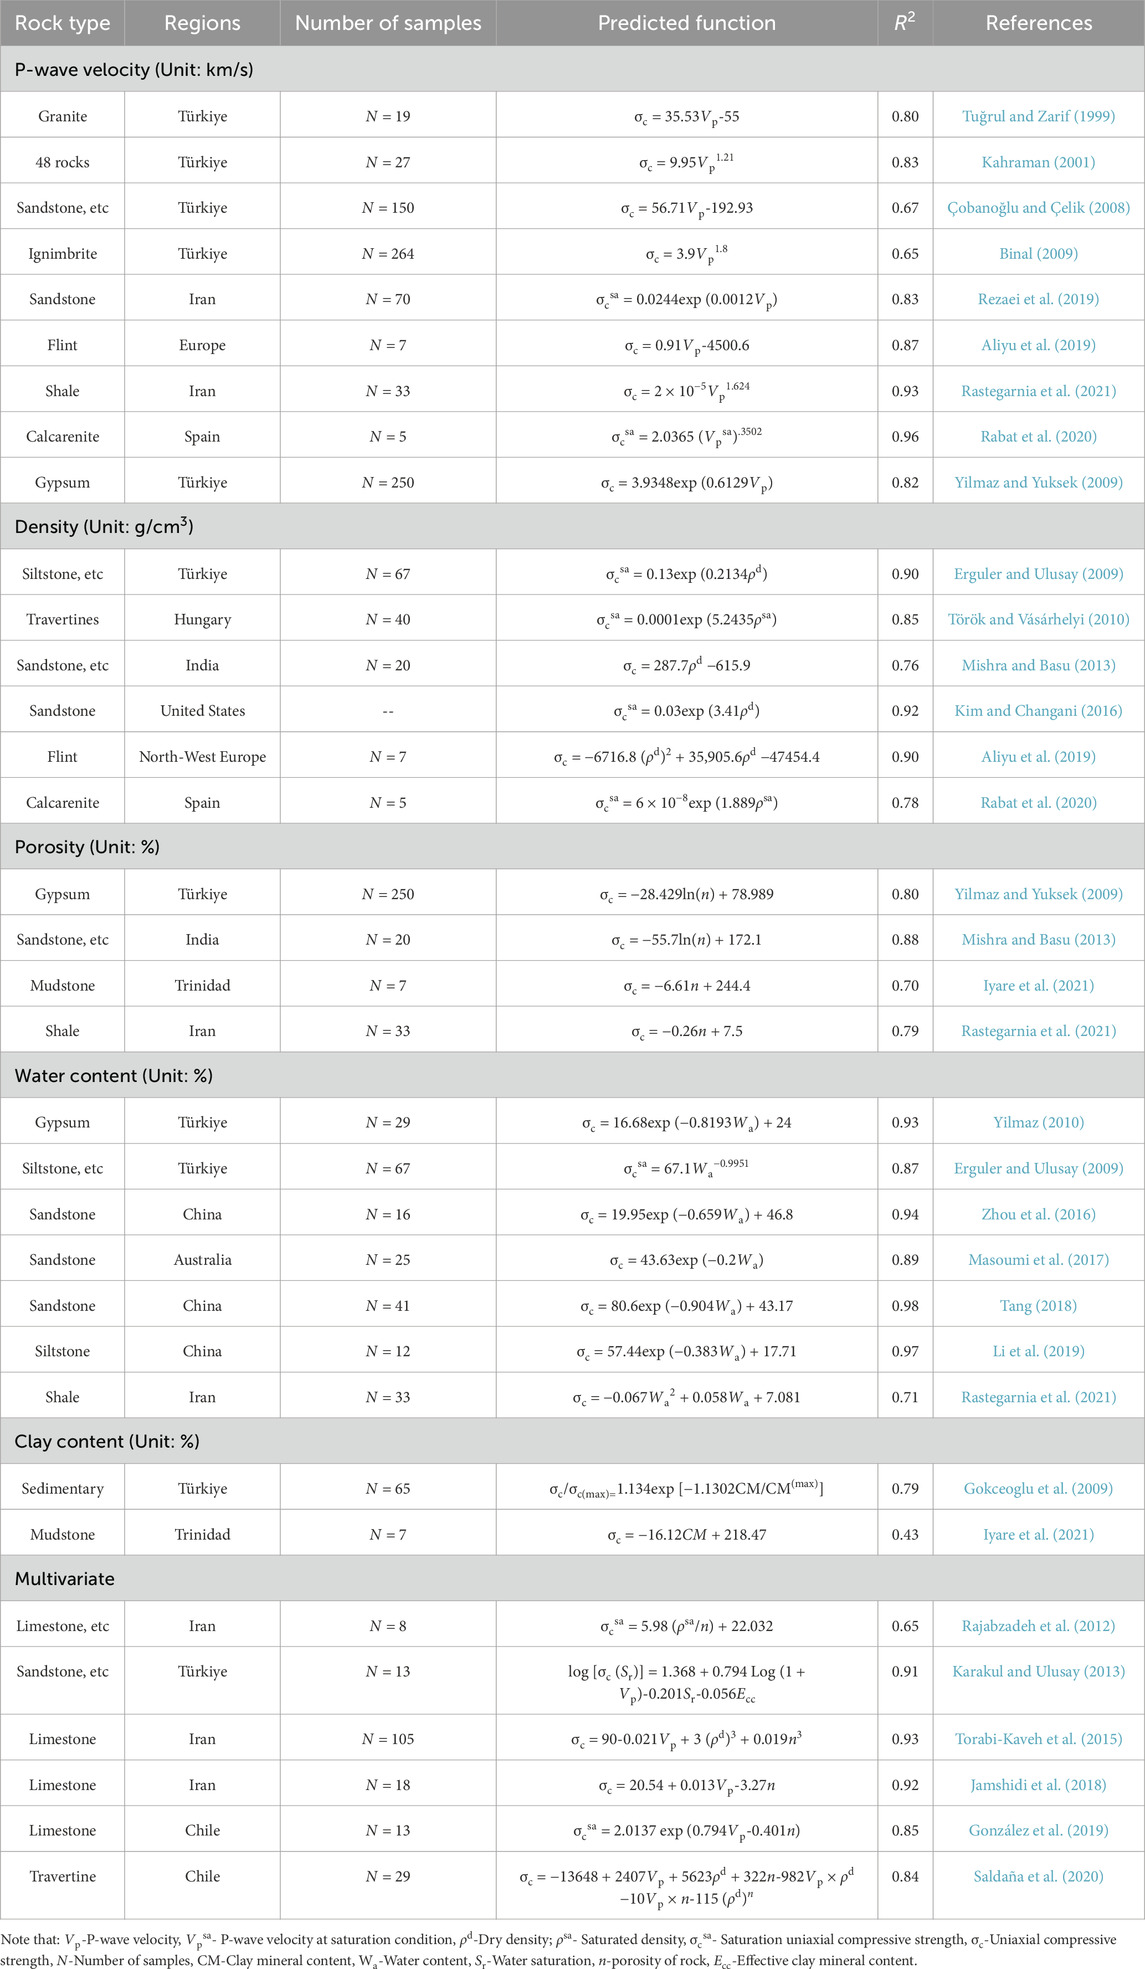
Table 1. Representative evaluation functions of UCS by using different non-destructive physical parameters.
2 Experimental procedure
2.1 Sample preparation
Fifteen kinds of sandstones with different initial physico-mechanical properties were used in this study. They were collected from some rainy regions, including Dali in Yunnan Province (AAR = 870 mm), Hangzhou in Zhejiang Province (AAR = 1,930 mm), Xi’an in Shannxi Province (AAR = 1,067.9 mm), Zigong in Sichuan Province (AAR = 1,223 mm) and Yichang in Hubei Province (AAR=1,216 mm). All sandstone samples were drilled from large sandstone blocks in order to avoid the discreteness caused by geological formation. All sandstone samples were drilled by using a coring drill with an internal diameter of 50 mm, then cylindrical cores were cut to the height of 100 mm by using a cutter. According to the suggested method by ASTM, D4543-08, (2008), both ends of the sample were polished, and the flatness should be less than 0.025 mm. Therefore, these cylindrical samples are 50 mm in the diameter and 100 mm in the height.
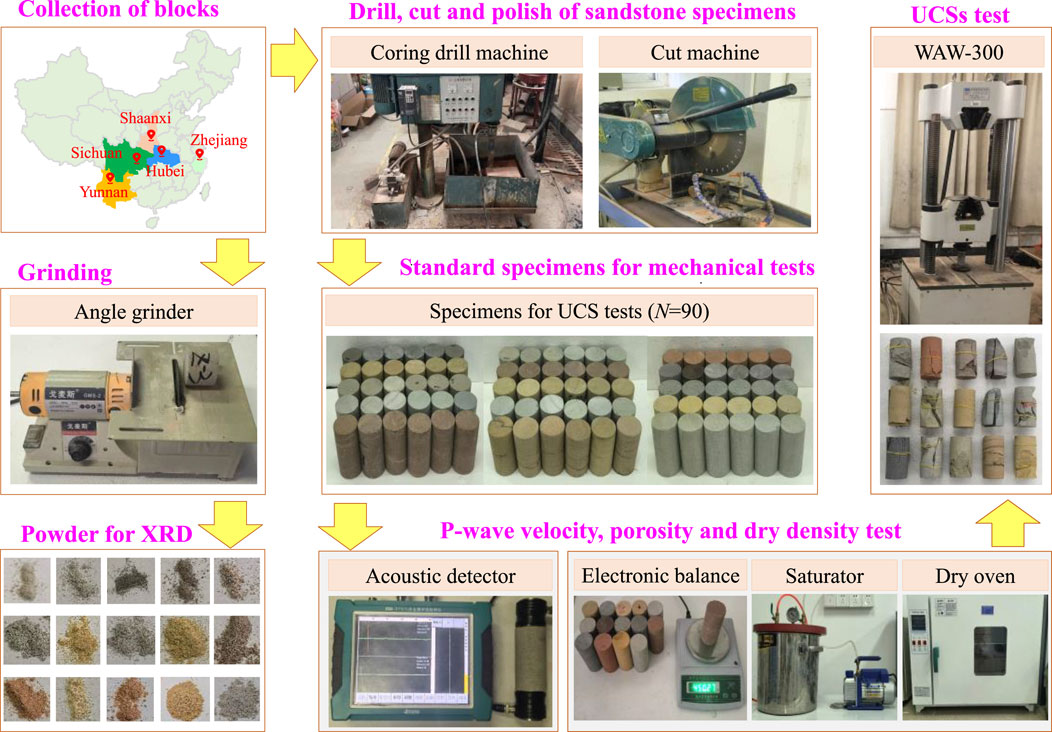
In this experiment, both the dry and saturated UCS were measured. To avoid test errors caused by the discreteness of samples, three parallel tests were conducted on the same condition. Therefore, 90 standard cylindrical samples were prepared in total. First, the samples were dried in a forced convection drying oven (model 101-2B) at 105°C for 48 h. Subsequently, half of the standard specimens were placed in a forced saturator under a vacuum of −0.1 MPa for 48 h to achieve full saturation (ASTM, D4543-08 2008). To avoid moisture exchange between samples and the environment, all the fully dried samples were sealed in plastic bags and fully saturated samples were wrapped by plastic films before the test. The preparation procedure of cylindrical sandstone samples and powder are shown in Figure 1.
2.2 Petrographic analysis
Several fragments from fresh sandstone blocks were ground into powders by using an angle grinder (<45 um). Powders were dried in a heating oven at 105°C for 48 h, and used to analyze the minerals by a TTR III X-ray diffraction (XRD). The mineral composition was quantified according to the standard SY/T 5163-2018 (2018).
2.3 Physico-mechanical tests
Porosities of these sandstone samples were measured by using the vacuum saturation method. First, the drying mass was tested by using a high-precision electronic balance with an accuracy of 0.01 g. When these samples were completely saturated in a forced saturator, masses of them were measured again. Then the porosity can be calculated as follows:
In Equation 1 n (%) is the porosity of rock, Msa is the mass of completely saturated sample, Md is the mass of completely dry sample, and Vs is the volume of standard sample.
After deriving the porosity, the dry density of rock can be calculated by Equation 2 as below:
P-wave velocities at the completely dry and saturated conditions were also monitored by using a non-metallic acoustic detector (RSM-SY5T). The transmitters and receivers at both ends of the standard sandstone sample need to be interchanged and the average value was adopted in order to reduce the measurement error.
The UCS of these sandstones were tested after measuring the porosity and P-wave velocity. The UCS tests were performed on an electro-hydraulic servo-mechanical machine (WAW-300) with a loading rate of 0.24 mm/min according to the method recommended by ASTM D7012-10 (2010). The test machine and samples for UCS can be observed in Figure 1.
3 Experimental results
3.1 Petrographic characteristics
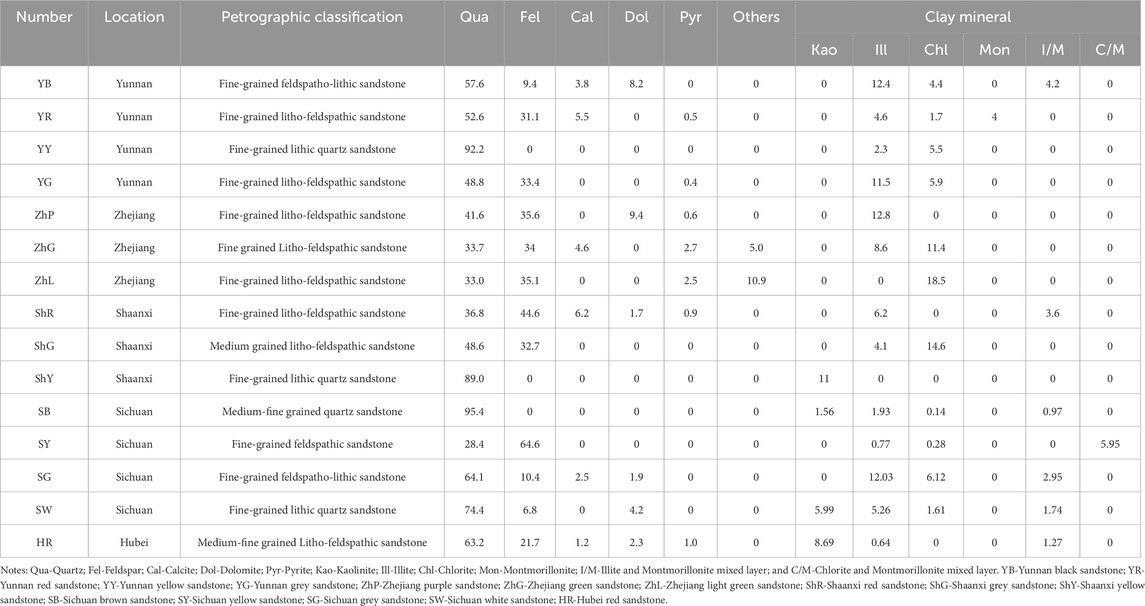
Mineral components of these sandstones were quantified by the XRD method. In addition, the particle size and their cemented structure were captured by using a 3D color optical microscope (Keyence, VHX-5000). These sandstones were divided into several geological types, according to the famous classification method based on the quartz-feldspar-rock fragments triangle as listed in Table 2 (Folk, 1968; Garzanti, 2019). It is evident that YB and SG are feldspatho-lithic sandstones, which have the debric contents more than feldspar. YR, YG, ZhP, ZhL, ShR, ZhG, HR and ShG are litho-feldspathic sandstones with more feldspar. YY, ShY and SW are the lithic quartz sandstones with quartz more than 75%. SB is the typical quartz sandstone with quartz more than 95%. SY is the feldspathic sandstone, because the ratio of feldspar to the debric is larger than 3:1. All of these sandstones contain some clay minerals, mainly including illite and chlorite. The quartz contents are from 28.4% to 95.4%, and the total clay mineral contents of these sandstones are from 4.6% to 21.1%. Moreover, the red sandstone from Yunnan province (YR) has 4% montmorillonite. It should be noted that the montmorillonite is a kind of high expansion clay minerals. Above all, these 15 sandstones are representative and cover the general range of typical clay-bearing sandstones.
3.2 Physico-mechanical properties
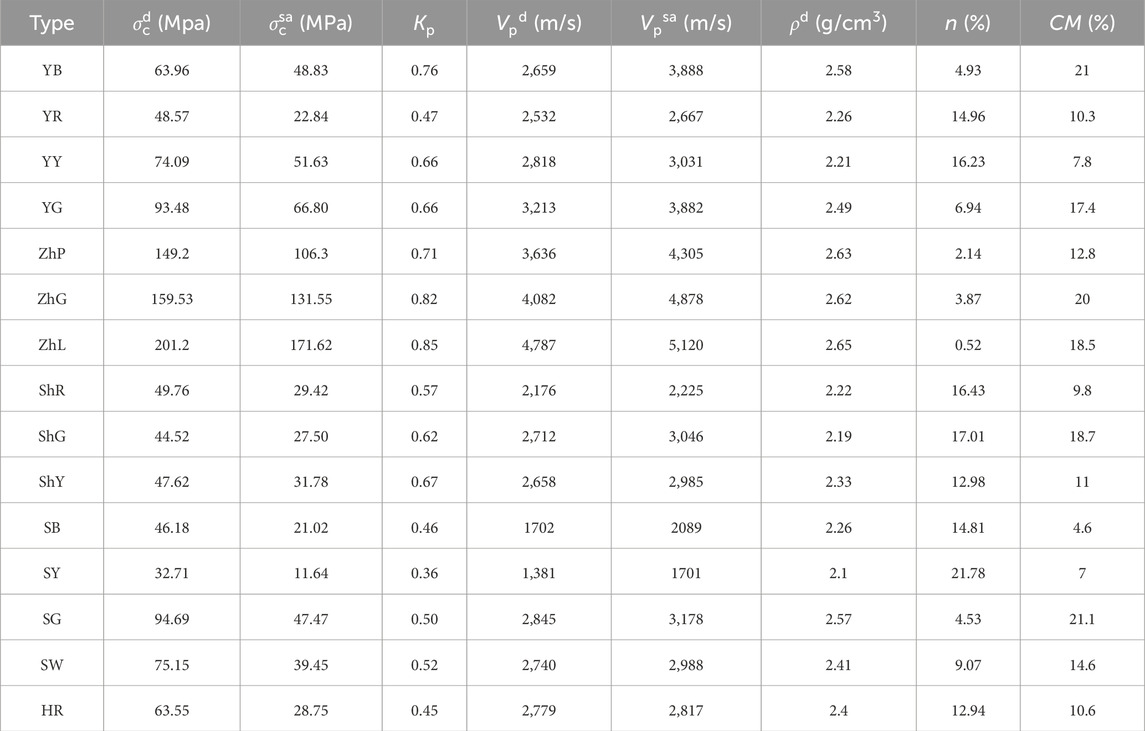
Basic physico-mechanical properties of these sandstones are derived and listed in Table 3. Both the high porous sandstone and intact sandstone are used, which have porosities from 0.52% to 19.46%. The P-wave velocities of these sandstones at the dry state vary from 1,381 m/s to 4,787 m/s. At the saturated state, they have a significant increment ratio from 1.4% to 46.2%. After completely saturated, the largest increment is 46.2% for the YB and the smallest increment is only 1.4% for the HR (Figure 2A). The P-wave velocity of water is approximately 1,400 m/s, which is much larger than that of air (Williams, 1996). Therefore, when voids are occupied by the liquid water, the P-wave velocity of the porous sandstone will be improved. In addition, both of dry and saturated P-wave velocities display a reduction trend with increasing the porosity for these sandstones, however, the increment ratio of P-wave velocity from dry to saturated conditions against the initial porosity is not remarkable.
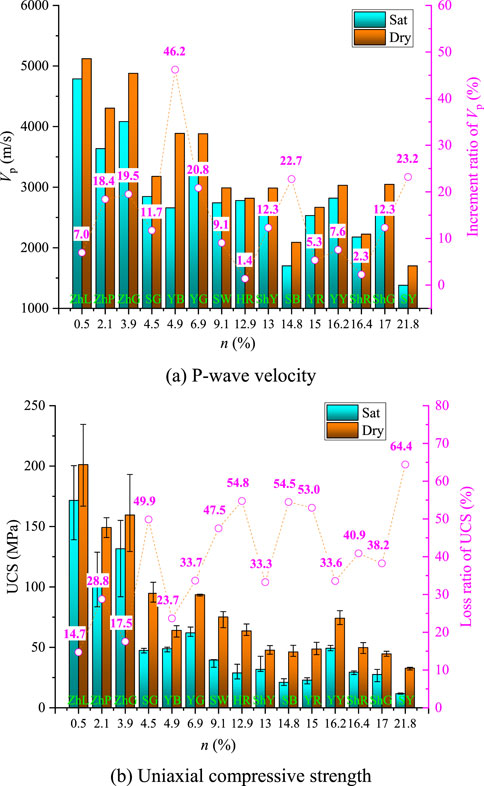
Figure 2. Water-induced change of common physico-mechanical propertie. (A) P-wave velocity (B) Uniaxial compressive strength.
Figure 2B shows that the mean UCS of these sandstones decreases rapidly from dry to fully saturated state due to the water weakening effect. The largest reduction is 64.4% for the SY and the smallest decrease is approximately 14.7% for the ZhL. The reduction ratio of UCS does not have a stable correlation with the porosity. Generally, a larger porosity implies more water will be absorbed into rocks and thus a greater water weakening damage occurs. However, not only the water absorption ability but also the mineral composition may influence the water weakening degree. Therefore, the relationship between the water weakening coefficient and potential influencing physical parameters should be investigated and built.
The saturated water weakening coefficient of sandstone is defined as follows:
Where
The actual value of Kp is from 0 to 1. A smaller value of Kp represents a larger water weakening damage. The minimum saturated water weakening coefficient is 0.36 for SY and the maximum value is approximately 0.85 for ZhL. In Table 3, porosities of SY and ZhL are 21.78% and 0.52%, respectively. It indicates that the sandstone SY has absorbed more water than ZhL, although the total clay mineral content of ZhL is much larger. In addition, the sandstone YR has 4% expansive montmorillonite as shown in Table 2, which may be another reason for causing the remarkable reduction of UCS after completely saturated. The expansive montmorillonite can induce more serious water weakening damage than the non-expansive clay minerals, therefore, the saturated water weakening coefficient is only 0.47 for YR. It can be concluded that the mineral composition and absorbed water content have remarkable influence on the UCS loss of sandstones.
3.3 Correlation between the saturated water weakening coefficient with the physical parameter for sandstones
It has been summarized that the P-wave velocity, density, and porosity are usually used to estimate the strength of rocks in Table 1. The relationship between the Kp and single physical parameter is plotted in Figure 3. Figure 3A shows that Kp linearly increases with increasing the P-wave velocity, and the determination coefficient is 0.77. This implies that the P-wave velocity is a potential physical parameter to estimate the water weakening coefficient of sandstones. Although the saturated water weakening coefficient also displays a linear increasing trend against the dry density, the discreteness is a little high and the determination coefficient is only 0.39 (Figure 3B). On the opposite, Kp linearly decreases with increasing the porosity (Figure 3C). It is evident that the sandstone with a high porosity usually has a low density and P-wave velocity, and more water will be absorbed inside the sandstone. Therefore, the high porosity sandstone will suffer much more serious water weakening, and thus causes a greater reduction of UCS. Figure 3D shows that the water weakening coefficient is positively correlated with the clay mineral content, which seems contrary to the popular expectation. Actually, only the wet clay minerals after absorbing water will cause the reduction of UCS. For instance, the ZhL Sandstone has a clay mineral content of 18.5% but a porosity of only 0.52%. The absorbed water is too low to cause the swelling and hydrolysis of all clay minerals. Therefore, only these water-contained clay minerals will contribute to the reduction of strength. Karakul and Ulusay (2013) proposed the concept of effective clay mineral content (Ecc) to describe the coupling effect of porosity and clay mineral content on the strength loss of rocks as follows:
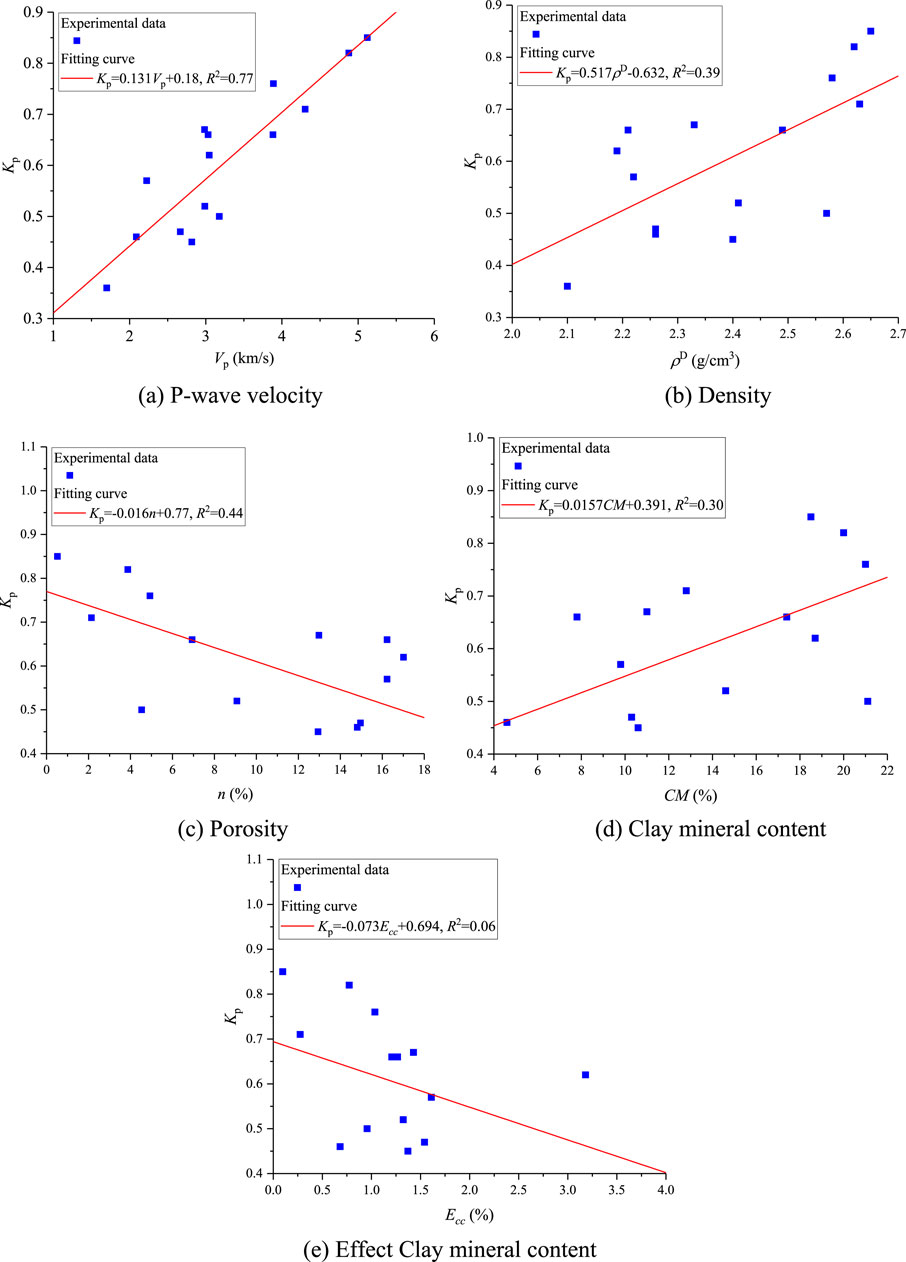
Figure 3. Correlation of Kp with the physico-mechancial parameters. (A) P-wave velocity (B) Density (C) Porosity (D) Clay mineral content (E) Effect Clay mineral content.
In Equation 4, n is porosity, CM is the content of clay mineral. The statistical relationship between Ecc and Kp for present sandstones is potted in Figure 3E. Although Figure 3 displays a linear relationship between the initial physical parameter with the water weakening coefficient, determination coefficients are very small. It is illustrated that only one physical parameter is not accurate enough to estimate the water weakening coefficient. Therefore, the multiple linear regression method may be more suitable to determine the best combination of physical parameters.
4 Evaluation of water weakening coefficient by using physical parameters
4.1 Saturated water weakening coefficient
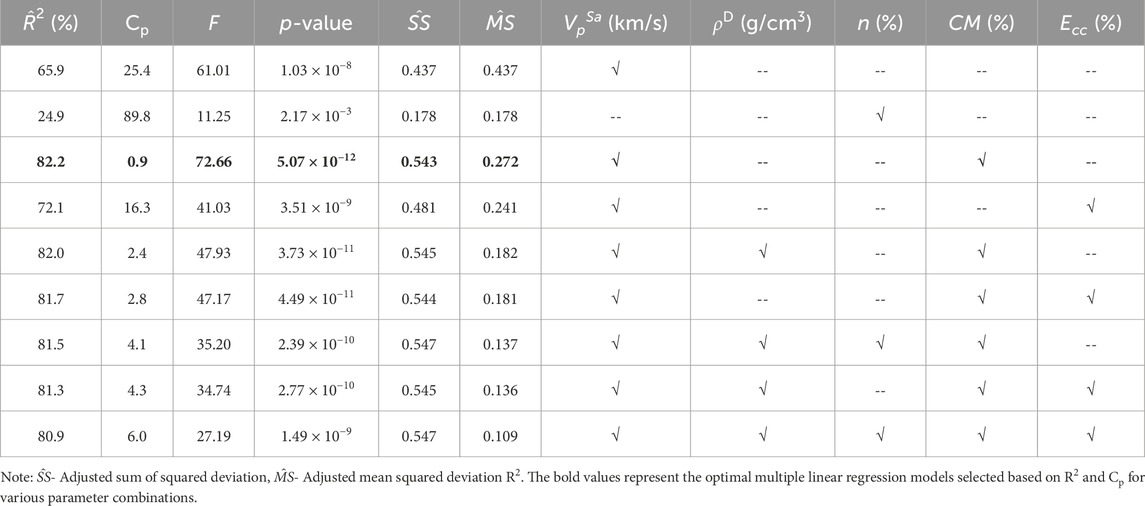
To identify the optimal subset of physical parameters for estimating the saturated water weakening coefficient, the multiple linear regression was adopted due to its simplicity, interpretability, ability to handle multiple independent variables, and strong predictive performance. Multiple linear regression analysis was carried out by combining with more experimental data from the previous studies (Table 4). In Table 4, the saturated UCS of sandstones are from 0.69 MPa to 88 MPa, and the clay mineral contents are in the range of 0 ∼ 47%. Therefore, these sandstones are representative and cover a wide range from soft to hard ones. The adjusted R2 and Mallows’ CP values can be used to evaluate the degree of correlation and determine the best subset. It is evident that the best fit has the highest adjusted R2 but the lowest CP.
In Equation 5 adjusted R2 is used to eliminate the effect of independent variable number as below:
In Equation 6
Cp is defined as a criterion for assessing the goodness of fit when comparing models with different parameters. It is defined as follows:
where RSSp represents the residual sum of square error for a model with q independent variables, and
Table 5 was generated using multiple linear regression models constructed in Minitab software. By inputting the data from Table 4, various parameter combinations were selected based on the
In Equation 7 β0, β1 and β2 are coefficients, which have been listed in Table 6.
Therefore, the final optimal linear evaluation function of the water weakening coefficient for sandstones can be expressed as
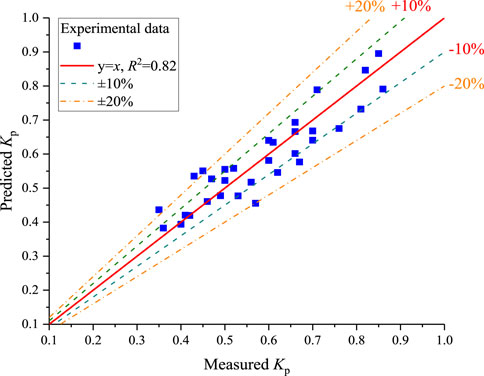
Equation 8 shows the water weakening coefficient of sandstone is proportional to the P-wave velocity and inversely proportional to the content of clay minerals. It means that the clay-bearing sandstone with a small P-wave velocity but high clay mineral content is more sensitive to water. Figure 4 shows that estimated values of Kp by using Equation 8 are in good agreement with actual measured values of Kp. The water weakening coefficients of these sandstones range from 0.35 to 0.86, but all evaluation errors are almost less than 20%, therefore, Equation 8 is applicable to estimate the saturated water weakening coefficient of clay-bearing sandstones.
4.2 Unsaturated water weakening coefficient
The traditional water weakening coefficient is used to estimate the UCS loss from dry to completely saturated conditions. However, the engineering rock mass may be not fully saturated in the field (Tang, 2018; Masoumi et al., 2017; Liu et al., 2020; Kim et al., 2017). Although some scholars have measured the UCS change of sandstones at different water saturations (Zhou et al., 2016, Jia et al., 2018; Huang et al., 2022b), how to estimate the unsaturated water weakening coefficient by using non-destructive physical parameters is still not clear. Huang et al. (2022c) developed an exponential function for estimating the UCS of sandstones with different water saturations as below:
If only physical parameters are used as the best subset, the unknown parameter A can be expressed by the porosity and clay mineral content based on the multiple linear regression method as follows (Huang et al., 2022c):
It should be noted that the porosity is adopted in Equation 10 instead of the P-wave velocity, because the P-wave velocity is not provided as the potential optimal parameter due to the lack of enough data in the previous literature (Huang et al., 2022c).
Substituting Equation 3 into Equation 9, yields
where
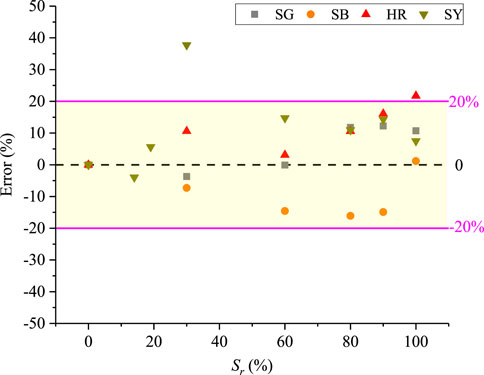
In this study, the UCS of SG, SB, HR and SY sandstones with different water contents were measured, and essential parameters for these sandstones are listed in Table 3. Substituting values of porosity and clay mineral content into Equation 10, A can be derived. Then, the unsaturated water weakening coefficient can be further predicted by substituting the value of A into Equation 11. Figure 5 shows that predicted unsaturated water weakening coefficients are in good agreement with experimental values. They reduce with increasing the water saturation. In Tables 3, 4, it can be found that the UCS of these sandstones range from 11.64 MPa to 47.47 MPa, therefore, the water weakening degrees of soft and medium hard sandstones can be well estimated. The evaluation error of unsaturated water weakening coefficient against the water saturation is plotted in Figure 6. It shows that almost all the predicted errors are smaller than 20%. It should be noted that some evaluation errors may be a little large for some points, because the accurate quantification of some parameters is very hard. For instance, the determination of the clay mineral content by the XRD method is influenced by the analysis experience of the technician. Nevertheless, the quantitative correlation between unsaturated water weakening coefficients at any water saturation with physical parameters is well built.
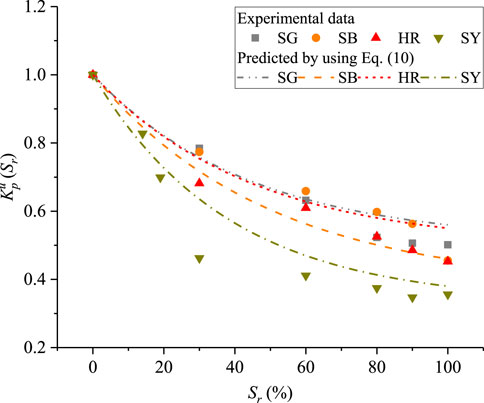
Figure 5. Comparison between the experimental and predicted water weakening coefficient at different water saturations.
5 Discussion
5.1 Water weakening mechanism of clay minerals by microscopic simulation
It is evidenced that the saturated water weakening coefficient of sandstones can be estimated by using the saturated P-wave velocity and clay mineral content in this study. The weight coefficient for the clay mineral content is approximately −0.536. In Table 3, 4, the maximum clay mineral content is from 0% to 47% for these sandstones. 47% clay mineral content can cause the reduction of Kp by 0.25 from Equation 8. It illustrates that the presence of clay minerals is an important factor influencing the water weakening degree of sandstones. Although the statistical relationship between the strength loss and physical parameters already confirmed the critical role of clay minerals, the water weakening mechanism of different clay minerals in sandstones are not fully understood. The crystalline layer dissolution of clay minerals induced by water is in a nano-scale (layer spacing ≤2 nm), therefore, the existing measurement method is difficult to describe the swelling behavior in such a small spacing range (Pradhan et al., 2015). The molecular dynamics (MD) simulation method may be a suitable tool to investigate the hydration process of clay minerals, because it can explain the changes in lattice spacing and mechanical properties of clay minerals at a microscopic level after water absorption, and it also quantitatively helps us understand the swelling and softening mechanism of clay minerals when encountering water (Zhang et al., 2018; Ren et al., 2022). The response of mechanical strengths of crystals during the hydration process also can be analyzed to gain insight into the micro-kinetic mechanism of clay hydration.
5.1.1 Construction of the molecular model
In order to simulate the water hydration process of typical clay minerals (montmorillonite, illite, kaolinite and chlorite), the specific parameters for molecular modelling are referred to Skipper et al. (1995), Drits et al. (2010), Bish (1993), and Joswig et al. (1989), respectively. In this study, water molecules are represented by the SPC/E water model (Berendsen et al., 1987). Some typical equilibrium diagrams containing clay molecule and adsorption water molecule are given in Figure 7. The bulk and shear module of clay mineral crystals after geometric optimization are calculated by the Forcite module.
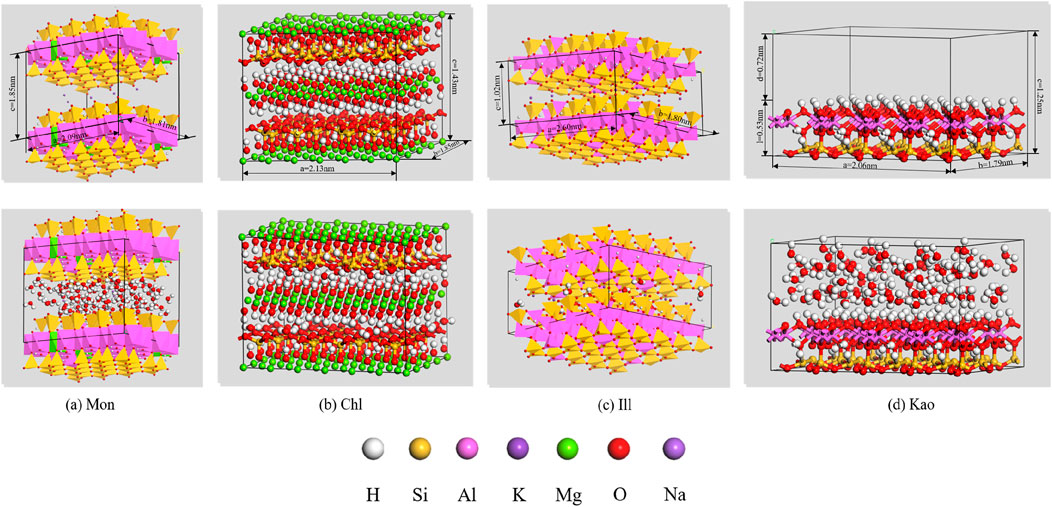
Figure 7. Schematic diagram of water adsorption equilibrium for typical clay minerals [(A–C)- Crystal size parameters; (D)-Vacuum layer: L-Crystalline layer].
5.1.2 Simulation results
By simulation, it is evidenced that the maximum number of water molecules absorbed inside the molecular interlayer are 96, 30, 12, and 0 for the montmorillonite, chlorite, illite and kaolinite, respectively. Therefore, the water adsorption capacity in different clay minerals decreases as the following order: montmorillonite > chlorite > illite > kaolinite. As shown in Figure 7, water molecules in the kaolinite structure are mostly concentrated in the vacuum layer, while only a small amount of water molecules are adsorbed on the surface of the crystal layer and no water molecule can enter into the kaolinite crystal. Therefore, the water weakening of kaolinite is only caused by the surface hydration, which is different from the other clay minerals. Liu et al. (2021) suggested that the radius of the silica-oxygen tetrahedral ring for illite was similar to the hydration radius of K+, which usually occurs on the surface of the crystal. When K+ adsorbs a certain amount of water molecules, it can be firmly embedded in the pores of illite crystals. The illite has a relative smaller ability to absorb water molecules into illite crystals than the montmorillonite, which effectively reduces the degradation effect of hydration in illite.
Figure 8 shows that both of the microscopic bulk modulus (K) and shear modulus (G) for different clay minerals show a decreasing trend with the increasing of absorbed water molecules. The reduction ratios of the mineral moduli are montmorillonite > illite > chlorite > kaolinite. The montmorillonite has the largest reduction ratio of microscopic modulus, because it belongs to the expansive clay mineral, in which most of the water molecules will be absorbed inside the molecular interlayer. The expansive ratio is more than 20 times for the sodium montmorillonite. As a result, the microscopic bulk modulus and shear modulus have reduced by more than 50.3% and 61.6% after reaching the maximum water content, respectively. The reduction of mineral modulus of the kaolinite is the smallest, because the interlayer of molecules is too narrow to absorb water molecules. The reduction ratio in mechanical parameters during the hydration of clay crystals almost is consistent with the macroscopic water absorption of clay minerals. The reduction ratios of mineral moduli for illite and chlorite are very close.
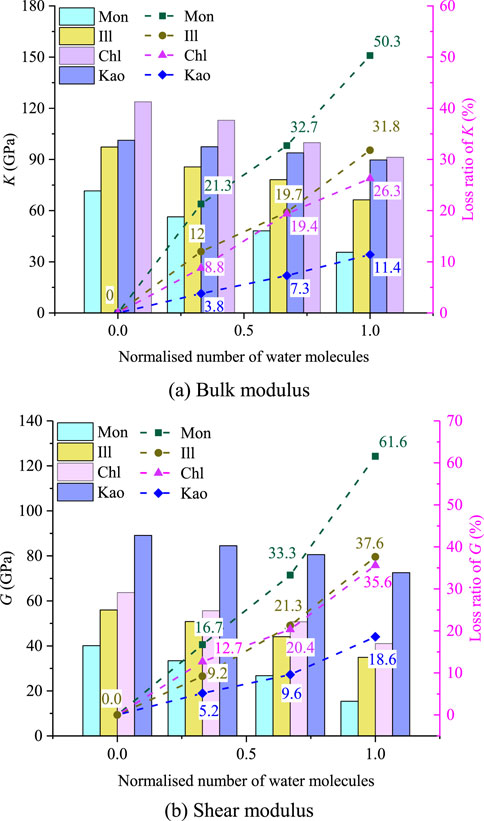
Figure 8. Variation of microscopic mechanical parameters for clay minerals after water absorption. (A) Bulk modulus (B) Shear modulus.
In Table 3, the first seven sandstones with the fastest reduction rate of water weakening coefficient are: SY>HR>SB>YR>SG>SW>ShR. All of these sandstones contain some montmorillonite (I/M or C/M) as shown in Table 2. However, the montmorillonite and its mixed layer are absence for almost all the other sandstones, which have higher water weakening coefficients. It further illustrates that the presence of montmorillonite can induce a much more water weakening degree and thus result in a greater reduction of UCS. It should be noted that the YB sandstone has 4.2% I/M but a high water weakening coefficient of 0.76. There may be two reasons for the low water weakening degree of YB. First, the porosity of YB is only 4.93%, therefore, only a little water will be absorbed into YB. In addition, the montmorillonite only occupies 5% of the total I/M mixed layer. It also illustrates that the montmorillonite plays a much more important role in the water weakening degree of sandstones.
5.2 Effect of the P- wave velocity
It is evidenced that the porous sandstone can absorb more water than intact sandstones at the completely saturated condition, because voids provide space for liquid water, and increase the contact area between liquid water and mineral particles, particularly the clay minerals. In Section 4.1, the P-wave velocity, instead of the porosity, is automatically selected as one parameter in the best subset by the linear regression method, which may be caused by two reasons:
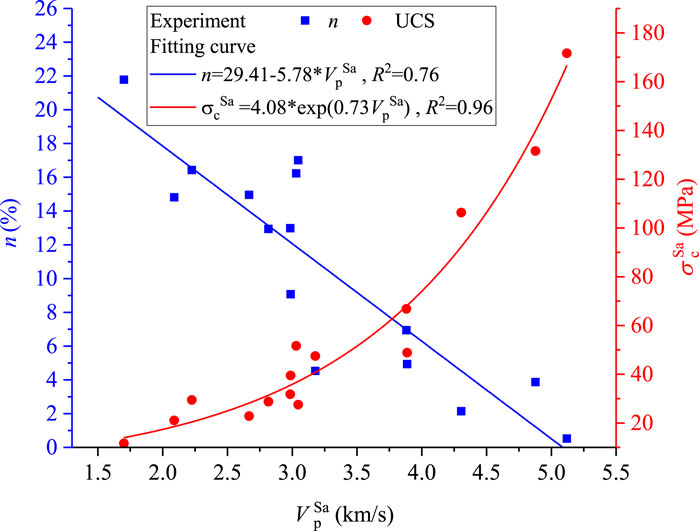
First, P-wave velocity has a strong linear relationship with the porosity of sandstone. Figure 9 shows that the porosity linearly decreases with increasing saturated P-wave velocity for sandstones. In addition, the pore structure is very complex and the porosity cannot characterize the pore size distribution (Huang and Yu, 2022). It illustrates that the P-wave velocity may be a better parameter to reflect the compactness and water absorption ability of rocks than the porosity. Secondly, the P-wave velocity of porous rocks can reflect the mineral composition which has been interpreted in typical geo-acoustic models (Ji et al., 2003; Lyu et al., 2020). The mineral modulus and P-wave velocity of the main minerals in sandstones are listed in Table 7. The clay mineral and quartz are more sensitive to water, but they have much smaller P-wave velocities. Therefore, they can cause more serious damage in rocks after contacting with water. In addition, the cementation strength among the mineral particles also has a remarkable influence on the P-wave velocity of the rock matrix (Dvorkin et al., 1994; Jarrard et al., 2000). A weak cementation of mineral particles will cause the reduction of P-wave velocity and more water may be absorbed into the matrix to attack minerals. Actually, the P-wave velocity has a significant correlation with UCS as show in Figure 9. The sandstone with a higher P-wave velocity usually has a larger saturated UCS. Above all, the P-wave velocity may be a more comprehensive parameter to quantify the water weakening degree than the porosity.
5.3 Limitations of sandstones in this study
In this study, we selected 15 sandstone samples to represent a broad range of typical sandstones containing clay minerals. The quartz content of these sandstones ranges from 28.4% to 95.4%, while the total clay mineral content ranges from 4.6% to 21.1%. Additionally, these sandstones vary widely in hardness, including feldspathic litharenite, lithic quartz sandstone, and typical quartz sandstone. Therefore, these samples are somewhat representative, particularly for studying the impact of clay mineral content on sandstone mechanical properties.
Although it is widely accepted that clay mineral content can cause the mechanical weakening of rocks when in contact with water, the influence of specific clay mineral compositions remains underexplored (Cherblanc et al., 2016). Furthermore, the representativeness of these samples on a global scale is limited. Firstly, the clay minerals commonly found in Chinese sandstones include kaolinite, montmorillonite, illite, chlorite, and a small amount of randomly interstratified clays (Liu et al., 2003). In contrast, the clay mineral compositions of sandstones abroad exhibit greater diversity. For example, North American sandstones often contain significant amounts of bentonite. The bentonite is a kind of swelling clay primarily composed of montmorillonite with excellent water absorption and plasticity, therefore, it provides unique industrial applications (Thair and Olli, 2008). These compositional differences result in notable variations in the chemical properties, adsorption capacity, and stability of clay minerals, therefore, the water weakening process by considering the composition of international clay minerals should be further investigated.
Secondly, the genesis of sandstones is closely related to their depositional environment. Chinese sandstones primarily form in river and delta environments, reflecting relatively stable sedimentary processes (Liu et al., 2003). In contrast, sandstones abroad, such as those in North America and Western Europe, are often derived from volcanic or glacial sediments, leading to significantly different physical and chemical properties compared to Chinese sandstones (Thair and Olli, 2008). These genesis differences may cause variations in water weakening of sandstone.
Furthermore, there are significant differences in sedimentary structures between Chinese and foreign sandstones. China, located at the junction of several tectonic plates with frequent seismic activity, often exhibits seismic sedimentary structures in sandstone research. In regions with less seismic activity, such structures may be less prominent (Feng et al., 2016). Chinese sandstones typically show good sorting, meaning the grain size distribution is relatively uniform. This characteristic is common in river and lake sedimentary environments and helps sandstones remain stable during weathering and erosion. In contrast, sandstones from volcanic or glacial environments abroad may exhibit poorer sorting and uneven grain size distribution (Collinson and Mountney, 2019). For example, in the Middle East, due to an arid climate and intense sedimentary processes, sandstones often have coarser layering and poorer sorting (Glennie, 2010). These structural differences can significantly impact sandstone stability and durability under various conditions and present challenges for cross-regional applications.
Currently, the sandstone samples used in our research mainly come from specific regions in China, making the results more applicable to Chinese sandstone characteristics. The international applicability of these findings still needs further validation. Differences in geological backgrounds, climate conditions, and sandstone formation processes across regions may lead to significant variations in physical, chemical, and mechanical properties. To address this limitation, future research will expand to other regions, exploring the performance of different sandstones in various applications and conducting a comparative analysis of the advantages and disadvantages of Chinese versus foreign sandstones in specific applications.
6 Conclusion
Based on this research, the following conclusions can be obtained.
(1) The water weakening coefficient is an important index to evaluate the water weakening degree. It is time-saving and economic to estimate this critical coefficient by using non-destructive physical parameters. Although there is a certain statistical correlation between the saturated water weakening coefficient with the P-wave velocity, porosity, density and effective clay mineral content, only one physical parameter is not adequate to estimate the saturated water weakening coefficient.
(2) The P-wave velocity and clay mineral content are automatically selected as the best subset to estimate the saturated water weakening coefficient by the linear regression method, in which the adjust R2 is 82%. The estimation errors are almost less than 20% for these 32 sandstones. Therefore, the equation we proposed (Equation 8) is applicable for estimating the saturation water weakening coefficient of clay-containing sandstone. Based on this, we believe that our findings are also applicable to other clay-containing sandstones.
(3) It has been proved that clay minerals are seriously damaged after absorbing water by using the molecular dynamics (MD) simulation method, therefore, they should be responsible for the UCS loss of sandstones when contacting with water. The montmorillonite plays a much more important role in the water weakening degree of sandstones than the other clay minerals. In addition, the P-wave velocity may be a more comprehensive index to quantify the water weakening degree than porosity, because it can comprehensively reflect the effect of the pore volume, the cementation of mineral particles and their components.
(4) The unsaturated water weakening coefficient at different water saturations are estimated by using the common physical parameters based on an exponential strength function. The decreasing rate of unsaturated water weakening coefficient is dependent of the porosity and clay minerals. The water weakening coefficient of the sandstone with a large porosity and more clay minerals decreases more quickly against the water saturation.
Data availability statement
The original contributions presented in the study are included in the article/supplementary material, further inquiries can be directed to the corresponding author.
Author contributions
JX: Data curation, Investigation, Resources, Validation, Writing–original draft, Writing–review and editing. SH: Conceptualization, Data curation, Formal Analysis, Funding acquisition, Investigation, Methodology, Resources, Validation, Visualization, Writing–original draft, Writing–review and editing. SY: Data curation, Validation, Writing–original draft. SZ: Data curation, Project administration, Resources, Writing–original draft. JS: Conceptualization, Data curation, Methodology, Project administration, Writing–original draft.
Funding
The author(s) declare that financial support was received for the research, authorship, and/or publication of this article. This work was supported by National Natural Science Foundation of China (Grant Nos 42072300 and 41702291), Project of Natural Science Foundation of Hubei Province (Grant No. 2021CFA094). This work was supported by “The 14th Five Year Plan” Hubei Provincial advantaged characteristic disciplines (groups) project of Wuhan University of Science and Technology (Grant No. 2023A0303).
Conflict of interest
The authors declare that the research was conducted in the absence of any commercial or financial relationships that could be construed as a potential conflict of interest.
Publisher’s note
All claims expressed in this article are solely those of the authors and do not necessarily represent those of their affiliated organizations, or those of the publisher, the editors and the reviewers. Any product that may be evaluated in this article, or claim that may be made by its manufacturer, is not guaranteed or endorsed by the publisher.
References
Al-Ani, T., and Sarapää, S. (2008). Clay and clay mineralogy. Physical-chemical Prop. Industrial Uses.
Aliyu, M. M., Shang, J., Murphy, W., Lawrence, J. A., Collier, R., Kong, F., et al. (2019). Assessing the uniaxial compressive strength of extremely hard cryptocrystalline flint. Int. J. Rock Mech. Min. Sci. 113, 310–321. doi:10.1016/j.ijrmms.2018.12.002
ASTM, D4543-08 (2008). Standard practices for preparing rock core as cylindrical test specimens. West Conshohocken: ASTM Int.
ASTM, D7012-10 (2010). Standard test method for compressive strength and elastic moduli of intact rock core specimens under varying states of stress and temperature. West Conshohocken: ASTM Int.
Berendsen, H. J. C., Grigera, J. R., and Straatsma, T. P. (1987). The missing term in effective pair potentials. J. Phys. Chem. 91, 6269–6271. doi:10.1021/j100308a038
Binal, A. (2009). Prediction of mechanical properties of non-welded and moderately welded ignimbrite using physical properties, ultrasonic pulse velocity, and point load index tests. Q. J. Eng. Geol. Hydrogeology 42, 107–122. doi:10.1144/1470-9326/07-067
Bish, D. L. (1993). Rietveld refinement of the kaolinite structure at 1.5 K. Clays Clay Min. 41, 738–744. doi:10.1346/CCMN.1993.0410613
Cai, X., Zhou, Z., Liu, K., Du, X., and Zang, H. (2019). Water-weakening effects on the mechanical behavior of different rock types: phenomena and mechanisms. Appl. Sci. 9, 4450. doi:10.3390/app9204450
Cai, X., Zhou, Z., Zang, H., and Song, Z. (2020). Water saturation effects on dynamic behavior and microstructure damage of sandstone: phenomena and mechanisms. Eng. Geol. 276, 105760. doi:10.1016/j.enggeo.2020.105760
Chand, S., Minshull, T. A., Gei, D., and Carcione, J. M. (2004). Elastic velocity models for gas-hydrate-bearing sediments—a comparison. Geophys. J. Int. 159, 573–590. doi:10.1111/j.1365-246X.2004.02387.x
Chen, L., Zhao, J., and Zheng, Z. (2017). Acoustic emission characteristics of compressive deformation and failure of siltstone under different water contents. Adv. Mater. Sci. Eng. 2017, 1–13. doi:10.1155/2017/4035487
Chen, X. L. (2011). Experimental study on rock mechanical properties under dry and saturated states. MA thesis. Henan Polytechnic University.
Cherblanc, F., Berthonneau, J., Bromblet, P., and Huon, V. (2016). Influence of water content on the mechanical behaviour of limestone: role of the clay minerals content. Rock Mech. Rock Eng. 49, 2033–2042. doi:10.1007/s00603-015-0911-y
Çobanoğlu, İ., and Çelik, S. B. (2008). Estimation of uniaxial compressive strength from point load strength, Schmidt hardness and P-wave velocity. Bull. Eng. Geol. Environ. 67, 491–498. doi:10.1007/s10064-008-0158-x
Drits, V. A., Zviagina, B. B., McCarty, D. K., and Salyn, A. L. (2010). Factors responsible for crystal-chemical variations in the solid solutions from illite to aluminoceladonite and from glauconite to celadonite. Am. Mineralogist 95, 348–361. doi:10.2138/am.2010.3300
Dvorkin, J., Nur, A., and Yin, H. (1994). Effective properties of cemented granular materials. Mech. Mater. 18, 351–366. doi:10.1016/0167-6636(94)90044-2
Erguler, Z. A., and Ulusay, R. (2009). Water-induced variations in mechanical properties of clay-bearing rocks. Int. J. Rock Mech. Min. Sci. 46, 355–370. doi:10.1016/j.ijrmms.2008.07.002
Feng, Z. Z., Bao, Z. D., Zheng, X. J., and Wang, Y. (2016). Researches of soft-sediment deformation structures and seismites in China — a brief review. J. Palaeogeogr. 5 (4), 311–317. doi:10.1016/j.jop.2016.06.001
Folk, R. L. (1968). Petrology of sedimentary rocks. Austin: Hemphill Publishing Company. doi:10.1086/622119
Garzanti, E. (2019). Petrographic classification of sand and sandstone. Earth-Science Rev. 192, 545–563. doi:10.1016/j.earscirev.2018.12.014
Gokceoglu, C., Sonmez, H., and Zorlu, K. (2009). Estimating the uniaxial compressive strength of some clay-bearing rocks selected from Turkey by nonlinear multivariable regression and rule-based fuzzy models. Expert Syst. 26, 176–190. doi:10.1111/j.1468-0394.2009.00475.x
González, J., Saldaña, M., and Arzúa, J. (2019). Analytical model for predicting the UCS from P-wave velocity, density, and porosity on saturated limestone. Appl. Sci. 9, 5265. doi:10.3390/app9235265
Hawkins, A. B., and Mcconnell, B. J. (1992). Sensitivity of sandstone strength and deformability to changes in moisture content. Q. J. Eng. Geol. Hydrogeology 25, 115–130. doi:10.1144/gsl.qjeg.1992.025.02.05
Huang, S., Cai, C., Yu, S., He, Y., and Cui, X. (2022a). Study on damage evaluation indexes and evolution models of rocks under freeze-thaw considering the effect of water saturations. Int. J. Damage Mech. 31, 1477–1505. doi:10.1177/10567895221106241
Huang, S., He, Y., Liu, G., Lu, Z., and Xin, Z. (2021). Effect of water content on the mechanical properties and deformation characteristics of the clay-bearing red sandstone. Bull. Eng. Geol. Environ. 80, 1767–1790. doi:10.1007/s10064-020-01994-6
Huang, S., He, Y., Yu, S., and Cai, C. (2022b). Experimental investigation and prediction model for UCS loss of unsaturated sandstones under freeze-thaw action. Int. J. Min. Sci. Technol. 32, 41–49. doi:10.1016/j.ijmst.2021.10.012
Huang, S., and Yu, S. (2022). Effect of water saturation on the strength of sandstones: experimental investigation and statistical analysis. Bull. Eng. Geol. Environ. 81, 323. doi:10.1007/s10064-022-02822-9
Huang, S., Yu, S., Ye, Y., Ye, Z., and Cheng, A. (2022c). Pore structure change and physico-mechanical properties deterioration of sandstone suffering freeze-thaw actions. Constr. Build. Mater. 330, 127200. doi:10.1016/j.conbuildmat.2022.127200
Iyare, U. C., Blake, O. O., and Ramsook, R. (2021). Estimating the uniaxial compressive strength of argillites using Brazilian tensile strength, ultrasonic wave velocities, and elastic properties. Rock Mech. Rock Eng. 54, 2067–2078. doi:10.1007/s00603-020-02358-y
Jamshidi, A., Zamanian, H., and Zarei Sahamieh, R. (2018). The effect of density and porosity on the correlation between uniaxial compressive strength and P-wave velocity. Rock Mech. Rock Eng. 51, 1279–1286. doi:10.1007/s00603-017-1379-8
Jarrard, R. D., Niessen, F., Brink, J. D., and Bücker, C. (2000). Effects of cementation on velocities of siliciclastic sediments. Geophys. Res. Lett. 27, 593–596. doi:10.1029/1999GL008429
Ji, S., Wang, Q., and Xia, B. (2003). P-wave velocities of polymineralic rocks: comparison of theory and experiment and test of elastic mixture rules. Tectonophysics 366, 165–185. doi:10.1016/S0040-1951(03)00094-5
Jia, H., Wang, T., Xiang, W., Tan, L., Shen, Y., and Yang, G. (2018). Influence of water content on the physical and mechanical behaviour of argillaceous siltstone and some microscopic explanations. Chin. J. Rock Mech. Eng. 37, 1618–1628. doi:10.13722/j.cnki.jrme.2017.1037
Joswig, W., Fuess, H., and Mason, S. A. (1989). Neutron diffraction study of a one-layer monoclinic chlorite. Clays Clay Min. 37, 511–514. doi:10.1346/CCMN.1989.0370602
Kahraman, S. (2001). Evaluation of simple methods for assessing the uniaxial compressive strength of rock. Int. J. Rock Mech. Min. Sci. 38, 981–994. doi:10.1016/S1365-1609(01)00039-9
Karakul, H., and Ulusay, R. (2013). Empirical correlations for predicting strength properties of rocks from P-wave velocity under different degrees of saturation. Rock Mech. Rock Eng. 46, 981–999. doi:10.1007/s00603-012-0353-8
Kim, E., and Changani, H. (2016). Effect of water saturation and loading rate on the mechanical properties of Red and Buff Sandstones. Int. J. Rock Mech. Min. Sci. 88, 23–28. doi:10.1016/j.ijrmms.2016.07.005
Kim, E., Stine, M. A., de Oliveira, D. B. M., and Changani, H. (2017). Correlations between the physical and mechanical properties of sandstones with changes of water content and loading rates. Int. J. Rock Mech. Min. Sci. 100, 255–262. doi:10.1016/j.ijrmms.2017.11.005
Lafrance, N., Auvray, C., Souley, M., and Labiouse, V. (2016). Impact of weathering on macro-mechanical properties of chalk: local pillar-scale study of two underground quarries in the Paris Basin. Eng. Geol. 213, 107–119. doi:10.1016/j.enggeo.2016.08.014
Li, B., Liu, J., Bian, K., Ai, F., Hu, X., Chen, M., et al. (2019). Experimental study on the mechanical properties weakening mechanism of siltstone with different water content. Arab. J. Geosci. 12, 656. doi:10.1007/s12517-019-4852-8
Liao, R., Chen, W., Wang, N., and Liu, W. (2019). Forecast of heritage deterioration based on freeze-thaw sensitivity of sandstone. J. Cent. South Univ. 50, 3084–3096. doi:10.11817/j.issn.1672-7207.2019.12.018
Liu, M., Pu, X., Zhang, Q., and Su, J. (2021). Molecular simulation for inorganic salts inhibition mechanism on illite hydration. J. Southwest Pet. U 43, 81–89. (In Chinese). doi:10.11885/j.issn.1674-5086.2021.04.29.15
Liu, Y., Cai, Y., Huang, S., Guo, Y., and Liu, G. (2020). Effect of water saturation on uniaxial compressive strength and damage degree of clay-bearing sandstone under freeze-thaw. Bull. Eng. Geol. Environ. 79, 2021–2036. doi:10.1007/s10064-019-01686-w
Liu, Z. F., Trentesaux, A., Clemens, S. C., Colin, C., Wang, P. X., Huang, B. Q., et al. (2003). Clay mineral assemblages in the northern South China Sea: implications for East Asian monsoon evolution over the past 2 million years. Mar. Geol. 201, 133–146. doi:10.1016/S0025-3227(03)00213-5
Lu, Y., Wang, L., Sun, X., and Wang, J. (2017). Experimental study of the influence of water and temperature on the mechanical behavior of mudstone and sandstone. Bull. Eng. Geol. Environ. 76, 645–660. doi:10.1007/s10064-016-0851-0
Lyu, C., Amiri, S. A. G., Grimstad, G., Høyland, K. V., and Ingeman-Nielsen, T. (2020). Comparison of geoacoustic models for unfrozen water content estimation. J. Geophys. Res. Solid Earth 125, e2020JB019766. doi:10.1029/2020JB019766
Masoumi, H., Horne, J., and Timms, W. (2017). Establishing empirical relationships for the effects of water content on the mechanical behavior of gosford sandstone. Rock Mech. Rock Eng. 50, 2235–2242. doi:10.1007/s00603-017-1243-x
Mishra, D. A., and Basu, A. (2013). Estimation of uniaxial compressive strength of rock materials by index tests using regression analysis and fuzzy inference system. Eng. Geol. 160, 54–68. doi:10.1016/j.enggeo.2013.04.004
Pradhan, S. M., Katti, K. S., and Katti, D. R. (2015). Evolution of molecular interactions in the interlayer of Na-montmorillonite swelling clay with increasing hydration. Int. J. Geomechanics 15, 04014073. doi:10.1061/(ASCE)GM.1943-5622.0000412
Rabat, Á., Cano, M., and Tomás, R. (2020). Effect of water saturation on strength and deformability of building calcarenite stones: correlations with their physical properties. Constr. Build. Mater. 232, 117259. doi:10.1016/j.conbuildmat.2019.117259
Rajabzadeh, M. A., Moosavinasab, Z., and Rakhshandehroo, G. (2012). Effects of rock classes and porosity on the relation between uniaxial compressive strength and some rock properties for carbonate rocks. Rock Mech. Rock Eng. 45, 113–122. doi:10.1007/s00603-011-0169-y
Rastegarnia, A., Lashkaripour, G. R., Sharifi Teshnizi, E., and Ghafoori, M. (2021). Evaluation of engineering characteristics and estimation of static properties of clay-bearing rocks. Environ. Earth Sci. 80, 621. doi:10.1007/s12665-021-09914-x
Ren, Y., Wu, D., and Jia, J. (2022). Molecular simulation the physical and chemical properties of Illite under different temperatures and pressures and interlaminar water saturation. J. Mater Sci. Eng. 41 (1). (In Chinese). doi:10.14136/j.cnki.issn1673-2812.2023.01.020
Reviron, N., Reuschlé, T., and Bernard, J. D. (2009). The brittle deformation regime of water-saturated siliceous sandstones. Geophys J. Int. 178, 1766–1778. doi:10.1111/j.1365-246X.2009.04236.x
Rezaei, M., Davoodi, P. K., and Najmoddini, I. (2019). Studying the correlation of rock properties with P-wave velocity index in dry and saturated conditions. J. Appl. Geophys. 169, 49–57. doi:10.1016/j.jappgeo.2019.04.017
Saldaña, M., González, J., Pérez-Rey, I., Jeldres, M., and Toro, N. (2020). Applying statistical analysis and machine learning for modeling the UCS from P-wave velocity, density and porosity on dry travertine. Appl. Sci. 10, 4565. doi:10.3390/app10134565
Shen, B. (2014). Coal mine roadway stability in soft rock: a case study. Rock Mech. Rock Eng. 47, 2225–2238. doi:10.1007/s00603-013-0528-y
Siegesmund, S., Gross, C. J., Dohrmann, R., Marler, B., Ufer, K., and Koch, T. (2003). Moisture expansion of tuff stones and sandstones. Environ. Earth Sci. 82, 146. doi:10.1007/s12665-023-10809-2
Skipper, N. T., Sposito, G., and Chang, F.-R. C. (1995). Monte Carlo simulation of interlayer molecular structure in swelling clay minerals. 2. Monolayer hydrates. Clays Clay Minerals 43, 294–303. doi:10.1346/CCMN.1995.0430304
Song, K., Wang, F., Yi, Q., and Lu, S. (2018). Landslide deformation behavior influenced by water level fluctuations of the Three Gorges Reservoir (China). Eng. Geol. 247, 58–68. doi:10.1016/j.enggeo.2018.10.020
Sun, Q., and Zhang, Y. (2019). Combined effects of salt, cyclic wetting and drying cycles on the physical and mechanical properties of sandstone. Eng. Geol. 248, 70–79. doi:10.1016/j.enggeo.2018.11.009
SY/T 5163-2018 (2018). Analysis method for clay minerals and ordinary non-clay minerals in sedimentary rocks by the X-Ray diffraction. Beijing: Chinese Oil Gas Industry Standard. National Energy Administration.
Tang, S. (2018). The effects of water on the strength of black sandstone in a brittle regime. Eng. Geol. 239, 167–178. doi:10.1016/j.enggeo.2018.03.025
Tomor, A. K., Nichols, J. M., and Orbán, Z. (2024). Evaluation of the loss of uniaxial compressive strength of sandstones due to moisture. Int. J. Archit. Herit. 18 (5), 771–787. doi:10.1080/15583058.2023.2188313
Torabi-Kaveh, M., Naseri, F., Saneie, S., and Sarshari, B. (2015). Application of artificial neural networks and multivariate statistics to predict UCS and E using physical properties of Asmari limestones. Arab. J. Geosci. 8, 2889–2897. doi:10.1007/s12517-014-1331-0
Török, Á., and Vásárhelyi, B. (2010). The influence of fabric and water content on selected rock mechanical parameters of travertine, examples from Hungary. Eng. Geol. 115, 237–245. doi:10.1016/j.enggeo.2010.01.005
Tuğrul, A., and Zarif, I. H. (1999). Correlation of mineralogical and textural characteristics with engineering properties of selected granitic rocks from Turkey. Eng. Geol. 51, 303–317. doi:10.1016/S0013-7952(98)00071-4
Verstrynge, E., Adriaens, R., Elsen, J., and Van Balen, K. (2014). Multi-scale analysis on the influence of moisture on the mechanical behavior of ferruginous sandstone. Constr. Build. Mater. 54, 78–90. doi:10.1016/j.conbuildmat.2013.12.024
Weng, L., Wu, Z., and Liu, Q. (2020). Dynamic mechanical properties of dry and water-saturated siltstones under sub-zero temperatures. Rock Mech. Rock Eng. 53, 4381–4401. doi:10.1007/s00603-019-02039-5
Williams, M. L. (1996). CRC handbook of chemistry and physics, 76th edition. Occup. Environ. Med. 53, 504. doi:10.1136/oem.53.7.504
Wong, L. N. Y., Maruvanchery, V., and Liu, G. (2016). Water effects on rock strength and stiffness degradation. Acta Geotech. 11, 713–737. doi:10.1007/s11440-015-0407-7
Xie, N., Tang, H. M., Yang, J. B., and Jiang, Q. H. (2022). Damage evolution in dry and saturated brittle sandstone revealed by acoustic characterization under uniaxial compression. Rock Mech. Rock Eng. 55, 1303–1324. doi:10.1007/s00603-021-02716-4
Yan, Y. Y., Ding, W., Liu, G. J., and Wang, H. Y. (2022). Effects of mineral crystal structure and properties on the macro-mechanical properties of rocks. Res. Square. doi:10.21203/rs.3.rs-1207534/v1
Yang, F., Zhou, H., Zhang, C., Lu, J., Lu, X., and Geng, Y. (2020). An analysis method for evaluating the safety of pressure water conveyance tunnel in argillaceous sandstone under water-weakening conditions. Tunn. Undergr. Space Technol. 97, 103264. doi:10.1016/j.tust.2019.103264
Yilmaz, I. (2010). Influence of water content on the strength and deformability of gypsum. Int. J. Rock Mech. Min. Sci. 47, 342–347. doi:10.1016/j.ijrmms.2009.09.002
Yilmaz, I., and Yuksek, G. (2009). Prediction of the strength and elasticity modulus of gypsum using multiple regression, ANN, and ANFIS models. Int. J. Rock Mech. Min. Sci. 46, 803–810. doi:10.1016/j.ijrmms.2008.09.002
Yuan, Y., Zhu, Y., Wang, W., and Yu, W. (2014). Failure mechanism of Mesozoic soft rock roadway in Shajihai coal mine and its surrounding rock control. Int. J. Min. Sci. Technol. 24, 853–858. doi:10.1016/j.ijmst.2014.10.019
Zhang, Y., Chen, M., Deng, Y., Jin, Y., Lu, Y., and Xia, Y. (2018). Molecular dynamics simulation of temperature and pressure effects on hydration characteristics of montmorillonites. Kuei Suan Jen Hsueh Pao/Journal Chin. Ceram. Soc. 46, 1489–1498. doi:10.14062/j.issn.0454-5648.2018.10.21
Zhou, Z., Cai, X., Cao, W., Li, X., and Xiong, C. (2016). Influence of water content on mechanical properties of rock in both saturation and drying processes. Rock Mech. Rock Eng. 49, 3009–3025. doi:10.1007/s00603-016-0987-z
Zhou, Z., Cai, X., Ma, D., Du, X., Chen, L., Wang, H., et al. (2019). Water saturation effects on dynamic fracture behavior of sandstone. Int. J. Rock Mech. Min. Sci. 114, 46–61. doi:10.1016/j.ijrmms.2018.12.014
Zi, F., Yang, G., and Jia, H. (2018). Influence of saturation degree on the mechanical properties of frozen argillaceous siltstone. J. Glaciol. Geocryol. 40, 748–755. doi:10.7522/j.issn.1000-0240.2018.0080
Glossary
Keywords: water weakening coefficient, uniaxial compression strength, clay minerals, P-wave velocity, multiple linear regression
Citation: Xu J, Huang S, Yu S, Zhu S and Song J (2024) Evaluation of the water weakening coefficient of sandstones by using non-destructive physical parameters. Front. Earth Sci. 12:1460912. doi: 10.3389/feart.2024.1460912
Received: 07 July 2024; Accepted: 11 September 2024;
Published: 07 October 2024.
Edited by:
Weiyao Guo, Shandong University of Science and Technology, ChinaReviewed by:
Lei Weng, Wuhan University, ChinaLv Jiahe, China University of Geosciences Wuhan, China
Copyright © 2024 Xu, Huang, Yu, Zhu and Song. This is an open-access article distributed under the terms of the Creative Commons Attribution License (CC BY). The use, distribution or reproduction in other forums is permitted, provided the original author(s) and the copyright owner(s) are credited and that the original publication in this journal is cited, in accordance with accepted academic practice. No use, distribution or reproduction is permitted which does not comply with these terms.
*Correspondence: Shibing Huang, aHVhbmdzaGliaW5nQHd1c3QuZWR1LmNu
 Jianbo Xu1
 Shibing Huang