- 1Key Lab of Earth Exploration and Information Techniques of Ministry of Education, College of Geophysics, Chengdu University of Technology, Chengdu, China
- 2College of Geophysics, Chengdu University of Technology, Chengdu, China
- 3CNOOC Research Institute Ltd., National Engineering Research Center of Offshore Oil and Gas Exploration, Beijing, China
- 4Research and Development Center, Bureau of Geophysical Prospecting INC., China National Petroleum Corporation, Zhuozhou, China
Granite buried hill oil and gas reservoirs are relatively scarce worldwide, and the fine prediction and characterization of their fractures have always been a significant industry challenge. Particularly in the South China Sea region, large and thick granite buried-hill reservoirs are influenced by various geological processes such as weathering and tectonics, resulting in a complex internal fracture system. The seismic reflection characteristics exhibit high steepness, discontinuity, and significant amplitude differences, posing significant difficulties for the fine characterization of fractures. A systematic and comprehensive research approach has not yet been established. Therefore, this study considers the large granite-buried hill A reservoir in the South China Sea as a typical case study and proposes a multi-scale fracture fine prediction and characterization methodology system. The method starts with analyzing the fracture scale and genesis to refine the fracture scales identifiable by conventional seismic data. Based on this, the U-SegNet model and transfer learning are utilized to achieve fine detection of large-scale fractures. Meanwhile, using high-resolution ant tracking technology based on MVMD frequency division and sensitive attribute preferences realizes a fine prediction of medium-to-small-scale fractures. Furthermore, the discrete fracture network is used for fracture deterministic modeling, ranging from geometric morphology to percolation behavior. Ultimately, a post-stack seismic multi-scale fracture prediction and characterization workflow is established. The results indicate that the buried hill in the study area exhibits a high degree of fracture development with evident multi-scale characteristics. Among them, large-scale fractures have a relatively low development density, primarily oriented in the NW and NE directions; medium-to-small-scale fractures exhibit high-density and omnidirectional development. The development of fractures significantly improves the storage space and fluid flow capacity of the buried hill. Compared with traditional methods, the proposed method notably enhances the accuracy of characterizing the degree of fracture development, spatial morphology, and percolation behavior in the buried hill reservoir, providing a scientific basis for oil and gas exploration and development.
1 Introduction
With rapid growth in global oil and gas demand and conventional oil and gas reserves now nearing a 50% extraction rate (Jia, 2022), unconventional resources have become increasingly crucial in the petroleum industry (Cui, 2010). Recent discoveries in the Liwan and Lingshui gas fields highlight the significant exploration potential in the deepwater area of the South China Sea. Taking the A gas field in the Pearl River Mouth Basin as an example, this area consists of granite fracture-type buried hill reservoirs with estimated reserves of approximately 56 billion cubic meters, making it a future exploration hotspot. Unlike conventional reservoirs, granite is an intrusive acidic rock that is dense and hard, and inherently unsuitable as a hydrocarbon reservoir. Effective reservoir formation occurs only after structural deformation and weathering leaching increase porosity. The A gas field’s granite buried hill reservoir typifies a weathering crust-type reservoir, exhibiting distinct vertical zonation: upper reservoirs undergo intense weathering and leaching, developing dissolution pores and fractures, forming weathering leaching zones; lower reservoirs experience weaker weathering, generally compact, dominated by tectonic fractures, forming endogenous fracture zones; intermittent dense zones of varying thickness may also be present (Peng et al., 2024; Wei et al., 2024). These reservoirs undergo complex transformations from weathering dissolution and tectonic movements, resulting in intricate fracture networks and high heterogeneity. Single-detection methods typically identify specific types of fractures or fracture zones, and the detection results are often a comprehensive response across different levels and scales of fractures. Therefore, the precise detection and characterization of multi-scale fractures are crucial for such reservoirs, posing a significant challenge.
Currently, methods for fault and fracture detection mainly include core scanning, logging, seismic analysis, and multi-information fusion. Seismic detection methods primarily characterize the continuity or discontinuity of strata through various attribute volumes. The primary methods include coherence (Bahorich and Farmer, 1995; Marfurt et al., 1998; 1999), variance (Van Bemmel and Pepper, 2000), dip and azimuth (Dalley et al., 2007), curvature (Roberts, 2001; Al-Dossary and Marfurt, 2006; Gao, 2013), edge detection (Di and Gao, 2013), ant tracking (Pedersen et al., 2002), semblance (Hale, 2013; Wu and Hale, 2016), and azimuthal anisotropy analysis (Mallick et al., 1998; Vasconcelos and Grechka, 2007; Zhang et al., 2013). Although azimuthal anisotropy analysis offers high fracture prediction accuracy, its high data acquisition costs often make it infeasible during early exploration stages. Conventional seismic interpretation typically uses coherence and edge detection to identify large-scale fractures, whereas ant tracking is employed to detect medium-to-small-scale fracture information. However, noise and stratigraphic features can also cause seismic reflection discontinuities, which means that traditional attribute analysis methods may be less effective in buried-hill regions.
With the rapid advancement of machine learning and artificial intelligence, deep learning methods are widely used in seismic exploration (Zhang et al., ; 2023; Tolstaya and Egorov, 2022; Sun and Hou, 2024), such as seismic inversion, seismic de-noising, and facies identification. Among them, large-scale automatic fracture detection has achieved advanced results in many seismic cases. For example, Tingdahl and Rooij (2005) implemented fault-probability estimation using artificial neural networks and fault-enhanced attributes. Chehrazi et al. (2013) first introduced convolutional neural networks (CNNs) into fault recognition and demonstrated promising outcomes in practical applications. Huang et al. (2017) employed seismic attributes as CNN inputs, enabling automatic fault identification. Di et al. (2018) compared the experimental results of MLP and CNN, proving CNN’s superiority in fault detection tasks. Subsequently, scholars have explored methods that directly utilize seismic images and fault labels as inputs, enhancing fault recognition accuracy and relieving computational pressure associated with multi-attribute techniques (Guo et al., 2018; Pochet et al., 2019; Wu et al., 2019). In recent years, numerous improved CNN architectures have emerged, such as hybrid networks based on U-Net and ResNet-34 (Liu et al., 2020), 3D U-SegNet hybrid network integrating U-Net and SegNet (Lyu et al., 2022), and Fault-Seg-Net (Li et al., 2023), which further enhance the fault detection performance and efficiency. Cunha et al. (2020) introduced transfer learning into seismic fault detection, improving the adaptability of the base model to real seismic data. Wei et al. (2022) utilized focal loss to enhance the transfer learning effectiveness for imbalanced samples. However, research on large-scale fracture detection in buried hill reservoirs remains scarce, with limited identification accuracy.
Frequency division technology is an effective seismic data processing method that can remove redundant information to accurately highlight seismic reflections at different scales (Naseer, 2024). Typically, as the frequency increases, the responses from the fracture zones are enhanced, allowing the identification of smaller-scale fracture zones. In recent years, frequency division technology combined with seismic attribute analysis has achieved significant success in identifying fractures in complex areas. For instance, Zhang et al. (2017) utilized spectral decomposition and anisotropic attribute analysis to achieve fine identification of small-scale fracture reservoirs. Liu J. et al. (2022) improved the detection accuracy of strike-slip fractures in the Tarim Basin using frequency domain coherence. Ouyang et al. (2020) predicted multi-scale fractures in shale reservoirs in the Sichuan Basin through wavelet transform frequency analysis and coherence attributes. Yan (2020) enhanced characterization of clastic rock faults in the western South China Sea using generalized S-transform frequency division and coherence attributes. However, owing to the Heisenberg uncertainty principle, the above time-frequency analysis methods struggle to simultaneously balance the time and frequency resolution. Additionally, there is limited research on buried-hill reservoirs in the southern South China Sea, and the sensitive attributes of fractures are not yet clear, posing challenges for predicting medium-to-small-scale fractures.
For a better description of fracture morphology, size, spatial arrangement, and orientation characteristics, it is essential to conduct detailed characterization through deterministic or stochastic modeling based on fracture detection. For instance, Zhang J. et al. (2021) utilized seismic attributes and imaging logging data for deterministic and stochastic modeling to characterize the spatial features of large-scale fractures and microfractures. Mi et al. (2023) established a fracture network model using imaging logging, core, thin section, and scanning electron microscope data and discussed the impact of microfractures on hydrocarbon distribution. Generally, mainstream fracture modeling techniques include discrete medium models (Kim and Deo, 2000; Huang and Wang, 2011), discrete fracture models (Bahrainian et al., 2015; Zeng and Yao, 2015), embedded discrete fracture models (Zhou, 2014), and discrete fracture network models (Baecher, 1983; Zhang et al., 2016). Among these, discrete fracture network (DFN) models are widely applied because of their simplicity in construction, broad applicability, and accurate reservoir description. The deterministic modeling of this model relies on the precise detection of reservoir fractures, whereas stochastic modeling is completed by imaging logging data and fractal law.
Gas reservoir A in the South China Sea is influenced by multiphase tectonic movements, with a highly developed and intersecting basement fracture system. The scarcity of imaging logging and core data in the study area poses significant challenges for fracture prediction and characterization. Therefore, this study proposes a multi-scale fracture fine prediction and characterization technology system tailored for granite buried-hill reservoirs during the early exploration stage, based on the scale division and genesis of fractures and post-stack seismic identification accuracy. The workflow is illustrated in Figure 1. First, anisotropic diffusion filtering is employed to enhance reflection discontinuities and reduce noise interference. Then, we conduct transfer learning using a pre-trained 3D U-SegNet, adjusting the model weights based on real fracture labels to make it suitable for buried hill A. During transfer learning, we propose a weighted hybrid binary dice loss (WHBD loss) to achieve the high-precision detection of large-scale fractures. Furthermore, we introduce multi-channel variational mode decomposition (MVMD) for high-precision frequency division, calculate various discontinuity attributes within the advantageous frequency bands, and select sensitive attributes for high-resolution ant-tracking, thereby enabling fine prediction of medium-to-small-scale fractures. Finally, deterministic modeling is performed based on the discrete fracture network (DFN) and multi-scale fracture prediction information to achieve a detailed characterization of fractures from geometric morphology to percolation characteristics in buried hill A. This provides a basis for the subsequent delineation of favorable reservoirs.
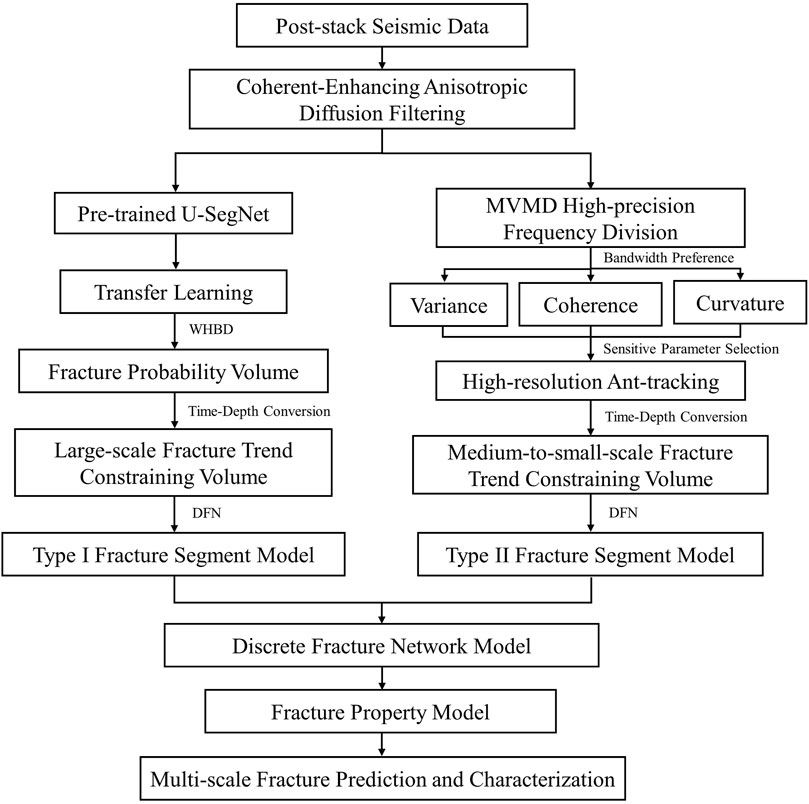
Figure 1. Multi-scale fracture prediction and characterization technology workflow for buried hill A.
2 Geological setting
Fractures are crucial structural elements of buried-hill petroleum reservoirs. They not only have important impacts on the formation, evolution, and trap development, but also serve as the primary migration pathways and storage spaces for oil and gas, playing a crucial role in the formation and distribution of hydrocarbon reservoirs (Yielding et al., 1997; Lyu et al., 2013). Accurate prediction of the spatial distribution of multi-scale fractures is crucial for improving the success rate of buried hill reservoir exploration and development efficiency. However, for complex geological targets such as deepwater ancient buried hills, fracture systems are highly developed owing to the influence of multiple tectonic movements, with seismic responses characterized by steep, chaotic reflections, weak reflections, or even blank reflections. Therefore, traditional attribute analysis techniques struggle to achieve fine characterization of multi-scale fractures.
The Pearl River Mouth Basin (PRMB) is a Cenozoic rift basin located in the northern South China Sea. The basin extends in a northeast orientation, with a length of 800 km and width of 300 km, covering an area of 20,000 km2, making it the largest hydrocarbon-bearing basin in the northern South China Sea. It consists of multiple tectonic belts from north to south: the northern uplift belt, northern depression belt, central uplift belt, central depression belt, southern uplift belt, and southern depression belt. The first three belts are located in the shallow-water area, while the latter three are in the deep-water area, forming a basic pattern of “three uplifts, three depressions” (Cai et al., 2021; Liu B. J. et al., 2022). The PRMB was controlled by the low-angle subduction of the ancient Pacific plate towards the South China plate during the Late Mesozoic era, with an overall tectonic setting of the Andes-type continental margin magmatic arc. Since the Cenozoic era, the PRMB has undergone four evolutionary stages: 1) Paleogene to Middle Eocene (Tg-T80): fault depression stage. 2) Late Eocene (T80-T70): fault-depression transition stage. 3) Oligocene to Middle Miocene (T70-T32): depression stage. 4) Middle Miocene to Present (T32-Quaternary): tectonic reactivation stage (Pin et al., 2001; Shi et al., 2005; Zhao et al., 2012).
The Baiyun Sag is located in the deep-water area of the Zhu II Depression in the PRMB, representing a typical deepwater slope sedimentary depression in the northern South China Sea (Figure 2A). According to the “north-south segmentation, east-west block” structural pattern of the PRMB (Chen et al., 2003), this area is situated in the central part of the basin sandwiched by two northwest-trending concealed fractures. The basin’s complex and significantly heterogeneous structure is characterized by various styles of large-scale detachment fracture systems. However, exploration of the ancient buried hills in the deepwater areas of the PRMB is still in its early stages, with few wells drilled and a lack of core and sidewall samples. Therefore, effectively utilizing seismic data and geological understanding to predict and characterize the development patterns of fracture systems in buried hill reservoirs is crucial for advancing exploration in this area.
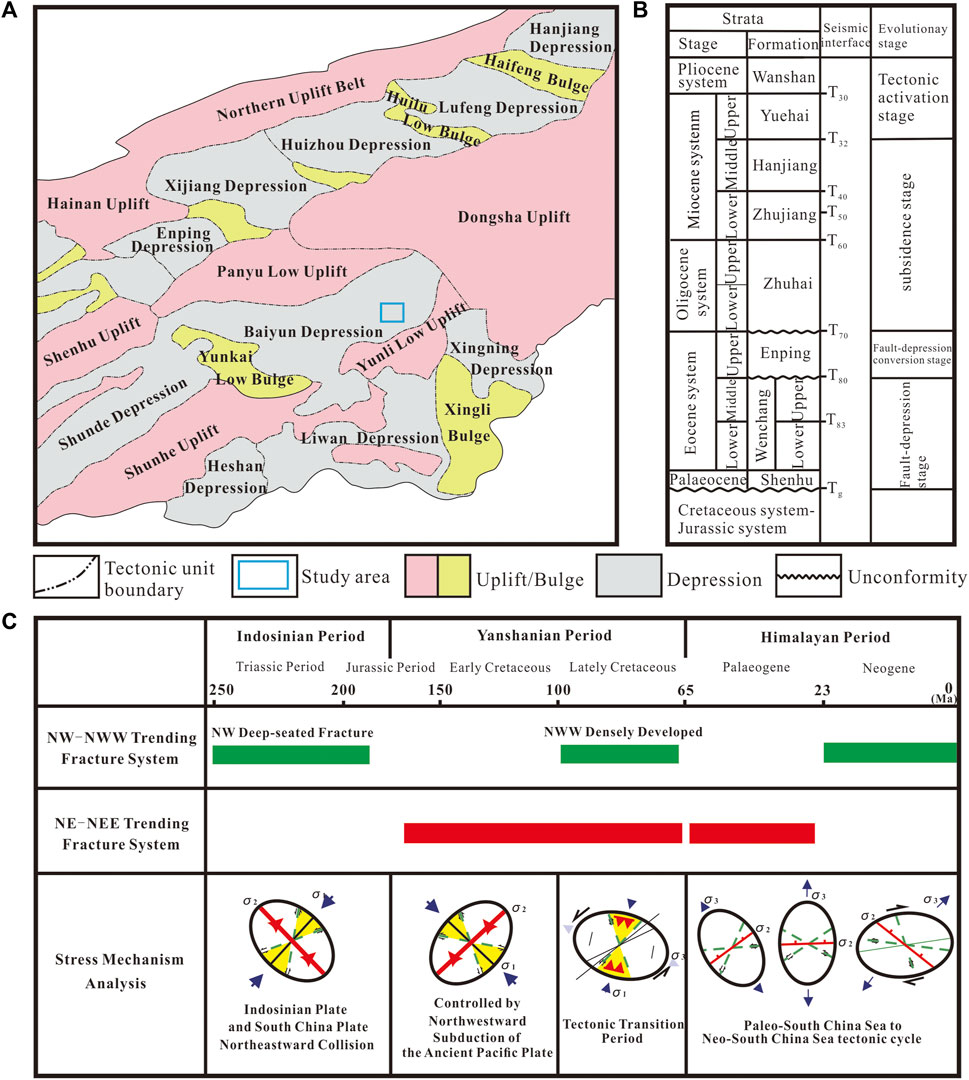
Figure 2. Geological features of the study area. (A) Structural units division and (B) stratigraphic column of the Pearl River Mouth Basin (modified from Yu et al., 2022; Peng et al., 2024); (C) Development period and formation mechanism of fractures in Pearl River Mouth Basin (provided by CNOOC).
The buried hill A gas reservoir is located in the eastern part of the Baiyun Sag in the PRMB, adjacent to hydrocarbon-rich depressions such as the Baiyun Main Sag and the Baiyun East Sag (Figure 2A), making it a significant natural gas accumulation zone in the Baiyun Sag (Wang et al., 2023). The basement lithology is primarily composed of granitoids, with a small amount of volcanic, volcaniclastic, and metamorphic rocks. Since the Late Mesozoic, this buried hill has undergone multiple tectonic stress phases (Figure 2C), resulting in well-developed fracture systems with distinct vertical zonation. From top to bottom, these zones include the weathering zone, internal fracture zone, and dense zone, with varying thicknesses. The weathering zone is subjected to intense weathering and erosion, leading to small-scale fractures in all directions. The internal zone is influenced by northwest-trending deep-seated fractures, developing two pre-existing fracture systems oriented NE-NEE and NW-NWW (Figure 2C). Buried-hill A has a total of four exploratory wells, but only one has been drilled into the buried hill, with a depth of 127 m (located in the weathering zone), and lacks imaging logging data. Currently, it is difficult to rely on well data for precise fracture prediction.
3 Conventional fracture prediction methods
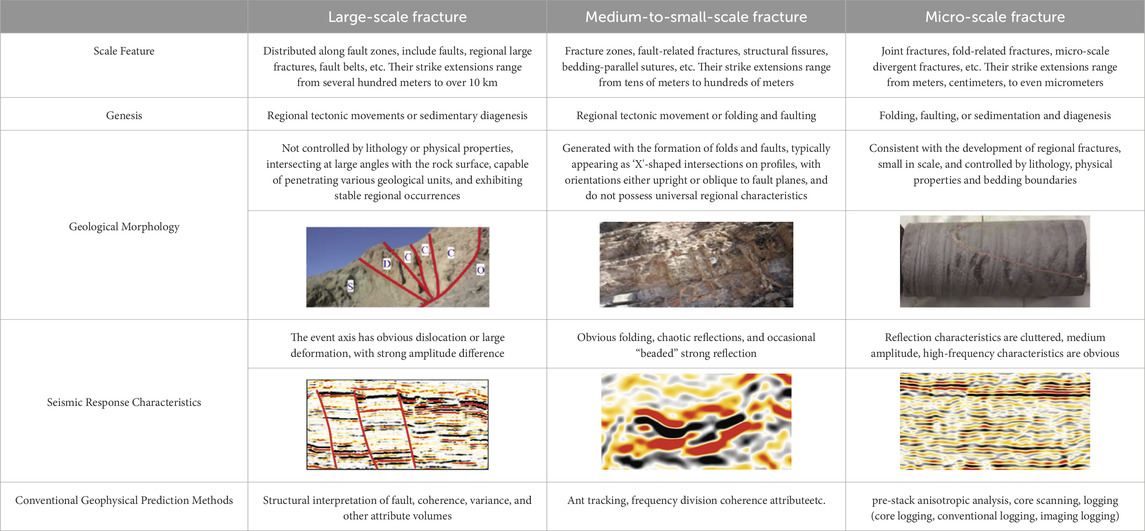
Clarification of the multi-scale characteristics of fractures is a prerequisite for the accurate prediction and characterization of fractures at various scales. This article first summarizes the types and causes of fractures with different development and extension scales (Zhou et al., 2011; Dong et al., 2016; Ma et al., 2018). Based on this, it analyzes the geological morphology and seismic response characteristics of fractures at different scales and summarizes the conventional geophysical prediction techniques (Table 1). As buried hill A is currently in the early stage of exploration, minimal drilling data are available. Therefore, we researched multi-scale fracture prediction and characterization methods suitable for granite buried hill A in the South China Sea based on the identifiable accuracy of post-stack seismic data. The currently identified medium-to-small-scale fractures belong to the categories of fracture zones, associated fractures, and small tectonic fractures caused by regional tectonic movements or faulting. In the mid-to-late stages of oil and gas exploration, a comprehensive evaluation of microscale fractures will require a combination of wide-azimuth seismic data, logging, and core samples.
4 The principles of multi-scale fracture prediction methods
4.1 Coherent-enhancing anisotropic diffusion filtering
Anisotropic diffusion filtering (Weickert, 1998; 1999; Bakker, 2002; Lu and Lu, 2009) can suppress residual noise while effectively preserving structural information of geological bodies and fracture development directions, thereby maintaining discontinuous structures such as faults and fractures. This helps to obtain fundamental data for precise fracture prediction and interpretation.
Building upon previous research, Weickert, 1998 introduced structural analysis into diffusion filtering by converting the diffusion coefficient into a structure tensor, allowing diffusion to vary with direction. This approach protects the linear texture features of images while removing noise. The constructed diffusion model is as Equation 1 (Weickert and Scharr, 2002):
where
where
where
Figures 3A–D show the seismic profiles and spectrum before and after coherent-enhancing anisotropic diffusion filtering. Tg (represented by the black line) indicates the location of the top of the buried hill. From the seismic profiles, it can be observed that the noise within the buried hill is significantly suppressed and the imaging accuracy is notably improved after filtering (as indicated by the blue box). Additionally, to facilitate the observation of the method’s effectiveness in preserving structural edges during de-noising, we mark a shallow fracture zone with the red boxes. These shallow fractures, being more readily observable and discernible compared to fractures within the buried hill, clearly demonstrate that the fracture morphology is well-preserved after filtering. The spectrum before and after filtering are essentially consistent, indicating that the anisotropic diffusion filtering primarily removes random noise without significantly damaging the effective signal. Figures 3E–H display the time slices of seismic amplitude and discontinuity detection volumes for both the original and filtered data. It can be seen that after coherent-enhancing anisotropic diffusion filtering, the feature and breakpoint features are enhanced, resulting in a clearer depiction of the fault zone.
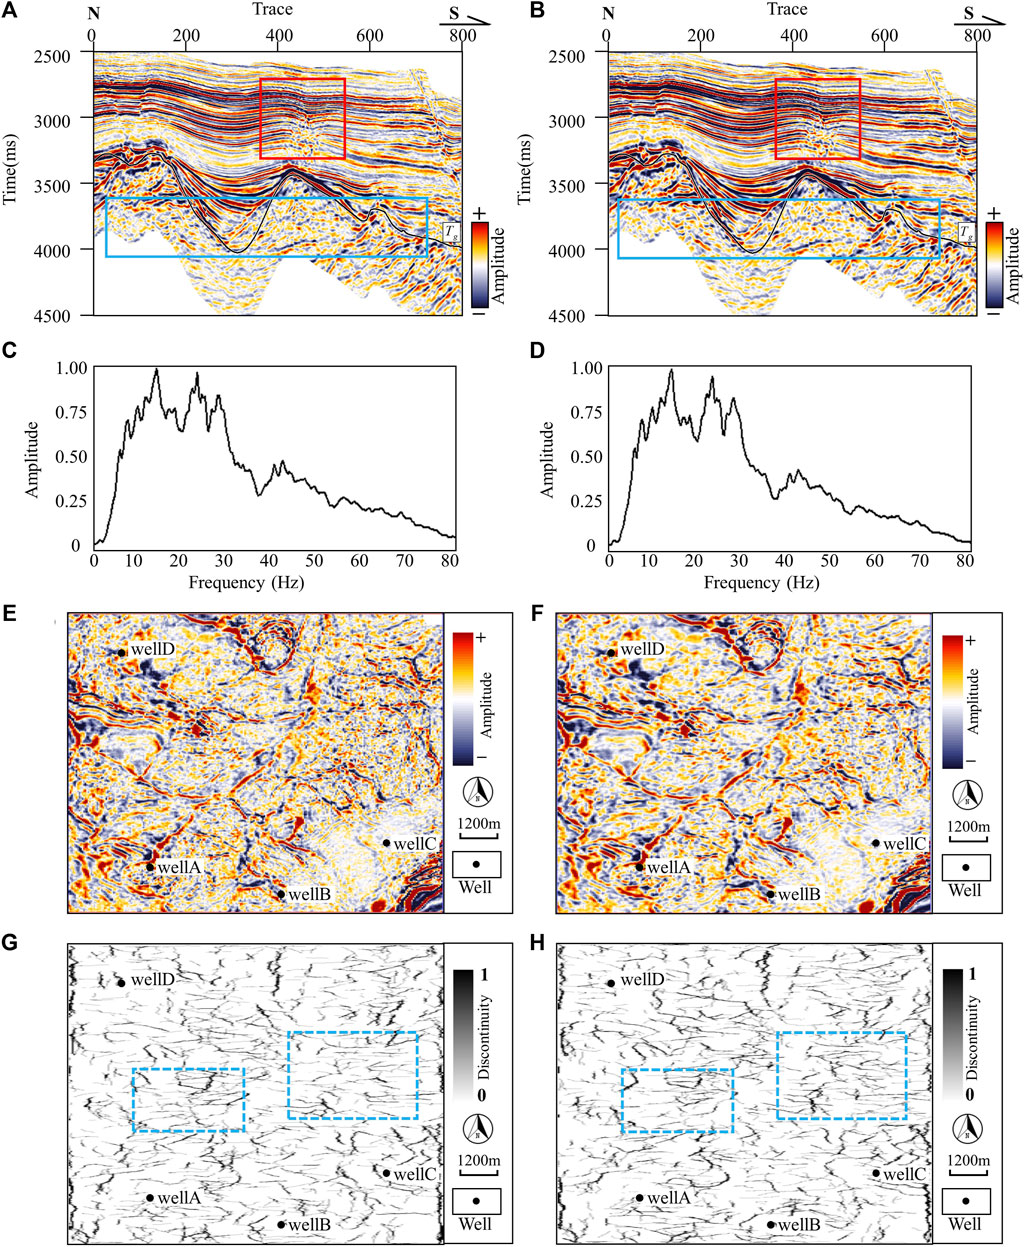
Figure 3. Comparison of seismic data, spectrum and discontinuous detection volume before and after filtering. (A) Original seismic profile; (B) Seismic profile after coherent-enhancing anisotropic diffusion filtering; (C) Original spectrum; (D) Spectrum after filtering; (E) Amplitude slice before filtering; (F) Amplitude slice after filtering; (G) Discontinuous detection slice before filtering; (H) Discontinuous detection slice after filtering.
4.2 Intelligent identification technique for large fractures based on transfer learning with U-SegNet and weighted hybrid loss
Convolutional neural networks (CNNs) perform image feature extraction and classification through a series of specific layers and have achieved state-of-the-art results in seismic fault detection tasks in recent years. U-Net and SegNet are two commonly used semantic segmentation network architectures. U-Net utilizes skip connections to concatenate shallow-level global features with deep-level local features, achieving multi-scale feature fusion through convolutions, thus enhancing the restoration of image details and semantic segmentation (Ronneberger et al., 2015). However, since the decoder consists of upsampling and transposed convolution operations, U-Net requires learning more parameters, which slows down the training speed. SegNet, on the other hand, passes pooling indices to the upsampling layers during the decoding process, enabling the network to have fewer parameters and a faster training speed, but lacks U-Net’s ability to capture multi-scale information (Badrinarayanan et al., 2017). Therefore, in the previous work, we constructed a 3D U-SegNet hybrid network (Lyu et al., 2022). This network is built on the SegNet structure and speeds up model convergence by passing the pooling indices to the upsampling layers for unpooling. Additionally, it introduces skip connections before the transposed convolution layers in the decoder, leveraging abstract features from the encoder for more detailed image segmentation. As a result, U-SegNet exhibits better performance and lower training costs, making it more advantageous for fault segmentation in complex 3D blocks.
U-SegNet is trained using the error backpropagation algorithm, enabling the rapid acquisition of optimal model weights. Transfer learning (TL) (Pan and Yang, 2010) can inherit all or part of the pre-trained U-SegNet weights from the source domain as an initial state, adjusting the network weights in the target domain to enhance the adaptability of the model. As long as there is a correlation between the two tasks, TL can usually achieve a satisfactory classification performance with less training on new datasets. Therefore, we conduct transfer learning based on the U-SegNet model designed and trained for 3D seismic fault segmentation to improve the accuracy of the model in buried-hill fracture detection. The model was trained with 400 sets of synthetic seismic images and fault labels with a size of 128 × 128 × 128, as detailed in our previous work (Lyu et al., 2022). Ultimately, this network achieved excellent fault segmentation capabilities using only synthetic data and performed well on the Dutch F3 block and Bohai buried-hill data. Consequently, we chose it as the base model for large-scale fracture detection in granite buried hills in the South China Sea. Figure 4 illustrates the network architecture.
The network already possessed good feature extraction and classification abilities. Here, we employ the transfer learning strategy that uses all the weights of the pre-trained model as the initial weights, freezes the shallow weight parameters of the network, and fine-tunes the deep weights to adapt the pre-trained model to the new dataset. This is because shallow convolutional layers typically extract globally shared base features, while deeper layers learn specific features that are closely related to the specific task. This approach is referred to as partial fine-tuning (PFT) when the learning rate is low, to avoid sudden changes in the weights during the backpropagation. The number of epochs is also kept low to avoid overfitting (epoch = 25 in this study). The training process is performed with the Adam optimizer (Kingma and Ba, 2014) to adjust the model weights and bias. As shown in Equation 4, it is an easy-to-implement algorithm that is computationally efficient and memory-friendly, suitable for addressing optimization problems with large-scale data and high levels of noise:
where
Binary balanced cross-entropy loss (Xie and Tu, 2015) is one of the most commonly used loss functions in fault detection at present, which can alleviate class imbalance to a certain extent. The calculation formula is as shown in Equation 5:
where
where
in this study,
To combine the focus of BCE and Dice losses on individual and overall pixels, respectively, this study employs BCE loss and Dice loss to construct a weighted hybrid loss function, termed WHBD loss, which effectively alleviates the class imbalance problem in fault data. Figure 5 illustrates the accuracy and loss curves for transfer training with different fusion ratios. The light blue curve in the figure depicts the model’s performance on both the training and validation sets when utilizing BCE loss. In this scenario, while the training set loss continues to decrease, the validation set loss begins to oscillate from the 10th epoch, suggesting that it is prone to overfitting during training with a small sample size. The final model stabilizes at approximately 87% accuracy on both the training and validation sets. The WHBD loss function effectively resolves the oscillation issue on the validation set, and when the weighted ratio of BCE to Dice is set at 3:7, the loss curves on the training and validation sets converge rapidly and decrease steadily. Simultaneously, the accuracy curve also exhibits the most stable upward trend, with the final model achieving a stable accuracy of approximately 96% on both the training and validation sets. Consequently, this study selects the fine-tuned model trained with a 3:7 weighted hybrid loss to perform large-scale fracture detection for the entire buried-hill dataset.

Figure 5. Model accuracy and loss curves trained with different weighting ratios. (A) Accuracy convergence curves on training and validation sets; (B) Loss convergence curves on training and validation sets.
4.3 Medium-to-small-scale fracture identification with HR ant tracking based on MVMD frequency division and sensitive attribute preferences
In this study, we introduce the multi-channel variational mode decomposition (MVMD) to perform high-precision frequency division on the buried hill A in the South China Sea. Through analysis, we determine the mid-frequency band as the advantageous frequency range. Based on this, we calculate various discontinuity detection attributes, compare and prefer the sensitive attribute of the buried hill reservoir, and utilize it as an input for high-resolution (HR) ant tracking. We term this approach of combining advantageous frequency band analysis with sensitive attribute selection as the “double optimization” strategy. Ultimately, we obtain the medium-to-small-scale fracture predicted probability cube.
4.3.1 High-precision frequency division technique based on multi-channel variational mode decomposition
Variational mode decomposition (VMD) is an adaptive nonlinear signal decomposition method (Dragomiretskiy and Zosso, 2014) that effectively addresses the mode-mixing issue in conventional time-frequency analysis when the frequencies are close. It has been widely applied in signal processing and seismic data analysis. MVMD (Rehman and Aftab, 2019) extends VMD from one dimension to multiple dimensions, ensuring consistency in component frequencies across various channels during decomposition, thereby further enhancing the lateral stability in frequency division. When acquiring the intrinsic mode function (IMF) components, MVMD introduces a variational model into the signal decomposition based on the common frequency components present in each channel of the input data. This process constructs an optimization problem to determine the optimal solution for the variational model, where the IMF components of all channels iteratively update their center frequencies and finite bandwidths simultaneously, thus adaptively obtaining K IMF components. For input data
Step 1: Assume the existence of K multivariate modulated oscillations
where
Step 2: Utilize the Hilbert transform to analytically represent each element in vector
where
Step 3: Solve the variational problem mentioned above by constructing an augmented Lagrangian representation, as shown in Equation 10:
where
Step 4: Iteratively update the analytic signal
where
This study employs the MVMD technique to perform high-precision frequency division on buried-hill data. Figure 6 shows the frequency division results of the seismic data, with a), b), and c) representing low-, medium-, and high-frequency volumes, respectively. As indicated by the orange box, the medium-frequency information within the buried hill is abundant, and the medium-frequency data exhibits high resolution and can clearly reflect the detailed information within the buried hill. The reflection boundaries of low-frequency data are blurred with interference from adjacent seismic events. The energy of the high-frequency data is primarily concentrated in shallow regions, with little high-frequency information contained within the buried hill. This may be related to the absorption and attenuation of the seismic waves. Therefore, this study prefers the medium-frequency volume for predicting and characterizing medium-to-small-scale fracture information within buried hill A.

Figure 6. MVMD frequency division. (A) Low-frequency volume; (B) Medium-frequency volume; (C) High-frequency volume.
4.3.2 Discontinuity detection attributes
For the identifiable medium-to-small-scale fracture information in seismic data, this paper calculates various discontinuity detection attributes and selects curvature as the sensitive attribute to perform the high-resolution ant tracking. Therefore, this section elaborates on these technical principles.
4.3.2.1 Curvature
According to Lisle (1994), curvature characteristics show a consistent relationship with the tensile fractures observed in the outcrop data. Generally, as deformation and folding intensify, the bending degree of the strata increases, leading to an increase in curvature. In this context, the tensile stress on the rock increases, thereby promoting the development of tensile fractures. Roberts (2001) elaborated on the fundamental theory of curvature properties and provided derivation formulas for surface curvature attributes. His research indicated that curvature properties exhibit high sensitivity to medium-to-small-scale fractures. Physically, curvature represents the degree of bending on a curve at a certain point, which can be defined in the following differential form:
Equation 14 indicates that the curvature value is absolute, whereas in the geological field, the curvature exhibits positive and negative distinctions. When a local stratum is horizontal, the normal vectors at each point are parallel to each other, resulting in a zero curvature. When the stratum is convex (anticline), the normal vectors diverge, resulting in a positive curvature. Conversely, when the local stratum is concave (syncline), the normal vectors converge, resulting in negative curvature. In the geological field, we focus only on normal curvature.
To fully express the physical significance of seismic data, 3D curvature is defined as follows: Assuming a plane intersects the stratigraphic surface along a straight line, the curvature at all points on this line can be obtained using Equation 14. Therefore, the calculation of 3D curvature can be transformed into a 2D curvature calculation. For an extracted stratigraphic surface, a quadratic surface
where a, b, c, d, e, and f are coefficients, a, b, and c are second-order derivatives of the surface, d and e are first-order derivatives of the surface, and f is the position of the surface in space. They can be expressed as Equation 16:
where p and q represent the dip angles of the event in inline and crossline directions, respectively. Using these coefficients, various curvature attributes can be calculated, including mean curvature, gaussian curvature, principal curvatures, maximum curvature, and minimum curvature. Among them, the maximum positive curvature
In this study, the maximum positive curvature attribute is calculated with a vertical radius of 12 and inline/crossline radius of 3.
4.3.2.2 Ant tracking
Colorni et al. (1991) first introduced the concept of ant colony algorithm and abstracted its process into a specific mathematical problem. Randen et al. (2001) applied ant colony algorithms to extract seismic attributes that are indicative of fractures. This principle involves utilizing electronic ants to search for discontinuous breakpoints within a region and mark them, attracting nearby ants to trace anomalies, and ultimately identifying subtle signal anomalies within the data through collective effort. However, because of the sensitivity of ant tracking to variations in seismic data, they are prone to being influenced by noise. Typically, we initially utilize seismic attributes to convert discontinuous features in amplitude volumes into relatively continuous fracture information. Subsequently, we employ ant colony algorithms to comprehensively trace and enhance the fracture and fault information, enabling 3D visualization.
The ant-tracing attributes are controlled by a series of tracking parameters, including the initial boundaries, deviation angles, search step size, allowed illegal steps, allowed legal steps, and stop criteria. To obtain clearer fracture detection results, we select a more sensitive combination of parameters, as detailed in Table 2. Considering the geological background of the study area, the buried-hill region has undergone intense weathering and leaching, resulting in the omnidirectional development of medium-to-small-scale fractures. Therefore, when constructing the initial ant colony system, we only apply dip-angle filtering and did not include azimuthal filtering.
4.4 Deterministic modeling of discrete fracture networks
Discrete fracture network (DFN) model (Baecher, 1983; Zhang et al., 2016) employs an object-oriented geostatistical modeling approach to establish intricate fracture sets by individually generating fracture segments. Each fracture segment possesses a series of attributes, such as location, orientation, morphology, and aperture, enabling an accurate and detailed description of multi-scale fracture systems from geometric morphology to fluid flow behavior. In this study, we use the probability cubes of multi-scale fractures as trend constraints to perform deterministic modeling, creating fracture segment sets at different scales. Finally, we provide a unified description of flow characteristics.
5 Results
5.1 Large-scale fracture detection
This paper utilizes the pre-trained U-SegNet model and transfer learning to conduct large-scale fracture detection. To maximize the effectiveness of transfer learning, we require preprocessing of real datasets to closely match the training conditions of the base model. This process involved four main steps. 1) Data normalization: Owing to the significant amplitude differences between the actual seismic and synthetic data, normalization (i.e., subtracting the mean and dividing by the standard deviation) is necessary to match the synthetic data. 2) Data labeling: Referring to fault profiles interpreted by geological experts, large-scale fracture labeling for typical profiles in the target area is completed (Figure 7). 3) 3D expansion and random cropping: Because manual labeling is based on profile data, we need to replicate the seismic and label images into 3D volumes and then randomly crop them to a size of 128 × 128 × 128 to meet the input and output requirements of the model. 4) Data augmentation: Manual labeling is costly and limited in reference materials. To reduce the probability of overfitting during transfer learning, we horizontally and vertically flip the labeled samples, ultimately generating 105 sets of 3D images containing actual seismic and large-scale fracture labels.
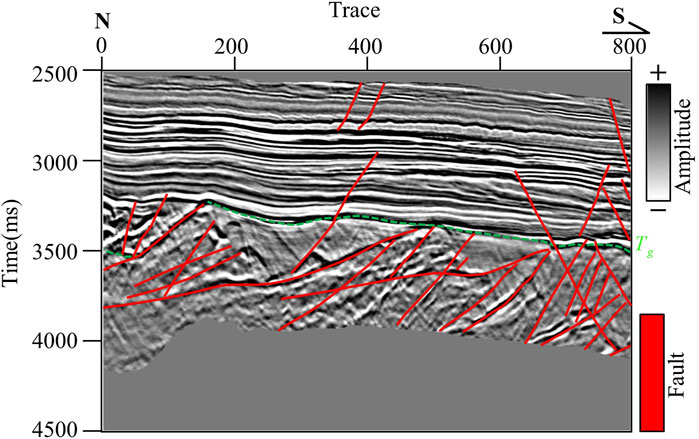
Figure 7. The typical seismic profile and large-scale fracture labels of buried hill (Tg represents the top of buried hill).
The environment used for training and testing the network is a computer equipped with a 12th Gen Intel(R) Core (TM) i7-12700 with 12 compute cores and 20 compute threads at 2.10 GHz and 32G of RAM. The deep learning platform uses Tensorflow-CPU version 2.10.0. We use the pre-trained U-SegNet as a base model and apply partial fine-tuning to adapt it to buried-hill data. Table 3 presents the parameters and numerical performance for both the base model and the transfer learning model. The evaluation metrics are calculated based on the entire real training dataset. We consider the fracture classes as the positive class.
The base model exhibits low specificity, resulting in numerous false positives. Additionally, its sensitivity is also low, indicating that many fractures may be missed in practice. Despite the low proportion of the ‘fracture’ class in the actual dataset, transfer learning models have successfully enhanced sensitivity. Particularly, the fine-tuned model trained with WHBD loss demonstrates excellent specificity. Due to the high imbalance in the dataset, specificity and accuracy are inadequate metrics for evaluating model performance, as 1% specificity could translate to hundreds of false positives in real-world scenarios. Therefore, we employ F1 score to assess overall performance, which represents a weighted average of sensitivity and specificity, reflecting the ability to correctly classify fractures and non-fractures. Furthermore, we utilize the AUC score to assess model performance, where a higher score indicates a lower false positive rate. Across multiple metrics, the WHBD-PFT model effectively highlights most large-scale fractures while reducing misidentifications.
We compare the detection results of deep learning with those of the seismic attributes (coherence and fault factor). Figure 8 shows the detection results of the cross-well profiles of wells A-C. Figure 8A shows the original seismic data profile, with the buried hill top marked by a green dashed line, representing the Tg layer. Figure 8B and c depict detections using coherence and fault factor, which are two commonly used attributes for identifying large-scale fractures. Owing to the influence of multiple tectonic movements in the study area, the fracture system is complex and the seismic response exhibits high-angle chaotic reflections. Traditional attributes detect fractures based on the discontinuity of seismic reflections, resulting in fragmented identifications in the buried hill data, which cannot meet the requirements for fine characterization of large-scale fractures. Figures 8D–F display the detections using three deep learning methods: the base model, BCE-PFT, and WHBD-PFT. Compared with traditional attributes, the accuracy and continuity of fracture identification using neural networks are significantly improved. Among them, the base model exhibits low identification accuracy, with numerous missed detections and false positives. While the BCE-PFT model enhances continuity to some extent, it still detects a considerable number of false positives. The WHBD-PFT significantly enhances the continuity of fracture detection, achieving optimal noise resistance and accuracy within the buried hill. The fracture morphology is clear (as indicated by yellow arrows), and both false positives and missed detections in shallow regions are notably reduced (blue arrows).
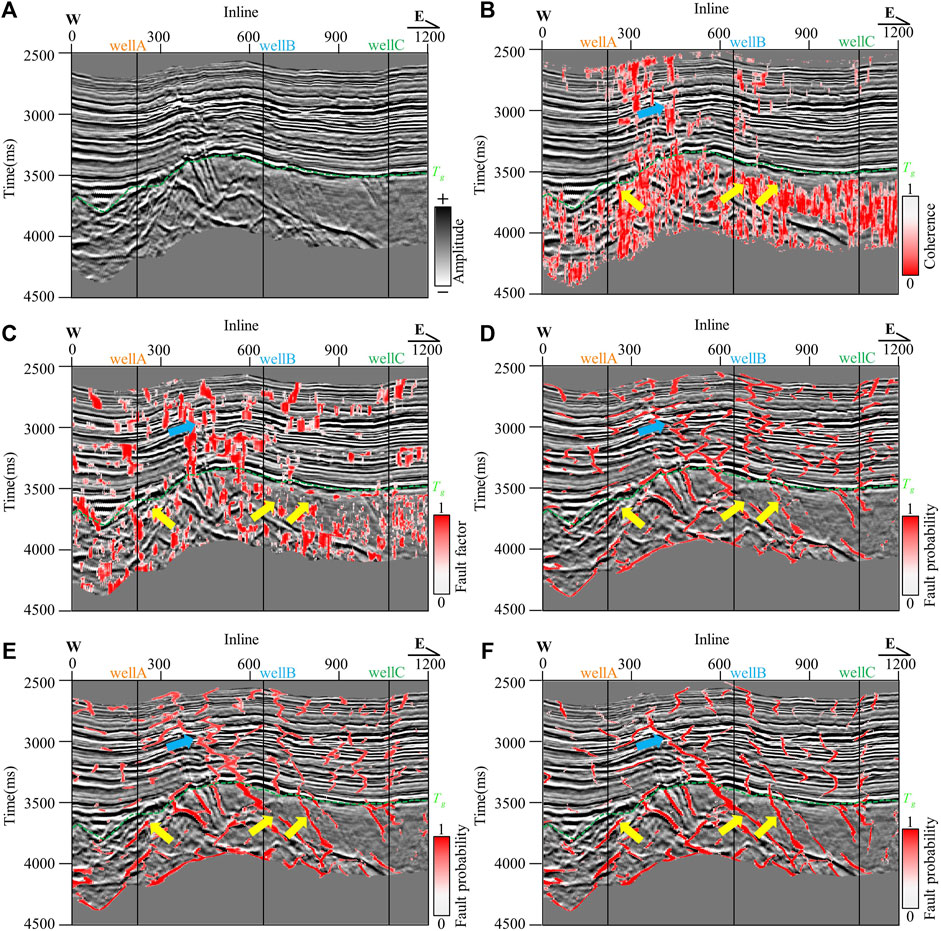
Figure 8. Comparison of large-scale fracture detection results for the cross-well profile. (A) Cross-well seismic profile; (B) and (C) Predicted results for coherence and fault factor attributes, respectively; (D–F) Predicted results using the base model, BCE-PFT, and WHBD-PFT, respectively.
To further observe the fracture distribution characteristics within the buried hill, we extract stratigraphic slices for each method, as shown in Figure 9 (25 ms down along Tg). Figure 9A presents a manually interpreted basement fracture distribution by geological experts, which we consider as a trend reference. Attributes exhibit low recognition accuracy and poor continuity owing to stratum fragmentation and chaotic reflections, making it difficult to characterize the planar distribution of fractures within the buried hill. The base model shows a noticeable improvement in performance compared to the attributes; however, its detected fractures exhibit poorer continuity and incompleteness when compared to Figure 9A. The BCE-PFT enhances continuity significantly but still lacks detailed information. Overall, the WHBD-PFT further enhances continuity, depicting clear fracture plane strikes and rich details (as indicated by red arrows). Well B is located between two large-scale NW-oriented fractures, and the WHBD-PFT detection results are consistent with geological priors, successfully capturing the features of NW-NWW fractures intersecting NE-NEE fractures (as shown in the blue box). Compared to Figure 9A, the WHBD-PFT model still cannot detect all fractures (this may be related to too few labeled samples), but it is capable of identifying most basement fracture locations, assisting in identifying and analyzing the large-scale fracture distribution characteristics within the buried hill, thereby better guiding the prediction of buried-hill reservoirs.
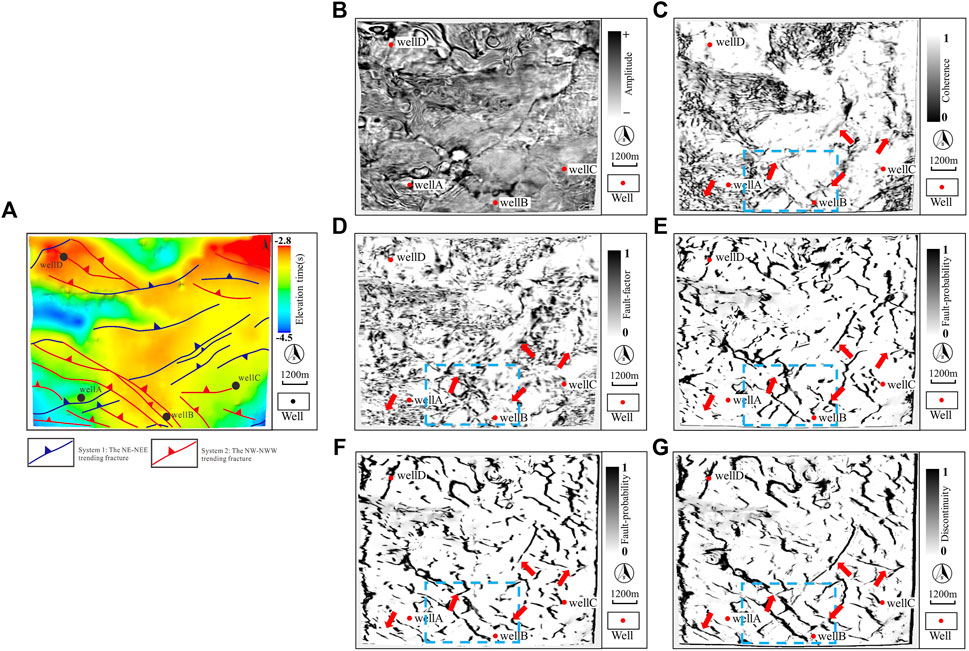
Figure 9. Comparison of stratigraphic slices for large-scale fracture detection results (25 ms down along Tg). (A) Distribution of large-scale basement fractures within buried hill interpreted by geological experts; (B) Stratigraphic slice of seismic amplitude; (C) and (D) Predicted results for the coherence and fault factor attributes, respectively; (E–G) Predicted results using the base model, BCE-PFT, and WHBD-PFT, respectively.
5.2 Medium-to-small-scale fracture prediction
The discontinuous attribute profiles and slices calculated based on the advantageous frequency band are shown in Figures 10, 11, respectively. As shown in Figure 10, the mid-frequency curvature exhibits a higher resolution compared to the mid-frequency variance and coherence, and it is more effective in reflecting medium-to-small-scale fracture patterns within the buried hill. Consequently, it is selected as the sensitive attribute for calculating high-resolution ant tracking, achieving a fine characterization of the high-angle reticulate fracture system in the buried-hill basement (indicated by red dashed lines). Figure 11A represents the edge detection attribute calculated from horizon Tg, which reflects the degree of stratigraphic deformation. The comparison reveals that the mid-frequency curvature provides rich and clear information about medium-to-small-scale fractures within the buried hill (marked by red arrows). The high-resolution ant tracking based on mid-frequency curvature can effectively characterize the dense fracture zones in the study area (marked by red dashed circles). The medium-to-small-scale fractures exhibit an overall omnidirectional development feature, which is consistent with the geological understanding of intense weathering and leaching in this region. The primary orientations include NNE, NEE, NNW, NWW, and EW.

Figure 10. Comparison of medium-to-small-scale fracture prediction results for the cross-well profile. (A) Cross-well seismic profile; (B–D) Mid-frequency variance, coherence, and curvature attributes, respectively; (E) High-resolution ant tracking based on mid-frequency curvature.
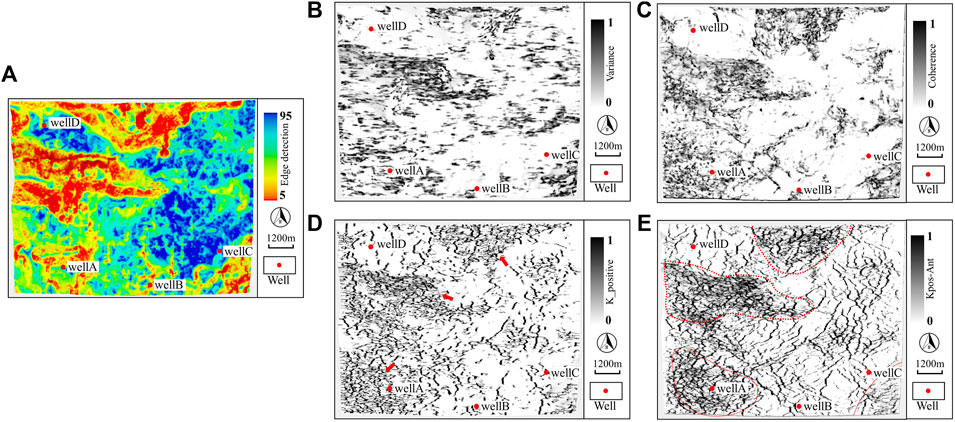
Figure 11. Comparison of stratigraphic slices for medium-to-small-scale fracture prediction results (25 ms down along Tg). (A) Edge detection attribute derived from Tg; (B), (C, D) Mid-frequency variance, coherence, and curvature attributes, respectively; (E) High-resolution ant tracking based on mid-frequency curvature.
Additionally, we separately extract the stratigraphic slices of full- and mid-frequency ant-tracking volumes and overlap them with the edge detection attribute, as shown in Figure 12. Through comparison, we find that mid-frequency ant-tracking significantly improves fracture identification accuracy, enabling rapid recognition of medium-to-small-scale fracture dense zones, which are predominantly concentrated in areas with significant tectonic deformation. This demonstrates that the advantageous frequency band analysis and the selection of sensitive attributes are crucial for enhancing the precision of buried-hill fracture prediction. However, the sensitive attributes corresponding to different regions and reservoir types vary. Therefore, it is necessary to test and determine appropriate attributes based on the specific conditions of each case.

Figure 12. Comparison of full- and mid-frequency ant tracking slices (25 ms down along Tg). (A) Full-frequency curvature - ant tracking; (B) Mid-frequency curvature - ant tracking.
5.3 Multi-scale fine characterization of fractured reservoirs
Natural fractures exhibit multi-scale characteristics, and fractures of different scales have varying effects on the physical properties of reservoirs. Multi-scale characterization of fractures is crucial for reservoir prediction. This study, based on the precise prediction of fractures at different scales, utilizes discrete fracture network modeling to characterize a series of attributes, such as the location, orientation, and morphology of fractures, thereby achieving a realistic and detailed description of the fracture system from geometric shape to percolation behavior. Large-scale fractures play a key role in hydrocarbon seepage. We adopt the fracture probability cube established in Section 5.1 using U-SegNet and WHBD loss transfer learning as a trend constraint to conduct deterministic modeling of large-scale fractures. Figure 13A and b show the generated fracture segment model and rose scatter diagram of type I, indicating that the development density of large-scale fractures in the study area is relatively low, characterized by sparse distribution, with the main strike orientations being NW and NE (indicated by light-yellow sectors). Medium-to-small-scale fractures are crucial for hydrocarbon storage. We utilize the ant-tracking volume established in Section 5.2 based on high-precision frequency division and sensitive attribute preferences as a trend constraint to carry out deterministic modeling of medium-to-small-scale fractures. Figure 13C and d show the generated fracture segment model and rose scatter diagram of type II, revealing that the development density of medium-to-small-scale fractures in the study area is relatively high, characterized by a dense distribution with random strike orientations, displaying omnidirectional development.
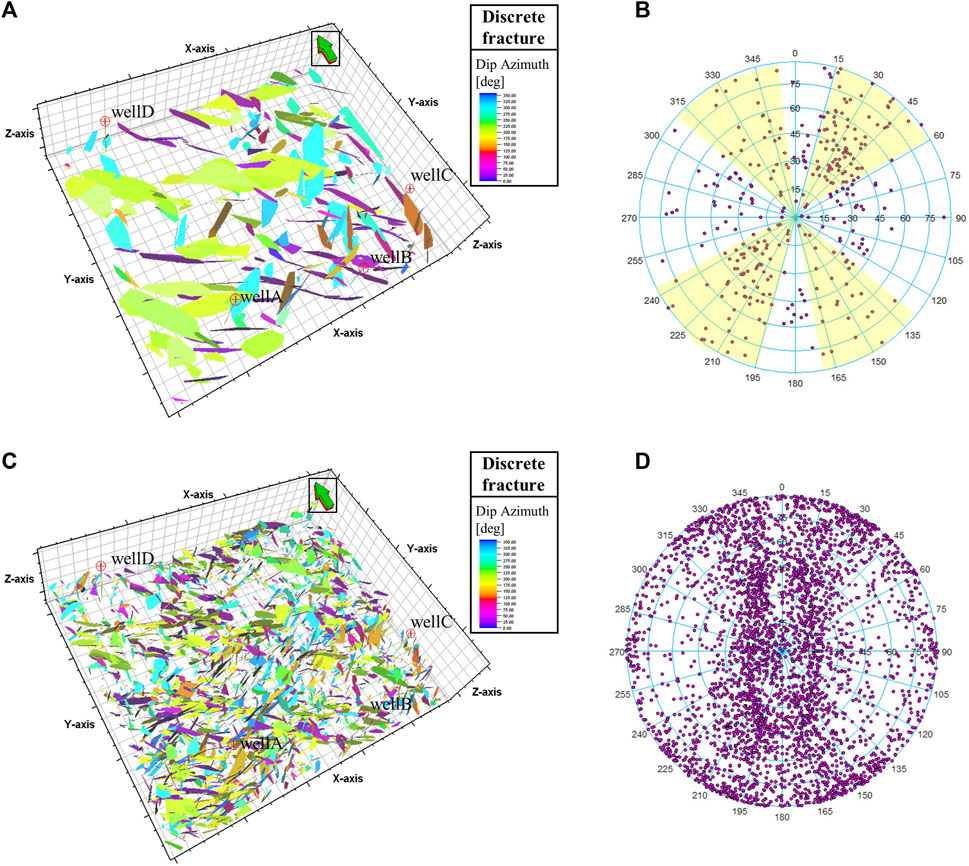
Figure 13. Fracture segment models and their rose scatter diagrams at various scales. (A, B) Large-scale fracture segment model (type I) and its rose scatter diagram; (C, D) Medium-to-small-scale fracture segment model (type II) and its rose scatter diagram.
By combining the two types of fracture segment models, we generate a discrete fracture network (DFN) model of granite buried hill A. The model results (Figure 14A) show that many medium-to-small-scale fractures develop near large-scale fractures, and their orientations are basically the same as those of large fractures, which aligns with geological understanding. According to the statistical analysis results (Figures 14B–D), the fracture dip angles are primarily concentrated between 40° and 90°, with a preponderance of high-angle fractures. The fracture lengths are concentrated within 0–600 m, suggesting the dominance of medium-to-small-scale fractures. Furthermore, the fracture apertures are concentrated between 0 mm and 10 mm.
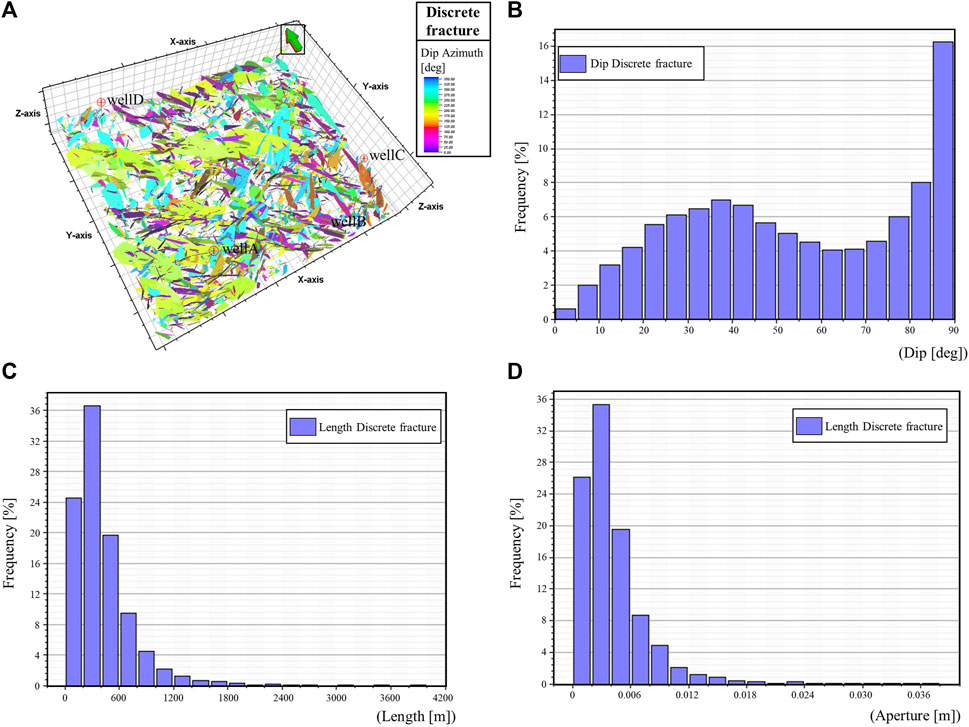
Figure 14. Discrete fracture network model and frequency histograms of fracture parameters. (A) DFN model; (B) Fracture dip angle; (C) Fracture length; (D) Fracture aperture.
Based on the characterization and depiction of the fracture geometric morphology, we further characterize the percolation behavior through the “equivalence” using the DFN model. Specifically, the ODA algorithm (Oda et al., 1993; Lang and Guo, 2013) is employed to calculate the effective fracture porosity and permeability. The fracture porosity is “equivalence” determined by the fracture length and aperture, while the fracture permeability is “equivalence” determined by the fracture network and aperture. The simulation results are shown in Figure 15. Well A, known as a high-yield well, is located in an area with high porosity and good permeability, validating the rationality of characterization results. Overall, the western part of the study area exhibits favorable reservoir properties and can be considered a potential target for future exploration.
6 Conclusion
This study successfully proposes a multi-scale fracture prediction and characterization technology system that combines traditional and intelligent methods. This provides an effective solution to the challenges faced in identifying buried-hill multi-scale fractures from post-stack seismic data in the early stages of exploration. By introducing the pre-trained U-SegNet model and transfer learning strategy, we significantly improve the detection accuracy and continuity of large-scale fractures within the buried hill. Moreover, the proposed weighted hybrid binary dice loss (WHBD loss) effectively resolve the oscillation issue of traditional loss functions on the validation set, enhancing the accuracy of transfer training. For medium-to-small-scale fractures prediction, we adopt a “double-optimization” strategy combining high-precision frequency division processing, advantageous frequency band analysis, and sensitive attribute preferences. By calculating the high-resolution ant-tracking, we achieve a fine depiction of medium-to-small-scale fracture zones within the buried hill A. Based on this, we construct fracture segment models and fracture property models of various scales through a discrete fracture network model, realizing a comprehensive characterization of the buried hill A fracture reservoir from geometric morphology to percolation characteristics. It provides a scientific basis for the subsequent evaluation and selection of exploration targets. At the same time, it offers valuable references for identifying and characterizing multi-scale fractures under similar geological conditions.
Data availability statement
The original contributions presented in the study are included in the article/Supplementary Material, further inquiries can be directed to the corresponding author.
Author contributions
JL: Conceptualization, Data curation, Investigation, Methodology, Software, Writing–original draft. HZ: Project administration, Resources, Supervision, Writing–review and editing. LL: Methodology, Validation, Writing–original draft. CN: Data curation, Resources, Writing–review and editing. QL: Formal Analysis, Validation, Writing–original draft.
Funding
The author(s) declare that financial support was received for the research, authorship, and/or publication of this article. CNPC Innovation Found (2021DQ02-0104) and Research on Fine Exploration and Surrounding Rock Classification Technology for Deep Buried Long Tunnels Driven by Horizontal Directional Drilling and Magnetotelluric Methods Based on Deep Learning (E202408010).
Conflict of interest
Author CN was employed by CNOOC Research Institute Ltd, National Engineering Research Center of Offshore Oil and Gas Exploration. Author QL was employed by Bureau of Geophysical Prospecting INC., China National Petroleum Corporation.
The remaining authors declare that the research was conducted in the absence of any commercial or financial relationships that could be construed as a potential conflict of interest.
Publisher’s note
All claims expressed in this article are solely those of the authors and do not necessarily represent those of their affiliated organizations, or those of the publisher, the editors and the reviewers. Any product that may be evaluated in this article, or claim that may be made by its manufacturer, is not guaranteed or endorsed by the publisher.
Supplementary material
The Supplementary Material for this article can be found online at: https://www.frontiersin.org/articles/10.3389/feart.2024.1456122/full#supplementary-material
References
Al-Dossary, S., and Marfurt, K. J. (2006). 3D volumetric multispectral estimates of reflector curvature and rotation. Geophysics 71 (5), P41–P51. doi:10.1190/1.2242449
Badrinarayanan, V., Kendall, A., and Cipolla, R. (2017). SegNet: a deep convolutional encoder-decoder architecture for image segmentation. IEEE Trans. Pattern Anal. Mach. Intell. 39 (12), 2481–2495. doi:10.1109/tpami.2016.2644615
Baecher, G. B. (1983). Statistical analysis of rock mass fracturing. J. Int. Assoc. Math. Geol. 15 (2), 329–348. doi:10.1007/bf01036074
Bahorich, M., and Farmer, S. (1995). 3-D seismic discontinuity for faults and stratigraphic features: the coherence cube. Lead. Edge 14 (10), 1053–1058. doi:10.1190/1.1437077
Bahrainian, S. S., Dezfuli, A. D., and Noghrehabadi, A. (2015). Unstructured grid generation in porous domains for flow simulations with discrete-fracture network model. Transp. Porous Media 109 (3), 1–17. doi:10.1007/s11242-015-0544-3
Bakker, P. (2002). Image Structure Analysis for Seismic Interpretation. [Ph. D. thesis]. Delft: Delft University of Technology.
Cai, G. F., Zhang, X. T., Peng, G. R., Wu, J., Liu, B. J., Bai, H. J., et al. (2021). Neogene volcanism and tectonics along the Yangjing-Yitong'ansha fault zone in the northern South China Sea margin. Geotect. Metallogenia 45 (1), 40–52. doi:10.16539/j.ddgzyckx.2021.01.004
Chehrazi, A., Rahimpour-Bonab, H., and Rezaee, M. R. (2013). Seismic data conditioning and neural network-based attribute selection for enhanced fault detection. Petrol. Geosci. 19 (2), 169–183. doi:10.1144/petgeo2011-001
Chen, C. M., Shi, H. S., Xu, S. C., and Chen, X. K. (2003). Formation conditions of tertiary oil and gas reservoirs in the Pearl River Mouth basin (east). Beijing: Science Press, 1–19.
Chopra, S., and Marfurt, K. J. (2007). Seismic attributes for prospect identification and reservoir characterization. Tulsa: Society of Exploration Geophysicists.
Colorni, A., Dorigo, M., and Maniezzo, V. (1991). “Distributed optimization by ant colonies,” in Proceedings of the European conference on artificial life (Paris), 134–142.
Cui, J. T. (2010). China's offshore oil and gas exploration and development into the 'deepwater area. China Ocean. News. 2010-03-30(002).
Cunha, A., Pochet, A., Lopes, H., and Gattass, M. (2020). Seismic fault detection in real data using transfer learning from a convolutional neural network pre-trained with synthetic seismic data. Comput. Geosci. 135, 104344. doi:10.1016/j.cageo.2019.104344
Dalley, R. M., Gevers, E. C. A., Stampfli, G. M., Davies, D., Gastaldi, C., Ruijtenberg, P., et al. (2007). Dip and azimuth displays for 3D seismic interpretation. First Break 25 (12), 101–108. doi:10.3997/1365-2397.2007031
Di, H., and Gao, D. (2013). Gray-level transformation and Canny edge detection for 3D seismic discontinuity enhancement. Comput. Geosciences 72, 192–200. doi:10.1016/j.cageo.2014.07.011
Di, H., Shafiq, M., and AlRegib, G. (2018). Patch-level MLP classification for improved fault detection: 88th Annual International Meeting, SEG, Expanded Abstracts. Tulsa. Society of Exploration Geophysicists, 2211–2215. doi:10.1190/segam2018-2996921.1
Dong, M. C., Lv, H. T., Pu, R. H., and Cao, Z. C. (2016). Charactertistics of strike-slip fault and its hydrocarbon geological significance in the eastern of central Tarism Basin. Geophys. Prospect. Petroleum 55 (6), 840–850. doi:10.3969/j.issn.1000-1441.2016.06.009
Dragomiretskiy, K., and Zosso, D. (2014). Variational mode decomposition. IEEE Trans. IEEE Trans. Signal Process 62 (3), 531–544. doi:10.1109/tsp.2013.2288675
Gao, D. (2013). Integrating 3D seismic curvature and curvature gradient attributes for fracture characterization: methodologies and interpretational implications. Geophysics 78 (2), O21–O31. doi:10.1190/geo2012-0190.1
Guo, B., Li, L., and Luo, Y. (2018). A new method for automatic seismic fault detection using convolutional neural network: 88th Annual International Meeting. Seg. Expand. Abstr., 1951–1955. doi:10.1190/segam2018-2995894.1
Hale, D. (2013). Methods to compute fault images, extract fault surfaces, and estimate fault throws from 3D seismic images. Geophysics 78 (2), O33–O43. doi:10.1190/geo2012-0331.1
Huang, L., Dong, X., and Clee, T. E. (2017). A scalable deep learning platform for identifying geologic features from seismic attributes. Lead. Edge 36 (3), 249–256. doi:10.1190/tle36030249.1
Huang, Z. Q., Wang, Y. Y., and Tao, K. (2011). Numerical study on two-phase flow through fractured porous media. Sci. China Technol. Sci. 54 (9), 2412–2420. doi:10.1007/s11431-011-4480-3
Jia, C. Z. (2022). National oil and gas exploration and development situation and development prospects. China Petroleum Petrochem. 20, 14–17. doi:10.15953/j.1004-4140.2022.31.02.01
Kim, J. G., and Deo, M. D. (2000). Finite element discrete-fracture mod-el for multiphase flow in porous media. Aiche J. 46 (6), 1120–1130. doi:10.1002/aic.690460604
Kingma, D. P., and Ba, J. (2014). Adam: a method for stochastic optimization. CoRR, 6980. doi:10.48550/arXiv.1412.6980
Lang, X. L., and Guo, Z. J. (2013). Fractured reservoir modeling method based on discrete fracture network model. Acta Sci. Nat. Univ. Pekin. 49 (6), 964–972. doi:10.13209/j.0479-8023.2013.128
Li, X., Li, K., Xu, Z., Huang, Z., and Dou, Y. (2023). Fault-Seg-Net: a method for seismic fault segmentation based on multi-scale feature fusion with imbalanced classification. Comput. Geotechnics 158, 105412. doi:10.1016/j.compgeo.2023.105412
Lisle, R. J. (1994). Detection of zones of abnormal strains in structures using Gaussian curvature analysis. AAPG Bull. 78, 1811–1819. doi:10.1306/a25ff305-171b-11d7-8645000102c1865d
Liu, B. J., Pang, X., Xie, S. W., Mei, L. F., Zhen, J. Y., Sun, H., et al. (2022b). Control effect of crust-mantle detachment fault activity on deep large delta sedimentary system in Baiyun sag, Pearl River Mouth Basin. Earth Sci. 47 (7), 2354–2373. doi:10.3799/dqkx.2022.035
Liu, J., Gong, W., Huang, C., Li, W., Li, H. Y., Dong, X. B., et al. (2022a). Seismic attribute characteristics of an ultradeep fractured-reservoir in the northern section of Shunbei No.5 strike-slip fault zone in Tarim Basin. Bull. Geol. Sci. Technol. 41 (4), 1–11. doi:10.19509/j.cnki.dzkq.2022.0112
Liu, J. W., Yang, X., Lau, S., Wang, X., Luo, S., Lee, V. C., et al. (2020). Automated pavement crack detection and segmentation based on two-step convolutional neural network. Computer-Aided Civ. Infrastructure Eng. 35 (11), 1291–1305. doi:10.1111/mice.12622
Lu, Y. H., and Lu, W. K. (2009). Edge-preserving polynomial fitting method to suppress random seismic noise. Geophysics 74 (4), V69–V73. doi:10.1190/1.3129907
Lyu, F., Zhou, H. L., Liu, J. P., Zhou, J., Tao, B., and Wang, D. (2022). A buried hill fault detection method based on 3D U-SegNet and transfer learning. J. Petroleum Sci. Eng. 218, 110917. doi:10.1016/j.petrol.2022.110917
Lyu, Y. Y., Fu, G., Fu, X. F., and Sun, Y. H. (2013). The transporting and sealing roles of faults on hydrocarbon. Beijing: Petroleum Industry Press.
Ma, D. B., Zhao, Y. M., Zhang, Y. T., Yang, P. F., Yang, M., and Li, L. (2018). Application of maximum likelihood attribute to fault identification: a case study of Rewapu block in Halahatang area, Tarism Basin, NW China. Nat. Gas. Geosci. 29 (6), 817–825. doi:10.11764/j.issn.1672-1926.2018.04.006
Mallick, S., Craft, K. L., Meister, L. J., and Chambers, R. E. (1998). Determination of the principal directions of azimuthal anisotropy from P-wave seismic data. Geophysics 63 (2), 692–706. doi:10.1190/1.1444369
Marfurt, K. J., Kirlin, R. L., Farmer, S. L., and Bahorich, M. S. (1998). 3-D seismic attributes using a semblance-based coherency algorithm. Geophysics 63 (4), 1150–1165. doi:10.1190/1.1444415
Marfurt, K. J., Sudhaker, V., Gersztenkorn, A., Crawford, K. D., and Nissen, S. E. (1999). Coherency calculations in the presence of structural dip. Geophysics 64 (1), 104–111. doi:10.1190/1.1444508
Mi, L. J., Fan, H. J., Fan, T. E., Gong, L., Niu, T., Su, X., et al. (2023). Development characteristics of multi-scale fracture network systems in metamorphic buried hills. Front. Earth Sci. 10, 1108032. doi:10.3389/feart.2022.1108032
Naseer, M. T. (2024). Seismic attributes and quantitative inverse dynamical simulations for characterization of late Cretaceous classical fluvial meander channelized stratigraphic traps system, onshore Indus, Pakistan: implications for hydrocarbon exploration. Mar. Petroleum Geol. 161, 106623. doi:10.1016/j.marpetgeo.2023.106623
Oda, M., Yamabe, T., Ishizuka, Y., Kumasaka, H., Tada, H., and Kimura, K. (1993). Elastic stress and strain in jointed rock masses by means of crack tensor analysis. Rock Mech. Rock Eng. 26 (2), 89–112. doi:10.1007/bf01023618
Ouyang, M., Shi, J., Hu, T., Xu, G., and Zhao, D. (2020). 3D frequency-division fracture prediction in shale gas reservoir in Weiyuan area, Sichuan Basin, China (Article). J. Chengdu Univ. Technol. Sci. Technol. Ed. 47 (1), 75–84. doi:10.3969/j.issn.1671-9727.2020.01.07
Pan, S. J., and Yang, Q. (2010). A survey on transfer learning. IEEE Trans. Knowl. Data Eng. 22 (10), 1345–1359. doi:10.1109/tkde.2009.191
Pedersen, S. I., Randen, T., Sonneland, L., and Steen, Ø. (2002). Automatic Fault extraction using artificial ants. SEG Technical Program Expanded Abstracts. Tulsa. Society of Exploration Geophysicists. doi:10.1190/1.1817297
Peng, G. R., Zhang, L. L., Wu, Z., Xie, S. W., Zhao, J. F., Lu, F. R., et al. (2024). Distribution laws of intensively weathering and leached zones in deep-water buried hills of the Pearl River Mouth Basin and their controlling factors. Nat. Gas. Ind. 44 (1), 97–107.
Pin, Y., Di, Z., and Zhao, S. L. (2001). A crustal structure profile across the northern continental margin of the South China Sea. Tectonophysics 338 (1), 1–21. doi:10.1016/s0040-1951(01)00062-2
Pochet, A., Diniz, P. H. B., Lopes, H., and Gattass, M. (2019). Seismic Fault detection using convolutional neural networks trained on synthetic poststacked amplitude maps. IEEE Geosci. Remote Sens. Lett. 16 (3), 352–356. doi:10.1109/lgrs.2018.2875836
Rehman, N., and Aftab, H. (2019). Multivariate variational mode decomposition. IEEE Trans. Signal Process. 67 (23), 6039–6052. doi:10.1109/tsp.2019.2951223
Roberts, A. (2001). Curvature attributes and their application to 3D interpreted horizons. First Break 19 (2), 85–100. doi:10.1046/j.0263-5046.2001.00142.x
Ronneberger, O., Fischer, P., and Brox, T. (2015). “U-Net: convolutional networks for biomedical image segmentation,” in Medical image computing and computer-assisted intervention (MICCAI), 234–241.
Shi, X., Burov, E., Leroy, S., Qiu, X., and Xia, B. (2005). Intrusion and its implication for subsidence: a case from the Baiyun Sag on the northern margin of the South China Sea. Tectonophysics 407 (1), 117–134. doi:10.1016/j.tecto.2005.07.004
Sun, J., and Hou, S. (2024). Improving signal fidelity for deep learning-based seismic interference noise attenuation. Geophysical Prospecting, 72. Geophys. Prospect. 72 (1), 142–154. doi:10.1111/1365-2478.13268
Tingdahl, K., and Rooij, M. D. (2005). Semi-automatic detection of faults in 3D seismic data. Geophys. Prospect 53 (4), 533–542. doi:10.1111/j.1365-2478.2005.00489.x
Tolstaya, E., and Egorov, A. (2022). Deep learning for automated seismic facies classification. Interpretation 10 (2), SC31–SC40. doi:10.1190/int-2021-0140.1
Van Bemmel, P. P., and Pepper, R. E. (2000). Seismic signal processing method and apparatus for generating a cube of variance values. U. S. Pat. 6 (151)–555.
Vasconcelos, Y. I., and Grechka, V. (2007). Seismic characterization of multiple fracture sets at Rulison Field, Colorado. Geophysics 72 (2), B19–B30. doi:10.1190/1.2436779
Wang, F. G., Zhang, X. T., Mei, L. F., Yan, H., Liu, B. J., Zhang, Z. T., et al. (2023). Characteristics of Paleogene compression-extension deformation and exploration significance in the Baiyun East area, Pearl River Mouth basin. Bull. Geol. Sci. Technol. 42 (1), 246–252. doi:10.19509/j.cnki.dzkq.2022.0179
Wei, X. L., Zhang, C. X., Kim, S. W., Jing, K. L., Wang, Y. J., Xu, S., et al. (2022). Seismic fault detection using convolutional neural networks with focal loss. Comput. Geosciences 158, 104968. doi:10.1016/j.cageo.2021.104968
Wei, Z. J., Gan, J., Wu, Y., Li, J. C., He, W. T., and Wang, W. B. (2024). Analysis of hydrocarbon accumulation conditions and prediction of favorable targets for the buried-hill in the deep water area of Southeast Hainan Basin: case study of Lingnan low uplift. Nat. Gas. Geosci. 35 (2), 313–326. doi:10.11764/j.issn.1672-1926.2023.08.013
Weickert, J. (1999). Coherence-enhancing diffusion filtering. Int. J. Comput. Vis. 31 (2-3), 111–127. doi:10.1023/a:1008009714131
Weickert, J., and Scharr, H. (2002). A scheme for coherence-enhancing diffusion filtering with optimized rotation invariance. J. Vis. Commun. Image Represent. 13 (1-2), 103–118. doi:10.1006/jvci.2001.0495
Wu, X., and Hale, D. (2016). 3D seismic image processing for faults. Geophysics 81 (2), IM1–IM11. doi:10.1190/geo2015-0380.1
Wu, X., Liang, L., Shi, Y., and Fomel, S. (2019). FaultSeg3D: using synthetic data sets totrain an end-to-end convolutional neural network for 3D seismic fault segmentation. Geophysics 84, IM35–IM45. doi:10.1190/geo2018-0646.1
Xie, S., and Tu, Z. (2015). Holistically-nested edge detection. Proc. IEEE Int. Conf. Comput. Vis. 125, 3–18. doi:10.1007/s11263-017-1004-z
Yan, H. T. (2020). Attribute analysis and hydrocarbon detection based on generalized S transform of synchronous extrusion. Chengdu: Chengdu University of Technology. doi:10.26986/d.cnki.gcdlc.2020.000662
Yielding, G., Freeman, B., and Needham, D. T. (1997). Quantitative fault seal prediction. AAPG Bull. 81 (6), 897–917. doi:10.1306/522b498d-1727-11d7-8645000102c1865d
Yu, Y. X., Zhang, J., Zhang, Z. T., Zhang, G. C., Zeng, J. H., and Yu, L. (2022). Fault characteristics and its significances on hydrocarbon accumulation in northeastern Baiyun sag, Pearl River Mouth basin. Mar. Geol. Quat. Geol. 42 (3), 133–139. doi:10.16562/j.cnki.0256-1492.2022031401
Zeng, Q., and Yao, J. (2015). Numerical simulation of fluid-solid coupling in fractured porous media with discrete fracture model and extended finite element method. Computation 3 (4), 541–557. doi:10.3390/computation3040541
Zhang, G. Z., Chen, H. Z., Wang, Q., and Yin, X. Y. (2013). Prediction of shear wave velocity and anisotropy parameters based on carbonate fractured rock physics model. Chin. J. Geophys. 56 (05), 1707–1715. doi:10.6038/cjg20130528
Zhang, J., Li, J. Y., Chen, X. H., Li, Y., and Huang, G. (2021b). Robust deep learning seismic inversion with a priori initial model constraint. Geophys. J. Int. 225 (3), 2001–2019. doi:10.1093/gji/ggab074
Zhang, J., Zhao, X. Y., Chen, Y. K., and Sun, H. (2023). Domain knowledge-guided data-driven prestack seismic inversion using deep learning. Geophysics 88 (2), M31–M47. doi:10.1190/geo2021-0560.1
Zhang, J. W., Huang, H. D., Zhu, B. H., and Liao, W. (2017). Fluid identification based on P-wave anisotropy dispersion gradient inversion for fractured reservoirs. Acta Geophys. 65 (5), 1081–1093. doi:10.1007/s11600-017-0088-8
Zhang, N., Yao, J., Xue, S., and Huang, Z. (2016). Multiscale mixed finite element, discrete fracture-vug model for fluid flow in fractured vuggy porous media. Int. J. Heat Mass Transf. 96, 396–405. doi:10.1016/j.ijheatmasstransfer.2015.11.090
Zhang, X. X., Yu, J. J., Li, N. Y., and Chao, W. (2021a). Multi-scale fracture prediction and characterization method of a fractured carbonate reservoir. J. Petroleum Explor. Prod. Technol. 11, 191–202. doi:10.1007/s13202-020-01033-w
Zhao, S. J., Wu, S. G., Shi, H. S., Dong, D. D., Chen, D. X., and Wang, Y. (2012). Structures and dynamic mechanism related to the Dongsha movement at the northern margin of South China Sea. Prog. Geophys. 27 (3), 1008–1019. doi:10.6038/j.issn.1004-2903.2012.03.022
Zhou, F. Q. (2014). Development of an embedded discrete fracture model for multi-phase flow in fractured reservoir. Appl. Mech. Mater. 668, 1488–1492. doi:10.4028/.scientific.net/amm.668-669.1488
Keywords: granite buried hill, multi-scale fractures, deep learning, frequency-division attribute, fracture prediction and characterization, discrete fracture network model
Citation: Liu J, Zhou H, Liao L, Niu C and Li Q (2024) Post-stack multi-scale fracture prediction and characterization methods for granite buried hill reservoirs: a case study in the Pearl River Mouth Basin, South China Sea. Front. Earth Sci. 12:1456122. doi: 10.3389/feart.2024.1456122
Received: 28 June 2024; Accepted: 19 July 2024;
Published: 19 August 2024.
Edited by:
Qingchun Li, Chang’an University, ChinaCopyright © 2024 Liu, Zhou, Liao, Niu and Li. This is an open-access article distributed under the terms of the Creative Commons Attribution License (CC BY). The use, distribution or reproduction in other forums is permitted, provided the original author(s) and the copyright owner(s) are credited and that the original publication in this journal is cited, in accordance with accepted academic practice. No use, distribution or reproduction is permitted which does not comply with these terms.
*Correspondence: Huailai Zhou, emhvdWh1YWlsYWkwNkBjZHV0LmVkdS5jbg==
 Junping Liu
 Huailai Zhou1,2*