
94% of researchers rate our articles as excellent or good
Learn more about the work of our research integrity team to safeguard the quality of each article we publish.
Find out more
ORIGINAL RESEARCH article
Front. Earth Sci., 31 July 2024
Sec. Georeservoirs
Volume 12 - 2024 | https://doi.org/10.3389/feart.2024.1434820
 Anupam Yadav1*Saeed Hameed Aldulaimi2Farag M. A. Altalbawy3Praveen K. N. Raja4M. Janaki Ramudu5Nizomiddin Juraev6,7Hameed Hassan Khalaf8Bassam Farman Bassam9Nada Qasim Mohammed10Dunya Jameel Kassid11Ahmed Elawady12,13,14
 Mohammad Sina15*
The most widely used equation to calculate water saturation or suitable shaly water saturation in clean or shaly formation, respectively, is the modified Archie formula. The quality of Archie parameters including saturation exponent affects the preciseness of water saturation, and thus estimated oil and gas in place. Therefore, estimating the saturation exponent by the soft computation methods deems to be necessary. In this study, intelligent models such as multilayer perceptron neural network, least squares support vector machine, radial basis function neural network, and adaptive neuro-fuzzy inference system are developed to predict saturation exponent in terms of petrophysical data including porosity, absolute permeability, water saturation, true resistivity, and resistivity index by utilizing a databank for middle east oil and gas reservoirs. The introduced models are optimized using particle swarm optimization, genetic algorithm, and levenberg marquardt techniques. Graphical and statistical methods are used to demonstrate the capability of the constructed models. Based on the statistical indexes obtained for each model, it is found that radial basis function neural network, multilayer perceptron neural network, and least squares support vector machine are the most robust models as they possess the smallest mean squared error, root mean squared error and average absolute relative error as well as highest coefficient of determination. Moreover, the sensitivity analysis indicates that water saturation has the most effect and porosity has the least effect on the saturation exponent. The developed models are simple-to-use and time-consuming tools to predict saturation exponent without needing laboratory methods which are tedious and arduous.
The preliminary objective of an engineered program of formation analysis in the oil industry is the assessment of oil and gas in place in oil and gas reservoirs, respectively (Kravtsova et al., 2022; Nguyen et al., 2022). Archie’s parameters n, m and a are typically constant in a routine formation; however, saturation exponent (n) can be allocated a wide range of numbers from 2 to 20 in water-wet to strongly oil-wet formations in certain conditions. Myriad researchers argue that saturation exponent is strongly dependent on displacement history, wettability, and pore size distribution and it may be assigned a value from 2 to 10 (Hamada et al., 2002). Historically, cementation exponent (m) was a parameter in Archie equation that has accounted for most studies and researches; by the introduction of Pickett Plot to estimate m from the wireline measurements of resistivity and porosity, m becomes more variable which can be estimated by crossplot, while tortuosity factor a and saturation exponent n remain a preferred-not-touch parameters unless, for instance, there are some core measurements that can give a different value from two (n=2.) (Al-Hilali et al., 2015).
In the process of log interpretation, one is required to obtain precise values of Archie’s parameters in order to determine precise water saturation in reservoir formations (Hamada et al., 2002; Dernaika et al., 2007). Constant assumption of saturation exponent, especially in oil or gas reservoirs with a variety of rocky species, can be the last resort (Abdrashitova et al., 2022; Xiao et al., 2024; Zhao et al., 2024). The common method of calculating saturation exponent obtained through laboratory data is special core analysis which directly leads to Archie parameters from the core, but the problem with these methods is the cost and timing of the relevant experiments (Worthington and Pallatt, 1992; Hamada et al., 2002).
The literature indicates several reports on the determination of saturation exponent. Al-Hilali (Al-Hilali et al., 2015) introduced a simple petrophysics-based workflow to estimate water saturation exponent rigorously, and concluded that it can be put into practice in any shaly-sand, and carbonate reservoirs. Najafi and Goodarzi (2011) presented two novel techniques, namely, homogenous distribution of parameters (HDP), and modified genetic algorithm (MGA) to specify Archie’s equation parameters simultaneously, and further compared them with other traditional methods. Hamada (2010) put forth a new methodology to calculate Archie’s equation factors based on the 3-dimensional graph of three different parameters including water saturation, formation porosity, and formation water resistivity. The author additionally provided a comparison with other methods to ascertain the accuracy magnitude belonging to each method. Mardi et al. (2012) put forward an artificial network based approach to calculate saturation exponent, cementation factor, and water saturation.
In the past, empirical equations and some analysis techniques were used for many topics, including mechanics (Yu et al., 2023), coal (Su et al., 2023), carbon capture and storage (Feng et al., 2024), fluid mechanics (Li et al., 2024a), and gas hydrates (Li et al., 2023). Recently, novel methods based on soft computation has successfully been presented through extensive applications in chemical and petroleum disciplines (Gharbi, 1997; Aminian et al., 2000). These methods are immensely stronger than traditional statistical and classical regression techniques in obtaining precise relationships between input and output datapoints (Mohebbi and Kaydani, 2015). One main method is the use of artificial neural network (ANN) for highly non-linear and classification problems, renowned for its fast estimation, and generalization capability after effectively network training (Gharbi, 1997). Generally, saturation exponent might be accurately predicted in terms of petrophysical (well-log) data through the use of ANNs. Nonetheless, during the learning/training stage, a databank with small datapoints can often result in the overfitting issue resulting in poor capability, and non-generalization. Furthermore, a great deal of time and effort is generally needed to procure the network optimum structure using an iterative-based and tedious approach (Saxena and Saad, 2007; Dehghani et al., 2008). Another helpful methodology is the fuzzy inference system known as FIS. Throughout FIS modeling, membership functions are used to distribute linguistic fuzzy data, and classical set principle is progressed (Zeng and Singh, 1996). This metaheuristic algorithm can capture the non-linear and complex behavior observed, for instance, in multi-dimensional input and output environments (Li et al., 2024b; Li et al., 2020). It is also immensely powerful when dealing with systems characterized with not vividly specified disciplines, and high uncertainties which are usually detected in geoscience systems (Mohebbi and Kaydani, 2015). A more strong technique recognized as adaptive neuro-fuzzy inference system (ANFIS) utilizes the combined features of learning power associated in ANN, and explicit information illustration linked with FIS (Nowroozi et al., 2009).
Recent attempts on soft computation schemes have resulted in developing a supervised machine learning technique, namely, support vector machine (SVM) wherein its relating learning technique is incorporated for the purpose of pattern recognition and data analysis (Schölkopf et al., 1999). SVM has gained much attention for its magnificent performance when handling classification and harsh regression problems (Kamari et al., 2016). SVM has been widely implemented hugely in engineering, and science areas such as porosity and permeability prediction by lithology, well log data, recognition, text/speech detection, and pattern identification in medical science (Choisy and Belaid, 2001; Gao et al., 2001). EL-Sebakhy (El-Sebakhy, 2009) carried out SVM approach to calculate reservoir fluid PVT behavior with the objective of canceling out the limitations associated with the classical neural networks. Chamkalani et al. (Chamkalani et al., 2013) made use of least square SVM (LSSVM) to put forth a new scaling equation aiming at predicting asphaltene precipitation with adequate results.
The effect of input parameters on the output variable can be identified by the concept of “sensitivity analysis” (Helton et al., 2005; Patelli et al., 2010). Sensitivity analysis is imperative when one attempts to verify a model, and uncovers how much robust the results of a model is (Christopher Frey and Patil, 2002). Disparate methodologies are used for sensitivity analysis and uncertainty including response surface, differential analysis, fast probability integration, sampling-based techniques, and Fourier amplitude sensitivity test (Iman et al., 1981).
In this study, at first a sensitivity analysis is performed in order to determine the sensitive parameters via relevancy factor. Then, several modeling approaches such as radial basis function neural network (RBF-ANN), multilayer perceptron neural network (MLP-ANN), ANFIS and LSSVM are put forth to estimate saturation exponent. For this purpose, first, special core analysis (SCAL) reports are collected from 28 wells from a number of middle eastern oil and gas reservoirs and the data needed to estimate the saturation exponent is extracted from existing methods, including 653 saturations exponent datapoints as a function of porosity (PHI), absolute permeability (Ka), water saturation (Sw), true resistivity (RT), and resistivity index (RI). Next, around 75% and 25% of the gathered datapoints are divided in two subsets including training and testing, respectively, for the intelligent modeling process. The reliability and accuracy of the generated models are then examined via statistical and graphical approaches.
The databank used in this paper contains 653 core saturation data as a function of porosity (PHI), absolute permeability (Ka), water saturation (Sw), true resistivity (RT), and resistivity index (RI). Table 1 tabulates the statistics associated with the utilized data. Notice that within the realm of petrophysics which is the globe of measuring, estimating, and calculating underground geological formation data, it is widely accepted that rock saturation exponent is related to rock porosity, absolute permeability, water saturation, true resistivity and resistivity index, though the direction and magnitude are quite different for these parameters. This is why the input parameters in this study include porosity, absolute permeability, water saturation, true resistivity, and resistivity index.
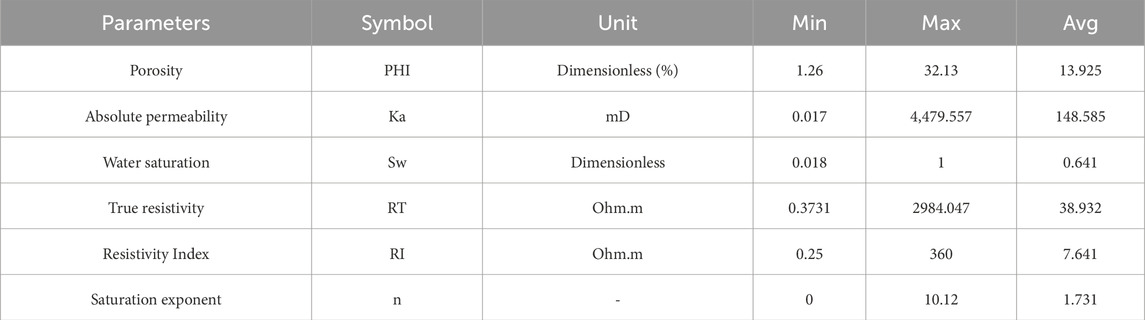
Table 1. Statistical parameters with regard to input and output parameters.
These days, machine learning is being used in various fields to predict key parameters (Zhou et al., 2022; Hu et al., 2024; Jiao et al., 2024). This paper is to apply machine learning algorithms to establish prediction models to model saturation exponent as a function of porosity, absolute permeability, water saturation, true resistivity and resistivity index. A brief introductory of the utilized machine learning algorithms is put forth below.
As a robust modeling methodology, artificial neural network (ANN) is capable of adopting to surrounding variation, efficiency enhancement, and training/learning from experience (Mohanraj et al., 2015). The most rudimentary element in ANN structure is recognized as neurons which are organized in disparate layers, and linked by connections. Two typical sorts of ANNs are named multilayer perceptron (MLP-ANN) and radial basis function (RBF-ANN) networks. MLP-ANN is generally characterized as three different layers of input, hidden, and output. Each hidden layer contains a number of neurons which are required to become optimized. In fact, the number of hidden layers, and neurons in each of them, and ultimately the optimal structure of MLP-ANN are attained through optimization techniques. When handling simple problems, one-hidden layer bearing MLP-ANN may be satisfactory; however, one should use a multi-hidden layer MLP-ANN when the data under study exhibit complicated behavior (Hemmati-Sarapardeh et al., 2016). The neurons prevailing in each hidden layer are connected with the neurons existing in the preceding and subsequent layers through interconnecting weight vectors. Each node value is multiplied via weight vector to estimate the proceeding node value located in the hidden/output layers associated with the implemented interconnection. Then, these values are summed up. Subsequently, a transfer function attempts to screen the summation of the achieved resultant with a bias coefficient. The screened value is ultimately assigned to a desirable neuron (Hemmati-Sarapardeh et al., 2018). It is worth noting that while “Linear” function is mainly put into practice in output layer, “Sigmoid” and “Tanh” transfer functions are generally utilized in intermediate layers. These functions are mathematically expressed as Eqs 1–3:
In which e is the Euler number and x being the input value. Taking into account “Sigmoid” and “Linear” transfer functions related to intermediate and output layers respectively, and a general network structure with solely one hidden layer, one may compute the output according to Eq. 4:
Wherein w1/b1 and w2/b2 represent weight bias coefficients relating to intermediate and output layers, correspondingly.
Network-based or adaptive neuro-fuzzy inference system (ANFIS) has widely been implemented in chemical and petroleum engineering disciplines as a predictive modeling approach. In order to overcompensate fuzzy system and neural network, Jang put forth ANFIS as a five-layered algorithm. ANFIS topology may be trained through back propagation and hybrid learning algorithms (Afshar et al., 2014).
Support vector machine (SVM) method categorized under machine learning discipline is mainly used for problem classification and regression analysis (Yao et al., 2006; Baylar et al., 2009). SVM-based techniques are more advantageous than ANN-based techniques because: overfitting issues are less likely to happen; the resultant model is more generalized and number of tuning coefficients are small; and network topology is not required to be determined. However, recent examinations have shown that the major shortcoming of SVM technique is the largescale quadratic programming problem (Van Gestel et al., 2002). To overcome the mentioned difficulty, a newer form of SVM, namely, least square SVM (LSSVM) has been developed. In this method, each embattled phenomenon is modeled using linear programming rather than quadratic equations. Consequently, any problem may be dealt with less intricacy (Ghiasi et al., 2014).
Eberhart and Kennedy (Eberhart and Kennedy, 1995) developed a population-based technique known as particle swarm optimization (PSO) behaviorally suggestive to population of animals including birds and insects. In this method, locations and velocities are initially assigned so as to initialize the preliminary population. Subsequently, each particle is evaluated via regression and statistical function analysis. During the simulation, particle location and velocity values are always being modified until a stopping criterion called fitness rate is reached, which terminates the mathematical procedure of PSO algorithm (Eberhart et al., 1996; Coulibaly and Baldwin, 2005).
As an evolutionary method, genetic algorithm (GA) was initially introduced for the purpose of problem optimization. Promising evolution of GA has been achieved using Mendel, Weisman, and Darwin’s theory genetics in this methodology (Bäck, 1997). The major property of GA algorithm is the detection of a different zone in a particular region (Hassan et al., 2005). This technique makes use of inversion, crossover, mutation as the genetic operators. The balanced between formation exploitation an exploration of new zones are supported by the genetic operations. GA strategy’s first stage is to initialize a population and specify the problem. Then, the generated potential solution via the initial population is scrutinized using a pre-defined fitness function. In the next step, the populations are categorized in accordance with each fitness value. Then, individual population is made through mutation and crossover operators. Honoring the stopping criterion marks the end of GA algorithm.
Levenberg-Marquardt (LM) methodology was presented when the traditional Newton technique was amended for the purpose of problem minimization efficiently. In this method, Hessian matrix, expressed below, is implemented within the equation of Newton-like weight update (Eq. 5):
In which η, x, e and J denote a scalar controlling learning process, weight of neural network, vector representing residual error, and Jacobian matrix, respectively (Daliakopoulos et al., 2005). Although LM optimization may only be implemented for small networks since it seeks large computations and memory occupations (Maier and Dandy, 1998), myriad reported applications in the literature report this technique promising and worthwhile (Anctil et al., 2004). The observed advantages of LM method over other techniques include higher convergence speed, less possibility of local minima entrapment, and larger stability and efficiency (Toth et al., 2000).
In the present paper, the acquired databank was initially categorized into two subsets of train (around 75% of the entire dataset), and testing (around 25% of the entire dataset), respectively. Training dataset was utilized to construct the model, then to validate the developed model, test dataset was made use of. It is worth noting that to cancel out the effect of large variations existing in the databank, the data were first normalized according to the formula defined below (Eq. 6):
Wherein n, nmax, nmin, and nnorm indicate actual datapoint, dataset maximum value, dataset minimum value, and normalized datapoint.
To conduct assessment of the generated models in this paper, a number of statistical formulations including mean squared error (MSE), standard deviation of error (SD), root mean squared error (RMSE), and coefficient of determination (R2), mathematically indicated below, are used (Eqs 7–10):
In the above four equations, N is the datapoint, and superscripts cal, and exp indicate calculated by the developed model and experimental saturation exponent, respectively. The mean value for each dataset is denoted by
To indicate to what an extent each input variable affects the output variable, sensitivity analysis is performed here. For this purpose, we use the concept of relevancy factor which can lie within −1 to 1. The relevancy factor is an index, demonstrating the direct and indirect relationship of each input parameter with the target variable. In addition, its value determines the magnitude of such effects. In this way, a positively and negatively derived relevancy factor means direct and indirect, respectively, of the input parameter under study with the target variable. Moreover, a larger value of this parameter for a specific input variable simply shows that it is more influential over the output parameter. Relevancy factor is defined as (Eq. 11):
The findings associated with sensitivity analysis on the saturation exponent using the relevancy concept is illustrated in Figure 1. As may be seen, among disparate input parameters, water saturation and porosity are the most and least effective factors on the saturation exponent. Moreover, we can conclude in contrast to absolute permeability and water saturation parameters, porosity, true resistivity and resistivity index factors are directly related with the saturation exponent.
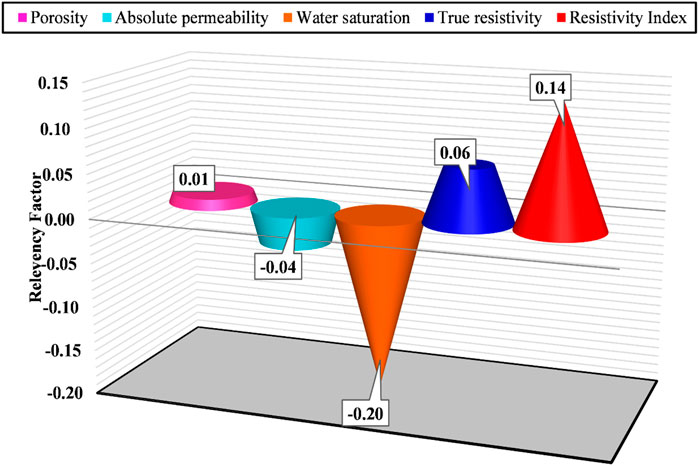
Figure 1. Sensitivity analysis on the saturation exponent.
In the present communication, disparate intelligent modeling techniques such as RBF-ANN, MLP-ANN, GA-ANFIS, PSO-ANFIS, and LSSVM were made use of to model saturation exponent (n) aided by a number of optimization methods including PSO, GA, and LM. Levenberg Marquardt (LM) technique was linked with MLP-ANN. MSE values versus iterations within the MLP-ANN structure are demonstrated in Figure 2. As can be seen, the MSE value approaches to lower values as the number of iterations grow and the minimum MSE is found at the iteration number equal to 1,500.
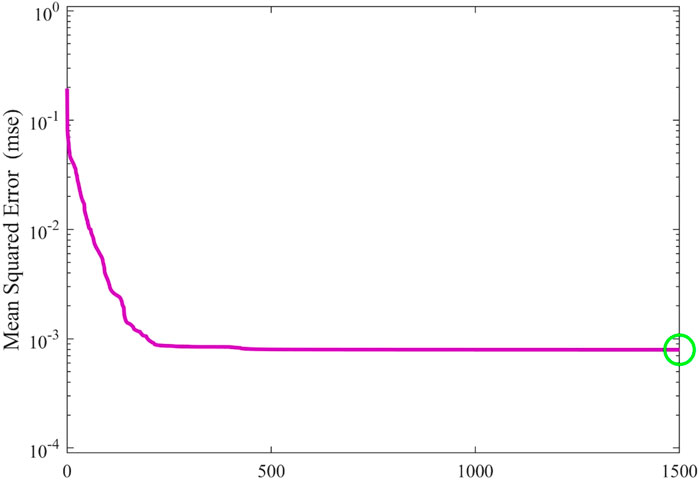
Figure 2. Mean squared error (MSE) versus iteration number for Levenberg Marquardt-trained MLP-ANN model.
The adjusted bias and weight coefficients obtained by LM method for the output and hidden layers are tabulated in Table 2. Again, these are the optimum values for the LM structure.
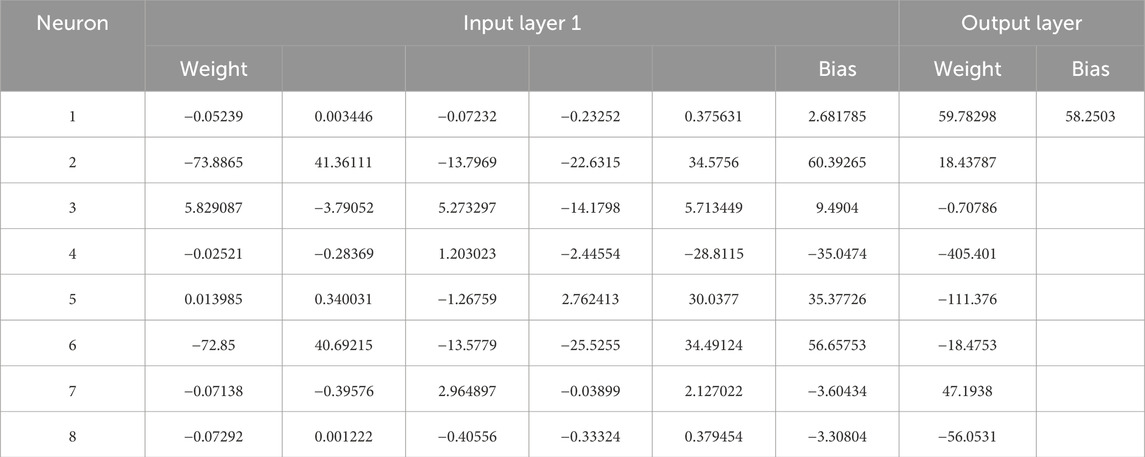
Table 2. Optimum bias and weight values based upon the developed MLP-ANN modeling technique.
In the RBF-ANN technique, we selected radial basis function as the hidden layer transfer function, and LM as the optimizing algorithm. The details of the constructed models are indicated in Table 3. This table illustrates number of neurons, internal functions, and tuning parameters for each modeling technique put forth in this study. Notice that these are the structure details that were obtained for the optimum structures.
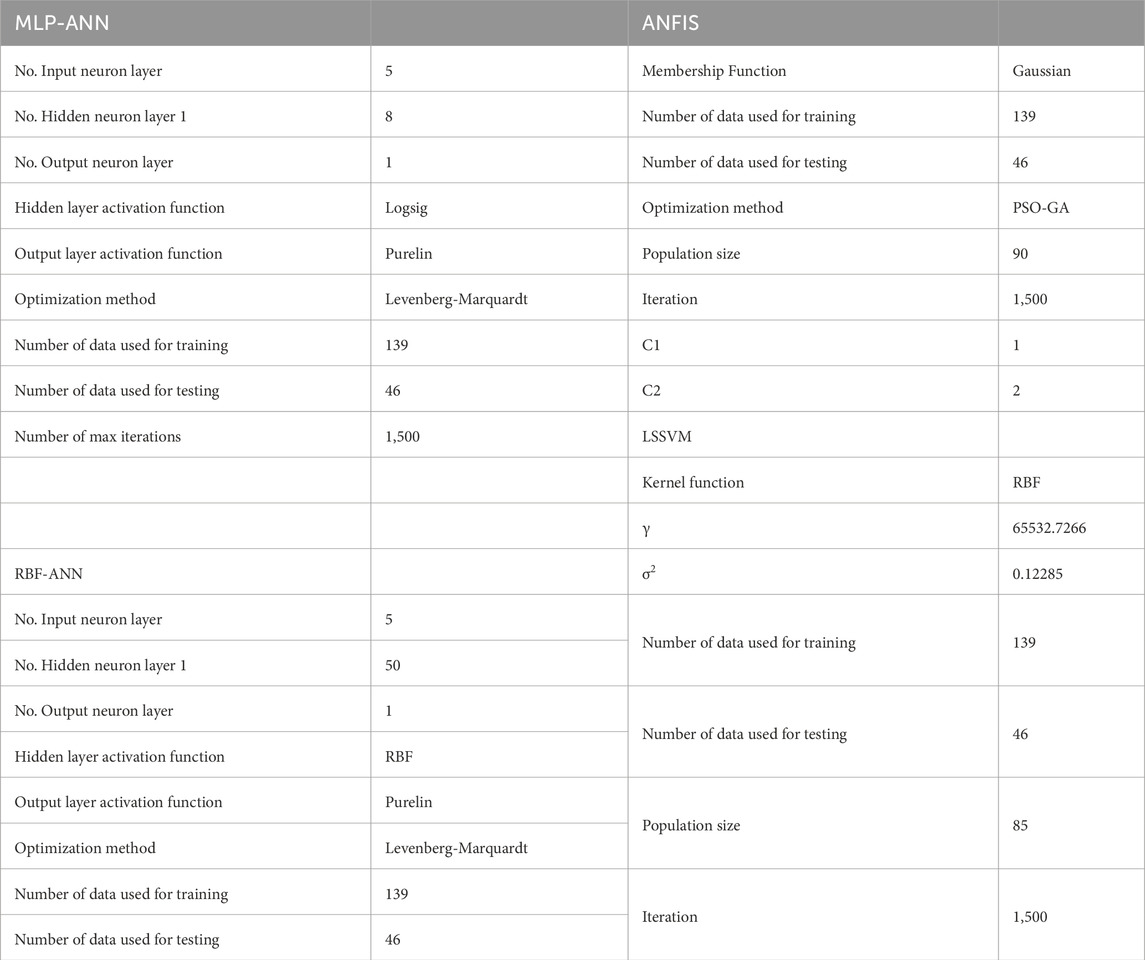
Table 3. Properties of generated models for the purpose of predicting saturation exponent.
The modeled and target saturation exponent values are plotted versus data index by various models in Figure 3.
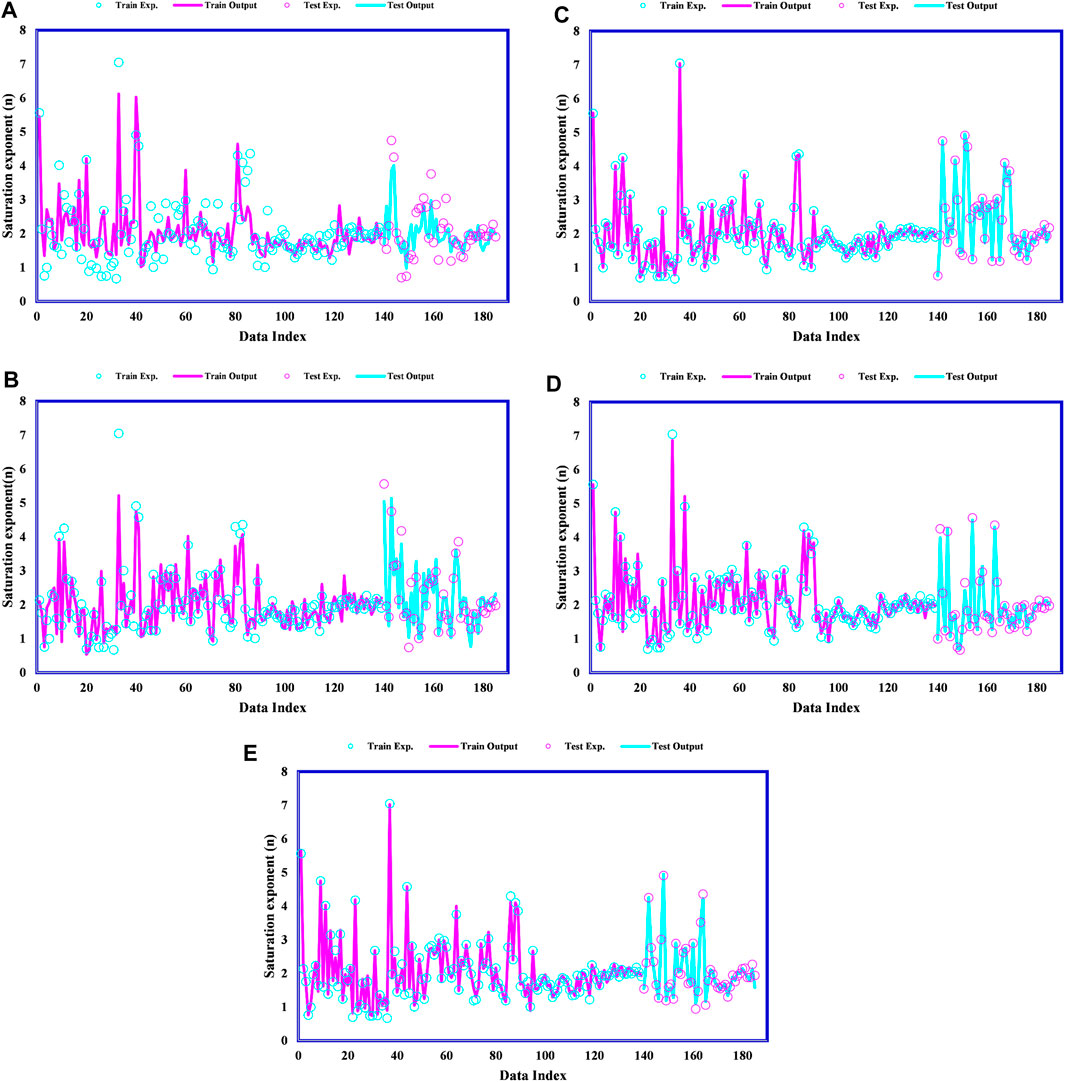
Figure 3. Comparison of target and modeled values by various modeling techniques: (A) GA-ANFIS, (B) PSO-ANFIS, (C) LSSVM, (D) MLP-ANN, (E) RBF-ANN.
Figure 3 demonstrates the robustness of the presented models in predicting the saturation exponent. To more thoroughly showcase the capability of these introduced models, regression plots for both the testing and training datasets are provided in Figure 4, illustrating the performance of the developed modeling techniques. These plots visually depict the correlation between the predicted and actual values, allowing for a clear assessment of the models’ accuracy and reliability. The training dataset results indicate how well the models have learned from the provided data, while the testing dataset results offer insights into their generalizability to unseen data. The close alignment of the regression lines to the 45-degree line in the plots suggests a high degree of accuracy in the predictions.
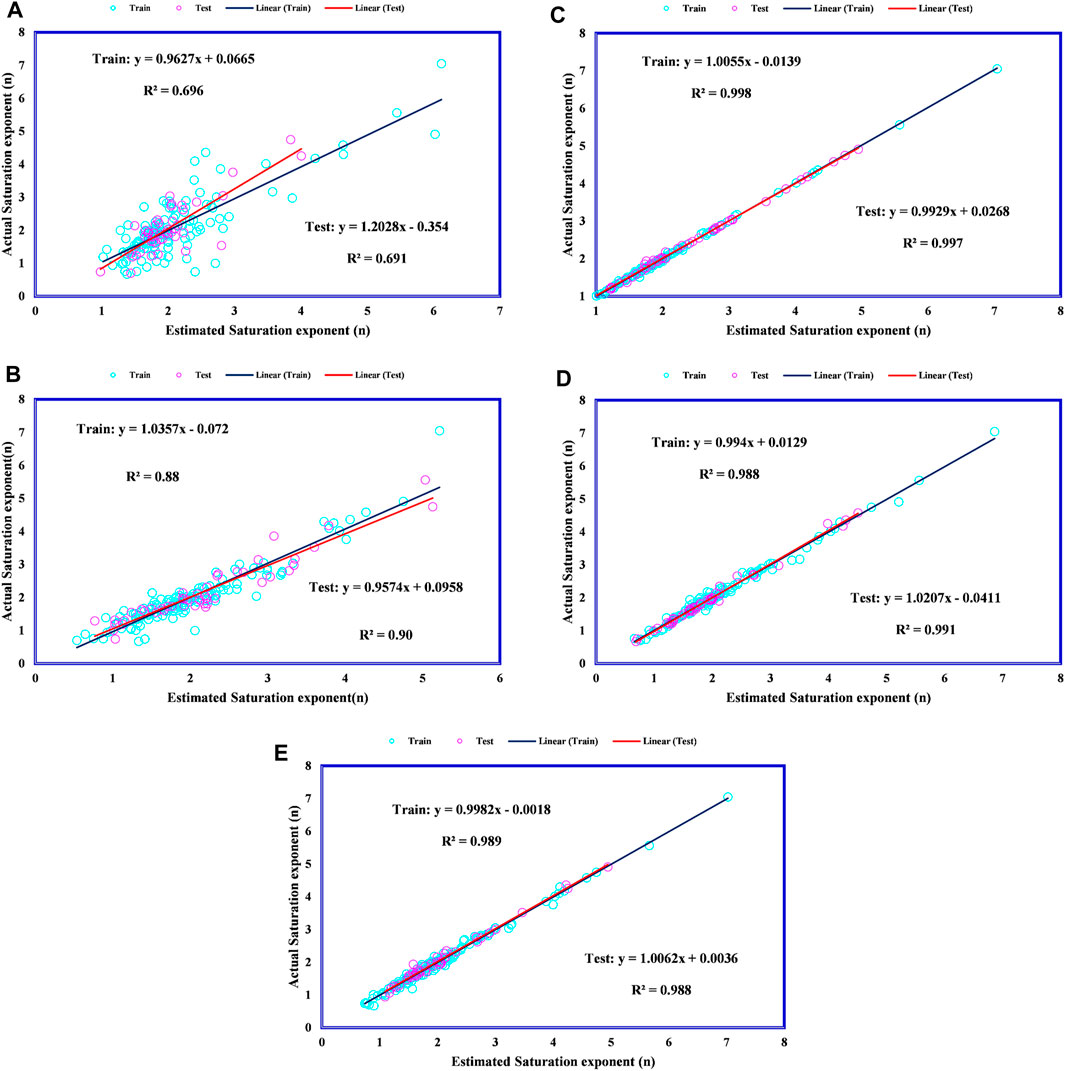
Figure 4. Regression plots using various modeling methods: (A) GA-ANFIS, (B) PSO-ANFIS, (C) LSSVM, (D) MLP-ANN, (E) RBF-ANN.
Any model with a higher coefficient of determination (R2) is considered more reliable; in this context, the datapoints are more closely aligned around the 45-degree line. The results indicate that GA-ANFIS is less accurate compared to other models such as MLP-ANN, RBF-ANN, and LSSVM, which exhibit higher R2 values. Following RBF-ANN, MLP-ANN, and LSSVM, the ANFIS-PSO model is the next most precise, with R2 values of 0.90 and 0.88 for the testing and training datasets, respectively.
Figure 5 displays the relative error against the target saturation exponent points for all the developed models. Among these models, MLP-ANN, RBF-ANN, and LSSVM show results that are tightly clustered around the zero line. Additionally, several statistical parameters such as Mean Squared Error (MSE), Root Mean Squared Error (RMSE), Standard Deviation (STD), and R2 are presented in Table 4 for the developed models. According to this table, LSSVM, RBF-ANN, and MLP-ANN have the lowest values of SD, RMSE, and MSE compared to other developed models, which means that the aforementioned models are the most accurate amongst all models.
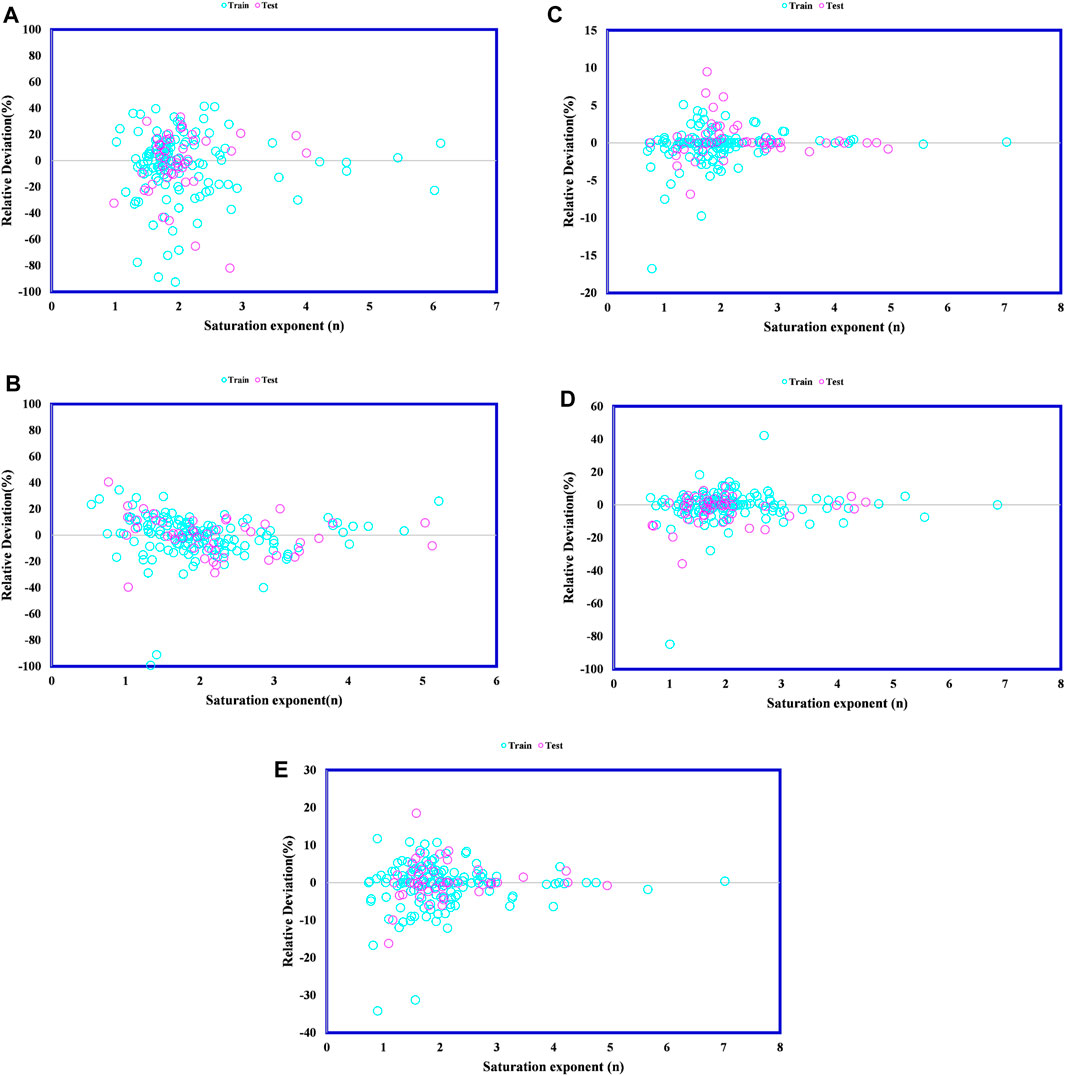
Figure 5. Relative deviation between target and modeled values: (A) GA-ANFIS, (B) PSO-ANFIS, (C) LSSVM, (D) MLP-ANN, (E) RBF-ANN.
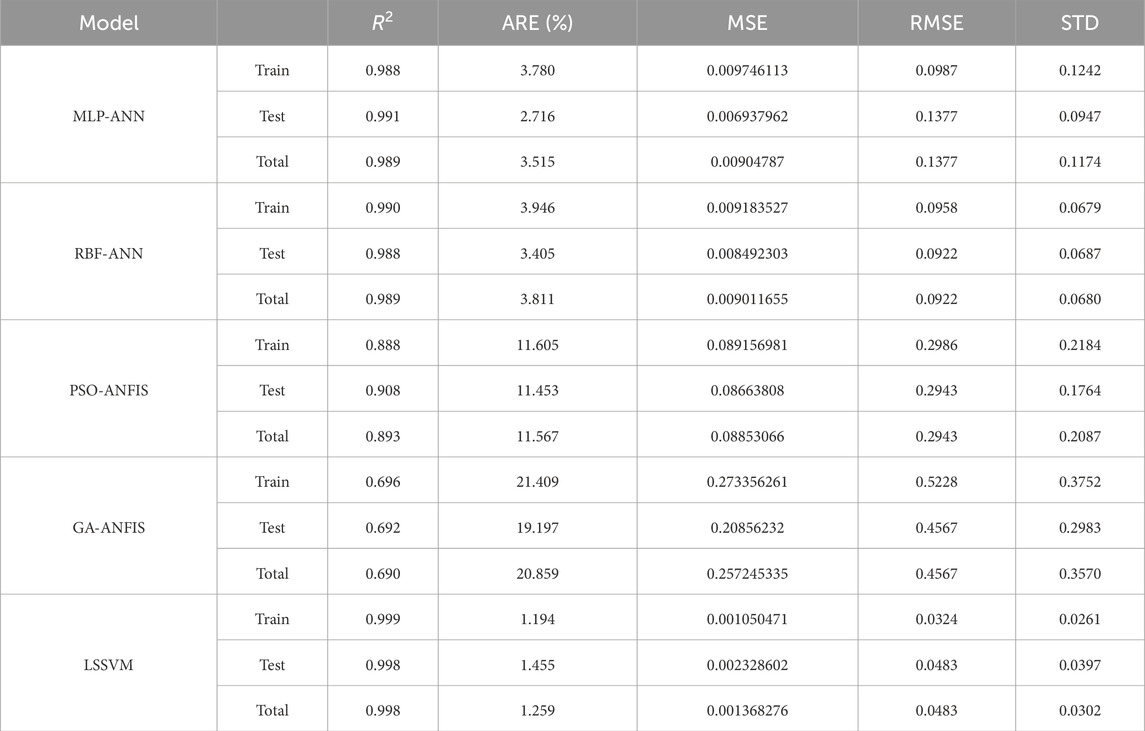
Table 4. Statistical parameters for various modeling methods in this study.
In the present study, several modeling techniques such as RBF-ANN, LSSVM, MLP-ANN, MLP-ANN, PSO-ANFIS, and GA-ANFIS were implemented to predict the saturation exponent parameter in terms of well log data. These modeling techniques were optimized through the use of PSO, GA, and ML algorithms. A databank of petrophysical data gathered for a number of middle eastern oil and gas reservoirs was used for this purpose. The gathered databank was split into two subsets to test and train the constructed models. Several statistical factors along with graphical plots were employed to assess the generated models. The results demonstrated that LSSVM, RBF-ANN, and MLP-ANN are the most accurate models with regard to prediction of saturation exponent as they are characterized with R2=0.9815-0.9983 and RMSE=0.0409-0.1410. The sensitivity analysis additionally indicated that saturation exponent has the highest dependency upon the water saturation.
The raw data supporting the conclusions of this article will be made available by the authors, without undue reservation.
AY: Conceptualization, Writing–original draft, SA: Software, Writing–review and editing, Data curation. FA: Writing–review and editing, Data curation, PR: Writing–original draft, Formal Analysis, Supervision. MR: Writing–original draft, Formal Analysis, Software. NJ: Writing–original draft, Funding acquisition, Resources. HK: Writing–original draft, Conceptualization, Funding acquisition, Project administration, Visualization. BB: Investigation, Writing–original draft, NQ: Writing–original draft, Investigation, Supervision. DK: Writing–original draft, Methodology, Project administration, Validation. AE: Project administration, Validation, Writing–review and editing. MS: Writing–review and editing, Project administration, Visualization.
The author(s) declare that no financial support was received for the research, authorship, and/or publication of this article.
The authors declare that the research was conducted in the absence of any commercial or financial relationships that could be construed as a potential conflict of interest.
All claims expressed in this article are solely those of the authors and do not necessarily represent those of their affiliated organizations, or those of the publisher, the editors and the reviewers. Any product that may be evaluated in this article, or claim that may be made by its manufacturer, is not guaranteed or endorsed by the publisher.
Abdrashitova, R. N., Salnikova, Y. I., Vaganov, Y. V., Kadyrov, M. A., Ponomarev, A. A., Drugov, D. A., et al. (2022). Regulatory framework for produced water management at the kamenny subsurface petroleum site in west siberia. Water Conservation Manag. (WCM) 6 (2), 115–136. doi:10.26480/wcm.02.2022.115.136
Afshar, M., Gholami, A., and Asoodeh, M. (2014). Genetic optimization of neural network and fuzzy logic for oil bubble point pressure modeling. Korean J. Chem. Eng. 31, 496–502. doi:10.1007/s11814-013-0248-8
Al-Hilali, M. M., Zein Al-Abideen, M. J., Adegbola, F., Li, W., and Avedisian, A. M. (2015). “A petrophysical technique to estimate Archie saturation exponent (n); case studies in carbonate and shaly-sand reservoirs–IRAQI oil fields,” in SPE Annual Caspian Technical Conference, Baku, Azerbaijan, November 2015.
Aminian, K., Bilgesu, H., Ameri, S., and Gil, E. (2000). “Improving the simulation of waterflood performance with the use of neural networks,” in SPE Eastern Regional Meeting, Morgantown, West Virginia, October 2000.
Anctil, F., Perrin, C., and Andréassian, V. (2004). Impact of the length of observed records on the performance of ANN and of conceptual parsimonious rainfall-runoff forecasting models. Environ. Model. Softw. 19 (4), 357–368. doi:10.1016/s1364-8152(03)00135-x
Bäck, T. (1997). Evolutionary computation: toward a new philosophy of machine intelligence. Hoboken, NJ: Wiley Online Library.
Baylar, A., Hanbay, D., and Batan, M. (2009). Application of least square support vector machines in the prediction of aeration performance of plunging overfall jets from weirs. Expert Syst. Appl. 36 (4), 8368–8374. doi:10.1016/j.eswa.2008.10.061
Chamkalani, A., Amani, M., Kiani, M. A., and Chamkalani, R. (2013). Assessment of asphaltene deposition due to titration technique. Fluid Phase Equilibria 339, 72–80. doi:10.1016/j.fluid.2012.11.037
Choisy, C., and Belaid, A. (2001). “Handwriting recognition using local methods for normalization and global methods for recognition,” in Proceedings of sixth international conference on document analysis and recognition, 13-13 September 2001, Seattle, WA, USA.
Christopher Frey, H., and Patil, S. R. (2002). Identification and review of sensitivity analysis methods. Risk Anal. 22 (3), 553–578. doi:10.1111/0272-4332.00039
Coulibaly, P., and Baldwin, C. K. (2005). Nonstationary hydrological time series forecasting using nonlinear dynamic methods. J. Hydrology 307 (1–4), 164–174. doi:10.1016/j.jhydrol.2004.10.008
Daliakopoulos, I. N., Coulibaly, P., and Tsanis, I. K. (2005). Groundwater level forecasting using artificial neural networks. J. Hydrology 309 (1–4), 229–240. doi:10.1016/j.jhydrol.2004.12.001
Dehghani, S. M., Sefti, M. V., Ameri, A., and Kaveh, N. S. (2008). Minimum miscibility pressure prediction based on a hybrid neural genetic algorithm. Chem. Eng. Res. Des. 86 (2), 173–185. doi:10.1016/j.cherd.2007.10.011
Dernaika, M., Efnik, M., Koronful, M., Al Mansoori, M., Hafez, H., and Kalam, M. (2007). “Case study for representative water saturation from laboratory to logs and the effect of pore geometry on capillarity,” in Paper SCA2007-38 presented at the International Symposium of the Society of Core Analysts, Calgary, Canada, 10-12 Sept, 2007.
Eberhart, R., and Kennedy, J. (1995). “A new optimizer using particle swarm theory,” in MHS'95. Proceedings of the sixth international symposium on micro machine and human science, Nagoya, Japan, 04-06 October 1995.
Eberhart, R., Simpson, P., and Dobbins, R. (1996). Computational intelligence PC tools. Cambridge, MA: Academic Press Professional, Inc.
El-Sebakhy, E. A. (2009). Forecasting PVT properties of crude oil systems based on support vector machines modeling scheme. J. Petroleum Sci. Eng. 64 (1–4), 25–34. doi:10.1016/j.petrol.2008.12.006
Feng, Y., Chen, J., and Luo, J. (2024). Life cycle cost analysis of power generation from underground coal gasification with carbon capture and storage (CCS) to measure the economic feasibility. Resour. Policy 92, 104996. doi:10.1016/j.resourpol.2024.104996
Gao, D., Zhou, J., and Xin, L. (2001). “SVM-based detection of moving vehicles for automatic traffic monitoring,” in ITSC 2001. 2001 IEEE Intelligent Transportation Systems. Proceedings (Cat. No. 01TH8585), Oakland, CA, USA, 25-29 August 2001.
Gharbi, R. (1997). Estimating the isothermal compressibility coefficient of undersaturated Middle East crudes using neural networks. Energy fuels 11 (2), 372–378. doi:10.1021/ef960123y
Ghiasi, M. M., Shahdi, A., Barati, P., and Arabloo, M. (2014). Robust modeling approach for estimation of compressibility factor in retrograde gas condensate systems. Industrial Eng. Chem. Res. 53 (32), 12872–12887. doi:10.1021/ie404269b
Hamada, G. (2010). Analysis of Archie's parameters determination techniques. Petroleum Sci. Technol. 28 (1), 79–92. doi:10.1080/10916460802706463
Hamada, G., Al-Awad, M., and Alsughayer, A. (2002). “Variable saturation exponent effect on the determination of hydrocarbon saturation,” in SPE Asia Pacific Oil and Gas Conference and Exhibition, Melbourne, Australia, October 2002.
Hassan, R., Cohanim, B., De Weck, O., and Venter, G. (2005). “A comparison of particle swarm optimization and the genetic algorithm,” in 46th AIAA/ASME/ASCE/AHS/ASC structures, structural dynamics and materials conference, Austin, Texas, 18–21 April 2005.
Helton, J. C., Davis, F., and Johnson, J. D. (2005). A comparison of uncertainty and sensitivity analysis results obtained with random and Latin hypercube sampling. Reliab. Eng. Syst. Saf. 89 (3), 305–330. doi:10.1016/j.ress.2004.09.006
Hemmati-Sarapardeh, A., Ghazanfari, M. H., Ayatollahi, S., and Masihi, M. (2016). Accurate determination of the CO2-crude oil minimum miscibility pressure of pure and impure CO2 streams: a robust modelling approach. Can. J. Chem. Eng. 94 (2), 253–261. doi:10.1002/cjce.22387
Hemmati-Sarapardeh, A., Varamesh, A., Husein, M. M., and Karan, K. (2018). On the evaluation of the viscosity of nanofluid systems: modeling and data assessment. Renew. Sustain. Energy Rev. 81, 313–329. doi:10.1016/j.rser.2017.07.049
Hu, D., Hu, Y., Yi, S., Liang, X., Li, Y., and Yang, X. (2024). Surface settlement prediction of rectangular pipe-jacking tunnel based on the machine-learning algorithm. J. Pipeline Syst. Eng. Pract. 15 (1), 04023061. doi:10.1061/jpsea2.pseng-1453
Iman, R. L., Helton, J. C., and Campbell, J. E. (1981). An approach to sensitivity analysis of computer models: Part II—ranking of input variables, response surface validation, distribution effect and technique synopsis. J. Qual. Technol. 13 (4), 232–240. doi:10.1080/00224065.1981.11978763
Jiao, S., Li, W., Li, Z., Gai, J., Zou, L., and Su, Y. (2024). Hybrid physics-machine learning models for predicting rate of penetration in the Halahatang oil field, Tarim Basin. Sci. Rep. 14 (1), 5957. doi:10.1038/s41598-024-56640-y
Kamari, A., Moeini, F., Shamsoddini-Moghadam, M.-J., Hosseini, S.-A., Mohammadi, A. H., and Hemmati-Sarapardeh, A. (2016). Modeling the permeability of heterogeneous oil reservoirs using a robust method. Geosciences J. 20, 259–271. doi:10.1007/s12303-015-0033-2
Kravtsova, Y. V., Babaevb, R. A., Kadyrova, M. A., Vaganova, Y. V., Tugusheva, O. A., Drugova, D. A., et al. (2022). Evaluation of reservoir properties of the cenomanian aquifer system at sites of produced water pumping as exemplified by the west salym oilfield in west siberia. Water Conservation Manag. 6 (2), 70–75. doi:10.26480/wcm.02.2022.70.75
Li, J., Zhang, Y., Lin, L., and Zhou, Y. (2023). Study on the shear mechanics of gas hydrate-bearing sand-well interface with different roughness and dissociation. Bull. Eng. Geol. Environ. 82 (11), 404. doi:10.1007/s10064-023-03432-9
Li, Q., Liu, J., Wang, S., Guo, Y., Han, X., Li, Q., et al. (2024b). Numerical insights into factors affecting collapse behavior of horizontal wellbore in clayey silt hydrate-bearing sediments and the accompanying control strategy. Ocean. Eng. 297, 117029. doi:10.1016/j.oceaneng.2024.117029
Li, Q., Wang, Y., Wang, F., Wu, J., Usman Tahir, M., Li, Q., et al. (2020). Effect of thickener and reservoir parameters on the filtration property of CO2 fracturing fluid. Energy Sources, Part A Recovery, Util. Environ. Eff. 42 (14), 1705–1715. doi:10.1080/15567036.2019.1604880
Li, Z., Huang, X., Xu, X., Bai, Y., and Zou, C. (2024a). Unstable coalescence mechanism and influencing factors of heterogeneous oil droplets. Molecules 29 (7), 1582. doi:10.3390/molecules29071582
Maier, H. R., and Dandy, G. C. (1998). Understanding the behaviour and optimising the performance of back-propagation neural networks: an empirical study. Environ. Model. Softw. 13 (2), 179–191. doi:10.1016/s1364-8152(98)00019-x
Mardi, M., Nurozi, H., and Edalatkhah, S. (2012). A water saturation prediction using artificial neural networks and an investigation on cementation factors and saturation exponent variations in an Iranian oil well. Petroleum Sci. Technol. 30 (4), 425–434. doi:10.1080/10916460903452033
Mohanraj, M., Jayaraj, S., and Muraleedharan, C. (2015). Applications of artificial neural networks for thermal analysis of heat exchangers–a review. Int. J. Therm. Sci. 90, 150–172. doi:10.1016/j.ijthermalsci.2014.11.030
Mohebbi, A., and Kaydani, H. (2015) “Permeability estimation in petroleum reservoir by meta-heuristics: an overview,” in Artificial intelligent approaches in petroleum geosciences. Berlin: Springer, 269–285.
Najafi, I., and Goodarzi, A. A. (2011). “Simultaneous determination of Archie’s parameters by application of modified genetic algorithm and HDP methods,” in 73rd EAGE Conference and Exhibition incorporating SPE EUROPEC 2011, Vienna, Austria, 23-26 May 2011.
Nguyen, X. P., Nguyen, D. T., Pham, V. V., and Vo, D. T. (2022). Highlights of oil treatment technologies and rise of oil-absorbing materials in ocean cleaning strategy. Water Conserv. Manag. 6, 06–14. doi:10.26480/wcm.01.2022.06.14
Nowroozi, S., Ranjbar, M., Hashemipour, H., and Schaffie, M. (2009). Development of a neural fuzzy system for advanced prediction of dew point pressure in gas condensate reservoirs. Fuel Process. Technol. 90 (3), 452–457. doi:10.1016/j.fuproc.2008.11.009
Patelli, E., Pradlwarter, H. J., and Schuëller, G. I. (2010). Global sensitivity of structural variability by random sampling. Comput. Phys. Commun. 181 (12), 2072–2081. doi:10.1016/j.cpc.2010.08.007
Saxena, A., and Saad, A. (2007). Evolving an artificial neural network classifier for condition monitoring of rotating mechanical systems. Appl. Soft Comput. 7 (1), 441–454. doi:10.1016/j.asoc.2005.10.001
Schölkopf, B., Burges, C. J., and Smola, A. J. (1999). Advances in kernel methods: support vector learning. Cambridge, MA: MIT Press.
Su, F.-q., He, X.-l., Dai, M.-j., Yang, J.-n., Hamanaka, A., Yu, Y.-h., et al. (2023). Estimation of the cavity volume in the gasification zone for underground coal gasification under different oxygen flow conditions. Energy 285, 129309. doi:10.1016/j.energy.2023.129309
Toth, E., Brath, A., and Montanari, A. (2000). Comparison of short-term rainfall prediction models for real-time flood forecasting. J. Hydrology 239 (1–4), 132–147. doi:10.1016/s0022-1694(00)00344-9
Van Gestel, T., De Brabanter, J., De Moor, B., Vandewalle, J., Suykens, J., and Van Gestel, T. (2002). Least squares support vector machines. Singapore: World Scientific.
Worthington, P. F., and Pallatt, N. (1992). Effect of variable saturation exponent on the evaluation of hydrocarbon saturation. SPE Form. Eval. 7 (04), 331–336. doi:10.2118/20538-pa
Xiao, D., Xiao, H., Song, W., Li, G., Zhang, J., Deng, H., et al. (2024). Utilization method of low-grade thermal energy during drilling based on insulated Drill pipe. Renew. Energy 225, 120363. doi:10.1016/j.renene.2024.120363
Yao, J., Zhao, S., and Fan, L. (2006). “An enhanced support vector machine model for intrusion detection,” in Rough Sets and Knowledge Technology: First International Conference, RSKT 2006, Chongquing, China, July 24-26, 2006, 538–543. doi:10.1007/11795131_78
Yu, H., Wang, H., and Lian, Z. (2023). An assessment of seal ability of tubing threaded connections: a hybrid empirical-numerical method. J. Energy Resour. Technol. 145 (5), 052902. doi:10.1115/1.4056332
Zeng, X.-J., and Singh, M. G. (1996). Approximation accuracy analysis of fuzzy systems as function approximators. IEEE Trans. fuzzy Syst. 4 (1), 44–63. doi:10.1109/91.481844
Zhao, Z., Zhao, X., Yin, Y., Li, C., Yang, Y., and Wang, Y. (2024). Identification of geochemical anomalies based on RPCA and multifractal theory: a case study of the sidaowanzi area, chifeng, inner Mongolia. Washington, DC: ACS Omega.
Keywords: soft computing methods, sensitivity analysis, archie equation, saturation exponent, oil and gas reservoir
Citation: Yadav A, Aldulaimi SH, Altalbawy FMA, Raja PKN, Ramudu MJ, Juraev N, Khalaf HH, Bassam BF, Qasim Mohammed N, Kassid DJ, Elawady A and Sina M (2024) Prediction of saturation exponent for subsurface oil and gas reservoirs using soft computing methods. Front. Earth Sci. 12:1434820. doi: 10.3389/feart.2024.1434820
Received: 19 May 2024; Accepted: 09 July 2024;
Published: 31 July 2024.
Edited by:
Qingchao Li, Henan Polytechnic University, ChinaReviewed by:
Ya Yao, Missouri University of Science and Technology, United StatesCopyright © 2024 Yadav, Aldulaimi, Altalbawy, Raja, Ramudu, Juraev, Khalaf, Bassam, Qasim Mohammed, Kassid, Elawady and Sina. This is an open-access article distributed under the terms of the Creative Commons Attribution License (CC BY). The use, distribution or reproduction in other forums is permitted, provided the original author(s) and the copyright owner(s) are credited and that the original publication in this journal is cited, in accordance with accepted academic practice. No use, distribution or reproduction is permitted which does not comply with these terms.
*Correspondence: Anupam Yadav, YW51cGFtLnlhZGF2QGdsYS5hYy5pbg==; Mohammad Sina, bS5zaW5hMDA2OTFAZ21haWwuY29t
Disclaimer: All claims expressed in this article are solely those of the authors and do not necessarily represent those of their affiliated organizations, or those of the publisher, the editors and the reviewers. Any product that may be evaluated in this article or claim that may be made by its manufacturer is not guaranteed or endorsed by the publisher.
Research integrity at Frontiers
Learn more about the work of our research integrity team to safeguard the quality of each article we publish.