 Farui Jiang
 Chonghao Liu
 Jianan Zhao
 Baode Jiang2
 Fengyan Fan
- 1Institute of Mineral Resources, Chinese Academy of Geological Sciences, Beijing, China
- 2School of Geography and Information Engineering, China University of Geosciences (Wuhan), Wuhan, China
- 3Guangdong Provincial Mineral Resources Exploration Institute, Guangdong Provincial Nuclear Geological Exploration Institute, Guangdong Geological Bureau, Guangzhou, China
Introduction: The Qinghai-Tibet Plateau holds a significant position in the global ecosystem, with its unique high altitude and complex geographical features fostering rich biodiversity. The plateau’s high-altitude environment and distinctive climate system significantly influence the Asian monsoon and regional hydrological cycles. Its vast glaciers and snow reserves are crucial in regulating the Asian climate. While previous studies have analyzed the habitat quality of the Qinghai-Tibet Plateau, significant variations exist across different vegetation ecoregions, warranting further investigation into these variations and their influencing factors.
Methods: This study conducted a comprehensive assessment of habitat quality on the Qinghai-Tibet Plateau by analyzing the impacts of human activities, climate change, and grazing intensity. Using the InVEST Model and Geodetector Model, we evaluated habitat quality across the plateau’s six vegetation ecoregions from 2000 to 2020. The efficacy of ecological red-line policies in actual conservation efforts was also examined.
Results: The results indicate that habitat quality among vegetation ecoregions is shaped by a complex interaction of geographical and human-induced factors, leading to notable spatiotemporal variations. From 2000 to 2020, the quality of habitats was significantly impacted by human activities, climate change, grazing intensity, and land-use changes. These effects were especially prominent during the period from 2005 to 2010.
Discussion: The changes in habitat quality on the Qinghai-Tibet Plateau are influenced by multiple driving factors, with significant differences in the drivers across various vegetation ecoregions. The ecological redline policy has played an important role in protecting the ecological environment in key areas, particularly in regions with high human intervention, where its effectiveness is more pronounced. In future ecological management, it is essential to strengthen conservation measures based on regional specificity. By comprehensively considering the impact of human activities and natural factors, developing more targeted management strategies is crucial for improving habitat quality.
1 Introduction
The Qinghai-Tibet Plateau (QTP), situated at the heart of Asia, is a testament to the power of nature, with its unique geographical position and extreme climatic conditions shaping a complex ecosystem of global ecological significance. The region is a biodiversity hotspot, hosting many endemic species that are irreplaceable for maintaining global biodiversity (Liu et al., 2021; Sun et al., 2023). The high-altitude environment and unique climate system of the QTP have a far-reaching impact on global climate patterns, primarily regulating the Asian monsoon system and regional hydrological cycles (Ding and Peng, 2020; Hua et al., 2022). However, the Qinghai-Tibet Plateau faces numerous ecological challenges. Climate change poses a significant threat, with rising temperatures and changing precipitation patterns leading to glacier retreat and permafrost degradation. Recent studies have highlighted the role of the glaciers in this area as crucial freshwater sources for Asia, directly replenishing river basins in China, India, and other South Asian countries. However, the accelerating glacier retreat and permafrost melting due to global warming are hastening changes in the region’s water resources, posing a significant threat to ecological balance (Drucker et al., 2011). The QTP is a vital global alpine ecological research hub, providing a valuable natural laboratory for studying global environmental changes. In terms of conservation status, the Qinghai-Tibet Plateau has been the focus of various national and international conservation efforts. Protected areas and nature reserves have been established, encompassing significant portions of the plateau to preserve its unique biodiversity and ecological functions.
Assessing habitat quality is a matter of scientific interest and a pressing need in the face of rapid global ecological changes and expanding human activities. The urgency is underscored by the increasing need to assess ecosystem services. Direct evaluation of habitat quality is the bedrock for biodiversity protection, land use planning, and ecological compensation mechanisms (Hadley and Betts, 2016; Hall et al., 1997). Nevertheless, despite recent strides in assessment methodologies, significant gaps persist. Most studies focus on the habitat needs of specific habitats or species, necessitating a more comprehensive and systematic assessment of habitat quality (Liu et al., 2016a; Chen J. et al., 2022; Giam et al., 2010; Terrado et al., 2016; Weber et al., 2018). Moreover, significant variations exist among different vegetation ecoregions, and further investigation is needed to understand these variations and the factors influencing them (Wu and Zhu, 2023). Technologically, the application of remote sensing and GIS technologies has improved the efficiency of spatial data acquisition (Liu et al., 2016a; Gu et al., 2019). However, the challenge lies in accurately interpreting and converting these data into habitat quality assessment information. Furthermore, the long-term impact assessments of climate change on habitats need to be improved by sufficient long-term monitoring data, which curtails scientific predictions of future habitat trends (Liu et al., 2016b). Thus, a thorough evaluation of habitat quality on the Qinghai-Tibet Plateau, elucidating the combined effects of human activities, climate change, and grazing intensity on the region’s ecosystem, is essential for both ecological assessments and the development of environmental protection policies. (Sanderson et al., 2002; Venter et al., 2016; Liu et al., 2016b; Wang et al., 2023). In this paper, the InVEST model was selected for the assessment of habitat quality. Compared with other models such as Zonation and MARXAN, InVEST provides a more direct function of habitat quality assessment and a comprehensive range of habitat quality indicators, as well as being relatively flexible in terms of data requirements, which makes it more suitable for the QTP region.
This study aims to conduct a multidimensional assessment of habitat quality on the QTP, exploring how habitat quality evolves under the multifaceted pressures of human activity (Bai et al., 2019; Hack et al., 2020; Liu et al., 2023), grazing intensity, and climate change and discussing the practical effectiveness of the Ecological red-line Policy in habitat protection. Grounded in vegetation ecoregions released by authoritative experts, this study employs the InVEST model to quantify habitat quality, incorporating the impacts of human activity intensity (Chen et al., 2016), grazing intensity (Fetzel et al., 2017; van Doorn et al., 2015; Zhang et al., 2018), and climate change (Gao et al, 2016; Niu et al., 2004; Wang S. R. et al., 2020; Yuke, 2019). The innovative aspects of this study’s methodology and indicators lie in its interdisciplinary analytical framework, which combines insights from various fields to enhance the precision of habitat quality assessments and bolster the specificity and effectiveness of policy interventions. This study evaluates the successes and challenges of the Ecological Red-line Policy using practical application data, providing support and a scientific basis for enhancing ecological protection strategies. Moreover, the methodological and technological innovations apply to the QTP and offer a reference for managing other ecologically sensitive areas and conservation zones (Chen et al., 2023a; Li and Song, 2022).
2 QTP vegetation ecoregions
The QTP, positioned in central Asia between 73° and 105° east longitude and 26°–40° north latitude, is recognized as the highest plateau globally, with an average elevation surpassing 4,000 m and covering an area of approximately 2.5 million square kilometers (Figure 1). This region is characterized by a complex and diverse geomorphological landscape, predominantly comprised of expansive plateaus, precipitous mountains, and deep river valleys, forming a unique highland mountainous geomorphological system (Sun et al., 2023). Based on the studies on vegetation ecoregions from Chinese Academy of Sciences and other authoritative researches (Hou, 1982; Editorial Board of the Vegetation Atlas of China, Chinese Academy of Sciences, 2001; Xu et al., 2008), the QTP’s vegetation has been categorized into six ecoregions in this study: desert, alpine grassland, meadow, broad-leaved forest, tender grassland, and tropical rainforest. This classification mirrors the Plateau’s complex geographic and climatic characteristics and their significant influence on vegetation distribution.
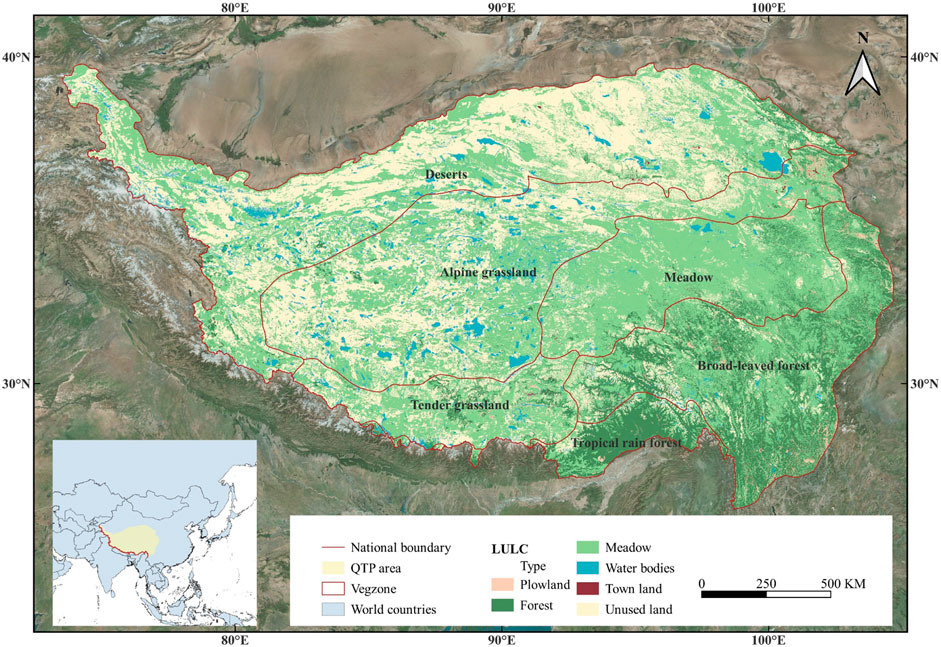
Figure 1. Vegetation ecoregions map of the Qinghai-Tibet Plateau.
3 Methodology
3.1 Data source
This study utilizes a comprehensive dataset comprising five distinct temporal snapshots—2000, 2005, 2010, 2015, and 2020—that capture land use and land cover changes on the QTP. Moreover, the research impressively integrates data on vegetation ecoregions, population density, gross domestic product, nocturnal lighting intensity (Chen et al., 2020), road infrastructure, grazing intensity, and climatological metrics, including average annual temperature and precipitation (Peng et al., 2019; Peng et al., 2017a; Peng et al., 2017b; Rong et al., 2020). Detailed information about the specific data types and their sources is methodically provided in Table 1.
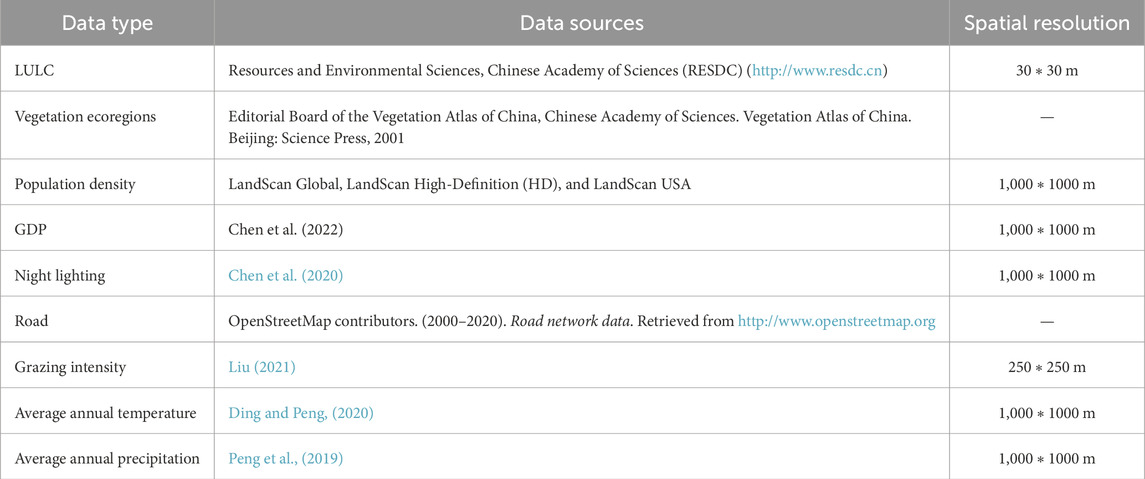
Table 1. Data types and sources.
3.2 Habitat quality assessment based on InVEST model
The Habitat Quality component of the InVEST model operates by integrating land use and land cover (LULC) data with threat factor data from the study area (Sharp et al., 2020). This integration paves the way for a meticulous evaluation of habitat quality across various scales. The model then quantifies the impact of threat sources on habitats, providing a precise measure of habitat degradation. The degradation is computed using the formulas outlined in Equations 1–3.
Where
Habitat quality is calculated by the degree of habitat degradation and the degree of habitat suitability, as publicized below (Equation 4).
Where
This study utilized version 3.14.0 of the InVEST software for habitat quality modeling. Initially, land-use data from the QTP spanning the years 2000, 2005, 2010, 2015, and 2020 were processed using the GIS platform. Based on prior research (Chen B. et al., 2022; Terrado et al., 2016; Weber et al., 2018), fieldwork on the ecological environment of the QTP, as well as relevant expert opinions and policy protection documents, the maximum influence distance and weight of threat factors and their decay modes were established and detailed in the accompanying table. Concurrently, the habitat suitability for various land-use types and their sensitivity to identified threats were defined. Parameters for the maximum influence distances and weights of threat factors, along with their attenuation mechanisms, are detailed in the table; additionally, habitat suitability for different land-use categories and their sensitivity to threat sources are documented in Supplementary Tables 1, 2.
3.3 Human activity intensity assessment
In this study, drawing upon prior related research (Liu, 2023), variables such as population density, GDP density, nighttime light intensity (Chen et al, 2021), land use type, and road infrastructure were employed to estimate metrics of anthropogenic activity from 2000 to 2020. Population density data were sourced from demographic surveys and censuses. This variable represents the number of people living per unit area and serves as a fundamental indicator of human presence and potential environmental impact. Nighttime light intensity was derived from satellite imagery, particularly from sensors that capture light emissions during nighttime. This measure is indicative of urbanization and human activities since higher light intensities generally correspond to more developed and densely populated areas. GDP density data were obtained from economic reports and databases. GDP per capita provides insights into the economic activity and development level of a region, reflecting the economic footprint of human activities. Land use and land cover data were collected from remote sensing and GIS databases, tracking changes in land use types such as agricultural land, forest, urban areas, etc. These changes are crucial for understanding human impact on natural landscapes. Road data were extracted from transportation and infrastructure databases, detailing the extent and type of road networks. Roads facilitate human movement and economic activities, significantly contributing to anthropogenic impacts. The raw raster data underwent preprocessing to derive the dataset on human activity intensity, which was calculated using the specified formula (Equation 5).
Where
3.4 Geodetector Model
The Geodetector model, predicated on the theory of geospatial differentiation, serves to discern spatial disparities among geographic elements and elucidate the underlying drivers, encompassing element detection, interaction detection, and risk area identification (Wang et al., 2010). This model surpasses other spatial analytical tools in its capacity to pinpoint crucial factors influencing spatial distribution effectively and to ascertain the interplay among diverse factors, accommodating a range of data distributions. Within this study, the Geodetector model was employed to explore the spatial relationships and interactions between habitat quality (HQ) and variables such as human activity intensity (HAI), grazing intensity (GI), temperature (T), and precipitation (P) across various vegetation zones, utilizing Equation 6 for calculations.
where
4 Results
4.1 Analysis of land use change in vegetation ecoregions
The Qinghai-Tibet Plateau, characterized by its extreme altitude, harsh climate, and unique biodiversity, highlights the profound sensitivity of its ecosystems to land use changes (Sanderson et al., 2002; Venter et al., 2016). From 2000 to 2020, data on land cover changes across the Plateau’s habitats reveal a landscape in constant flux, shaped by the pressures of climate change and human expansion (Figure 2). This study utilizes vegetation ecoregions to construct a land use transition matrix (Table 2; Supplementary Figure 1). It analyzes the net changes of various land use types within each vegetation zone, as depicted in Figure 4. In alpine grassland vegetation types, the transformation of grasslands into unused land is substantial, showing a clear trend towards desertification likely influenced by overgrazing or developmental activities. The net changes in cropland and forested areas are minimal, while the area of watersheds is rising, possibly reflecting the several key management and policy initiatives, including major ecological protection projects and compensation schemes implemented over the years. In broadleaf forest areas, the increase in net changes of cropland and developed land indicates intensified human activities recently. Concurrently, expanding forested areas and reducing unused land highlight the success of ecological restoration and forest resource management initiatives in these regions. In desert, meadow, and tender grassland vegetation zones, there is a significant decrease in grassland area and a noticeable increase in unused land. In tropical rainforest areas, significant reductions in forests and unused lands are accompanied by increased grasslands. According to analyses from Table 6; Figure 4, the pattern of land use transition is characterized by a decline in grasslands, relative stability in forests and watersheds, and marginal changes in cropland and developed areas. The varied changes across vegetation types are underscored by the notable reduction in areas of alpine grasslands, deserts, meadows, and tender grasslands, with particularly sharp declines observed in alpine grasslands. Despite these disparities, forests and watersheds have maintained relative stability, with minimal fluctuations in area, providing reassurance about the effectiveness of conservation and management strategies. The slight variations in cropland and developed areas may be attributed to land management policies, planning, and the intrinsic natural conditions of the region, indicating that human activity intensity on the QTP has remained relatively high over the past 2 decades.
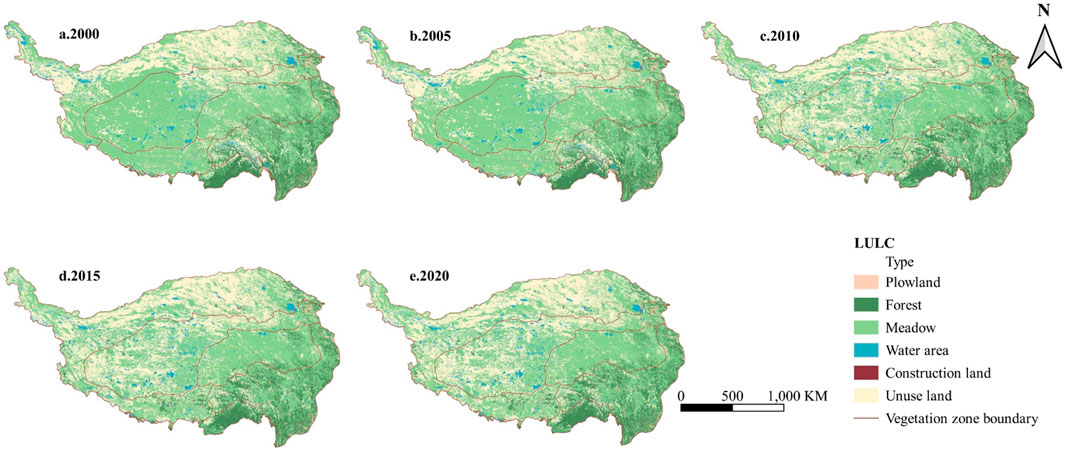
Figure 2. Land use situation on the Qinghai-Tibet Plateau from 2000 to 2020.
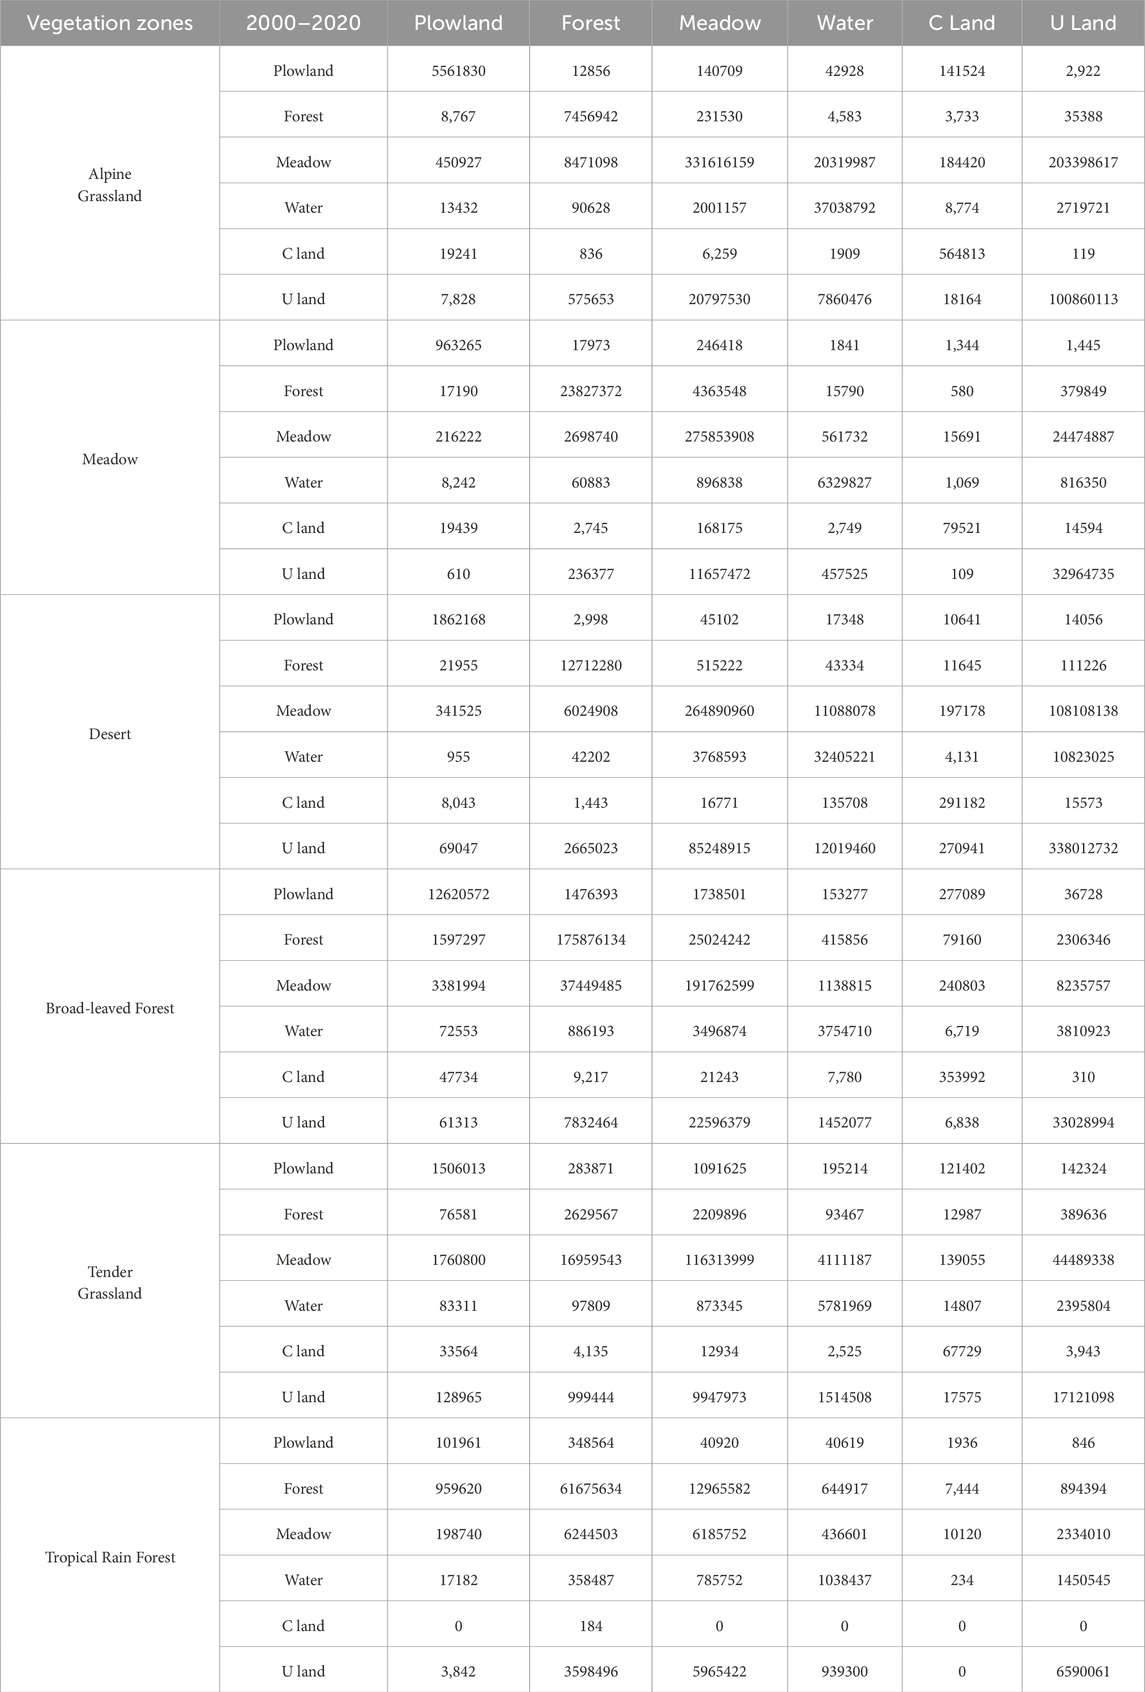
Table 2. Land use transfer matrix for vegetation zones from 2000 to 2020.
4.2 Evaluation of human activity intensity
Over these 2 decades, significant GDP growth was predominantly concentrated in the eastern and southern peripheries of the plateau, regions largely corresponding to broadleaf and tropical rainforest zones. In contrast, economic growth in alpine grassland and desert areas was comparatively slower. The economic expansion in broadleaf and tropical rainforest areas is likely linked to agriculture, tourism, and forest product development. High altitudes and harsh climatic conditions limit the expansion of agriculture and other economic activities. Economic development in these regions requires reliance on eco-friendly strategies, such as ecotourism and sustainable herding, which help preserve the fragile highland ecology and bring economic benefits to local communities.
Increases in population density have primarily occurred in regions with abundant vegetation, particularly in broadleaf forests and tropical rainforest zones. This trend reflects human residential preferences and the aggregation of economic activities in ecologically favorable areas. Population distribution on the QTP is closely linked to regional ecological conditions. With their mild climate and abundant water resources, Broadleaf forests and tropical rainforest zones support agriculture and habitation, thus attracting significant population inflows. In contrast, the population density changes in alpine grassland and desert regions remain minimal due to harsh natural conditions such as high altitude and low rainfall, which limit extensive human activity and socio-economic development. Although this is beneficial for preserving local natural habitats, it also highlights the imbalance in regional development.
Increases in illumination have primarily concentrated in the eastern part of the plateau and along major transportation routes, particularly near large cities and transportation hubs. This trend is closely linked to regional economic growth, urbanization, and infrastructure development. As an essential indicator of human activity and economic progress, the enhancement of nighttime lighting reflects the rapid socio-economic development across the plateau over the past 2 decades. Especially in broadleaf forests and tropical rainforest zones, the intensification of nighttime lighting is likely directly related to urban expansion, tourism development, and improvements in transportation networks. While these activities have spurred regional economic growth, they may also pressure the local ecological environment, such as light pollution and disturbances (Figure 3).
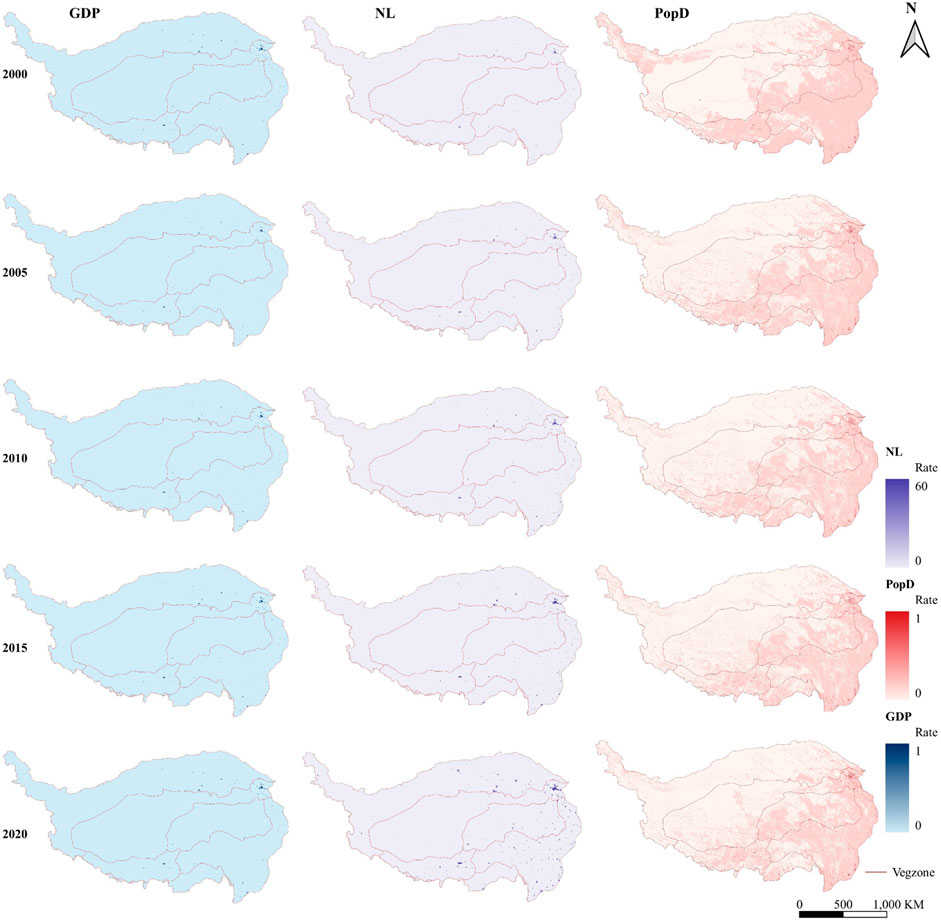
Figure 3. Changes in the GDP, NL and PopD of the Qinghai-tibet plateau, 2000–2020.
Analyzing the changes in the road network on the QTP from 2000 to 2020 reveals a significant acceleration in infrastructure development across most regions, excluding some parts of the desert and high-altitude grasslands (Figure 4). This transformation reflects the rapid modernization the plateau has undergone over the last 2 decades, particularly in terms of investment in transportation infrastructure. In 2000, the road network on the plateau was relatively sparse, primarily concentrated in more populous areas and along major river corridors. As time progressed, especially after 2010, the road network expanded rapidly, with new roads extending into remote areas to the west and north. By 2020, even some previously isolated high-altitude grassland and meadow areas saw significant improvements in transportation accessibility.
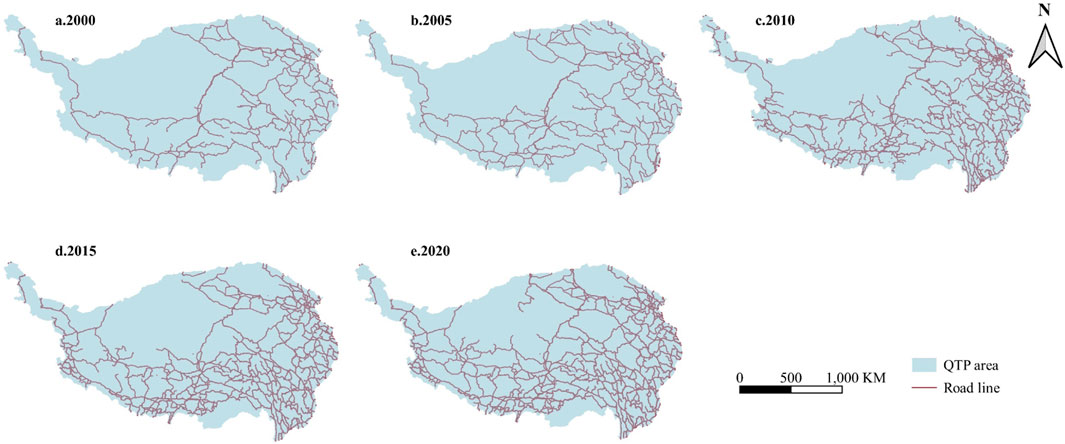
Figure 4. Changes in the road network of the Qinghai-Tibet Plateau, 2000–2020.
The QTP experienced a significant increase in human activity, particularly in the eastern and southern regions where transportation infrastructure is well-developed and along major river valleys (Figure 5). In the broad-leaved forest and tropical rainforest zones, where the climate is more suitable and natural resources are abundant, attracting greater human settlement and economic development. The analysis indicates that the increase in human activity is concentrated near urban centers and transportation networks, closely tied to infrastructure development. As roads and railways were expanded and improved, and as urban areas grew, human activity in these regions naturally intensified. Areas with high activity often see agricultural expansion, industrial development, and residential construction, which exert pressure on local ecosystems, potentially leading to a decrease in biodiversity and degradation of ecosystem services. Conversely, changes in human activity intensity in vegetation zones such as high-altitude grasslands and deserts are less pronounced, reflecting potentially effective conservation measures or the natural constraints of these areas, which make them unsuitable for large-scale economic activities.
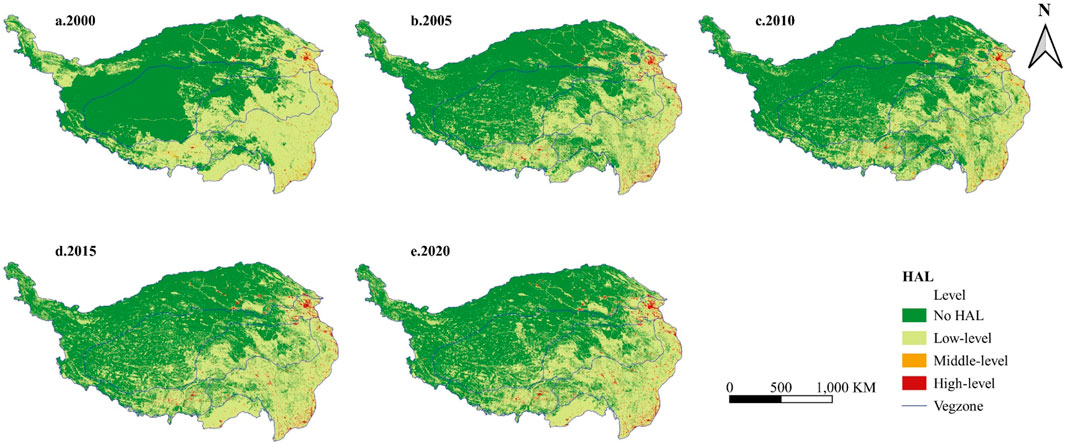
Figure 5. Changes in human activity intensity on the Qinghai-Tibet Plateau, 2000–2020.
4.3 Analysis of grazing intensity
Grazing intensity varies significantly across the plateau’s diverse ecosystems. In alpine meadows and grasslands, where vegetation regrowth can be relatively slow due to harsh climate conditions, intense grazing can lead to soil compaction, reduced vegetation cover, and increased erosion. In forested areas, such as the coniferous forests found in higher elevations, overgrazing can still degrade understory vegetation and disrupt ecosystem processes essential for forest regeneration and biodiversity conservation.
An analysis of the grazing intensity changes on the QTP from 2000 to 2020 reveals a pronounced trend, particularly with significant increases in the meadow and high mountain grassland areas (Figure 6). This change indicates an intensification of human utilization of these vegetative regions, especially in pastoral activities. In the high mountain grasslands, as grazing intensity increases, so does the pressure on the grasslands, potentially leading to degradation, enhanced soil erosion, and reduced biodiversity. Additionally, since grasslands play a crucial role in carbon sequestration, excessive grazing could weaken this ecological service, exacerbating the adverse effects of climate change. In the meadow regions, increased grazing intensity may also degrade ecosystem services, including reduced water retention and soil quality. Meadows, typically rich in biodiversity, may experience shifts in plant community composition due to overgrazing, impacting the entire ecosystem’s structure and function. Notably, the changes in grazing intensity in broadleaf forests and tropical rainforest regions are relatively minor. This is likely due to the natural conditions and vegetative types of these areas, which are unsuitable for large-scale pastoral activities, thereby maintaining a more stable ecosystem.
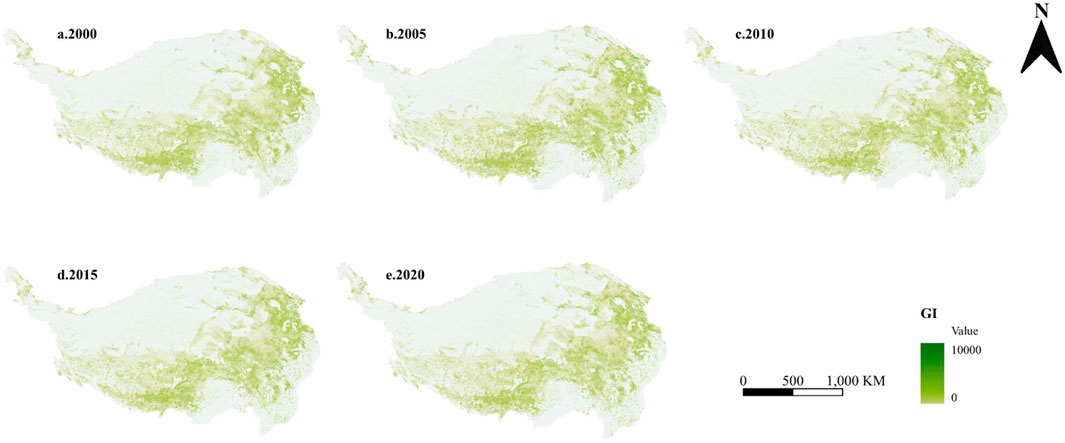
Figure 6. Changes in grazing intensity on the Qinghai-Tibet Plateau from 2000 to 2020.
4.4 Climate indicator analysis
Annual precipitation and temperature serve as critical indicators of the climatic characteristics of the QTP. The analysis of annual precipitation changes from 2000 to 2020 reveals significant geographical and temporal variations across different vegetation zones. The western, eastern and north-eastern parts of the plateau show an increasing trend in precipitation, accounting for 56.01 per cent of the region, while the northern, central and south-eastern parts of the plateau show a decreasing trend in precipitation. In the eastern regions, characterized by broadleaf forests and tropical rainforests, precipitation levels are notably higher and more stable due to the influence of monsoonal climates. These areas support complex ecosystems and high biodiversity due to their ample rainfall. In contrast, the central and western regions, comprising alpine grasslands and meadows, experience relatively lower and more variable precipitation. The ecosystems in these areas are susceptible to precipitation changes, with fluctuations directly impacting grassland productivity and degradation levels. Desert regions consistently exhibit low precipitation, limiting vegetation growth and biodiversity development.
Over this period, the Plateau has witnessed a notable gradual increase in average temperatures. Overall, more than 90 per cent of the Tibetan Plateau has shown a warming trend in the last 20 years, with cooling occurring mainly in the northern part of the plateau. Temperature increases have been especially noticeable in the broadleaf forest and tropical rainforest zones, likely due to their lower elevations and denser human activities. In contrast, the alpine grassland and desert regions experienced more modest temperature changes but still demonstrated a progressive warming trend, reflecting the pervasive effects of global warming on high-altitude areas. The temperature surge carries significant implications for the Plateau’s ecosystems. In the lower elevation zones of broadleaf forests and tropical rainforests, the rising temperatures could disrupt phenological cycles, reshape species population structures, and foster the proliferation of invasive species, potentially resulting in biodiversity loss and ecosystem function degradation, such as carbon storage and water regulation (Figure 7).

Figure 7. Annual average temperature, precipitation conditions of the QTP, 2000–2020.
4.5 Habitat quality evaluation
Between 2000 and 2020, habitat quality in the QTP predominantly remained within the quality range of 0.6–1.0, maintaining a relatively stable proportion. Nonetheless, there has been an increase in low-quality biotic habitats, with habitat quality values between 0 and 0.4. Mean habitat quality has significantly fluctuated over these 2 decades, decreasing from 0.52 to 0.46. This trend indicates that the ecological environment of the QTP may be under substantial pressure and threat, necessitating further scrutiny and investigation (Figure 8; Table 3).
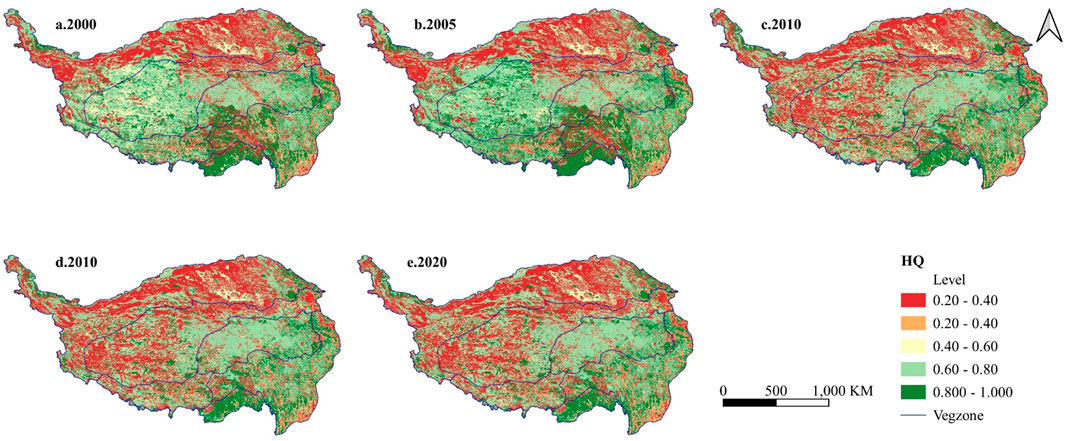
Figure 8. Habitat quality on the Qinghai-tibet plateau from 2000 to 2020.
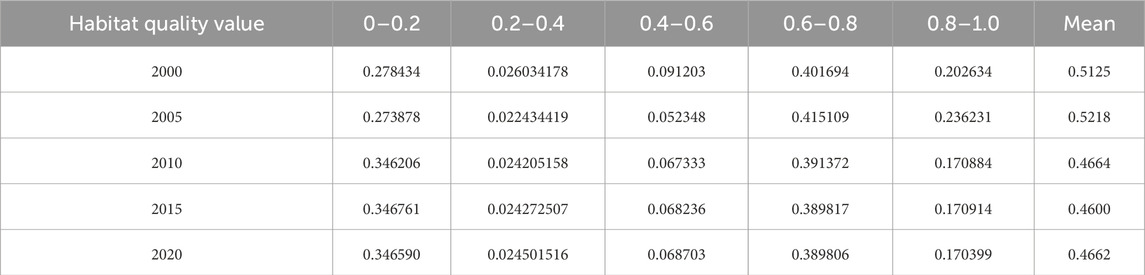
Table 3. Normalized statistics of habitat quality indicators on the Qinghai-Tibet Plateau, 2000–2020.
4.6 Analysis of driving factors for habitat quality
4.6.1 Desert region
In the desert region, HQ correlations display marked variability across distinct temporal segments and influencing variables. During the 2005 to 2010 interval, HQ showed pronounced correlations, contrasting with the generally insignificant correlations observed with other factors throughout most assessed periods (Table 4). This analysis underscores the complexity of environmental responses in arid landscapes, suggesting that specific temporal contexts significantly modulate the impact of various ecological drivers on habitat quality.
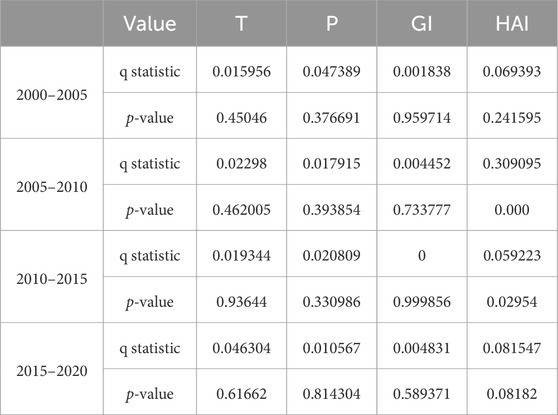
Table 4. Desert region one-way correlation.
From 2000 to 2005, T exhibited a weak relationship with P, GI, and HAI, with P showing similarly weak correlations with another factor. GI and HAI demonstrated relatively strong correlations, indicating a potential link between them. From 2005 to 2010, T maintained weak relationships with other factors, and P was weakly correlated with all factors, particularly with T and GI. The correlation between GI and HAI was notably higher than between T and GI, suggesting a closer connection between environmental protection efforts and human activities during this interval. In the 2010 to 2015 timeframe, T remained weakly related to other factors, while P exhibited weak relations with T but stronger connections with GI and HAI. Although GI’s correlation with P and T remained low, its correlation with HAI was more pronounced. From 2015 to 2020, the correlation of T with other factors strengthened, particularly with P. The relationship between P and T became significant, and interactions with GI and HAI were more pronounced (Supplementary Table 5).
4.6.2 Alpine grassland region
The dynamics between T, P, GI, and anthropogenic indices with HQ in the alpine grassland region showed variable trends and intensities from 2000 to 2020. Notably, from 2010 to 2015, all factors demonstrated highly significant correlations with HQ. T showed correlations with HQ during this period. Furthermore, the HQ index maintained high correlations across multiple periods, suggesting that human activities have significantly influenced ecological transformations within this region (Table 5).

Table 5. Alpine grassland region one-way correlation.
During the initial phase of the study, T demonstrated weak associations with P, GI, and HAI. Precipitation displayed similarly weak correlations with the other variables, though slightly more pronounced with GI than HAI. Notably, GI and HAI exhibited relatively strong correlations during this period, highlighting a significant link between grazing and human activities. As the study progressed, the relationship between GI and HAI became markedly stronger than between T and GI, suggesting an increasingly close connection between environmental protection efforts and human activities. This trend persisted, with P maintaining weak relationships with T but showing stronger ties with GI and HAI. While the correlation of GI with P and T remained modest, its association with HAI grew more distinct. In later years, the correlation of T with other factors intensified, especially with P. The relationship between P and T solidified, and its connections with GI and HAI became more conspicuous. Throughout the study, the robust correlation of GI with HAI persisted (Supplementary Table 6).
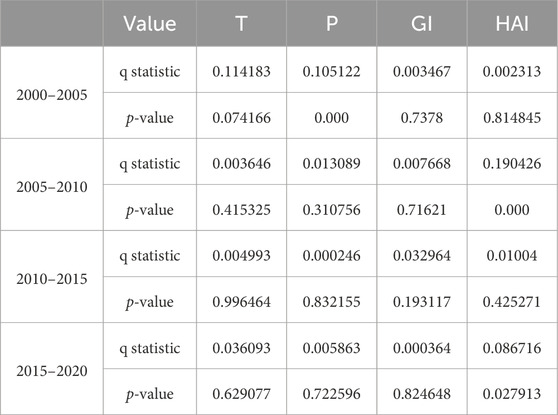
Table 6. Meadow region one-way correlation.
4.6.3 Meadow region
In the Meadow area, P’s correlation was significantly strong from 2000 to 2005, Additionally, GI showed significant correlations from 2005 to 2010 and 2015 to 2020, respectively, indicating a more substantial impact of human activities on the meadow ecosystem during these specific intervals. Conversely, the correlations between temperature and GI were weaker for most of the studied periods. This robust statistical analysis provides a clear picture of the environmental dynamics in the meadow region (Table 6).
During the initial phase of the study, T exhibited a significant correlation with all evaluated factors, notably with P. Precipitation displayed moderate to high correlations across all factors, particularly with GI. The correlation between GI and HAI was relatively low, indicating a limited influence of human activities on vegetation cover during this period. As the study progressed, there was a marked increase in the correlations among all factors, with HAI showing a more pronounced association with the other three factors. In subsequent years, correlations among factors generally declined, with T showing minimal significant correlations with other factors. However, the relationship between GI and HAI became more distinct, indicating a more substantial influence of human activities on grazing practices. In the final years of the study, there was a general increase in the correlation of all factors, particularly between HAI and other environmental factors (Supplementary Table 7).
4.6.4 Broad-leaved forest region
The study’s findings in the broad-leaved forest area revealed significant variations in the impacts of environmental factors and human activities over time. Human activities were found to have a substantial and consistent impact on the broad-leaved forest, spanning multiple periods. Additionally, temperature was identified as a significant factor during 2015–2020, underscoring the critical role of climate change. These findings highlight the need for continued research and monitoring of these areas (Table 7).
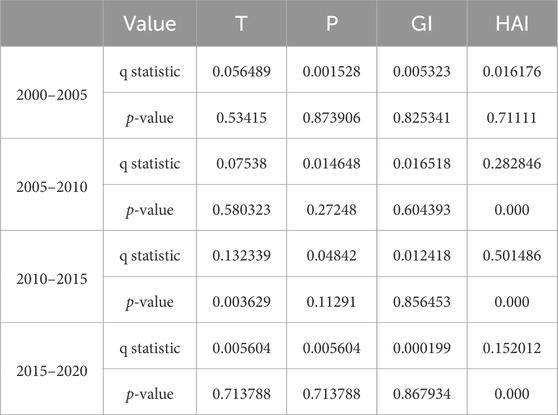
Table 7. Broad-leaved forest region one-way correlation.
From 2000 to 2005, T correlation with other environmental factors indicated a limited direct impact on the region. P also showed minimal correlations with other factors. GI presented low correlations, suggesting that changes in GI are relatively independent of other variables. HAI, displaying slightly higher correlations, indicates some interaction between anthropogenic activities and climatic conditions. From 2005 to 2010, an increase in the correlations among all factors was observed, especially the correlation of HAI with the other three factors, signaling intensified interactions between human activities and environmental factors. Between 2010 and 2015, correlations among factors escalated further, with the correlation between HAI and GI reaching an exceptionally high level. This significant correlation underscores the pronounced effects of human activities like urban development and land-use alterations on the natural environment. From 2015 to 2020, although correlations among factors declined, HAI continued to show high correlations with other variables, particularly with T and P (Supplementary Table 8).
4.6.5 Grassland region
In the tender grassland area, T demonstrated varying effects from 2000 to 2005. However, its influence waned in subsequent periods, suggesting that other environmental or anthropogenic factors might mitigate T’s direct impact on the tender grassland ecosystem. Nevertheless, the direct linkage between P and the area continued to be weak. GI consistently showed non-significant effects, indicating a potentially weaker connection between grass cover and singular climatic factors or a predominance of other non-climatic influences, such as grazing pressure. Conversely, HAI consistently exhibited a significant impact across various periods (Table 8).
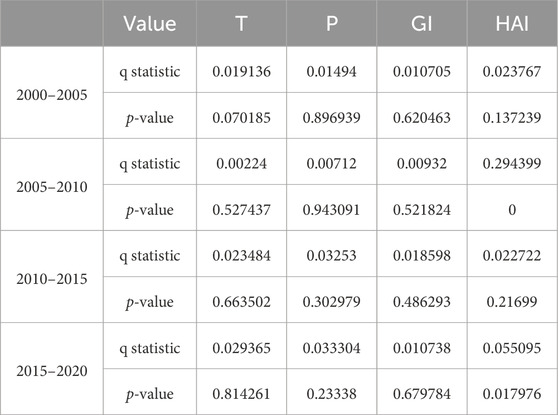
Table 8. Tender grassland region one-way correlation.
Between 2000 and 2005, the weak correlation of T with other factors underscored its independence from variations in associated environmental and anthropogenic parameters. The more pronounced correlations between HAI with GI and P indicated significant interactions between human activities and environmental conditions. From 2005 to 2010, the correlation among all factors generally increased, suggesting a significant intensification in the interplay between human activities and environmental factors during this interval. The relationship between P and T notably strengthened from 2010 to 2015, possibly due to enhanced linkages amid more pronounced climate variations. Although HAI’s correlation with all factors was evident, it remained relatively subdued, suggesting that their direct interactions might have weakened while human activities continued to exert influence. From 2015 to 2020, the correlations among all factors were moderate, and the association of HAI with P and GI showed improvement (Supplementary Table 9).
4.6.6 Tropical rainforest region
In the tropical rainforest area, data analysis from 2000 to 2020 revealed significant temporal fluctuations in the impacts of environmental and anthropogenic factors. Notably, the influence of P on the tropical rainforest was particularly pronounced during 2000–2005, aligning with the ecosystem’s high reliance on rainfall. Concurrently, the influence of HAI became markedly noticeable during 2010–2015, highlighting a period of intensified human impact (Table 9).
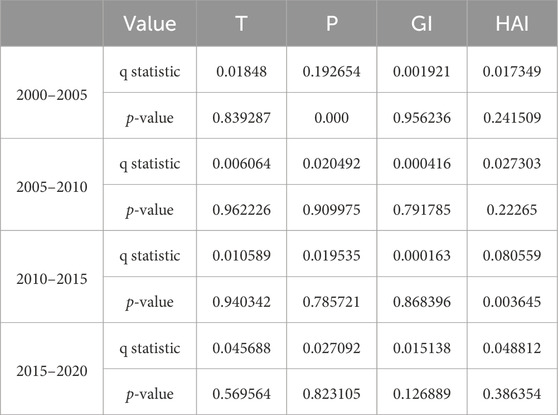
Table 9. Tropical rain forest region one-way correlation.
Between 2000 and 2005, the correlation between P, T, and GI was significantly high, with P exhibiting a significant influence, as evidenced by a q-statistic of 0.192654. The q-statistic quantifies the strength and direction of the linear relationship between two variables, with one representing a perfect positive correlation, −1 representing a perfect negative correlation, and 0 indicating the absence of correlation. It underscores P’s critical role in shaping the dynamics of the tropical rainforest during this period. The association between HAI, P, and GI was also pronounced, suggesting impactful interactions. From 2005 to 2010, correlations among all factors were generally subdued, indicating a period of lesser interactivity among these variables. However, from 2010 to 2015, the correlation of HAI with other factors, notably P and GI, intensified, reflecting an alarming increase in human footprint in the tropical rainforests. This period likely saw a significant rise in deforestation and land development activities, marking a crucial shift in the ecosystem dynamics. From 2015 to 2020, the correlations among all factors showed a general increase, with the q-statistic for P remaining at 0.192654, reaffirming its substantial influence on the tropical rainforests. However, what is more concerning is the significantly strengthened interactions between HAI and other environmental factors, highlighting a more pronounced and urgent interplay between human activities and both climatic and vegetative aspects of the region (Supplementary Table 10).
We present the correlation and comparative differences of habitat driving factors under different vegetation types as follows: Figure 9.
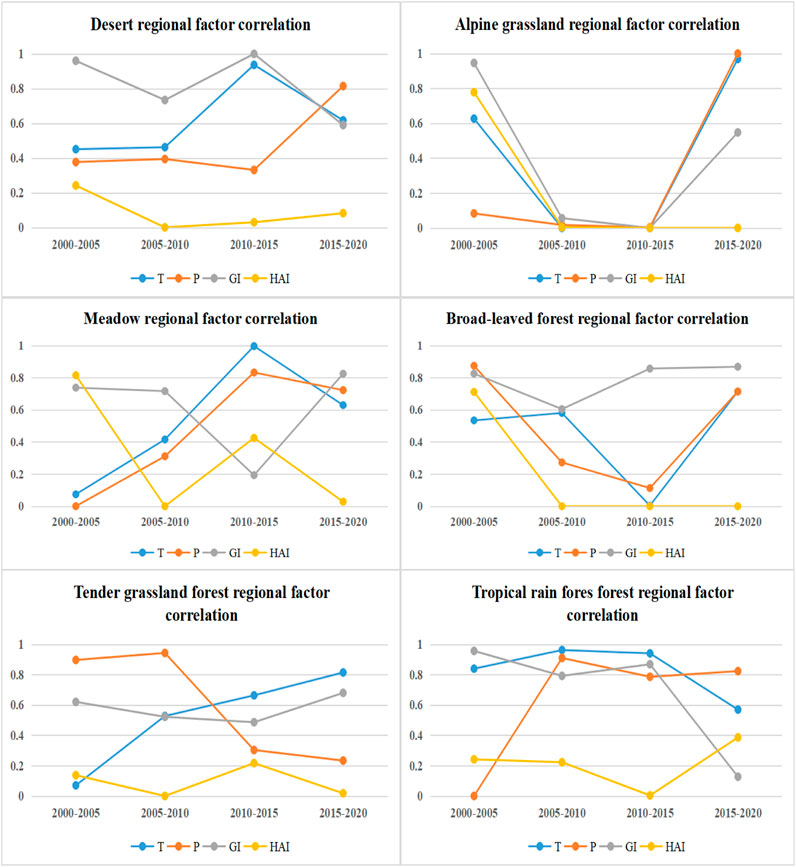
Figure 9. Correlation analysis plot of habitat drivers.
5 Discussion
5.1 Regional variability in habitat quality drivers
Between 2000 and 2020, the response to environmental and anthropogenic factors across various regions exhibited specific correlations with HQ (Zhang et al., 2023). T and P consistently displayed low correlations with HQ in the desert region. However, HAI had a pronounced impact on HQ, which was especially notable from 2005 to 2010 and maintained its significance from 2010 to 2015. All factors in the alpine grassland region showed significantly stronger correlations with HQ between 2005 and 2010 and 2010 and 2015. In contrast, these correlations were negligible in other years (Wang et al., 2021). In the meadow region, P was significantly correlated with HQ from 2000 to 2005, while other factors showed no significant correlation. HAI was significantly correlated between 2005 and 2010. In the broad-leaved forest region between 2010 and 2015, T significantly correlated with HQ, and HAI’s impact was highly significant. In the tender grassland region, correlations from 2000 to 2005 were non-significant, though HAI approached significance. HAI’s impact was notably significant from 2005 to 2010 and 2015 to 2020. In the tropical rainforest region, P exhibited a very significant correlation with HQ from 2000 to 2005, and HAI’s impact was significant from 2010 to 2015. P demonstrated significant effects in the desert and tropical rainforest regions during 2000–2005, likely reflecting the critical role of water resources as limiting factors impacting ecosystem health directly (Matomela et al., 2022). T showed a significant correlation only in the broad-leaved forest during 2010–2015, suggesting that climatic fluctuations significantly affected forest ecology (Supplementary Figure 2). Long-term climate change can lead to shifts in the boundaries of vegetation zones. For instance, temperate forests may migrate northward due to rising temperatures, gradually replacing the existing boreal vegetation. Similarly, the boundaries of grasslands and deserts may extend into more humid areas, thereby altering the local ecosystem structure and function. Simultaneously, long-term climate change may result in the extinction of certain sensitive species, thereby reducing ecosystem diversity and functional redundancy. Additionally, climate change can impact water retention, carbon storage, and soil conservation. Changes in precipitation patterns may significantly affect the availability of water resources, thereby influencing agricultural production and human water use (Luo et al., 2024; Wu and Zhu, 2023).
From 2000 to 2020, synergistic relationships among various environmental and anthropogenic factors impacting habitat quality showed marked regional differences. HAI exhibited significant correlations with HQ from 2005 to 2010 and 2010 to 2015, while interactions with other factors remained less evident in the desert region. Conversely, the correlations with HQ significantly intensified in the alpine grassland region from 2005 to 2010 and 2010 to 2015. However, these interactions waned from 2015 to 2020, particularly concerning HAI, highlighting a dynamic interplay over time. The meadow region experienced a pronounced correlation between precipitation and HQ from 2000 to 2005 and a notable influence of HAI on HQ from 2005 to 2010. In the broad-leaved forest region, temperature and HAI showed significant correlations with HQ from 2010 to 2015, a period marked by heightened environmental sensitivity. In the tender grassland region, HAI significantly influenced HQ from 2005 to 2010 and from 2015 to 2020 (Chen et al., 2016). In the tropical rainforest region, precipitation markedly affected HQ from 2000 to 2005, and HAI had a significant role from 2010 to 2015. These observations highlight the complex and variable interactions among climatic variables, human activities, and other ecological drivers across different ecosystems and over distinct periods.
5.2 Ecological red line policy impacts on QTP
The implementation of ecological red-line policies across different vegetation zones on the QTP exhibits significant regional variations (Figure 10). In the broad-leaved forest and tropical rainforest areas, these policies have effectively curtailed unsustainable land uses, such as excessive development and illegal logging, which are critical for maintaining biodiversity and preventing soil erosion. The ecological red-lines in these zones have successfully preserved forest cover, providing crucial support for ecosystem services, including carbon storage and water preservation (Chen et al., 2023b). Conversely, despite the enforcement of ecological red-line policies, their effectiveness faces challenges in the alpine grassland and meadow zones due to the inherent fragility of these ecosystems and their high sensitivity to climate change. For example, issues like grassland degradation remain severe due to overgrazing and reduced precipitation induced by climate change. Moreover, the implementation of ecological red-lines in these areas needs to pay greater attention to the livelihood needs of local communities and traditional rights to ensure the socio-economic sustainability of the policies. Ecological red-lines primarily aim to prevent overuse and land degradation in desert regions (Li and Song, 2022). In these arid areas, protective measures focus on combating land desertification and preserving sparse vegetation coverage. Although these actions somewhat mitigate ecological degradation, they provide limited support for ecosystem restoration and need to be integrated with other ecological recovery projects. Applying ecological red-line policies on the QTP demonstrates their adaptability and limitations across different ecosystems. Future policy adjustments should consider regional ecological characteristics, climate change trends, and community development needs, adopting more flexible and diverse management strategies to enhance the overall effectiveness and adaptability of the policies.
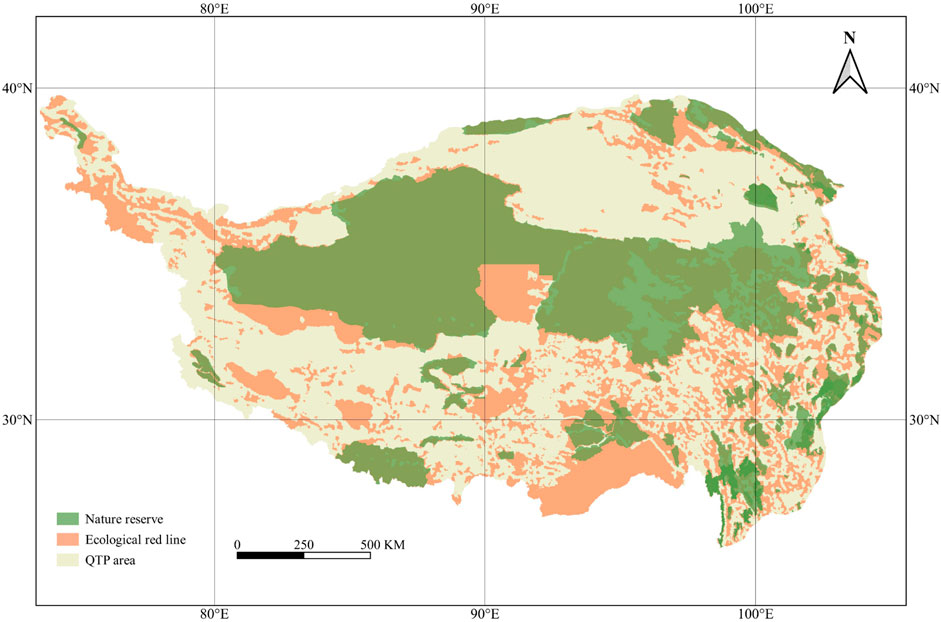
Figure 10. Qinghai-Tibet Plateau ecological protection areas and ecological red-line distribution.
In the QTP, the establishment of the Changtang National Nature Reserve signifies a forward-looking commitment to ecological conservation. As the largest alpine grassland reserve in the region, Changtang National Nature Reserve is dedicated to protecting biodiversity and ecosystem services (Xu et al., 2018). However, the reserve’s habitat quality has declined over the past decade, indicating that current conservation measures and management strategies must effectively keep pace with ecological degradation. Despite expanding protected areas through the designation of ecological red lines, which extend beyond the existing reserve boundaries to mark priority areas for stricter management, the ongoing deterioration of habitat quality reveals a complex reality: simply establishing reserves is insufficient to halt ecological degradation (Liang et al., 2016). The case of Changtang underscores the need to consider additional influencing factors. Human activities, particularly illegal hunting, mining, and improper land use, threaten the ecological environment, even within the reserve’s confines (Hack et al, 2020). Additionally, grazing intensity directly impacts the health and productivity of grasslands; despite policies limiting grazing, practical implementation faces challenges (Zhang et al., 2018). Climate change also significantly affects the plateau, with global warming-induced glacier melting and changes in precipitation patterns impacting water distribution and biodiversity (Wang S. R. et al., 2020). While the reserve provides some buffering against these changes, the long-term maintenance of habitat quality relies on comprehensive and integrated management strategies, including effective climate adaptation measures such as vegetation restoration and water resource management, as well as strategies to address human disturbances. Therefore, enhancing the effectiveness of conservation measures requires strengthening regional cooperation, promoting data sharing, and exchanging best practices. Local policy implementation must consider global climate patterns and adopt flexible conservation strategies capable of adapting to evolving ecological conditions. The habitat quality and ecological protection of the QTP necessitate a multi-layered, multidimensional management strategy that integrates scientific research, community involvement, and policymaker cooperation to achieve the dual goals of ecological preservation and sustainable development.
5.3 Drivers of habitat quality dynamics on QTP
Changes in habitat quality, a pressing issue influenced by an array of environmental and human-induced factors, are closely tied to regional characteristics. Climate change and HAI are the principal drivers affecting habitat quality on the QTP. Climatic elements, mainly T and P (Bai et al.,2023), directly and indirectly impact habitat quality. Due to the extreme and variable climate conditions, high-altitude ecosystems are susceptible to climatic fluctuations. For instance, rising temperatures may induce species migration to higher altitudes, altering existing biological community structures and habitat boundaries.
The impact of HAI across different vegetation zones starkly illustrates that increased human utilization significantly deteriorates habitat health. In alpine meadows and broad-leaved forest areas, human land use changes, such as agricultural expansion and urbanization, pose significant threats to habitat quality (Hadley and Betts, 2016). Additionally, activities like grazing, while relatively mild, can still stress ecosystems if mismanaged.
The linkage between theoretical and empirical studies reveals the complexity and multidimensionality of changes in habitat quality. Empirical results indicate that while ecological red-line policies and the establishment of nature reserves have mitigated human disturbances to some extent, single protective measures are insufficient to fully address the trend of declining habitat quality against the backdrop of global warming. Therefore, future environmental management strategies must be comprehensive (Weber et al., 2018), based on in-depth climate change studies and human activity monitoring, to find a sustainable balance between ecological protection and economic activities.
In summary, Over the past 2 decades, the average habitat quality has shown significant fluctuations, decreasing from 0.52 to 0.46. Concerning different vegetation zones, habitat degradation primarily manifests as the expansion of low-quality habitat areas. This expansion extends from the desert areas in the northern Qinghai-Tibet Plateau to the alpine grasslands in the central plateau and the tender grasslands in the southern plateau, potentially indicating grassland desertification. In contrast, the tropical rainforests and broadleaf forests in the southeastern plateau exhibit relatively stable and superior habitat quality characteristics. Moreover, urbanization in specific areas of the Qinghai-Tibet Plateau may lead to intensified land development and pollution, adversely affecting ecosystem quality. A profound understanding of the drivers and mechanisms underlying changes in habitat quality is crucial. Effective ecological conservation measures and sustainable development on the QTP can only be achieved through the combined efforts of policymakers, researchers, and local managers. It necessitates a solid and united front in implementing scientifically based ecological management and protection strategies.
5.4 Strategic policy directions for ecological management
This study has elucidated the regional disparities in the impacts of environmental and human-related factors on habitat quality across various ecological zones of the QTP from 2000 to 2020, providing vital guidance for future policy formulation (Wang et al., 2023). The findings indicate that the primary drivers of habitat quality in different regions include climate change, the human activity intensity (HAI), and precipitation, with varying degrees of influence across different areas and periods. This recognition of variability underscores the importance of crafting region-specific policies that address the predominant environmental challenges faced by each area.
Conservation measures need to be tailored to each ecological zone’s specific needs and environmental pressures to integrate ecological conservation with regional development more effectively. For instance, in alpine grasslands and broad-leaved forests, intensifying human activity management, particularly in land use and protected area management, could mitigate habitat degradation. Furthermore, in regions where precipitation significantly impacts habitat quality, such as tropical rainforests and meadows, implementing water conservation and climate adaptation strategies is crucial to maintaining ecosystem stability and biodiversity.
Considering the broader context of global climate change, future policies should also enhance ecosystems' resilience and adaptability (Yuke, 2019). Supporting these efforts with scientific research will better elucidate the long-term effects of climate change on high-altitude ecosystems. Strengthening inter-regional cooperation, sharing data, and management experiences are also vital steps to enhancing the efficacy and impact of ecological protection.
6 Conclusions and prospects
(1) From 2000 to 2020, the habitat quality across six vegetative ecological zones on the Qinghai-Tibet Plateau was influenced by a complex interplay of human activities, climate change, and grazing intensity, displaying significant regional variability and temporal shifts, particularly pronounced between 2005 and 2010. Between 2000 and 2020, the HAI had the most significant and consistent impact on habitat quality across various regions, particularly from 2005 to 2015, while P and T exhibited varying levels of significance depending on the region and period, and the GI showed significant effects only in specific areas.
(2) This study evaluated the applicability of the ecological red-line policy across different ecosystems and proposed directions for policy adjustments. This data-driven policy evaluation method serves as a quantitative decision-support tool for future environmental policy formulation, facilitating the optimization of management and conservation measures in protected areas.
(3) Looking ahead, it is crucial to continue exploring the mechanisms by which climate change affects ecosystems, particularly regarding adaptability and resilience in high-altitude ecosystems—moreover, enhancing real-time monitoring and long-term impact assessments of human activities, especially regarding land use changes and the efficiency of protected area management in ecologically vulnerable zones.
Data availability statement
The original contributions presented in the study are included in the article/Supplementary Material, further inquiries can be directed to the corresponding authors.
Author contributions
FJ: Data curation, Formal Analysis, Software, Visualization, Writing–original draft, Writing–review and editing. CL: Funding acquisition, Methodology, Supervision, Writing–review and editing, Writing–original draft. JZ: Resources, Writing–review and editing, Writing–original draft. BJ: Writing–review and editing, Writing–original draft, Software. FF: Writing–review and editing, Writing–original draft, Methodology.
Funding
The author(s) declare that financial support was received for the research, authorship, and/or publication of this article. The research was supported by the Second Tibetan Plateau Scientific Expedition and Research Program (Grant No. 2021QZKK0305) and the Basic Science Center Project of the National Natural Science Foundation of China (Grant No. 72088101).
Acknowledgments
Some of the datasets are provided by National Tibetan Plateau/Third Pole Environment Data Center (http://data.tpdc.ac.cn).
Conflict of interest
The authors declare that the research was conducted in the absence of any commercial or financial relationships that could be construed as a potential conflict of interest.
The reviewer JL declared a shared affiliation with the authors FJ, BJ to the handling editor at time of review.
Publisher’s note
All claims expressed in this article are solely those of the authors and do not necessarily represent those of their affiliated organizations, or those of the publisher, the editors and the reviewers. Any product that may be evaluated in this article, or claim that may be made by its manufacturer, is not guaranteed or endorsed by the publisher.
Supplementary material
The Supplementary Material for this article can be found online at: https://www.frontiersin.org/articles/10.3389/feart.2024.1432434/full#supplementary-material
References
Bai, L., Xiu, C., Feng, X., and Liu, D. (2019). Influence of urbanization on regional habitat quality: a case study of Changchun City. Habitat Int. 93, 102042. doi:10.1016/j.habitatint.2019.102042
Bai, L., Zhou, J., Luo, J. M., Dou, H., and Zhang, Y. (2023). Analyzing driving factors of soil alkalinization based on geodetector-A case in northeast China. Sustainability 15 (15), 11538. doi:10.3390/su151511538
Chen, B., Jing, X., Liu, S., Jiang, J., and Wang, Y. (2022b). Intermediate human activities maximize dryland ecosystem services in the long-term land-use change: evidence from the Sangong River watershed, northwest China. J. Environ. Manag. 319, 115708. doi:10.1016/j.jenvman.2022.115708
Chen, J., Gao, M., Cheng, S., Hou, W., Song, M., Liu, X., et al. (2022a). Global 1 km× 1 km gridded revised real gross domestic product and electricity consumption during 1992–2019 based on calibrated nighttime light data. Sci. Data 9, 202. doi:10.1038/s41597-022-01322-5
Chen, W., Gu, T., Xiang, J., Luo, T., and Zeng, J. (2023a). Assessing the conservation effectiveness of national nature reserves in China. Appl. Geogr. 161, 103125. doi:10.1016/j.apgeog.2023.103125
Chen, W. X., Yang, L.Y., Wu, J. H., Wu, J. H., Wang, G. Z., Bian, J. J., et al. (2023b). Spatio-temporal characteristics and influencing factors of traditional villages in the Yangtze River Basin: a Geodetector model. Herit. Sci. 11 (1), 111. doi:10.1186/s40494-023-00948-x
Chen, Y., Qiao, F., and Jiang, L. (2016). Effects of land use pattern change on regional scale habitat quality based on InVEST model: a case study in Beijing. J. Peking Univ. Nat. Sci. Ed. 52 (3), 553–562. doi:10.13209/j.0479-8023.2016.057
Chen, Z. Q., Yu, B. L., Yang, C., Zhou, Y. Y., Yao, S., Qian, X., et al. (2020). An extended time-series (2000-2023) of global NPP-VIIRS-like nighttime light data. doi:10.7910/DVN/YGIVCD
Chen, Z., Yu, B., Yang, C., Zhou, Y., Yao, S., Qian, X., et al. (2021). An extended time series (2000-2018) of global NPp-VIIRSLike nighttime light data from a cross-sensor calibration. Earth Syst. Sci. Data 13 (3), 889–906. doi:10.5194/essd-13-889-2021
Ding, Y., and Peng, S. (2020). Spatiotemporal trends and attribution of drought across China from 1901–2100. Sustainability 12 (2), 477. doi:10.3390/su12020477
Drucker, D. G., Bridault, A., Cupillard, C., Hujic, A., and Bocherens, H. (2011). Evolution of habitat and environment of red deer (Cervus elaphus) during the Late-glacial and early Holocene in eastern France (French Jura and the western Alps) using multi-isotope analysis (δ13C, δ15N, δ18O, δ34S) of archaeological remains. Quat. Int. 245 (2), 268–278. doi:10.1016/j.quaint.2011.07.019
Editorial Board of the Vegetation Atlas of China, Chinese Academy of Sciences (2001). Vegetation atlas of China. Beijing: Science Press.
Fetzel, T., Havlik, P., Herrero, M., and Erb, K. (2017). Seasonality constraints to livestock grazing intensity. Glob. CHANGE Biol. 23 (4), 1636–1647. doi:10.1111/gcb.13591
Gao, Q., Guo, Y., Xu, H., Ganjurjav, H., Li, Y., Wan, Y., et al. (2016). Climate change and its impacts on vegetation distribution and net primary productivity of the alpine ecosystem in the Qinghai-Tibetan Plateau. Sci. Total Environ. 554-555, 34–41. doi:10.1016/j.scitotenv.2016.02.131
Giam, X., Bradshaw, C., Tan, H., and Sodhi, N. S. (2010). Future habitat loss and the conservation of plant biodiversity. Biol. Conserv. 143 (7), 1594–1602. doi:10.1016/j.biocon.2010.04.019
Gu, Y. Y., Huang, X. F., Zou, C. X., Ye, X., Lin, N. F., and Zhang, W. M. (2019). Monitoring habitat quality changes in Yuanjiangyuan Nature Reserve based on Landsat images. J. Ecol. Rural Environ. 35 (6), 764–772. (in Chinese with English abstract). doi:10.19741/j.issn.1673-4831.2018.0442
Hack, J., Molewijk, D., and Beißler, M. R. (2020). A conceptual approach to modeling the geospatial impact of typical urban threats on the habitat quality of river corridors. Remote Sens. 12, 1345. doi:10.3390/rs12081345
Hadley, A. S., and Betts, M. G. (2016). Refocusing habitat fragmentation research using lessons from the last decade. Curr. Landsc. Ecol. Rep. 1 (2), 55–66. doi:10.1007/s40823-016-0007-8
Hall, L., Krausman, P., and Morrison, M. (1997). The habitat concept and a plea for standard terminology. Wildl. Soc. Bull. 25 (1), 173–182.
Hou, X. (1982). Vegetation geography and the chemical composition of its dominant plants. Beijing: Science Press.
Hua, T., Zhao, W., Cherubini, F., Hu, X., and Pereira, P. (2022). Strengthening protected areas for climate refugia on the Tibetan Plateau, China. Biol. Conserv. 275, 109781. doi:10.1016/j.biocon.2022.109781
Li, Y., and Song, Z. (2022). Have protected areas in China achieved the ecological and economic “win-win” goals? Evidence from the Giant Panda Reserves of the Min Mont Range. For. Policy Econ. 144, 102845. doi:10.1016/j.forpol.2022.102845
Liang, J., Donovan, E., Jackel, B., Spanswick, E., and Gillies, M. (2016). On the 630 nm red-line pulsating aurora: red-line Emission Geospace Observatory observations and model simulations. J. Geophys. RESEARCH-SPACE Phys. 121 (8), 7988–8012. doi:10.1002/2016ja022901
Liu, B. (2021). Actual livestock carrying capacity estimation product in Qinghai-Tibet Plateau (2000-2019). Natl. Tibet. Plateau/Third Pole Environ. Data Cent. doi:10.11888/Ecolo.tpdc.271513
Liu, H. M., Cheng, Y., Liu, Z. F., Li, Q. R., Zhang, H. Y., and Wei, W. (2023). Conflict or coordination? The spatiotemporal relationship between humans and nature on the Qinghai-Tibet Plateau. Earth’s Future 11 (9), e2022EF003452. doi:10.1029/2022EF003452
Liu, H. (2023). Human activity intensity dataset of the Qinghai-Tibet Plateau (2000-2020). National Tibetan Plateau/Third Pole Environment Data Center.
Liu, P., Wen, H., Lin, L., Liu, J., and Zhang, L. (2016a). Habitat evaluation for Asian elephants (Elephas maximus) in Lincang: conservation planning for an extremely small population of elephants in China. Biol. Conserv. 198, 113–121. doi:10.1016/j.biocon.2016.04.005
Liu, Q., Fu, Y. H., Zeng, Z., Huang, M., Li, X., and Piao, S. (2016b). Temperature, precipitation, and insolation effects on autumn vegetation phenology in temperate China. Glob. Change Biol. 22 (2), 644–655. doi:10.1111/gcb.13081
Liu, Y., Liu, S., Sun, Y., Li, M., An, Y., and Shi, F. (2021). Spatial differentiation of the NPP and NDVI and its influencing factors vary with grassland type on the Qinghai-Tibet Plateau. Environ. Monit. Assess. 193 (1), 48. doi:10.1007/s10661-020-08824-y
Luo, Z. H., Yu, H. L., Yang, S. F., Long, Y., Liu, P., Wang, T., et al. (2024). Climate change may improve the habitat suitability and connectivity of sika deer (Cervus nippon) in the Shennongjia area of China. Ecol. Inf. 81, 102558. doi:10.1016/j.ecoinf.2024.102558
Matomela, N., Li, T. X., Ikhumhen, H. O., Raimundo Lopes, N. D., and Meng, L. (2022). Soil erosion spatio-temporal exploration and Geodetection of driving factors using InVEST-sediment delivery ratio and Geodetector models in Dongsheng, China. GEOCARTO Int. 37 (26), 13039–13056. doi:10.1080/10106049.2022.2076912
Niu, T., Chen, L., and Zhou, Z. (2004). The characteristics of climate change over the Tibetan Plateau in the last 40 years and the detection of climatic jumps. Adv. Atmos. Sci. 21 (2), 193–203. doi:10.1007/bf02915705
Peng, S., Ding, Y., Liu, W., and Li, Z. (2019). 1 km monthly temperature and precipitation dataset for China from 1901 to 2017. Earth Syst. Sci. Data 11, 1931–1946. doi:10.5194/essd-11-1931-2019
Peng, S., Ding, Y., Wen, Z., Chen, Y., Cao, Y., and Ren, J. (2017b). Spatiotemporal change and trend analysis of potential evapotranspiration over the Loess Plateau of China during 2011-2100. Agric. For. Meteorology 233, 183–194. doi:10.1016/j.agrformet.2016.11.129
Peng, S., Gang, C., Cao, Y., and Chen, Y. (2017a). Assessment of climate change trends over the Loess Plateau in China from 1901 to 2100. Int. J. Climatol. 38, 2250–2264. doi:10.1002/joc.5331
Rong, G., Li, K., Han, L., Alu, S., Zhang, J., and Zhang, Y. (2020). Hazard mapping of the rainfall–landslides disaster chain based on GeoDetector and bayesian network models in shuicheng county, China. Water 12 (9), 2572. doi:10.3390/w12092572
Sanderson, E. W., Jaiteh, M., Levy, M. A., Redford, K. H., Wannebo, A. V., and Woolmer, G. (2002). The human footprint and the last of the wild. BIOSCIENCE 52 (10), 891–904. doi:10.1641/0006-3568(2002)052[0891:thfatl]2.0.co;2
Sharp, R., Chaplin-Kramer, R., Wood, S., Angarita, H., Guannel, G., Pennington, D., et al. (2020). InVEST user's guide. Available at: https://naturalcapitalproject.stanford.edu/software/invest.
Sun, L., Li, H., Wang, J., Chen, Y., Xiong, N., Wang, Z., et al. (2023). Impacts of climate change and human activities on NDVI in the Qinghai-Tibet Plateau. Remote Sens. 15 (3), 587. doi:10.3390/rs15030587
Terrado, M., Sabater, S., Chaplin-Kramer, B., Mandle, L., Ziv, G., and Acuña, V. (2016). Model development for the assessment of terrestrial and aquatic habitat quality in conservation planning. Sci. Total Environ. 540, 63–70. doi:10.1016/j.scitotenv.2015.03.064
van Doorn, A., Woinarski, J., and Werner, P. A. (2015). Livestock grazing affects habitat quality and persistence of the threatened purple-crowned fairy-wren malurus coronatus in the victoria river district, northern territory, Australia. EMU 115 (4), 302–308. doi:10.1071/mu14073
Venter, O., Sanderson, E. W., Magrach, A., Allan, J. R., Beher, J., Jones, K. R., et al. (2016). Sixteen years of change in the global terrestrial human footprint and implications for biodiversity conservation. Nat. Commun. 7, 12558. doi:10.1038/ncomms12558
Wang, H. Y., Qin, F., Xu, C. D., Li, B., Guo, L. P., and Wang, Z. (2021). Evaluating the suitability of urban development land with a Geodetector. Ecol. Indic., 123. doi:10.1016/j.ecolind.2021.107339
Wang, J., Liao, X., Christakos, G., Liao, Y., Zhang, T., Gu, X., et al. (2010). Geographical detectors-based health risk assessment and its application in the neural tube defects study of the heshun region, China. Int. J. Geogr. Inf. Sci. 24 (1), 107–127. doi:10.1080/13658810802443457
Wang, S. R., Guo, L. L., He, B., and lyu, Y. (2020). The stability of Qinghai-Tibet Plateau ecosystem to climate change. Phys. Chem. EARTH 115, 102827. doi:10.1016/j.pce.2019.102827
Wang, X. Y., Su, F. Z., Yan, F. Q., and Zhang, X. (2023). Effects of coastal urbanization on habitat quality: a case study in guangdong-Hong Kong-Macao greater bay area. Land 12 (1), 34. doi:10.3390/land12010034
Weber, D., Schaepman-Strub, G., and Ecker, K. (2018). Predicting habitat quality of protected dry grasslands using Landsat NDVI phenology. Ecol. Indic. 91, 447–460. doi:10.1016/j.ecolind.2018.03.081
Wu, X.Y., and Zhu, X.F. (2023). Differences in response to climate extremes in different vegetation zones in China. J. Ecol. 43 (24), 10202–10215. doi:10.20103/j.stxb.202306081217
Xu, X. B., Tan, Y., Yang, G. S., and Barnett, J. (2018). China's ambitious ecological red lines. LAND USE POLICY 79, 447–451. doi:10.1016/j.landusepol.2018.08.037
Xu, X. K., Chen, H., and Levy, J. K. (2008). Spatiotemporal vegetation cover variations in the Qinghai-Tibet Plateau under global climate change. Chin. Sci. Bull. 53 (6), 915–922. doi:10.1007/s11434-008-0115-x
Yuke, Z. (2019). Characterizing the spatio-temporal dynamics and variability in climate extremes over the Tibetan plateau during 1960–2012. J. Resour. Ecol. 10 (4), 397–414. doi:10.5814/j.issn.1674-764x.2019.04.007
Zhang, C. P., Dong, Q. M., Chu, H., Shi, J., Li, S., Wang, Y., et al. (2018). Grassland community composition response to grazing intensity under different grazing regimes. Rangel. Ecol. Manag. 71 (2), 196–204. doi:10.1016/j.rama.2017.09.007
Keywords: Qinghai-Tibet plateau, habitat quality, InVEST model, geodetector model, ecological red-line policy, climate change, human activities, grazing intensity
Citation: Jiang F, Liu C, Zhao J, Jiang B and Fan F (2024) Habitat quality assessment on the Qinghai-Tibet plateau across vegetation ecoregions using InVEST and Geodetector models. Front. Earth Sci. 12:1432434. doi: 10.3389/feart.2024.1432434
Received: 14 May 2024; Accepted: 23 September 2024;
Published: 18 October 2024.
Edited by:
Hongjian Zhu, Yanshan University, ChinaReviewed by:
Jun Li, China University of Geosciences, ChinaBhupati Neupane, Chinese Academy of Sciences (CAS), China
Cheng Renju, CAGS, China
Copyright © 2024 Jiang, Liu, Zhao, Jiang and Fan. This is an open-access article distributed under the terms of the Creative Commons Attribution License (CC BY). The use, distribution or reproduction in other forums is permitted, provided the original author(s) and the copyright owner(s) are credited and that the original publication in this journal is cited, in accordance with accepted academic practice. No use, distribution or reproduction is permitted which does not comply with these terms.
*Correspondence: Chonghao Liu, bGl1Y2hjYWdAMTYzLmNvbQ==; Jianan Zhao, emhhb2ppYW5hbjE5ODlAMTYzLmNvbQ==