- State Key Laboratory of NBC Protection for Civilian, Beijing, China
Accurate three-dimensional spatiotemporal distribution information on near-surface aerosols is of great significance for environmental research. In this study, a 3D scanning coaxial Mie lidar (3D-STML) was developed to achieve a fast three-dimensional scanning observation of aerosol diffusion processes in near-surface areas. 3D-STML generates high-spatiotemporal resolution images of aerosol extinction coefficient in real-time and captures the dynamic changes of aerosols in near real-time. By optimizing the design of the light guide mirror and the telescope sub-mirror, the system has a small overlap. Based on this, a highly stable and high-speed mechanical rotation mechanism was developed to enable three-dimensional observations. The integration of a solid-state high-repetition-rate pulsed laser and a coaxial, optical system for the transmitter and receiver ensures rapid tracking of aerosol plumes. To meet the observation requirements of near-surface aerosols, an aerosol inversion algorithm combining the Fernald and Klett methods was designed and developed. For aerosol plume monitoring needs, an aerosol plume-tracking algorithm based on Kalman filtering was developed to track the spatiotemporal evolution of aerosols automatically. Experimental results demonstrated that 3D-STML is capable of detecting aerosols in a range from 15 m to 4 km, with a distance resolution of 1.5 m and a time resolution of 0.083 s. It can effectively track and capture aerosol plumes. It can be used for large-scale, long-term observation of near-surface aerosols and for monitoring the spatiotemporal evolution of aerosol plumes.
1 Introduction
Aerosols are mixtures formed by solid or liquid microscopic particles suspended in a gas, typically ranging in diameter from a few nanometers to several tens of micrometers (Luc. Van Vaeck and Van Cauwenberghe, 1985; A. G. Clarke et al., 1999). Industrial emissions, vehicle exhaust, and other activities release many pollutants, some of which form aerosols. These aerosols disperse and transport in the atmosphere, leading to environmental pollution and health issues. Understanding aerosols’ transport processes and behavior in the atmosphere is of significant importance in revealing the sources of pollutants, their pathways of propagation, and the interplay between different regions (Talukdar and Maitra, 2019; Xie et al., 2020).
Due to the combined effects of animal and plant activities, meteorological conditions, and human factors, the spatiotemporal distribution patterns of near-surface aerosols are often highly complex (Ramanathan et al., 2001). Additionally, the near-surface region, a concentrated area of human activities and pollution sources, presents challenges for observation. Factors such as high population density, urban structures, and topography can interfere with aerosols’ transport and dispersion processes, making their observation more difficult. Passive observation instruments such as spectrometers and mass spectrometers can provide long-term stable aerosol observation data (H. Tammet et al., 1998; Allan et al., 2003). However, these instruments are generally limited in their detection range, and deploying them over large areas incurs high costs. Unmanned aerial vehicles equipped with aerosol sensors can adjust their observation paths and altitudes flexibly to obtain more accurate data on aerosols’ vertical or horizontal distribution (James M. Brady et al., 2016). Nevertheless, unmanned aircraft observation is limited by flight time and payload capacity, and the coverage range needs to be improved. Satellite remote sensing can provide extensive information on the spatiotemporal distribution of aerosols (Zhang et al., 2021; Xu et al., 2022). However, it measures the aerosol optical thickness of the entire atmospheric layer. It is subject to limitations in remote sensing resolution, cloud cover, and temporal gaps, thus posing constraints on detailed observations of near-surface regions.
Atmospheric lidar is an active optical remote-sensing technology with a wide measurement range, good real-time performance, and strong anti-interference capability (Thomas, 1991; Yang et al., 2023). It has been applied for aerosol observations. Existing atmospheric lidars generally adopt off-axis optical systems, which result in a large blind zone near the surface due to the overlap effect (Wandinger and Ansmann, 2002). They are mainly used for long-term directional observations of the middle and upper atmospheres (Sassen, 1991; Jinhuan and Hongbin, 2004). Regarding near-surface aerosol observations, the following work has been done: Yan et al. (2013) developed a portable micro-pulse Mie scattering lidar and a three-dimensional scanning system based on a coaxial optical path, which is used to observe atmospheric boundary layer structures, clouds, and aerosol properties. Wang et al. (2020) developed a blind-zone-free scanning lidar based on a dual field-of-view (FOV) receiving system, which is used to locate industrial pollution sources on the ground. Chen et al. (2021) developed a polarized micropulse lidar (P-MPL) to analyze the characteristics of aerosols and cloud layers during short-term rainfall, convective roll clouds, and haze processes. Many scholars generally adopt vertical observations and attempt to describe the long-term dynamic changes of local aerosols, which play a key role in aerosol pollution prevention and control. In this study, aiming at the complex near-surface environment and a wide range of aerosol sources, a lidar system was developed by combining algorithms and hardware. It has the characteristics of low energy, a small observation blind zone, good real-time performance, and the ability to track aerosol plumes in three dimensions dynamically. It can provide more detailed and accurate spatiotemporal information on atmospheric aerosol evolution and provide strong support for environmental monitoring, climate research, and air quality assessment.
This article introduces the 3D-STML system, which uses a solid-state high-repetition-rate pulsed laser, designs a co-axial optical path for integrated transmission and reception, and develops a three-dimensional scanning mechanical device. In addition, aerosol inversion algorithms and aerosol plume-tracking algorithms were developed specifically to monitor near-surface aerosols. The remainder of this article is organized as follows: Section 2 introduces the framework of the 3D-STML system, the principles of the algorithms used, and the performance parameters of each component. Section 3 describes the observational experiments conducted using the 3D-STML system, including a comparison observation in Hefei with the commercial product LVIS-T100, observations of spatiotemporal aerosol evolution in Qingdao, and observations of aerosol plume-tracking. The final section presents the concluding remarks.
2 Materials and methods
2.1 System structure
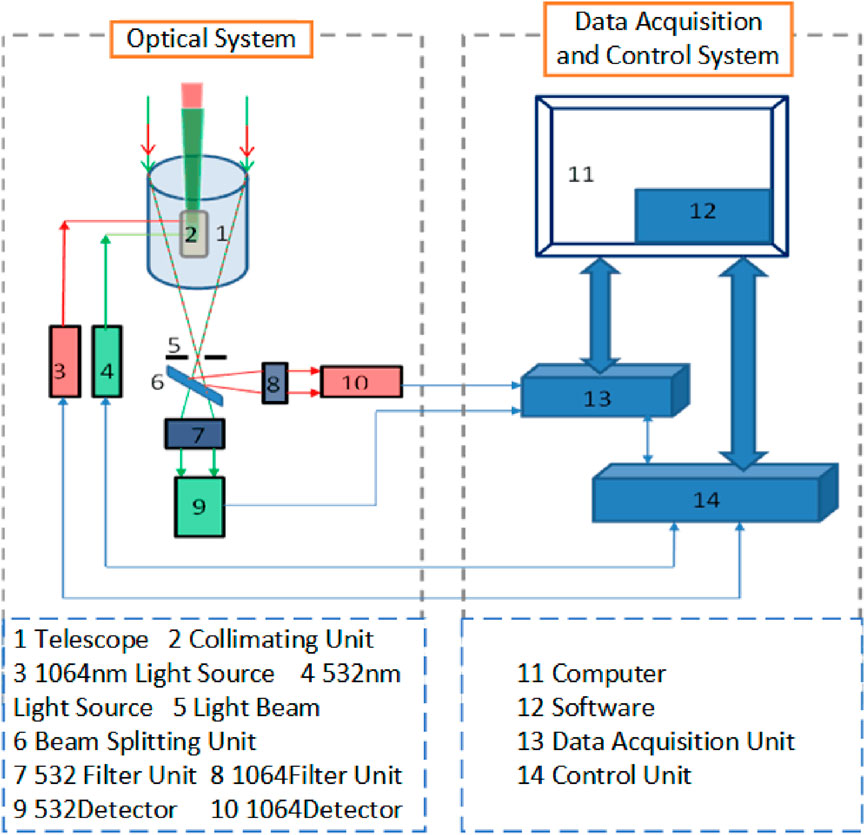
The system structure of the 3D-STML comprises two main components: an optical system and a data acquisition and control system, as shown in Figure 1. The components labeled as 1,064 (3, 8, 10) are optional elements reserved during the system design to enhance the detection performance of the system.
The laser emission unit consists of a laser and an emission lens group. It uses a diode-pumped, high-frequency, low-energy, solid-state laser, which is essential to the system’s operation.
The optical receiving unit comprises a primary telescope mirror, a pinhole optical grid, and subsequent optical systems. It features a coaxial lens system for both laser emission and signal reception. It serves both as a beam expander for laser emission and as a mirror for receiving echo signals, enabling a compact lidar system structure. After the backscattered photons reach the detector, they are converted into electrical pulse signals. These signals are accumulated and chronologically counted by a photon counter and then stored in a data storage unit. This system utilizes asynchronous accumulation, which means that all data points are stored in the internal memory when a pulse cycle occurs, and then, the accumulation process occurs. Although this method requires specific accumulation procedures to be executed within each pulse cycle, resulting in a limited maximum collection depth, it is relatively simple to implement and can quickly meet timing requirements. A computer reads and displays these data in real-time as echo curves and detection data.
A coaxial design has many advantages in the working scenario of 3D-STML (three-dimensional scanning and tracking of aerosol plumes). According to relevant simulation studies, compared to a dual-axis laser radar, a coaxial laser radar has a smaller blind zone (Shiina, 2010; Hao et al., 2013). This means that it can provide more data closer to the earth’s surface. Additionally, adopting a coaxial optical path can reduce the number of components, making the radar system more compact and reducing the engineering implementation difficulty of the three-dimensional scanning device (Rodrigo and Pedersen, 2013). Finally, in scenarios where aerosol plumes need to be tracked and scanned, the environmental conditions change rapidly. A non-coaxial design would introduce more uncertainty due to differences in environmental conditions along the emission and reception paths.
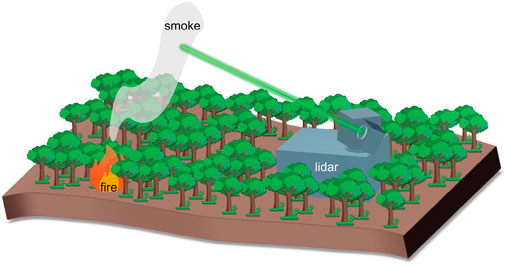
The lidar operation is fully automated through software-controlled circuits, increasing system efficiency and reducing human error. The coaxial design of the laser emitter and optical receiver minimizes the errors and instabilities typically associated with non-coaxial systems, thereby increasing the accuracy of the observations. The signal detection and acquisition device plays a critical role in processing the returned signals to ensure the precision of the observed results. Based on this, we have also designed a three-dimensional scanning device that can be controlled by a program to automate the observation direction. Ultimately, this innovative design allows the 3D-STML to produce real-time images of aerosol extinction coefficients with a high spatiotemporal resolution, making it highly effective for long-term monitoring of near-surface aerosols. The 3D-STML system typically performs horizontal scanning observations of the target area. It conducts three-dimensional tracking scanning observations after detecting aerosol plumes (such as smoke and dust generated from wildfires), as shown in the Figure 2.
2.2 Technical parameters
The laser in this system works at a wavelength of 532 nm, with a laser pulse energy of 10
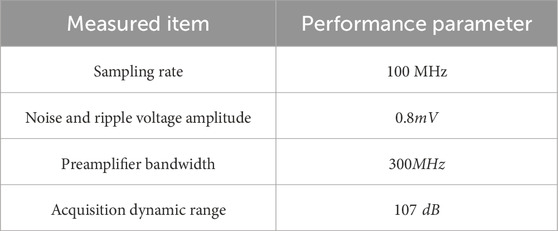
The transient recorder in this system utilizes a hybrid technology that combines single-photon counting with analog-to-digital conversion. This advanced approach ensures both high precision and a broad range of signal intensities from detected targets. The performance parameters of the system are detailed in Table 1.
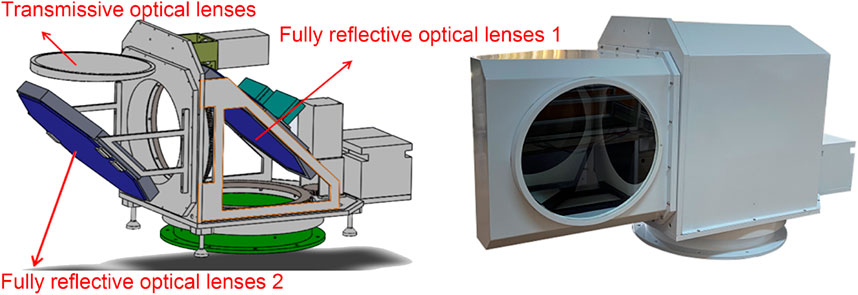
The three-dimensional scanning device is a crucial element of the lidar system for capturing spatial information about the targets. It primarily comprises two octagonal 532-nm total reflection optical lenses and one 240-mm transmission lens, and its overall weight is approximately 100 kg. Its construction is illustrated in Figure 3.
The device utilizes a stepper motor for accurate rotational control, adjusting the number of control pulses and their emission frequency to regulate angular displacement and velocity. Specifically, this project utilizes a two-phase 42-stepper motor connected to the rotating turntable through a worm gear drive mechanism. The stepper motor features a step angle of 1.8°, and the motor controller can achieve up to 16 subdivisions, resulting in a minimum angle of 0.1125°. With a gear ratio of 180:1, a full 360-degree turntable rotation requires 576,000 pulses. By meticulously controlling the pulse count, we can fine-tune the scanning angle resolution of the lidar, ensuring uniform spacing between measurement points. The performance parameters of this setup are detailed in Table 2.
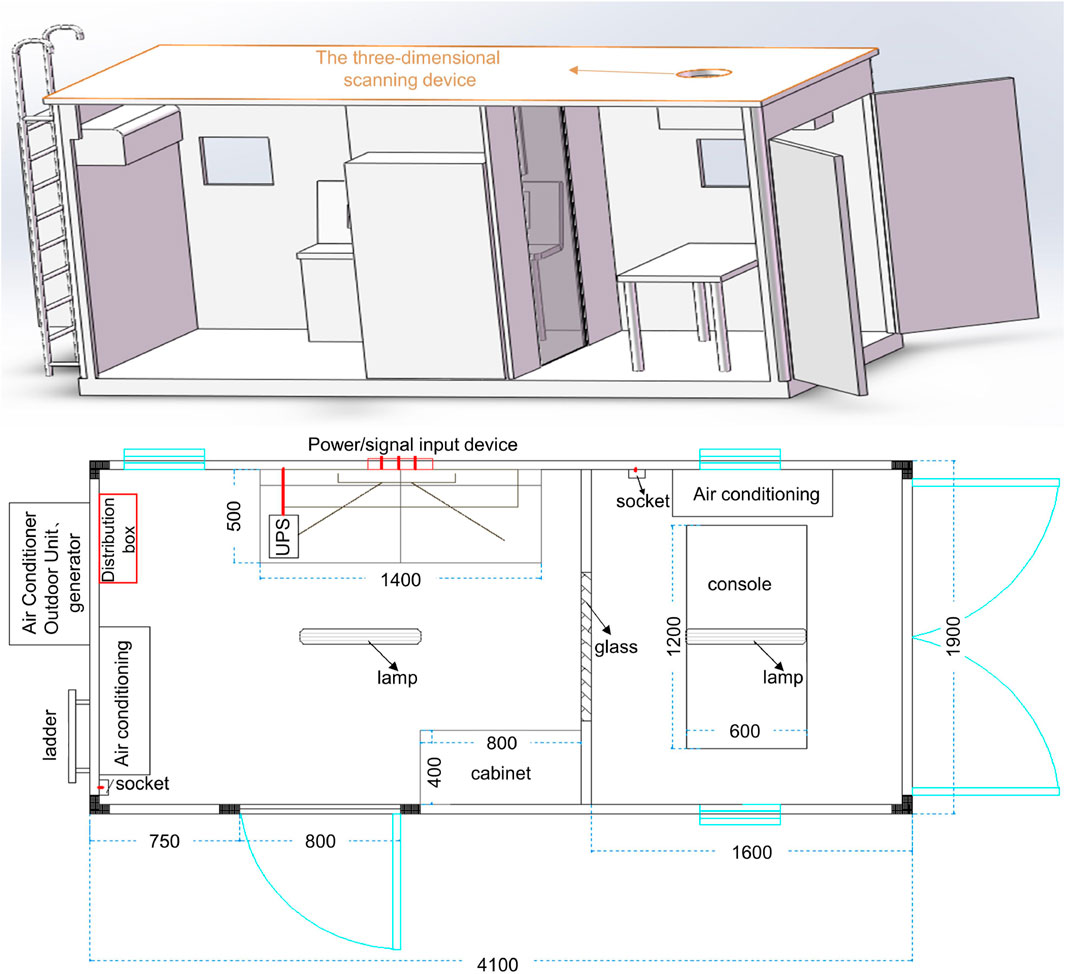
Finally, all components are integrated into a cabin. The internal layout and dimensions of the 3D-STML are shown in Figure 4. The overall weight is approximately 2 tons.
2.3 Inversion algorithms
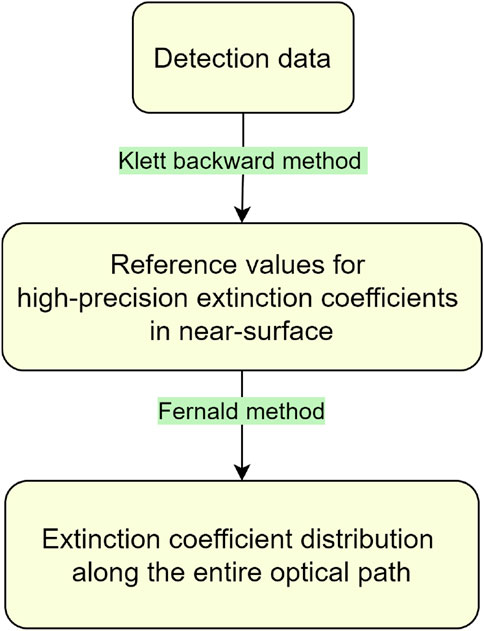
When conducting three-dimensional scanning observations of aerosols, the concentration in the near field is much higher than that in the far field. Even under vertical observation conditions, reaching the clean atmospheric layer is difficult, making it impossible to use the classical Fernald method for calculation (Fernald, 1984; Li et al., 2015). Although the Klett method does not require calibration of the detection height, it can be affected by various factors under complex atmospheric conditions, such as the non-sphericity of aerosol particles and variations in the atmospheric structure, resulting in less accurate inversion results (Klett, 1981, 1983). Considering the observation scenario and the distance, we propose a fusion algorithm combining the Fernald and Klett methods: first, the extinction coefficient of the lidar is inverted using the Klett method, and then, based on the distribution of the extinction coefficient, the scattering signal at the farthest distance is selected as the calibration height for the Fernald method. This approach allows us to obtain more reliable and accurate aerosol concentration inversion results by leveraging the advantages of both methods under complex atmospheric conditions. The algorithm flowchart is shown in Figure 5.The specific principles of the algorithm are as follows:
Based on the principles of lidar and the Mie scattering lidar equation (Samokhvalov, 1979; Liou and Takano, 1994; Young, 1995), the power of the backscattered signal at a distance
where
In the Klett method, the relationship between the backscattering coefficient
where
The backward method of Klett can be used to obtain the atmospheric extinction coefficient at
where
In the equation,
2.4 Aerosol plume tracking algorithm
We have developed an algorithm that can track aerosol plumes. The system remains in the horizontal scanning mode when no aerosol plume is detected. Once an aerosol plume is identified, the system switches to tracking mode. It adjusts the observation direction in real time based on the inversion results by controlling the three-dimensional scanning device. We established a right-handed Cartesian coordinate system with the laser path direction as the positive x-axis direction. The algorithm workflow is as follows:
First, the aerosol plume is identified using the inverted extinction coefficient distribution
After detecting an aerosol plume, a Kalman filter is used to track and predict the state of the plume center (the point with the highest concentration), including its position and velocity (Kalman and Bucy, 1961). The state vector
where
Assuming constant velocity, the state transition equation can be represented as follows:
where
In the lidar system, the position can be directly observed, and the velocity is inferred from the position changes, as shown in Equation 9:
where
The predicted covariance matrix is calculated as shown in Equation 10:
where
Finally, the Kalman gain is calculated, and the state is continuously updated to maintain the tracking of the aerosol plume, as shown in Equation 11:
where
It is worth noting that the algorithm cannot distinguish between aerosol plumes and low-level clouds as both exhibit sharp and high-extinction gradient areas. Therefore, the detection strategy adopted by the algorithm is to continue horizontal scanning observations in the absence of aerosol plumes to avoid interference from clouds. This approach also applies to scenarios such as surface wildfires and industrial emissions. However, it should not be overlooked that when an aerosol plume is detected, if there is an overlap between the aerosol plume and a low-level cloud, the observation results may be affected, and further analysis by researchers is required. We will strive to improve this algorithm in future research.
3 Results and discussion
3.1 Extinction coefficient retrieval error
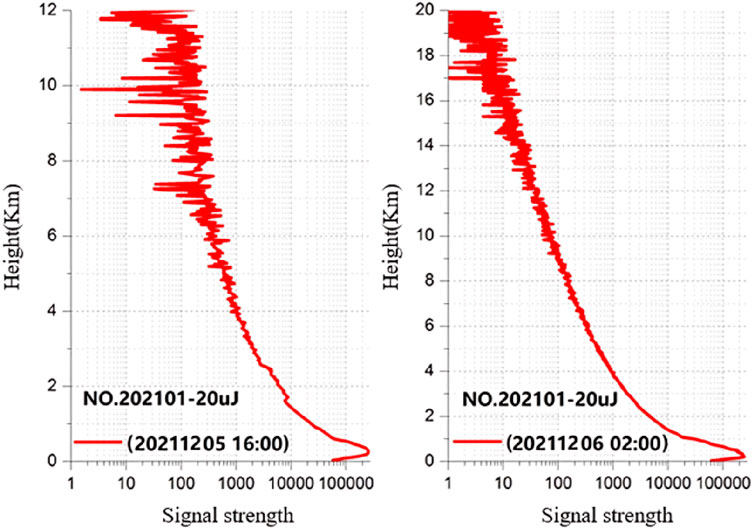
We conducted a test of the extinction coefficient error measurement on the rooftop of building 1, Scientific Island, Hefei City. The test was conducted under clear atmospheric conditions, with a horizontal visibility of more than 10 km. Figure 6 shows the typical measurement data of the lidar during daytime and nighttime. The effective range during the daytime was approximately 8 km, which increased to 18 km at night. Additionally, the overlap region at night was reduced by approximately 200 m. This is likely due to the lower environmental interference at night, resulting in a more concentrated echo signal.
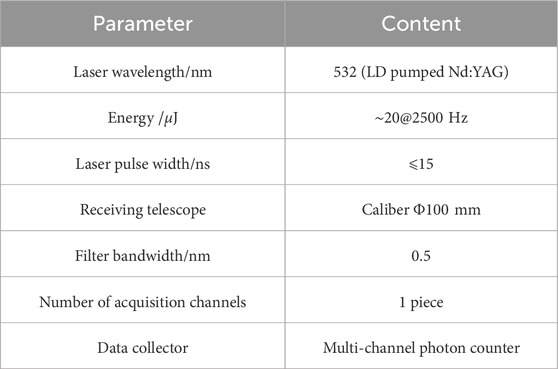
We used the LVIS-T100 portable lidar device developed by the Hefei Institutes of Physical Science, Chinese Academy of Sciences, as a reference instrument, and its parameters are shown in Table 3. During the testing process, we simultaneously operated both 3D-STML and LVIS-T100, keeping them in the atmospheric measurement state. To ensure the accuracy of the results, we placed the two lidars at the same height, with a horizontal distance not exceeding 3 m. We conducted observations at different time intervals and angles by manually adjusting the horizontal and vertical viewing angles and operating both lidars simultaneously. We compared the measurement results of the two devices and calculated the deviation rate. Figure 7 displays the comparison of the vertical measurement extinction coefficient results, with a deviation rate of 7.218
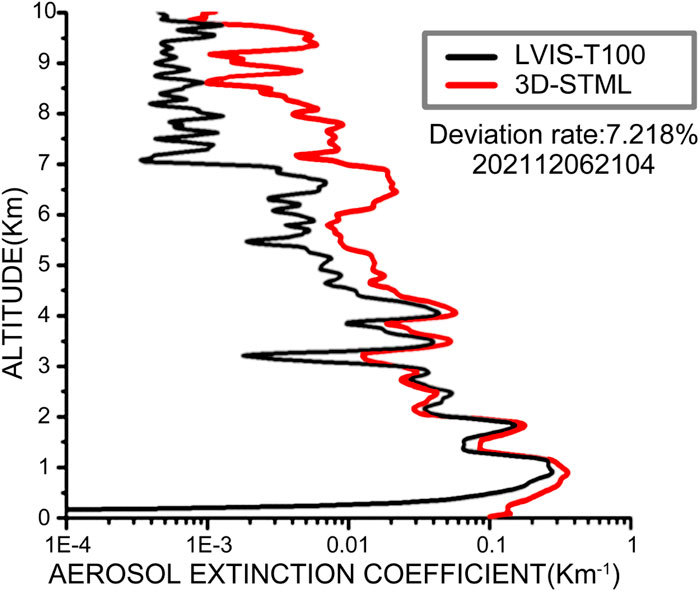
Figure 7. Comparison of horizontal extinction coefficient profiles measured by 3D-STML and the LVIS-T100.
Through this test, we could evaluate the accuracy and stability of the 3D-STML in measuring the extinction coefficient. Considering the test conditions and the limitations of the equipment, the deviation rate is still within an acceptable range despite some deviation. Future work can focus on further optimizing the observation methods and equipment configuration to improve the precision and reliability of the measurements.
3.2 Spatiotemporal evolution of aerosol particles
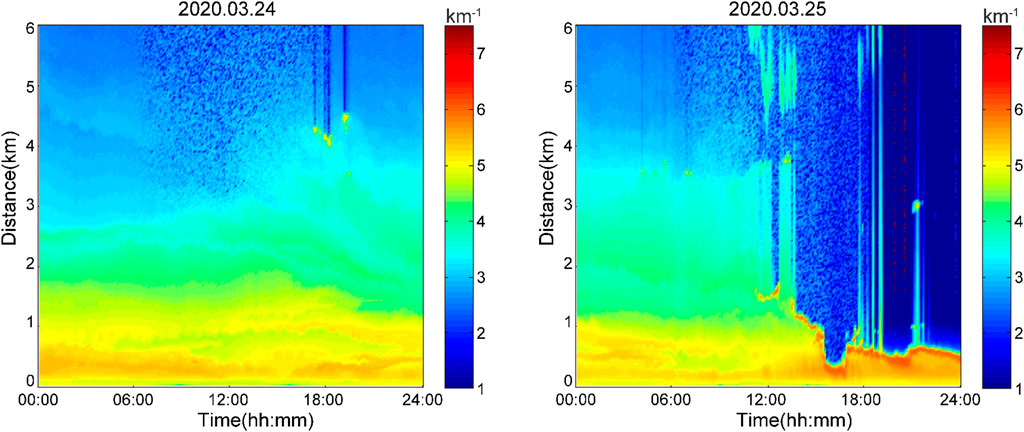
We have developed a software package for the 3D-STML, which includes control, inversion, and visualization functions. Before starting the observation, the software package allows for the configuration of the three-dimensional scanning parameters, followed by the initiation of the device. Once the observation begins, the software package controls the three-dimensional scanning device to return to the starting point and commence operation. Data acquisition is initiated, and the software package receives data until the designated scanning task is completed. The collected data are automatically saved and processed to calculate the corresponding extinction coefficient and then presented as spatiotemporal evolution maps. This format provides a visual representation of the spatiotemporal variations in aerosols, facilitating researchers’ analysis and interpretation of the observations. On 24 and 25 March 2022, the 3D-STML conducted aerosol spatiotemporal evolution observations in Qingdao. The observation results are shown in Figure 8, and the time is UTC+8.
A preliminary interpretation of the results is presented below to illustrate the research value of the spatiotemporal evolution map of 3D-STML. As of noon on 25 March, the vertical distribution of aerosol concentration remains relatively stable, indicating good and stable weather conditions during this period. Near the surface (0–1 km), the extinction coefficient is typically higher, which can be attributed to the accumulation of aerosols due to ground activities such as traffic and industrial emissions. In the early morning of 25 March (from 0:00 to 12:00), there is a more robust extinction coefficient at 3–4 km compared to the same period on 24 March. This suggests that aerosols are being transported to higher altitudes during this period, which is consistent with the frequent vertical transport characteristic of the atmosphere during the transitional season of spring. After noon on 25 March, a strong extinction zone appears 1 km above the ground, almost completely attenuating the signal. Some drizzle clouds may have influenced this. Overall, in long-term continuous observations in a fixed vertical direction, the inversion results of 3D-STML can effectively reflect the changes in environmental aerosols, providing the necessary support for aerosol plume-tracking experiments.
3.3 Observational experiment of aerosol plumes
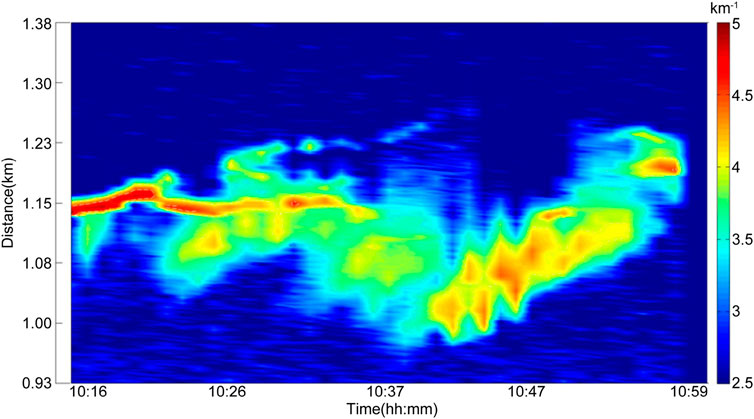
To validate the capability of 3D-STML to track the spatiotemporal evolution of aerosol plumes in three dimensions, we conducted an observation experiment with a particle generator in Qingdao on 23 August 2022. In this experiment, we placed the particle generator approximately 1 km away from the lidar and generated aerosol plumes by mechanical control. At the same time, the 3D-STML entered the scanning mode to begin the observation. Ultimately, we successfully captured the spatiotemporal evolution of the aerosol plumes, as demonstrated in Figure 9. The time is UTC+8.
Figure 9 depicts the spatiotemporal evolution of the aerosol plume. The aerosol concentration is highest at the nozzle of the particle generator, and it gradually decreases as the aerosols disperse in the air. The dispersion is mainly influenced by factors such as the natural wind field and aerosol settling. The plume shows temporal non-uniformity, with higher aerosol concentrations observed in distant and lower areas. This can be attributed to the turbulence and instability of the airflow, leading to an uneven distribution of aerosols.
The 3D-STML generated each profile in just 0.083 s in this experiment, indicating its excellent temporal and spatial resolution and three-dimensional scanning capability. Combined with the spatiotemporal evolution maps generated by the accompanying software package, researchers can better understand the aerosol dispersion process in the atmosphere. Through this experiment, we have validated the capability of 3D-STML to observe the spatiotemporal evolution of aerosol plumes, which is important for understanding aerosol transport and transformation processes. At 10:37, the aerosol plume can be influenced by wind forces in the direction of propagation, resulting in hindered diffusion and an abnormal increase in concentration. Subsequently, under the combined effects of thermal dynamics and turbulence, the plume rises and spreads further.
4 Conclusion
This article introduced the development of 3D-STML and its application to the dynamic monitoring of aerosol plumes. Regarding the system design, a shared coaxial optical system capable of three-dimensional rotation was used for laser emission and reception, allowing the system to have good observation capabilities and three-dimensional scanning ability near the surface. Additionally, an aerosol inversion algorithm based on a fusion of the Fernald and Klett methods was developed, along with an aerosol plume-tracking algorithm based on Kalman filtering. This enabled the system to accurately and stably invert aerosol extinction coefficients and automatically track aerosol plumes. Under favorable weather conditions, the effective range during the day was approximately 8 km, increasing to 18 km at night. For aerosol spatiotemporal observation, the detection range was 0.0015–4.005 km, the dynamic range was 0.001–10
Compared to passive measurement devices like aerosol sensors, 3D-STML was found to have a much larger detection range and better resistance to environmental interference, but it could only measure the aerosol extinction coefficient. Compared to drone-based measurement methods, 3D-STML still displayed an advantage in terms of detection coverage, but it was susceptible to interference from obstructing objects and had slightly less flexibility. Compared to satellite remote sensing, 3D-STML had a much smaller detection coverage range, but its near-surface observation capabilities and spatiotemporal resolution were much higher than those of satellites. Considering all of these factors, 3D-STML has unique advantages for the dynamic monitoring of aerosol plumes. Future research can further enhance the performance and flexibility of the system to meet the aerosol observation needs in different scenarios, and provide more accurate and comprehensive data support for environmental monitoring and related research.
Data availability statement
The raw data supporting the conclusions of this article will be made available by the authors, without undue reservation.
Author contributions
QL: conceptualization, methodology, resources, writing–original draft, and writing–review and editing. YX: software, validation, and writing–review and editing. CC: validation and writing–review and editing. YL: data curation, investigation, and writing–review and editing. YJ: formal analysis, visualization, and writing–review and editing. WS: conceptualization, project administration, supervision, and writing–review and editing.
Funding
The author(s) declare that no financial support was received for the research, authorship, and/or publication of this article.
Conflict of interest
The authors declare that the research was conducted in the absence of any commercial or financial relationships that could be construed as a potential conflict of interest.
Publisher’s note
All claims expressed in this article are solely those of the authors and do not necessarily represent those of their affiliated organizations, or those of the publisher, the editors, and the reviewers. Any product that may be evaluated in this article, or claim that may be made by its manufacturer, is not guaranteed or endorsed by the publisher.
References
Allan, J., Jimenez, J., Williams, P., Alfarra, M., Bower, K., Jayne, J., et al. (2003). Quantitative sampling using an Aerodyne aerosol mass spectrometer 1. Techniques of data interpretation and error analysis. J. Geophys. Res. 108, 1–10. doi:10.1029/2002JD002358
Brady, J. M., Dale Stokes, M., Bonnardel, J., and Bertram, T. H. (2016). Characterization of a quadrotor unmanned aircraft system for aerosol-particle-concentration measurements. Environ. Sci. and Technol. 50 (3), 1376–1383. doi:10.1021/acs.est.5b05320
Chen, C., Song, X., Wang, Z., Wang, W., Wang, X., Zhuang, Q., et al. (2021). Observations of atmospheric aerosol and cloud using a polarized micropulse lidar in xi’an, China. Atmosphere 12, 796. doi:10.3390/atmos12060796
Clarke, A. G., Azadi-Boogar, G. A., and Andrews, G. (1999). Particle size and chemical composition of urban aerosols. Sci. Total Environ. 235, 15–24. doi:10.1016/S0048-9697(99)00186-2
Fernald, F. G. (1984). Analysis of atmospheric lidar observations - some comments. Appl. Opt. 23, 652–653. doi:10.1364/AO.23.000652
Hao, C.-h., Guo, P., Chen, H., Zhang, Y.-c., and Chen, S.-y. (2013). “Determination of geometrical form factor in coaxial lidar system,” in Ispdi 2013 - fifth international symposium on photoelectronic detection and imaging. Editors F. Amzajerdian, A. Aksnes, W. Chen, C. Gao, Y. Zheng, and C. Wang Beijing, China. doi:10.1117/12.2034667
Jinhuan, Q., and Hongbin, C. (2004). Recent progresses in atmospheric remote sensing research in China —Chinese national report on atmospheric remote sensing research in China during 1999–2003. Adv. Atmos. Sci. 21, 475–484. doi:10.1007/BF02915574
Kalman, R. E., and Bucy, R. S. (1961). New results in linear filtering and prediction theory. J. Basic Eng. 83, 95–108. doi:10.1115/1.3658902
Klett, J. D. (1981). Stable analytical inversion solution for processing lidar returns. Appl. Opt. 20, 211. doi:10.1364/AO.20.000211
Klett, J. D. (1983). Lidar calibration and extinction coefficients. Appl. Opt. 22, 514. doi:10.1364/AO.22.000514
Li, C., Pan, Z., Mao, F., Gong, W., Chen, S., and Min, Q. (2015). De-noising and retrieving algorithm of Mie lidar data based on the particle filter and the Fernald method. Opt. EXPRESS 23, 26509–26520. doi:10.1364/OE.23.026509
Liou, K., and Takano, Y. (1994). Light scattering by nonspherical particles: remote sensing and climatic implications. Atmos. Res. 31, 271–298. doi:10.1016/0169-8095(94)90004-3
Omar, A. H., Winker, D. M., Vaughan, M. A., Hu, Y., Trepte, C. R., Ferrare, R. A., et al. (2009). The CALIPSO automated aerosol classification and lidar ratio selection algorithm. J. Atmos. Ocean. Technol. 26, 1994–2014. doi:10.1175/2009JTECHA1231.1
Ramanathan, V., Crutzen, P. J., Kiehl, J. T., and Rosenfeld, D. (2001). Aerosols, climate, and the hydrological cycle. Science 294, 2119–2124. doi:10.1126/science.1064034
Rodrigo, P. J., and Pedersen, C. (2013). Monostatic coaxial 15 μm laser Doppler velocimeter using a scanning Fabry-Perot interferometer. Opt. Express 21, 21105. doi:10.1364/OE.21.021105
Samokhvalov, I. V. (1979). Double-scattering approximation of lidar equation for inhomogeneous atmosphere. Opt. Lett. 4, 12. doi:10.1364/OL.4.000012
Sassen, K. (1991). The polarization lidar technique for cloud research: a review and current assessment. Bull. Am. Meteorological Soc. 72, 1848–1866. doi:10.1175/1520-0477(1991)072⟨1848:TPLTFC⟨2.0.CO;2
Shiina, T. (2010). “Optical design for near range lidar,” in SPIE asia-pacific remote sensing. Editors U. N. Singh, and K. Mizutani Incheon, Republic of Korea. doi:10.1117/12.869568
Talukdar, S., and Maitra, A. (2019). Analysis of an aerosol environment in an urban region and its impact on regional meteorology. Energy, Environ. Sustain., 143–164. doi:10.1007/978-981-15-0540-9_7
Tammet, H., Mirme, A., and Tamm, E. (1998). Electrical aerosol spectrometer of tartu university. J. Aerosol Sci. 29, S427–S428. doi:10.1016/S0021-8502(98)00595-3
Thomas, G. E. (1991). Mesospheric clouds and the physics of the mesopause region. Rev. Geophys. 29, 553–575. doi:10.1029/91RG01604
Van Vaeck, L., and Van Cauwenberghe, K. A. (1985). Characteristic parameters of particle size distributions of primary organic constituents of ambient aerosols. Environ. Sci. and Technol. 19 (8), 707–716. doi:10.1021/es00138a009
Wandinger, U., and Ansmann, A. (2002). Experimental determination of the lidar overlap profile with Raman lidar. Appl. Opt. 41, 511. doi:10.1364/AO.41.000511
Wang, J., Liu, W., Liu, C., Zhang, T., Liu, J., Chen, Z., et al. (2020). The determination of aerosol distribution by a No-Blind-Zone scanning lidar. Remote Sens. 12, 626. doi:10.3390/rs12040626
Xie, W., Li, Y., Bai, W., Hou, J., Ma, T., Zeng, X., et al. (2020). The source and transport of bioaerosols in the air: a review. Front. Environ. Sci. and Eng. 15, 44. doi:10.1007/s11783-020-1336-8
Xu, Q., Chen, X., Rupakheti, D., Dong, J., Tang, L., and Kang, S. (2022). Evaluation and comparison of spatio-temporal relationship between multiple satellite aerosol optical depth (AOD) and near-surface PM2.5 concentration over China. Remote Sens. 14, 5841. doi:10.3390/rs14225841
Yan, Q., Hua, D., Li, S., Wang, Y., and Zhou, Z. (2013). “Observations of the boundary layer structure, cloud and aerosol properties with portable Mie scattering lidar,” in International symposium on precision engineering measurement and instrumentation 2012. Editor J. Lin Chengdu, China. doi:10.1117/12.2014571
Yang, T., Li, H., Wang, H., Sun, Y., Chen, X., Wang, F., et al. (2023). Vertical aerosol data assimilation technology and application based on satellite and ground lidar: a review and outlook. J. Environ. Sci. 123, 292–305. doi:10.1016/j.jes.2022.04.012
Young, S. A. (1995). Analysis of lidar backscatter profiles in optically thin clouds. Appl. Opt. 34, 7019. doi:10.1364/AO.34.007019
Keywords: lidar, near-surface aerosols, aerosol extinction coefficients, environmental monitoring, aerosol plumes
Citation: Li Q, Xin Y, Chen C, Li Y, Jiang Y and Song W (2024) Development and observation of a three-dimensional scanning coaxial Mie lidar for dynamic monitoring of near-surface aerosol plumes. Front. Earth Sci. 12:1430178. doi: 10.3389/feart.2024.1430178
Received: 09 May 2024; Accepted: 05 September 2024;
Published: 25 September 2024.
Edited by:
Gregori de Arruda Moreira, Federal Institute of São Paulo, BrazilReviewed by:
Bijoy Vengasseril Thampi, Science Systems and Applications, Inc., United StatesPaytsar Muradyan, Argonne National Laboratory (DOE), United States
Copyright © 2024 Li, Xin, Chen, Li, Jiang and Song. This is an open-access article distributed under the terms of the Creative Commons Attribution License (CC BY). The use, distribution or reproduction in other forums is permitted, provided the original author(s) and the copyright owner(s) are credited and that the original publication in this journal is cited, in accordance with accepted academic practice. No use, distribution or reproduction is permitted which does not comply with these terms.
*Correspondence: WeiWei Song, c29uZ3dlaXdlaTxhIGhyZWY9Im1haWx0bzoyMDI0QDE2My5jb20iPjIwMjRAMTYzLmNvbTwvYT4=
 QingWei Li
 WeiWei Song