- 1Shanxi Earthquake Administration, Taiyuan, China
- 2National Continental Rift Valley Dynamics Observatory of Taiyuan, Taiyuan, Shanxi, China
- 3Institute of Geology, China Earthquake Administration, Beijing, China
- 4Key Laboratory of Seismic and Volcanic Hazards, Institute of Geology, China Earthquake Administration, Beijing, China
Following the earthquake, prompt evaluation of the distribution of coseismic landslides and estimation of potential disaster losses are crucial for emergency response and resettlement planning. The Luding earthquake of 2022 offers a valuable opportunity to conduct a rapid assessment of coseismic landslides using various models. In this study, we utilize the Logistic Regression (LR)-based Xu2019 model, a new-generation model developed in China, alongside the Newmark model to perform the rapid hazard assessment of coseismic landslides. Assessing the accuracy and applicability of these two models based on the coseismic landslides from the Luding earthquake, we find that within intensity area of IX, the high probability area identified by the Newmark model aligns closely with the actual distribution of landslides. However, the Newmark model’s prediction is overestimated in the intensity area of VIII. For the Xu2019 model, the prediction results are in good agreement with the distribution of actual landslides. Most landslides are located in high probability areas, such as Detuo town, Wandong, and Xingfu villages, indicating that the model has a higher prediction accuracy. Overall, two models have good practical utility in emergency hazard assessment of coseismic landslides. However, the Newmark model requires multi-input parameters and the assignment of these parameters will increase the uncertainty and subjectivity in the practical application of the modeling assessment.
1 Introduction
Powerful earthquakes often trigger numerous seismic geological disasters in mountainous regions. The casualties and property losses resulting from these catastrophes significantly contribute to the overall earthquake risk (Gorum et al., 2013; Fan et al., 2019; Havenith et al., 2022). Earthquake-induced landslides are significant secondary geological disasters, often occurring during or shortly after an earthquake (Keefer, 1984; Xu et al., 2016; Shao et al., 2023a). They are characterized by their large quantity and scale, wide distribution, complex mechanisms, resulting in severe casualties and economic losses, and prolonged post-earthquake effects (He et al., 2023; He et al., 2024).
Rapid and precise acquisition of the spatial distribution and potential hazard assessment of coseismic landslides following an earthquake is crucial for emergency rescue and resettlement planning (Tanyas et al., 2019a; Tanyas et al., 2019b; Nowicki Jessee et al., 2019). Currently, the coseismic landslide hazard assessment methods included the machine learning methods (Shao et al., 2019; Ma et al., 2020; Huang et al., 2022; Shao and Xu, 2022; Wang et al., 2023) and the Newmark method based on mechanics mechanism (Chen et al., 2014; Jin et al., 2018; Liu et al., 2018; Huang et al., 2020). Machine learning methods face a challenge: they require detailed co-seismic landslide data for model training. However, visually interpreting earthquake-induced landslides is difficult and time-consuming due to issues such as collecting and processing satellite or aerial images, cloud cover, and the slow speed of manually identifying massive landslides (Robinson et al., 2017). As a result, the assessment results based on data-driven methods frequently lag behind the actual emergency response, rendering them ineffective for the prevention and mitigation of seismic landslides (Nowicki et al., 2014; He et al., 2021).
In recent years, near-real-time assessment models of coseismic landslides based on data-driven approaches have emerged as powerful tools for quickly estimating the spatial location of landslides (Kritikos et al., 2015; Xu et al., 2019; He et al., 2021). The goal of these models is to create a near real-time prediction model of seismic landslides at a large regional scale (global or national) by utilizing the existing landslide inventories and machine learning methods. The model can then be applied in a sudden earthquake event by combining with the ground motion, and topographic and geological data of the quake-affected area (Tanyas et al., 2019a; Nowicki Jessee et al., 2019). For example, Nowicki et al. (2014) used the logistic regression (LR) method to create a globally applicable near real-time assessment model with a 1 km resolution based on four global coseismic landslide databases. Subsequently, Nowicki Jessee et al. (2019) updated the existing coseismic landslide inventories and established a new evaluation model based on the 23 earthquake events. Tanyas et al. (2019a) established a global slope unit-based model for the near real-time prediction of earthquake-induced landslides based on seven influencing variables and 25 coseismic landslide inventories around the world. Allstadt et al. (2018) chose the 2016 Mw 7.8 New Zealand earthquake as a test case to assess the performance and applicability of three globally published near-real-time models. The evaluation results show that the global empirical model for near-real-time assessment of coseismic landslides has great potential in emergency assessment. Meanwhile, Xu et al. (2019) introduced a real probability prediction method for coseismic landslides using the Bayesian probability method and LR model. They established a new generation earthquake landslide hazard model in China based on nine real earthquake cases. These studies suggest that data-driven near-real-time prediction models have promising prospects and significant potential for rapidly assessing regional earthquake-induced landslides.
The physically-based Newmark displacement method fully considers the mechanism of earthquake-induced landslides. It utilizes slope instability results and seismic displacement to quantitatively classify the hazard level of coseismic landslides. This method is widely used globally for rapidly assessing earthquake-induced landslides (Jibson, 2011; Wang et al., 2018). This method has also been applied to the emergency assessment of coseismic landslides in many regions, such as the 1979 ML 5.7 Coyote lake earthquake (Wilson and Keefer, 1983), 1994 Mw6.7 Northridge earthquake (Jibson et al., 2000), 2008 Mw7.9 Wenchuan earthquake (Godt et al., 2008), 2013 Mw6.7Lushan earthquake (Ma and Xu, 2019b; Jin et al., 2019), 2014 Mw6.1 Ludian earthquake (Chen et al., 2018), 2015 Mw7.9 Nepal earthquake (Gallen et al., 2017), 2017 Mw7.0 Jiuzhaigou earthquake (Yue et al., 2018), 2017 Ms 6.9 Milin earthquake (Du et al., 2022), 2021Mw7.4 Maduo earthquake (Wei and Chen, 2022). These cases demonstrate the reliability and timeliness of the physically-based Newmark model in emergency assessments of regional earthquake-induced landslides.
Overall, although both methods are widely used in the rapid assessment of earthquake-induced landslides, there is still a lack of quantitative comparative analysis regarding the applicability of data-driven models and the Newmark model in rapid emergency assessment of coseismic landslides, especially in the Sichuan and Yunnan area with frequent earthquake. On 5 September 2022, an Ms6.8 earthquake struck Luding County, Ganzi Tibetan Autonomous Prefecture, Sichuan Province, with an epicenter reported at 102.08 E, 29.59 N and a focal depth of 16 km by the China Earthquake Networks Center (CENC). The earthquake-produced shaking by the China Earthquake Administration (CEA) assigned a maximum seismic intensity of IX on the Mercalli scale, which is determined by the degree of damage to buildings during an earthquake, instrumentally measured ground motion, engineering damage, human perception, and other macroscopic phenomena. As of September 13, the earthquake had resulted in 93 deaths and 25 individuals missing. Otherwise, this event triggered massive coseismic landslides, mainly including shallow debris flows, collapses, topples and a few large-scale debris slides (Zhao et al., 2022; Dai et al., 2023; Yang et al., 2023). Many residential houses and roads were destroyed, resulting in greater personnel and property losses. Among them, casualties directly caused by building’s collapses account for about 20%, and more than 80% are related to earthquake-induced landslides (Fan et al., 2022), which provides an excellent opportunity for us to carry out different evaluation models in the regional rapid assessment of earthquake-induced landslides.
This study utilized the Xu2019 model, a new generation Chinese seismic landslide hazard model, along with a simplified Newmark model to perform a rapid emergency assessment of landslides triggered by the 2022 Ms6.8 Luding earthquake. Then, Based on the coseismic landslide inventory derived from the visual interpretation of pre and post-quake Planet images with 3 m resolution, a detailed quantitative analysis of the emergency evaluation results was performed to investigate the applicability of the two models in this earthquake event. This study is expected to be useful for rapid emergency response, optimizing emergency deployment, and improving emergency rescue efficiency for a single earthquake event.
2 Study area
The Xianshuihe fault is an active and large-scale strike-slip fault zone that controls the relative movement and extrusion of sub-plates. This occurs against the backdrop of continued southeastward squeezing of crustal materials at the southeast margin of the Tibetan Plateau due to the convergence of the India-Eurasia plate (Tapponnier et al., 2001). The Xianshuihe fault is situated at the boundary between the Songpan-Ganze block and the Chuan-Dian block on the eastern margin of the Tibetan Plateau. It intersects with the Longmenshan fault and the Anninghe fault, forming the well-known “Y-shaped” fault zone in western Sichuan (Figure 1). Stretching 350 km from the northwest of Donggu to the south of Moxi, the fault has a strike ranging from about 130° to 148° (Bai et al., 2018). The 2022 Ms 6.8 Luding earthquake happened close to the Moxi fault in the southeastern segment of the Xianshuihe fault zone. Since 1700, there have been 17 earthquakes with a magnitude of seven or higher along the Xianshuihe fault zone, with nine of them occurring in the middle segment of the fault (Figure 1).
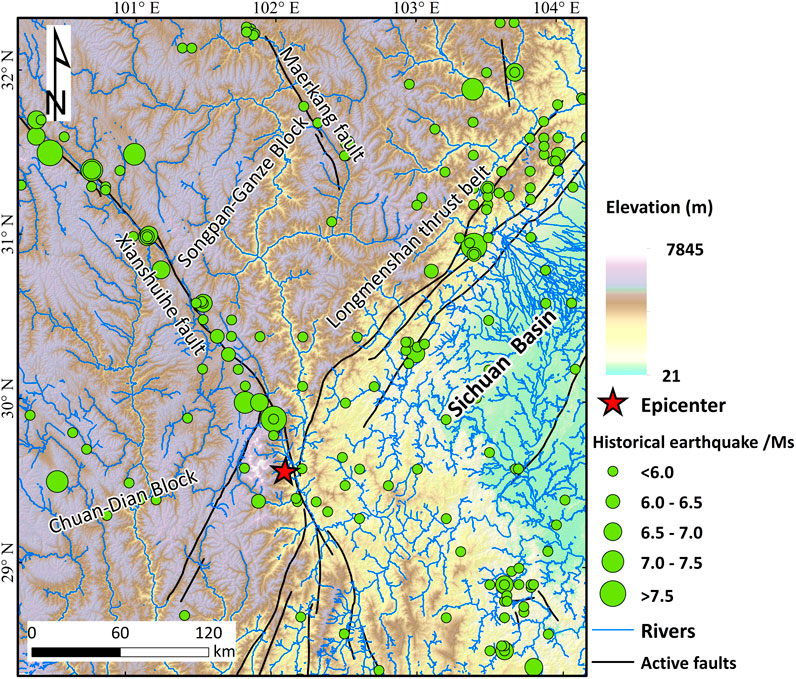
Figure 1. Map showing the active faults, historical earthquakes and topography distribution near the Xianshuihe fault. The active fault lines are from Deng (2007).
The Luding area is situated in the Hengduan Mountains on the southeastern edge of the Tibetan Plateau, characterized by alpine and canyon landforms. The Dadu River flows through the region from north to south, featuring a significant drop in elevation. The epicenter of the Luding earthquake, at 102.08°E, 29.59°N, is located in the Hailuogou Glacier Forest Park of Gongga Mountain, standing at 7,556 m above sea level with an altitude difference of 6,570 m. The study area experiences a typical subtropical monsoon climate, with an average annual temperature of 15.5 C and annual rainfall of 664.4 mm. The formation lithology in the area is mainly Quaternary alluvial proluvial deposits (Qh2apl) and fluvioglacial deposits (Qp3−lgfl), Permian dolomite, middle Devonian limestone and magmatic rock (Figure 2). The extensive tectonic activity and weathering in this region have led to the development of rock mass joints and fragmentation, creating favorable conditions for landslides to occur (Li et al., 2022).
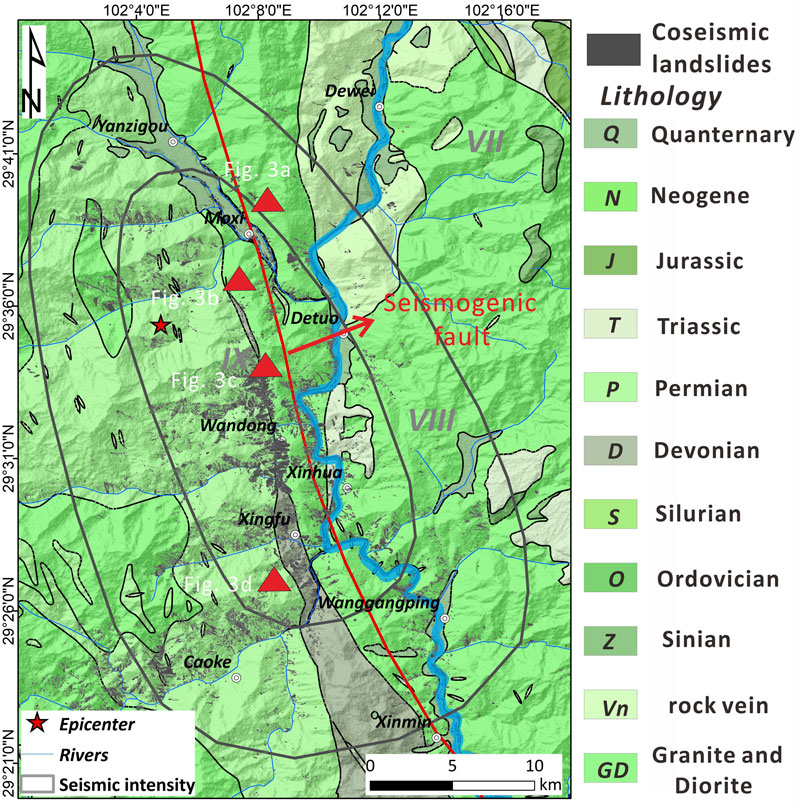
Figure 2. Geological map of the study area; the red line is the seismogenic fault of luding earthquake event; the coseismic landslide inventory of this event is obtained from Shao et al. (2024).
3 Method and data
3.1 Coseismic landslide inventory of 2022 luding earthquake
The coseismic landslide database relies on visual interpretation of satellite images taken before and after the earthquake (Shao et al., 2024). The post-earthquake images are Planet images with a resolution of 3 m, collected from September 8 to 30 December 2022. In order to verify that any landslides present before the earthquake were not mistaken for coseismic landslides, the pre-quake Planet images in July and August of the study area were acquired. The results reveal that the earthquake triggered approximately 12,600 landslides with a total landslide area of 36.0 km2 in areas above VIII intensity zones on the Mercalli scale. The largest landslide area measures 120,000 m2, while the smallest is 65 m2, with an average area of 2,700 m2 (Figure 2). Coseismic landslides are mainly found on both sides of the Moxi fault and the Dadu River and concentrated in intensity IX areas like Moxi, Detuo, and Wanggangping town (Figure 2). Among them, Wandong village is the most affected area by landslides in this earthquake. Field photos illustrating the development of coseismic landslides in the landslide-prone areas of this earthquake event are shown in Figure 3.
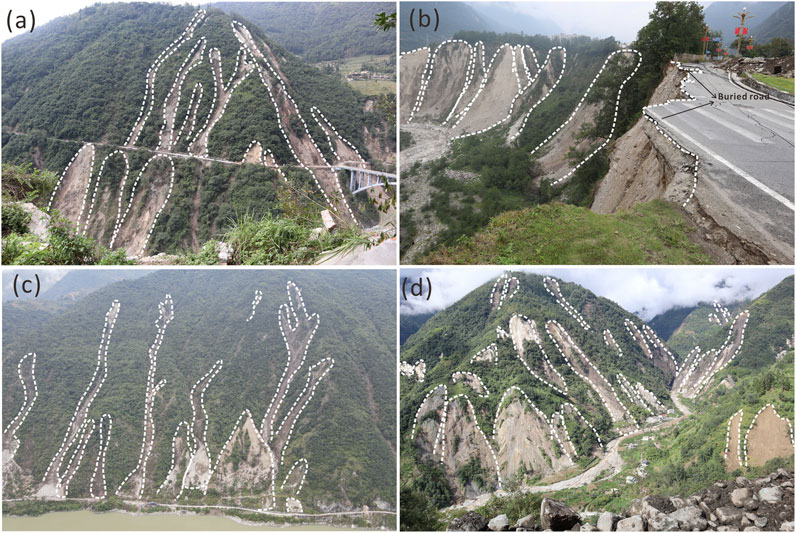
Figure 3. The field photos of coseismic landslides triggered by the Luding earthquake event; (A) Shallow debris flows in the west of Hailuogou Bridge; (B) Group-occurring collapses near Moxi Platform; (C) Shallow landslides near Detuo town; (D) Shallow landslides and collapses near Xingfu village.
3.2 Newmark method
The Newmark displacement method was initially introduced by Newmark (1965) for analyzing the stability of dams under earthquake conditions. It posits that the instability of the dam is influenced by the deformation resulting from the earthquake rather than the minimum safety factor. This method considers that the permanent displacement is caused by constantly accumulated displacement along the most dangerous sliding surface after the instantaneous instability of the sliding body under the ground action. In this method, the critical (or yield) acceleration (ac) of the potential sliding body is determined by the pseudo-static method, and the permanent displacement can be calculated by quadratic integration of the portion of the ground motion acceleration time history that exceeds the ac.
The cumulative displacement based on the Newmark model is calculated in three steps including slope safety factor (Fs), critical acceleration (ac), and permanent displacement:
(1) Through geometric properties of the slope (thickness of rock and soil mass (t), saturation degree of rock and soil mass (m), the inclination angle of the sliding surface (α) and mechanical properties of rock and soil mass ( effective cohesion (
(2) Using the infinite slope method, we can derive the ac from the above Fs (Equation 2).
where g is the gravitational acceleration, α is the inclination angle of the sliding surface, which is approximated by the slope angle.
(3) The Newmark displacement (Dn) of the study area can be determined using a simplified Newmark equation (Equation 3). In this study, we selected the empirical Newmark equation, derived from a dataset of 2,270 strong-motion records from 30 earthquakes worldwide (Jibson, 2007).
The probability of slope failure (Pf) in the study area can be calculated based on the spatial distribution of the Newmark displacement (Dn). This calculation is performed using the failure probability curve, which is fitted using data from the 2008 Wenchuan earthquake-induced landslide inventory (Ma and Xu , 2019b) (Equation 4). This formula enables the estimation of the instability probability of earthquake-induced landslides in the Wenchuan and surrounding areas
where p(f) represents the probability of failure (Pf); Dn is the calculated Newmark displacement.
3.3 Logistic regression method
The logistic regression (LR) model is a regression analysis used when the dependent variable is a binary categorical variable. It's widely employed as a nonlinear multivariate statistical model in landslide hazard assessment. Moreover, it’s the preferred method for establishing near-real-time prediction models of earthquake-induced landslides (Tanyas et al., 2019a; Nowicki Jessee et al., 2019; Shao et al., 2020). The LR model transforms the dependent variable into a binary categorical variable, where landslide occurrence is denoted by one and non-occurrence by 0. The relationship between the probability of landslide occurrence and potential influencing factors can be expressed as (Equations 5, 6):
Among them, p represents the occurrence probability of landslide. Z represents the sum of the linear weights after the independent variables are superimposed;
This study utilizes the Xu2019 model, a new seismic landslide hazard model, as the near real-time evaluation tool for coseismic landslides (Xu et al., 2019). The model utilizes nine earthquake-induced landslide inventories from various regions in China as training samples. It incorporates 13 influencing factors, including elevation, relative elevation, slope angle, and aspect, to develop a near real-time evaluation model for coseismic landslides using the LR method. This model enables rapid assessment of coseismic landslides following individual earthquake events based on the actual distribution of Peak Ground Acceleration (PGA). Further details about the model are available in the previous study by Xu et al. (2019).
3.4 Data
The elevation data utilized in this study is derived from the ALOS PALSAR Digital Elevation Model (DEM), with a resolution of 12.5 m, obtained from the Alaska Satellite Facility (https://vertex.daac.asf.alaska.edu). The slope gradient across the study area was calculated based on this DEM data. As illustrated in Figure 4A, the spatial distribution of slope angles shows steeper slopes in the western region and gentler slopes in the eastern region. For the ground motion data, we utilized the Peak Ground Acceleration (PGA) map provided by the Xuanmei Fan team from Chengdu University of Technology. This map was generated by interpolating strong motion records collected within 100 km from the epicenter of the earthquake in Sichuan. According to Fan et al. (2022), the seismic stations recorded a maximum PGA value of 644.4 cm/s2, with the corresponding station located approximately 20 km away from the epicenter. The PGA distribution map indicates that areas with higher PGA values are situated to the south of the epicenter, while the northern areas exhibit relatively lower PGA values (https://mp.weixin.qq.com/s/I7lHKb6c7GeJ-Z83T9rJqw).
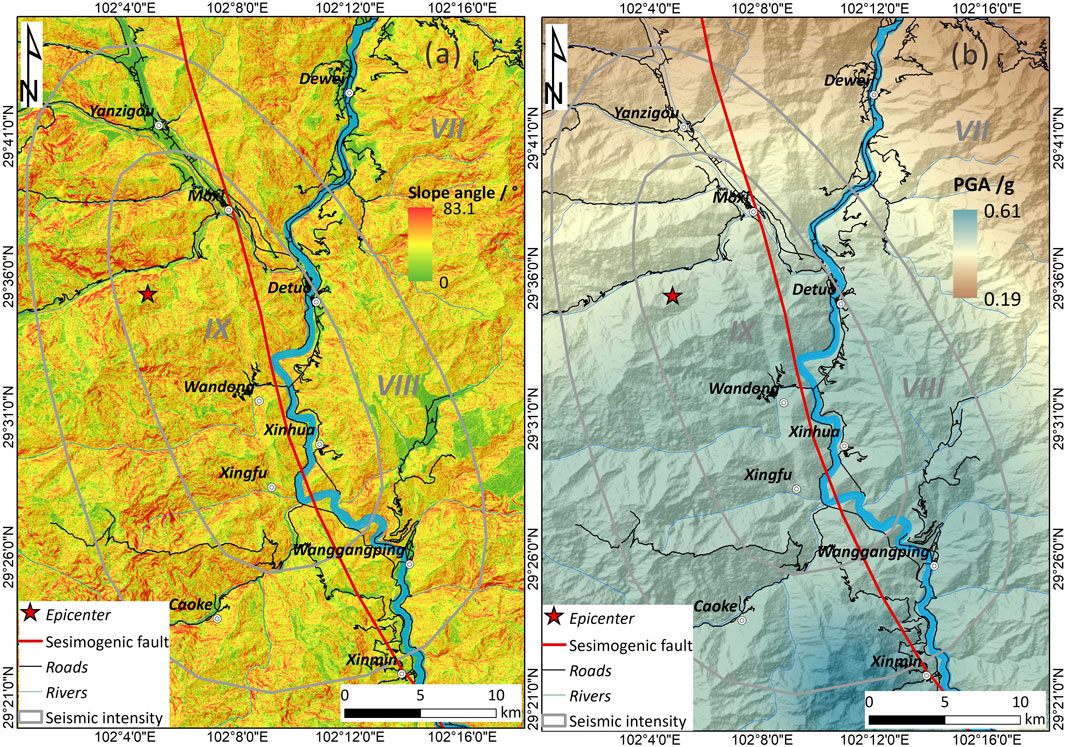
Figure 4. Map showing the distribution of slope angle and ground motion (PGA); (A) The spatial distribution of slope angle; (B) The spatial distribution of PGA (g) is obtained by open peak ground acceleration (PGA) distribution maps published by Xuanmei Fan team of the Chengdu University of Technology.
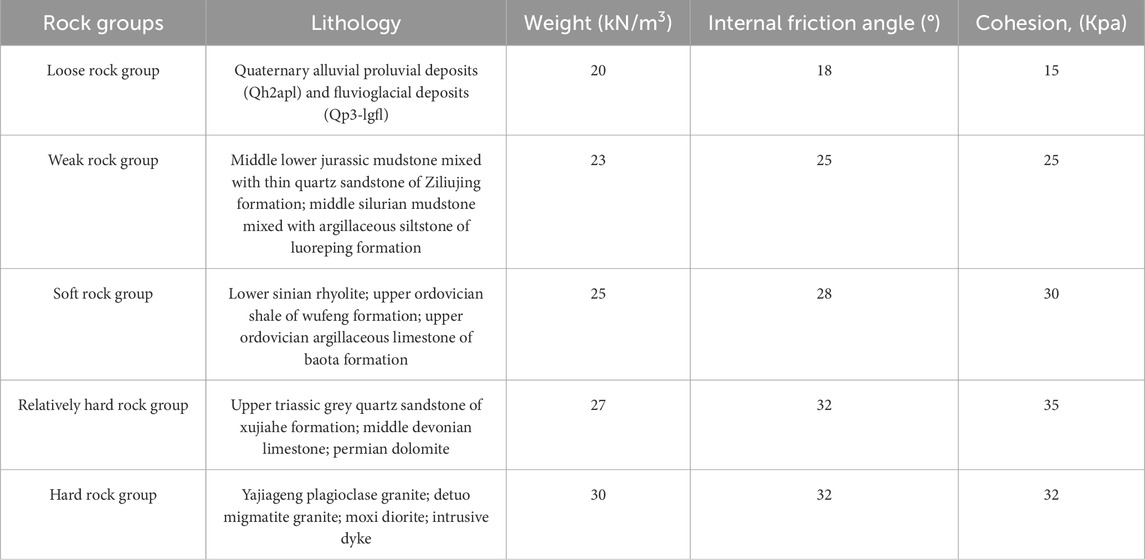
Based on 1:200,000 geological maps published by the China Geological Survey (http://dcc.cgs.gov.cn/), the lithology of the study area was classified into engineering geological rock types, drawing upon previous studies (Zhang et al., 2017; Ma and Xu, 2019b; Wang et al., 2021), and considering the classification of rock masses engineering GB/T 50,218–2014 (Ministry of Water Resources of the People’s Republic of China, 2014). Consequently, the lithology of the study area was divided into five categories: hard rock, relatively hard rock, soft rock, weak rock, and loose rock groups, with corresponding mechanical parameters assigned for each rock group (see Table 1). It is noteworthy that granite and intrusive dikes in this area are significantly affected by tectonic activity, leading to highly developed joints and fissures in the rock mass, resulting in the actual strength of the rock mass being notably lower than that of the rock itself. Based on previous studies (Ma and Xu , 2019a; Ma et al., 2020; Wang et al., 2021), appropriate adjustments were made to the mechanical values of the hard rock group, with a reduction coefficient set at 0.8. Considering that the majority of landslides triggered by this earthquake event are shallow disrupted landslides, it is assumed that the sliding depth of the landslide (t) is 3 m, and the saturation degree of the rock mass (m) is 0, based on previous studies (Dreyfus et al., 2013; Ma and Xu , 2019b).
4 Result
According to Formulas 1, 2 in the above-mentioned Newmark model and the corresponding terrain data and mechanical parameters of rock mass, we can calculate the ac distribution results of the study area (Figure 5A). The ac is used to characterize coseismic landslide susceptibility. In general, the higher the ac, the less prone to slope failure in ground motion. The lower the ac, the more unstable the slope and the easier the slope is to lose stability in ground motion (Chen et al., 2014). The results show that the majority of the areas with lower ac values are located in the steep slopes (that is, slopes greater than 50°, and the ac values in these areas, i.e., red area are generally less than 0.15 (Figure 5A). The ac value of the study area is relatively small in most areas on the west side of the seismogenic fault, while the ac value in the east side of the seismogenic fault is large. By combining the Newmark model and the corresponding PGA distribution (Figure 4B), the Dn value of the Luding earthquake can be calculated. The result shows that the majority of the areas with large Dn values are concentrated on both sides of the valley. In particular, the concentrated areas with large Dn value (that is, the blue area) are distributed in the north of the Luding epicenter such as the nearby area of Detuo town, the western area of Wandong village and Xingfu village (Figure 5B).
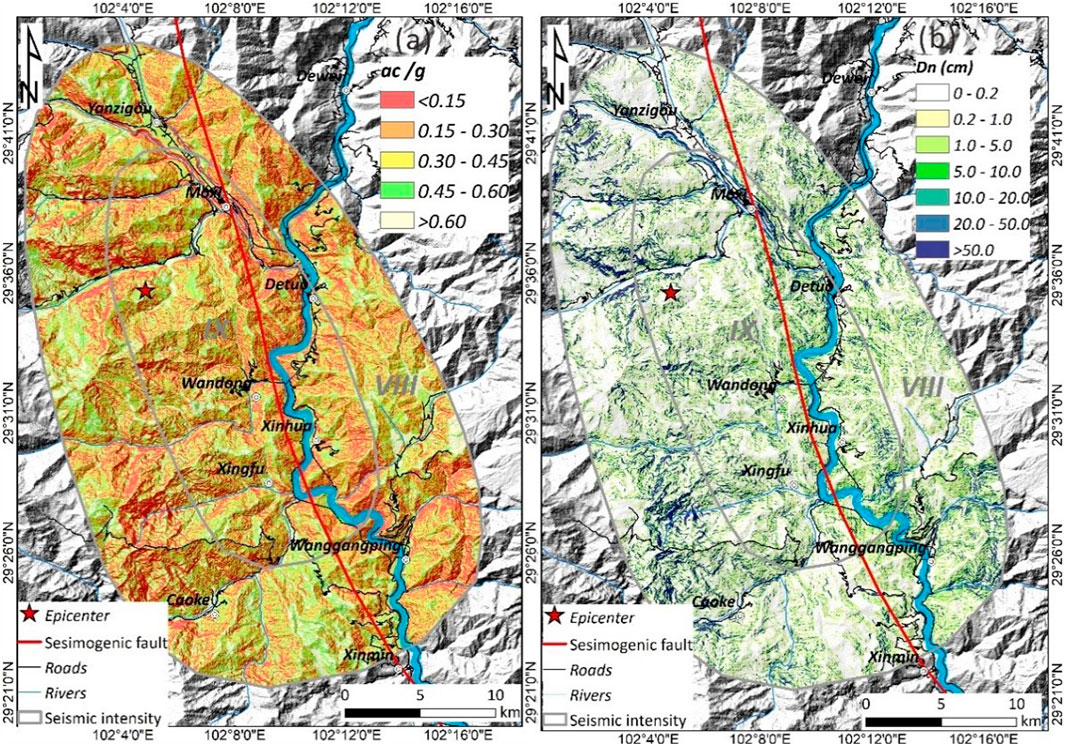
Figure 5. Map showing the distribution of ac and Dn of this Lushan earthquake; (A) Critical acceleration (ac); (B) Newmark displacement (Dn).
Combined with the above Dn distribution result, the estimation of failure probability of the Newmark model can be calculated by the probability curve of slope failure (Figure 6A). As for the LR model, we can also use the Xu2019 model to calculate the probability map of this event through the PGA distribution (Figure 6B). The results indicate that most landslides are mainly distributed along both sides of the seismogenic fault, especially concentrated within a 5 km range on either side of the fault. The Newmark model’s high probability areas align reasonably well with actual landslide distributions in seismic intensity IX zones, primarily situated along both sides of the Dadu River, indicating areas of elevated failure likelihood. However, in regions with seismic intensity VIII, the Newmark model tends to overestimate landslide occurrences. Specifically, it predicts high failure probabilities in the northwest and southern areas of the epicenter, but the actual landslide distribution in these areas is relatively sparse. Conversely, the LR model demonstrates a strong agreement between its prediction results and the observed landslide distribution, with the majority of landslides occurring in high-probability areas. Several landslide abundance areas such as Detuo town, Wandong village, and Xingfu village have high predicted probability which demonstrates that the model has high predictive accuracy.
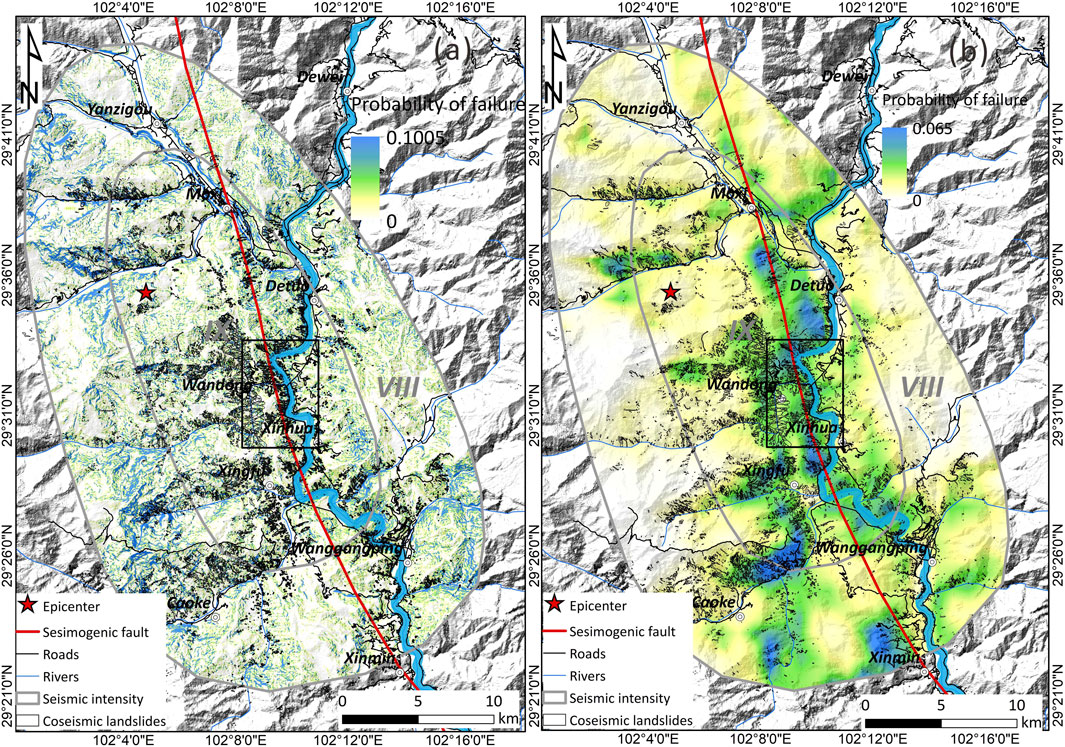
Figure 6. Estimation of slope failure probability calculated by different prediction models; (A) Newmark model; (B) Xu2019 model.
To compare the spatial distribution of slope failure probability with actual landslides, we selected Wandong Village, the area most affected by landslides in this earthquake. Figure 7 displays a locally enlarged area showing the estimated failure probability calculated by different prediction models near Wandong Village. Overall, the predictions of both models align well with the actual landslide distribution in this area. For the Newmark model, high-probability areas are concentrated on both sides of the Dadu River, which corresponds to the actual landslide distribution in this area (Figure 7A). Conversely, the Xu2019 model indicates that the majority of landslides are distributed in regions with middle to high probabilities of instability, with only sporadic landslides occurring in areas of low probability (Figure 7B)
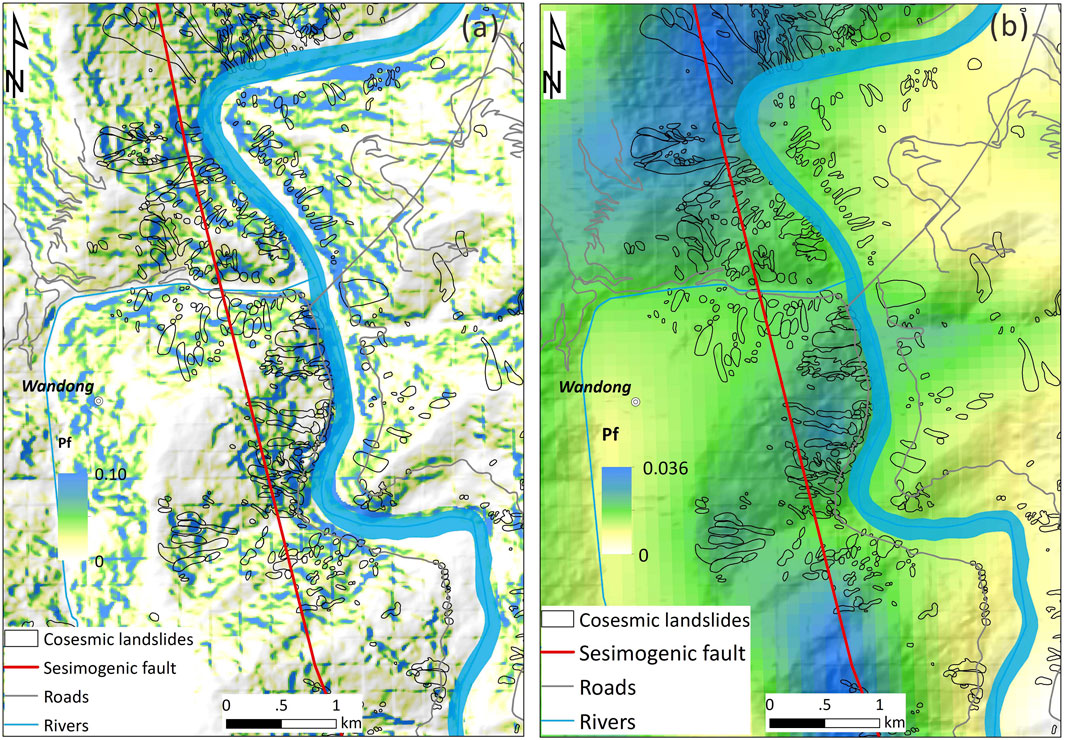
Figure 7. Locally enlarged area of estimated slope failure probability calculated by different prediction models; (A) Newmark model; (B) Xu2019 model.
To quantitatively analyze the prediction results of the two models, we divided the study area into grids measuring 1 km by 1 km, and then calculated the predicted landslide area and the actual area under each grid (Figure 8). We computed the actual landslide area for each grid, revealing that the majority of landslides are concentrated in areas with a seismic intensity of IX (Figure 8A). Particularly, most landslides occur along both sides of the Dadu River, with few coseismic landslides observed in regions with a seismic intensity of VIII. The total coseismic landslide area is 36.0 km2, with the largest landslide area within a single grid of 0.5 km2, located near Xingfu Village (Figure 8A). Figure 8B displays the predicted landslide area for each grid using the Newmark model. The results indicate that the maximum landslide area within a single grid is 0.045 km2, with the total predicted area by the Newmark model estimated at 8.57 km2. Notably, the predicted results in the northwest and southern areas of the epicenter are significantly overestimated. Figure 8C presents the predicted landslide area for each grid using the Xu2019 model. The predicted areas with high values are largely consistent with the distribution of landslide-prone areas. For example, the areas surrounding Detuo town, Wandong, and Xingfu village have highly developed landslides, and the prediction results indicate that these areas are also high-hazard areas. The total predicted landslide area of the Xu2019 model is 8.17 km2 and the maximum landslide area of a single grid is 0.047 km2.
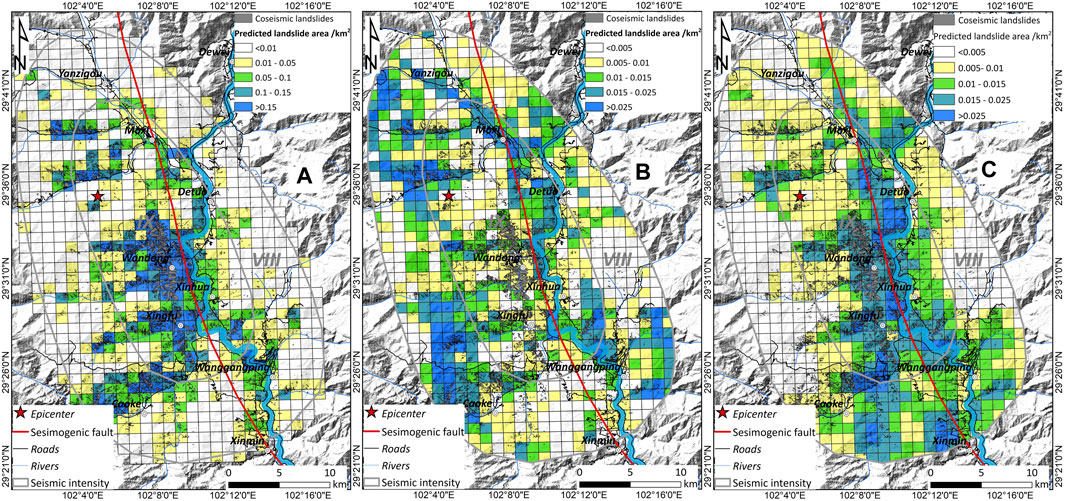
Figure 8. Map showing the distribution of predicted landslide area and actual landslide area (fishnet is 1 km * 1 km); (A) Actual landslide area; (B) Newmark model; (C) Xu2019 model.
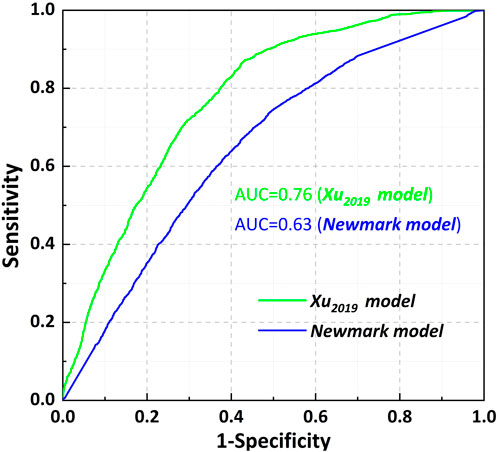
Additionally, the modeling accuracy is assessed using the ROC curve. The receiver operating characteristic (ROC) curve provides a comprehensive measure of continuous sensitivity and specificity variables (Swets, 1988). The evaluation criteria are as follows: AUC = 0.5 indicates a stochastic model; AUC between 0.5 and 0.7 suggests low accuracy; AUC between 0.7 and 0.9 indicates high accuracy; AUC > 0.9 indicates very high accuracy (Brenning, 2005). For this study, ∼12,600 landslides within seismic intensity VIII are utilized as landsliding positive samples. Non-sliding negative samples consist of ∼12,600 randomly selected points outside the buffer zone of landsliding samples (buffer radius = 100 m), resulting in a total of ∼25,200 sample points. Based on the SPSS software, the prediction accuracy of different models is calculated based on these sample points. The prediction results reveal that the Xu2019-based model demonstrates significantly higher accuracy than the Newmark model, with a prediction accuracy of 0.76, whereas the Newmark model exhibits relatively lower accuracy, at only 0.63 (Figure 9).
5 Discussion
Timing is critical during the post-earthquake emergency response phase. Swift emergency assessments can promptly identify high-risk areas of coseismic landslides, laying the groundwork for optimizing emergency deployment (Robinson et al., 2017; Ma et al., 2020). In recent years, few achievements have emerged in the construction of near-real-time assessment models based on the abundant earthquake-induced landslides data, but the application and accuracy of these models in actual quake events are rare. Allstadt et al. (2018) compared three globally near-real-time prediction models and calculated the predicted landslide area of the 2016 Kaikoura earthquake by constantly updating PGA distribution results published by the USGS at different times. The results indicate a significant overestimation of the actual landslide distribution, with the predicted landslide area being 6.5–55 times larger than the observed area. To address these issues, a new seismic landslide hazard model of Xu2019 model, was developed using the Bayesian probability method and the LR model, and subsequently applied to the Luding earthquake. The result shows that the Xu2019 model can more accurately predict the spatial location of coseismic landslides, with most high-susceptibility areas distributed on both sides of the seismogenic fault. However, there are still some deviations in local areas. For example, the model underestimates the occurrence of coseismic landslides in the northwest region, where coseismic landslides are most developed. Conversely, for the southwest region on the left side of the seismogenic fault, the predicted results are overestimated. We believe the possible reasons for this phenomenon are, firstly, the base data resolution of Xu2019 model is 100 m, which affects the model’s prediction accuracy to some extent, causing spatial prediction errors at local scales. Secondly, the nine earthquake cases selected for Xu2019 model are events that triggered landslides in China and neighboring areas since 1999, occurring in regions with varying topography and geological conditions. Only three of these cases are located in the Sichuan region, which may weaken the applicability of the Xu2019 model in the Luding earthquake, Sichuan province (Xu et al., 2019). Additionally, due to the relatively sparse seismic station records in the region, the interpolated PGA distribution might be lower than the actual situation, which is another potential reason for the underestimation of the predicted area. Otherwise, it is important to note that the total landslide area predicted by the Xu2019 model is lower than the landslide area triggered by the Luding earthquake. We believe that the main reason for this phenomenon is the unique high mountain and canyon terrain of the Luding region. Furthermore, the earthquake is located at the Y-shaped junction of three major active tectonic faults, and the rock and soil masses are relatively fractured, making this area prone to landsliding. Therefore, compared to earthquakes of similar magnitude, the Luding earthquake has a more pronounced ability to trigger landslides (Shao et al., 2024).
Emergency hazard assessment using the Newmark model involves multiple parameters, such as terrain, geotechnical mechanics, groundwater, and ground motion. However, there are numerous uncertainties associated with these parameters, both in their inherent nature and in the process of obtaining them (Wang et al., 2015; Bojadjieva et al., 2018). To achieve more precise predicted displacement, the Newmark method requires clear physical and mechanical properties of rocks, as well as accurate ground motion parameters (Dreyfus et al., 2013). Therefore, for the Newmark model, the set of input parameters may be the key point to affect the evaluation results, especially the assignment of rock mass parameters. The combination of different lithology is required in the process of engineering geological rock groups. Although this simplified treatment is easier to calculate, it may obliterate the spatial difference in rock mass strength distributions (Wang et al., 2015). Moreover, the rock mass in the source area of coseismic landslides predominantly consists of weathered jointed-cracked rock mass, exhibiting mechanical properties that deviate from typical rocks. Consequently, empirical or measured rock strength parameters may inadequately represent the strength characteristics of the in-situ rock mass. This discrepancy can lead to assignment results that diverge from the actual conditions during the stage of mechanical parameter assignment, ultimately resulting in significant disparities between the predicted and actual landslide distributions (Wang et al., 2015).
From the predicted results of the Newmark model, we can observe that the area with high instability probability has a certain degree of agreement with the actual landslide distribution. Most source areas of the coseismic landslides are located in the area on both sides of the Dadu River, of which this area is also a high hazard area. However, in the region with a seismic intensity of VIII, the prediction results based on the Newmark model are overestimated. According to the actual distribution of the coseismic landslides, there are few landslides in this area. However, this area is predicted to be a high-hazard area based on the Newmark model. We believe that this phenomenon is caused by an underestimation of the mechanical parameters of the rock during the combination of different lithology in engineering rock group groups. Furthermore, it should be noted that the PGA map used in this study is based on the interpolation of ground motion records by strong motion instruments within 100 km from the epicenter which are provided by the Sichuan earthquake administration. While the PGA result can roughly characterize the distribution of ground motion in this earthquake event, it does not account for the site effect of ground motion propagation, specifically ignoring local topography, slope structure, and the propagation direction of seismic waves. Therefore, As a result, we may be unable to obtain accurate seismic motion information and underestimate seismic amplitude in the middle and upper parts of the mountain which result in predicted landslide displacement being less than the actual situation (Wang et al., 2015; Li and Su, 2021).
Prompt and accurate identification and prediction of landslide risk areas following earthquakes can effectively guide the deployment of rescue personnel and allocation of resources, thereby minimizing casualties and property losses (Shao et al., 2023b). In comparing two models, the Xu2019 model demonstrates better capability in identifying high landslide hazard areas, aligning well with hazard levels and distribution characteristics of Luding-induced landslides. This can provide decision-makers with scientific guidance for deploying emergency rescue teams and assessing property and casualty impacts. In contrast, the Newmark model exhibits deviations between predicted and actual landslide distributions, potentially leading to misjudgments in coseismic landslide hazard assessment. Furthermore, both models underestimated the landslide area for the Luding earthquake and consequently underestimates its destructive impact and complicating rescue resource deployment, but the Xu2019 model effectively distinguishes between low and high landslide hazard areas that can offer valuable insights for emergency response and rapid risk assessment.
6 Conclusion
The aim of this study is to conduct a quantitative analysis of different assessment models in the rapid emergency evaluation of coseismic landslides triggered by the 2022 Ms 6.8 Luding earthquake. The data-driven Xu2019 model and the physically-based Newmark model are selected for this purpose. Using the coseismic landslide inventory of this event, the applicability and accuracy of these two models are discussed. The findings reveal that the Newmark model predicts high probability areas that somewhat align with the actual landslide distribution, primarily concentrated on both sides of the Dadu River where failure probability is high. However, the Newmark model tends to overestimate landslide occurrence in regions with a seismic intensity of VIII. Conversely, the LR model closely matches the actual landslide distribution, indicating high prediction accuracy. To assess model accuracy, the ROC curve is employed. Results indicate that the Xu2019 model outperforms the Newmark model, achieving a prediction accuracy of 0.76 compared to 0.63 for the Newmark model. Both models demonstrate good timeliness in rapid hazard assessment of earthquake-induced landslides. However, while the Newmark model theoretically considers the occurrence mechanism of seismic landslides and has broader applicability, it requires multiple input parameters, leading to increased uncertainty and subjective factors in practical application.
Overall, compared to the Newmark model, the Xu2019 model has a higher predictive capability. However, since the Xu2019 model is primarily trained on the earthquake-induced landslide database from the Sichuan-Yunnan region, its applicability to other regions still needs further validation. Therefore, establishing a high-precision geospatial database of basic geomechanical parameters is crucial to improving the accuracy of the Newmark model in emergency evaluation. For the Xu2019 model, continual enrichment of earthquake-induced landslide inventories in mainland China can lead to the development of a near-real-time model tailored to the area, enhancing forecast accuracy in emergency assessments of coseismic landslides.
Data availability statement
The raw data supporting the conclusions of this article will be made available by the authors, without undue reservation.
Author contributions
YL: Writing–original draft. SM: Conceptualization, Data curation, Supervision, Validation, Visualization, Writing–review and editing. CX: Data curation, Writing–review and editing.
Funding
The author(s) declare that financial support was received for the research, authorship, and/or publication of this article. This research was supported by the National Natural Science Foundation of China (Grant No. 42207532).
Acknowledgments
We are grateful to thank the strong earthquake-induced geological disasters research team led by Professor Xuanmei Fan of Chengdu University of Technology for sharing the PGA map of the 2022 Ms6.8 Luding earthquake. In addition, we also thank team of Professor Chong Xu for sharing the cosiesimic landslide inventory of this earthquake event at the first time. We appreciate the constructive feedback provided by the two reviewers, which has been helpful in improving the quality of our manuscript.
Conflict of interest
The authors declare that the research was conducted in the absence of any commercial or financial relationships that could be construed as a potential conflict of interest.
Publisher’s note
All claims expressed in this article are solely those of the authors and do not necessarily represent those of their affiliated organizations, or those of the publisher, the editors and the reviewers. Any product that may be evaluated in this article, or claim that may be made by its manufacturer, is not guaranteed or endorsed by the publisher.
References
Allstadt, K. E., Jibson, R. W., Thompson, E. M., Massey, C. I., Wald, D. J., Godt, J. W., et al. (2018). Improving near-real-time coseismic landslide models: lessons learned from the 2016 Kaikōura, New Zealand, Earthquake. Bull. Seismol. Soc. Am. 108, 1649–1664. doi:10.1785/0120170297
Bai, M., Chevalier, M. L., Pan, J., Replumaz, A., Leloup, P. H., Métois, M., et al. (2018). Southeastward increase of the late Quaternary slip-rate of the Xianshuihe fault, eastern Tibet. Geodynamic and seismic hazard implications. Earth Planet. Sci. Lett. 485, 19–31. doi:10.1016/j.epsl.2017.12.045
Bojadjieva, J., Sheshov, V., and Christophe, B. (2018). Hazard and risk assessment of earthquake-induced landslides—case study. Landslides 15, 161–171. doi:10.1007/s10346-017-0905-9
Brenning, A. (2005). Spatial prediction models for landslide hazards: review, comparison and evaluation. Nat. Hazards and Earth Syst. Sci. 5, 853–862. doi:10.5194/nhess-5-853-2005
Chen, X., Liu, C., and Wang, M. (2018). A method for quick assessment of earthquake-triggered landslide hazards: a case study of the Mw6.1 2014 Ludian, China earthquake. Bull. Eng. Geol. Environ. 78, 2449–2458. doi:10.1007/s10064-018-1313-7
Chen, X. L., Liu, C. G., Yu, L., and Lin, C. X. (2014). Critical acceleration as a criterion in seismic landslide susceptibility assessment. Geomorphology 217, 15–22. doi:10.1016/j.geomorph.2014.04.011
Dai, L., Fan, X., Wang, X., Fang, C., Zou, C., Tang, X., et al. (2023). Coseismic landslides triggered by the 2022 Luding Ms6.8 earthquake, China. Landslides 20, 1277–1292. doi:10.1007/s10346-023-02061-3
Dreyfus, D. K., Rathje, E. M., and Jibson, R. W. (2013). The influence of different simplified sliding-block models and input parameters on regional predictions of seismic landslides triggered by the Northridge earthquake. Eng. Geol. 163, 41–54. doi:10.1016/j.enggeo.2013.05.015
Du, G., Zhang, Y., Zou, L., Yang, Z., Yuan, Y., and Ren, S. (2022). Co-seismic landslide hazard assessment of the 2017 Ms 6.9 Milin earthquake, Tibet, China, combining the logistic regression–information value and Newmark displacement models. Bull. Eng. Geol. Environ. 81, 446. doi:10.1007/s10064-022-02901-x
Fan, X., Scaringi, G., Korup, O., West, A. J., van Westen, C. J., Tanyas, H., et al. (2019). Earthquake-induced chains of geologic hazards: patterns, mechanisms, and impacts. Rev. Geophys. 57, 421–503. doi:10.1029/2018rg000626
Fan, X., Wang, X., Dai, L., Fang, C., Deng, Y., Zou, C., et al. (2022). Characteristics and spatial distribution pattern of Ms 6.8 Luding earthquake occurred on September 5, 2022. J. Eng. Geol. (In Chinese).
Gallen, S. F., Clark, M. K., Godt, J. W., Roback, K., and Niemi, N. A. (2017). Application and evaluation of a rapid response earthquake-triggered landslide model to the 25 April 2015 Mw 7.8 Gorkha earthquake, Nepal. Tectonophysics 714-715, 173–187. doi:10.1016/j.tecto.2016.10.031
Godt, J. W., Sener, B. ., Verdin, K. L., and Wald, D. J. (2008). “Rapid assessment of earthquake-induced landsliding,” in Proceedings of the first world landslide forum, Tokyo, Japan, November 18–21.
Gorum, T., van Westen, C. J., Korup, O., van der Meijde, M., Fan, X., and van der Meer, F. D. (2013). Complex rupture mechanism and topography control symmetry of mass-wasting pattern, 2010 Haiti earthquake. Geomorphology 184, 127–138. doi:10.1016/j.geomorph.2012.11.027
Havenith, H. B., Guerrier, K., Schlögel, R., Braun, A., Ulysse, S., Mreyen, A. S., et al. (2022). Earthquake-induced landslides in Haiti: analysis of seismotectonic and possible climatic influences. Nat. Hazards Earth Syst. Sci. 22, 3361–3384. doi:10.5194/nhess-22-3361-2022
He, K., Lombardo, L., Chang, L., Sadhasivam, N., Hu, X., Fang, Z., et al. (2024). Investigating earthquake legacy effect on hillslope deformation using InSAR-derived time series. Earth Surf. Process. Landforms 49, 980–990. doi:10.1002/esp.5746
He, K., Tanyas, H., Chang, L., Hu, X., Luo, G., and Lombardo, L. (2023). Modelling InSAR-derived hillslope velocities with multivariate statistics: a first attempt to generate interpretable predictions. Remote Sens. Environ. 289, 113518. doi:10.1016/j.rse.2023.113518
He, Q., Wang, M., and Liu, K. (2021). Rapidly assessing earthquake-induced landslide susceptibility on a global scale using random forest. Geomorphology 391, 107889. doi:10.1016/j.geomorph.2021.107889
Huang, D., Wang, G., Du, C., Jin, F., Feng, K., and Chen, Z. (2020). An integrated SEM-Newmark model for physics-based regional coseismic landslide assessment. Soil Dyn. Earthq. Eng. 132, 106066. doi:10.1016/j.soildyn.2020.106066
Huang, Y., Xu, C., Zhang, X., and Li, L. (2022). Bibliometric analysis of landslide research based on the WOS database. Nat. Hazards Res. 2, 49–61. doi:10.1016/j.nhres.2022.02.001
Jibson, R. W. (2007). Regression models for estimating coseismic landslide displacement. Eng. Geol. 91, 209–218. doi:10.1016/j.enggeo.2007.01.013
Jibson, R. W. (2011). Methods for assessing the stability of slopes during earthquakes—a retrospective. Eng. Geol. 122, 43–50. doi:10.1016/j.enggeo.2010.09.017
Jibson, R. W., Harp, E. L., and Michael, J. A. (2000). A method for producing digital probabilistic seismic landslide hazard maps: an example from the Los Angeles, California, area. Eng. Geol. 58, 271–289. doi:10.1016/s0013-7952(00)00039-9
Jin, J., Wang, Y., Gao, D., Yuan, R. M., and Yang, X. Y. (2018). New evaluation models of Newmark displacement for southwest China. Bull. Seismol. Soc. Am. 108, 2221–2236. doi:10.1785/0120170349
Jin, K. P., Yao, L. K., Cheng, Q. G., and Xing, A. G. (2019). Seismic landslides hazard zoning based on the modified Newmark model: a case study from the Lushan earthquake, China. Nat. Hazards 99, 493–509. doi:10.1007/s11069-019-03754-6
Keefer, D. K. (1984). Landslides caused by earthquakes. Geol. Soc. Am. Bull. 95, 406–421. doi:10.1130/0016-7606(1984)95<406:lcbe>2.0.co;2
Kritikos, T., Robinson, T. R., and Davies, T. R. H. (2015). Regional coseismic landslide hazard assessment without historical landslide inventories: a new approach. J. Geophys. Res. Earth Surf. 120, 711–729. doi:10.1002/2014jf003224
Li, C., and Su, L. (2021). Influence of critical acceleration model on assessments of potential earthquake–induced landslide hazards in Shimian County, Sichuan Province, China. Landslides 18, 1659–1674. doi:10.1007/s10346-020-01578-1
Li, W., Chen, J., Lu, H., Shan, Y., Li, Z., Chen, B., et al. (2022). Emergency analysis of the impact of the luding Ms 6.8 earthquake on Hailuogou Glacier. Geomatics Inf. Sci. Wuhan Univ. (In Chinese).
Liu, J., Shi, J., Wang, T., and Wu, S. (2018). Seismic landslide hazard assessment in the Tianshui area, China, based on scenario earthquakes. Bull. Eng. Geol. Environ. 77, 1263–1272. doi:10.1007/s10064-016-0998-8
Ma, S., and Xu, C. (2019a). Applicability of two Newmark models in the assessment of coseismic landslide hazard and estimation of slope-failure probability: an example of the 2008 wenchuan Mw 7.9 earthquake affected area. J. Earth Sci. 30, 1020–1030. doi:10.1007/s12583-019-0874-0
Ma, S., Xu, C., and Shao, X. (2020). Spatial prediction strategy for landslides triggered by large earthquakes oriented to emergency response, mid-term resettlement and later reconstruction. Int. J. Disaster Risk Reduct. 43, 101362. doi:10.1016/j.ijdrr.2019.101362
Ma, S. Y., and Xu, C. (2019b). Assessment of co-seismic landslide hazard using the Newmark model and statistical analyses: a case study of the 2013 Lushan, China, Mw6.6 earthquake. Nat. Hazards 96, 389–412. doi:10.1007/s11069-018-3548-9
Ministry of Water Resources of the People's Republic of China (2014). Standrad for engineering classification of rock masses GB/T 50218-2014. Beijing: Standards Press of China.
Newmark, N. M. (1965). Effects of earthquakes on dams and embankments. Géotechnique 15, 139–160. doi:10.1680/geot.1965.15.2.139
Nowicki, M. A., Wald, D. J., Hamburger, M. W., Hearne, M., and Thompson, E. M. (2014). Development of a globally applicable model for near real-time prediction of seismically induced landslides. Eng. Geol. 173, 54–65. doi:10.1016/j.enggeo.2014.02.002
Nowicki Jessee, M. A., Hamburger, M. W., Allstadt, K., Wald, D. J., Robeson, S. M., Tanyas, H., et al. (2019). A global empirical model for near-real-time assessment of seismically induced landslides. J. Geophys. Res. Earth Surf. 123, 1835–1859. doi:10.1029/2017jf004494
Robinson, T. R., Rosser, N. J., Densmore, A. L., Williams, J. G., Kincey, M. E., Benjamin, J., et al. (2017). Rapid post-earthquake modelling of coseismic landslide intensity and distribution for emergency response decision support. Nat. Hazards Earth Syst. Sci. 17, 1521–1540. doi:10.5194/nhess-17-1521-2017
Shao, X., Ma, S., and Xu, C. (2023a). Distribution and characteristics of shallow landslides triggered by the 2018 Mw 7.5 Palu earthquake, Indonesia. Landslides 20, 157–175. doi:10.1007/s10346-022-01972-x
Shao, X., Ma, S., and Xu, C. (2023b). Hazard assessment modeling and software development of earthquake-triggered landslides in the Sichuan–Yunnan area, China. Geosci. Model Dev. 16, 5113–5129. doi:10.5194/gmd-16-5113-2023
Shao, X., Ma, S., Xu, C., Xie, C., Li, T., Huang, Y., et al. (2024). Landslides triggered by the 2022 Ms. 6.8 Luding strike-slip earthquake: an update. Eng. Geol. 335, 107536. doi:10.1016/j.enggeo.2024.107536
Shao, X., Ma, S., Xu, C., Zhang, P., Wen, B., Tian, Y., et al. (2019). Planet image-based inventorying and machine learning-based susceptibility mapping for the landslides triggered by the 2018 Mw6.6 Tomakomai, Japan Earthquake. Remote Sens. 11, 978. doi:10.3390/rs11080978
Shao, X., Ma, S., Xu, C., and Zhou, Q. (2020). Effects of sampling intensity and non-slide/slide sample ratio on the occurrence probability of coseismic landslides. Geomorphology 363, 107222. doi:10.1016/j.geomorph.2020.107222
Shao, X., and Xu, C. (2022). Earthquake-induced landslides susceptibility assessment: a review of the state-of-the-art. Natural Hazards Research 2, 172–182.
Swets, J. A. (1988). Measuring the accuracy of diagnostic systems. Science 240, 1285–1293. doi:10.1126/science.3287615
Tanyas, H., Rossi, M., Alvioli, M., van Westen, C. J., and Marchesini, I. (2019a). A global slope unit-based method for the near real-time prediction of earthquake-induced landslides. Geomorphology 327, 126–146. doi:10.1016/j.geomorph.2018.10.022
Tanyas, H., Westen, C. J., Persello, C., and Alvioli, M. (2019b). Rapid prediction of the magnitude scale of landslide events triggered by an earthquake. Landslides 16, 676.
Tapponnier, P., Zhiqin, X., Roger, F., Meyer, B., Arnaud, N., Wittlinger, G., et al. (2001). Oblique stepwise rise and growth of the Tibet plateau. Science 294, 1671–1677. doi:10.1126/science.105978
Wang, L., Xiao, T., Liu, S., Zhang, W., Yang, B., and Chen, L. (2023). Quantification of model uncertainty and variability for landslide displacement prediction based on Monte Carlo simulation. Gondwana Res. 123, 27–40. doi:10.1016/j.gr.2023.03.006
Wang, T., Liu, J., Li, Z., Xin, P., Shi, J., and Wu, S. (2021). Seismic landslide hazard assessment of China and its impact on national territory spatial planning. Geol. China 48, 21–39.
Wang, T., Wu, S., Shi, J., and Xin, P. (2015). Concepts and mechanical assessment method for seismic landslide hazard: a review. J. Eng. Geol. 23, 93–104.
Wang, T., Wu, S. R., Shi, J. S., Xin, P., and Wu, L. Z. (2018). Assessment of the effects of historical strong earthquakes on large-scale landslide groupings in the Wei River midstream. Eng. Geol. 235, 11–19. doi:10.1016/j.enggeo.2018.01.020
Wei, Y., and Chen, X. (2022). Applicability of different seismic landslide risk assessment methods: a case study of Maduo Ms 7.4 earthquake. Sesimology Geol. 44, 590–603.
Wilson, R. C., and Keefer, D. K. (1983). Dynamic analysis of a slope failure from the 6 August 1979 Coyote lake, California, earthquake. Bull. Deismological Soc. Am. 73, 863–877. doi:10.1785/bssa0730030863
Xu, C., Xu, X., Tian, Y., Shen, L., Yao, Q., Huang, X., et al. (2016). Two comparable earthquakes produced greatly different coseismic landslides:The 2015 Gorkha,Nepal and 2008 Wenchuan,China events. J. Earth Sci. 27, 1008–1015. doi:10.1007/s12583-016-0684-6
Xu, C., Xu, X., Zhou, B., and Shen, L. (2019). Probability of coseismic landslides: a new generation of earthquake-triggered landslide hazard model. J. Eng. Geol. 27, 1122.
Yang, Z., Pang, B., Dong, W., and Li, D. (2023). Spatial pattern and intensity mapping of coseismic landslides triggered by the 2022 luding earthquake in China. Remote Sens. 15, 1323. doi:10.3390/rs15051323
Yue, X., Wu, S., Yin, Y., Gao, J., and Zheng, J. (2018). Risk identification of seismic landslides by joint Newmark and RockFall analyst models: a case study of roads affected by the Jiuzhaigou earthquake. Int. J. Disaster Risk Sci. 9, 392–406. doi:10.1007/s13753-018-0182-9
Zhang, Y.-s., Yang, Z.-h., Guo, C.-b., Wang, T., Wang, D.-h., and Du, G.-l. (2017). Predicting landslide scenes under potential earthquake scenarios in the Xianshuihe fault zone, Southwest China. J. Mt. Sci. 14, 1262–1278. doi:10.1007/s11629-017-4363-6
Keywords: 2022 Ms6.8 luding earthquake, coseismic landslide, emergency assessment, newmark model, logistic regression (LR) model
Citation: Lu Y, Ma S and Xia C (2024) Application of different earthquake-induced landslide hazard assessment models on the 2022 Ms 6.8 luding earthquake. Front. Earth Sci. 12:1429421. doi: 10.3389/feart.2024.1429421
Received: 08 May 2024; Accepted: 07 August 2024;
Published: 20 August 2024.
Edited by:
Wentao Yang, University of Leeds, United KingdomReviewed by:
Maria Francesca Ferrario, University of Insubria, ItalyKun He, Southwest Jiaotong University, China
Copyright © 2024 Lu, Ma and Xia. This is an open-access article distributed under the terms of the Creative Commons Attribution License (CC BY). The use, distribution or reproduction in other forums is permitted, provided the original author(s) and the copyright owner(s) are credited and that the original publication in this journal is cited, in accordance with accepted academic practice. No use, distribution or reproduction is permitted which does not comply with these terms.
*Correspondence: Siyuan Ma, bWFzaXl1YW5AaWVzLmFjLmNu
 Yao Lu
 Siyuan Ma
 Chaoxu Xia