- 1Department of Civil and Environmental Engineering, Ehime University, Matsuyama, Japan
- 2Center for Marine Environmental Studies, Ehime University, Matsuyama, Japan
- 3Business Planning and Development Division, Yachiyo Engineering Co., Ltd., Tokyo, Japan
Quantifying the transport of floating macroplastic debris (FMPD) in waterways is essential for understanding the plastic emission from land. However, no robust tool has been developed to monitor FMPD. Here, to detect FMPD on river surfaces, we developed five instance segmentation models based on state-of-the-art You Only Look Once (YOLOv8) architecture using 7,356 training images collected via fixed-camera monitoring of seven rivers. Our models could detect FMPD using object detection and image segmentation approaches with accuracies similar to those of the pretrained YOLOv8 model. Our model performances were tested using 3,802 images generated from 107 frames obtained by a novel camera system embedded in an ultrasonic water level gauge (WLGCAM) installed in three rivers. Interestingly, the model with intermediate weight parameters most accurately detected FMPD, whereas the model with the most parameters exhibited poor performance due to overfitting. Additionally, we assessed the dependence of the detection performance on the ground sampling distance (GSD) and found that a smaller GSD for image segmentation approach and larger GSD for object detection approach are capable of accurately detecting FMPD. Based on the results from our study, more appropriate category selections need to be determined to improve the model performance and reduce the number of false positives. Our study can aid in the development of guidelines for monitoring FMPD and the establishment of an algorithm for quantifying the transport of FMPD.
1 Introduction
Quantifying floating macroplastic debris (FMPD) on the surface of rivers is extremely important for assessing the plastic emission from land to sea and for validating existing estimates of global plastic emissions (Al-Zawaidah et al., 2021). However, to date, efforts to accurately quantify plastic emissions from land have faced challenges because FMPD in rivers is only sporadically monitored (van Emmerik et al., 2019a; van Emmerik et al., 2019b; González-Fernández et al., 2023; van Emmerik et al., 2023). For example, van Emmerik et al. (2019b) quantified the FMPD from bridges in the Seine River through visual observation and reported significant spatiotemporal variation in FMPD transport with increasing river discharge. These visual observations could enable the robust quantification of FMPD transport and clarify the temporal dynamics of FMPD, even in tidal reaches (van Emmerik et al., 2018) and during floods (van Emmerik et al., 2023); however, obtaining long-term data has been more difficult because of the large amount of labor involved and the high cost of continual surveying. In addition, observer bias, which depends on observer skill and level of experience, increases the uncertainty of the data (Hurley et al., 2023).
To address the challenges in FMPD monitoring, several techniques for quantifying FMPD transport via fixed cameras have been established (Kataoka and Nihei, 2020; van Lieshout et al., 2020). Kataoka and Nihei (2020) established a novel algorithm for evaluating the transport of floating debris on river surfaces by combining image analysis and a template matching technique; here, image analysis was used to detect the debris and convert the RGB color information in images to CIELUV color information, and the template matching was used to evaluate the transport between the frames of river surface videos. These authors suggested that the mass flux of floating riverine debris could be evaluated through image analysis by multiplying the average weight per unit pixel by the area of floating riverine debris. However, these methods do not enable the detection of FMPD from the RGB images. van Lieshout et al. (2020) attempted to develop an automated method for monitoring FMPD via deep learning. They demonstrated that the automated monitoring method incorporating the deep learning approach could reliably quantify FMPD, which was reasonable with manual methods. Several studies have subsequently incorporated deep learning for detecting FMPD on river surfaces and riverbanks (Lin et al., 2021; Jia et al., 2023b).
Although deep learning models for detecting FMPD on river surfaces have been developed, their applicability has been limited and insufficiently discussed. For example, one of the methodologies for monitoring the FMPD is to use a camera fixed to a bridge to view the river surface vertically downward (Kataoka and Nihei, 2020; van Lieshout et al., 2020). When monitoring the FMPD during floods, the resolution of the recorded video varied according to the water level change. This could impose a limitation in detecting FMPD from the recorded video. Morevoer, Redmon and Farhadi (2018) compared the detection accuracies according to the object size for the evaluation of the performance of You Only Look Once version 3 (YOLOv3) using the Common Objects in Context (COCO) image dataset; they reported a significant difference in accuracy for detecting small objects (< 322 pixels) and large objects (> 962 pixels), and the former was significantly lower than the latter. Their results indicated that the detection accuracy of the FMPD varied with water level; this insight is essential for developing a technique for quantifying FMPD transport. Furthermore, an object detection (OD) approach has often been applied to quantify the FMPD on river surfaces. This can count FMPD individually with a bounding box (van Lieshout et al., 2020); however, the FMPD is equivalently quantified even if its size and shape are different, which causes uncertainty in the evaluation of FMPD mass transport (Jia et al., 2023a). Thus, an image segmentation (IS) approach can be used to quantify those features of FMPD and is essential for reducing the uncertainty in the evaluation of the FMPD mass transport. For this reason, segmentation is a useful approach for quantifying the FMPD mass transport because FMPD can be detected via both object detection and image segmentation approaches. However, the instance segmentation approach has not yet been incorporated into the detection of FMPD on river surfaces.
Here, we develop five instance segmentation models for detecting FMPD on rivers by training a cutting-edge deep learning architecture called YOLO (i.e., YOLOv8), which is commonly used in many studies (e.g., Ahmed et al., 2023; Fan et al., 2024). We then compare these five models. In addition, we examine the dependence of the detection accuracy on the changes in the water level and category selection and then discuss a technical issue for quantifying FMPD transport using river surface images. In addition to providing a new technique for monitoring FMPD transport using fixed cameras, our results can contribute to the development of guidelines for monitoring FMPD transport and for synchronizing FMPD monitoring practices internationally.
2 Materials and methods
YOLOv8 segment models were adopted for detecting FMPD on river surfaces. There are five YOLOv8 segmentation models that differ in terms of accuracy and inference speed. To develop the models, we collected many images from seven rivers in Japan. Next, the images were segmented into seven categories via open-source software. The five YOLOv8 segment models were trained on these training data.
2.1 Collection of vertically shot videos of the river surface
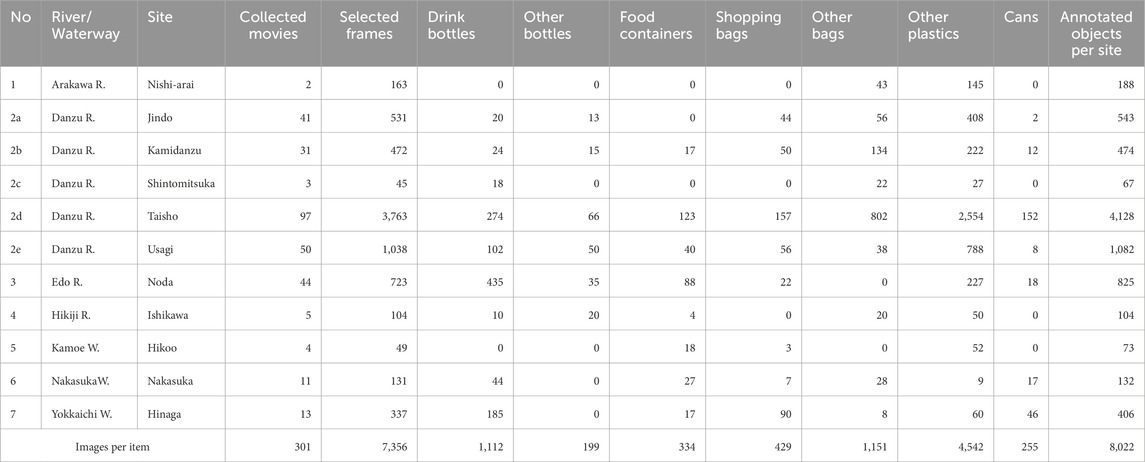
To prepare training image data, we collected videos of river/waterway surfaces viewed perpendicularly downward from bridges at 11 sites on the seven rivers (Table 1). An overview of the camera specifications is provided in Supplementary Table S1. The video cameras were fixed on a bridge rail, with the exception of the Edo and Hikiji Rivers sites; at these sites, the cameras were held by hand. The cameras were installed to monitor floating plastic debris for long-term monitoring (longer than 1 month) at 8 sites, and videos at the Edo River were temporally collected during a flood event. Then, 301 videos in which plastic objects were visible were visually extracted (Table 1).
2.2 Image segmentation training dataset
The training data for detecting FMPD were created using the 301 videos (Table 1) compiled in the efficient interactive segmentation tool [EISeg: Hao et al. (2022)]. EISeg is an efficient and intelligent interactive segmentation annotation software built around interactive segmentation algorithms enabled by Baidu’s PaddlePaddle deep learning framework (Hao et al., 2022). EISeg can accurately and efficiently generate segmentation masks.
First, each of the 301 collected videos was divided into numerous frames (i.e., original images), and then, 7,356 frames with target objects were selected (Table 1). The target objects found from all frames were categorized into seven debris types that are common in the seven rivers; these included drink bottles, other bottles, food containers, shopping bags, other bags, other plastics, and aluminum/steel cans. “Drink bottles” are widely discarded waste objects and are a typical item in aquatic environments (Opfer et al., 2012; JRC, 2013). “Other bottles” refers to plastic bottles other than drink bottles, such as cleaner or cosmetics bottles. “Food containers” include lunch boxes and fast-food containers. “Shopping bags” are also typical disposal waste in aquatic environments. “Other bags” refer to plastic bags other than shopping bags and include food packages and snack bags. In addition to these categories, “other plastics” refer to other types of plastic waste. Finally, “aluminum/steel cans” are single-use containers/bottles for packaging made primarily of aluminum or steel. Although they are not a type of plastic waste, aluminum/steel cans were included in training as target objects to avoid misidentification because their shapes are similar to those of “drink bottles.” The target objects in all images were segmented with EISeg to create training data, and then all the annotation data were exported in Microsoft COCO format (Lin et al., 2014).
Preprocessing was used to improve the performance and efficiency of the model (Krizhevsky et al., 2017); here, the size of each training image was unified by cropping the original frame to several tile images with 1,024 px ×1,024 px in which target objects were randomly located. Note that the number of tile images generated from each frame depended on the location of the target objects. Furthermore, to improve the robustness of the models (Krizhevsky et al., 2017), the training data were augmented by applying several techniques to the created data: flip (horizontal or vertical), 90° rotation (clockwise, counterclockwise, upside down), cropping (up to 20% zoom), rotation (±15°), shear (±10° horizontal, ±10° vertical), grayscale (±15% of images), hue (±20°), saturation (±25%), brightness (±15%), exposure (±10%), blur (up to 2%), and noise (up to 0.3% of pixels). These techniques were randomly applied, and 27,214 augmented images were generated. A total of 25,743 and 1,471 images were used for training and validation, respectively.
2.3 Training the YOLOv8 models
Using this training dataset, we developed a detection model for these target objects on river surfaces via YOLOv8, which was developed by Ultralytics (https://github.com/ultralytics/ultralytics). YOLOv8 is a state-of-the-art (SOTA) architecture that has improved performance, accuracy, and flexibility. The YOLO architecture consists of three essential blocks (i.e., backbone, neck, and head). The backbone is responsible for extracting the meaningful features from the input image. The neck is a bridge between the backbone and the head and aggregates and refines the features extracted by the backbone; it often focuses on enhancing the spatial and semantic information across the different scales. The neck includes additional convolutional layers and C2f modules (the cross-stage partial bottleneck with two convolutions). These C2f modules are connected to two heads (Terven et al., 2023). The head is the final part of the network and is responsible for generating the output. To improve detection accuracy, CSPDarknet53, a modified version of DarkNet-53, was utilized as the YOLOv8 backbone and was followed by the C2f module (Terven et al., 2023). In addition, YOLOv8 uses anchor-free detection with a decoupled head to independently process objectness, classification, and regression tasks, which speeds up non-maximum suppression (Hosang et al., 2017). Furthermore, YOLOv8 can be applied to a wide range of instance segmentation, tracking, and pose estimation, as well as object detection, which builds upon the success of previous YOLO versions.
In the present study, the semantic segmentation extension of YOLOv8 was retrained to detect and categorize the seven debris types without transfer learning using the 25,743 training images from the training platform shown in Supplementary Table S2. The C2f module is followed by two segmentation heads, which learn to predict the semantic segmentation masks for the input image. There are five YOLOv8 segment architectures with different scales [e.g., network size, the number of blocks, parameters and layers; see Terven et al. (2023)]: YOLOv8n (nano), YOLOv8s (small), YOLOv8m (medium), YOLOv8l (large), and YOLOv8x (extralarge). YOLOv8n has the fastest speed, fewest parameters, and lowest accuracy, whereas YOLOv8x has the slowest speed, largest quantity of parameters, and highest accuracy (https://github.com/ultralytics/ultralytics). The applicability of these architectures was investigated. Each architecture was trained using 100 epochs.
2.4 Data collection for validating the accuracy of target object detection
The dependence of the accuracy of FMPD detection on changes in the water level was evaluated using video data collected from a custom camera system with an ultrasonic water level gauge (WLGCAM; Clealink Technology Co., Ltd., Japan; Supplementary Table S3) installed in three rivers/waterways (i.e., the Nakasuka Waterway, Shigenobu River, and Ishite River) (Supplementary Figure S1). The sequential monitoring of the river surface began at the Nakasuka Pump Station on 20 June 2023, and monitoring of the other two rivers began on 13 July 2023. The aim of the WLGCAM installation was to determine the flow of FMPD in the catchment area of the Shigenobu River and the drainage area of the Nakasuka Pump Station. The Ishite River is the largest tributary of the Shigenobu River. The WLGCAMs were installed in front of and behind the confluence. Several studies have indicated that FMPD transport dramatically fluctuates under flood conditions (Kataoka and Nihei, 2020; van Emmerik et al., 2023). To grasp the significant fluctuations, monitoring FMPD transport with high temporal resolution is needed; however, recording river surface videos at short-term intervals is unrealistic because a large amount of data must be stored. To resolve this tradeoff, the WLGCAM was used to collect image data under flood conditions.
The WLGCAM could be automatically operated according to river conditions by supplying electrical power via a built-in solar system. Its specifications are listed in Supplementary Table S3. The WLGCAM was controlled by a Rasberry-Pi-based control device that was connected to a solar system, an IP camera, and an ultrasonic water level gauge (WLG). The water level was always measured at 10-min intervals by the WLG. The measured water level data were used as a trigger to switch recording modes from normal to flood modes and vice versa. Under normal conditions (the “normal mode”), the IP camera recorded river surface videos with 4 K (3,840 px × 2,160 px) at 60 min intervals. When the water level exceeded a certain threshold value, which was 50 cm higher than that under normal conditions, the recording mode was switched to “flood mode” by the control device. After switching to flood mode, the river surface video was recorded at 10-min intervals. Regardless of the river state, the recording duration was one minute, which was determined by considering the limitation of the communication volume (50 GB per month). All water level and river surface video data were transmitted to Google Drive, which was remotely available anytime and anywhere.
From 61 video data during flood mode, 107 frames in which target objects existed on the river surface were selected (Table 2) and then annotated with EISeg (see Section 2.2). Numerous FMPDs flow down the water surface of each river during floods, while FMPDs are rarely found in frames under normal conditions. In addition, the Shigenobu and Ishite Rivers were dried under normal conditions. Thus, we evaluated the model performance just by using the frames in flood mode without the data in normal mode.

Table 2. Test data for evaluating the model performance recorded by the WLGCAM at the three rivers/waterways.
Furthermore, the test data were expanded by magnifying the frames by four ratios (i.e., ×0.5, ×1.0, ×1.5 and ×2.0) to determine the dependence of model performance on the water level changes. The viewing distances from the WLG sensor to the river surface under normal conditions at the Nakasuka Waterway, Shigenobu River and Ishite River were 3.850 m, 8.760 m, and 7.560 m, respectively. At the water level, the ground sampling distances (GSDs) of the Nakasuka Waterway, Shigenobu River and Ishite River were 0.88, 3.72, and 3.22 mm/px, respectively. The GSD linearly decreased with decreasing viewing distance between the WLG sensor and the water surface (i.e., increasing water level) (Supplementary Figure S2). By substituting the viewing distance when the 61 videos were recorded to these fitting lines, we identified the GSD at each recording time. Since the variety of the GSDs was limited, we expanded 107 frames by magnifying them by ×0.5 (i.e., 1920 px × 1,080 px of image size), ×1.5 (i.e., 5,760 px × 3,240 px) and ×2.0 (i.e., 7,680 px × 4,320 px), as well as the original image size (i.e., ×1.0 (3,840 px × 2,160 px)). The magnified image was equally divided into 1,024 px × 1,024 px tile images; this process generated one, six, fifteen, and twenty-eight tile images from the ×0.5, ×1.0, ×1.5 and ×2.0 magnified images, respectively. Note that only ×0.5 and ×1.0 images of the Nakasuka waterway were used because the viewing distance was approximately half that of the distance at the other sites (Supplementary Figure S2). Ultimately, 3,802 tile images were augmented for test tasks, and then, 808 target objects were annotated by EISeg (Table 2). The 808 annotated objects corresponding to 10% of the training dataset (i.e., 8,022 objects; Table 1) were used to validate the model performance and evaluate the dependence of the accuracy on the water level change.
2.5 Evaluation metrics for the model performance
The performance in detecting and classifying the target objects was examined using the 107 annotated images. The average precision (AP) was used to evaluate the model performance and is defined as follows (Redmon and Farhadi, 2018):
where
For evaluating the detection performance of plastic debris, true-positive (TP) indicates that the actual and predicted categories of an object are plastic, false-positive (FP) indicates that a non-plastic object is unexpectedly predicted to be positive, and false-negative (FN) means that a plastic object is predicted to be negative (Equations 2, 3). Moreover, when evaluating the classification performance of the target objects, TP means that the target category is consistent with the predicted category, FN means that the former is predicted as another category or is not detected, and FP means that the nontarget category is misclassified into the target category (Jia et al., 2024). To evaluate the precision and recall (Equations 2, 3), the intersection over union (IoU), which is the overlap of the predicted bounding box (segmentation pixels), is measured as follows.
The IoU indicates how much the predicted area of each category overlaps with the ground truth (Equation 4).
On the basis of the COCO competition, AP50-95 is the average over 10 IoU levels, which range from 0.5 to 0.95 with a step size of 0.05 (Redmon and Farhadi, 2018). We used the AP50-95 as a representative metric to evaluate the performance. In addition, five additional metrics (AP50, AP75, APS, APM, and APL) were also calculated for performance evaluation. AP50 (AP75) is a metric for which the IoU >0.5 (IoU >0.75). APS, APM, and APL are the AP50-95 values for small (mask area < 322), medium (322 ≤ mask area < 642), and large (mask area ≥ 642) objects, respectively. These three metrics were calculated using the mask area of the annotated objects in the dataset for testing. To evaluate the classification performance, these metrics were averaged over the target categories; for example, mAP50-95 is the average AP50-95 of the target categories (Jia et al., 2024).
3 Results
On the basis of the predictions of the instance segmentation models, the accuracies were calculated using the OD and IS approaches. The OD approach corresponds to evaluating the accuracy of predictions of the location and size of the target object. Moreover, the IS approach can be used to evaluate the accuracy of predicting the shapes of the target object as well as its location and size. For both approaches, we show the dependence of the accuracies on the changes in the scaling of the target object. This factor is essential to maintain the detection accuracy when monitoring the FMPD on river surfaces because the water level can rise in a flood state.
3.1 Training results from the five YOLOv8 segment models
The five YOLOv8 segment models were trained with 25,743 training images and then evaluated with 1,471 validation images to fine-tune the model parameters. The validation results are summarized in Table 3. The mAP50-95 and mAP50 denote the averages of AP50-95 and AP50 of each category (Redmon and Farhadi, 2018); these were evaluated for both the OD and IS as the classification performance. The mAP50-95 for the OD (IS) ranged between 60.2% and 69.4% (47.1% and 55.0%), indicating that YOLOv8x was the most accurate depending on the number of weight parameters (Table 3). In addition, we found that the accuracy for IS was slightly lower than that for OD because the strictness of masking the category was considered in the evaluation of the former. For the validation dataset, the classification performance of our model was equivalent to that of the YOLOv8 models pretrained on the COCO val2017 dataset (https://docs.ultralytics.com/tasks/segment).
3.2 Testing our models using the new data obtained via the WLGCAM
To compare the applicability of our models when they are applied at new sites, the detection and classification performances of the five models were evaluated using 107 images obtained by the WLGCAM in the Nakasuka Waterway, Shigenobu River, and Ishite River (Table 2).
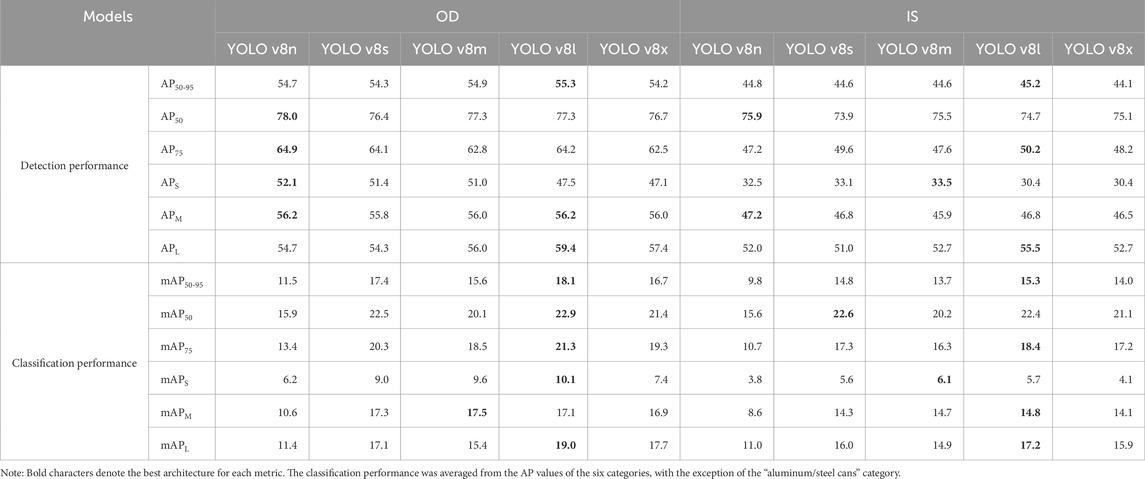
Significant differences in the detection performance among our models were found. The AP50-95 of YOLOv8l was the highest for both the OD and IS approaches, whereas that of YOLOv8x was the lowest despite having the most weight parameters (Table 4). On the other hand, several metrics of YOLOv8n (i.e., AP50 for OD and IS and AP75 for IS) were slightly better than those of YOLOv8l. In particular, the detection performance of the YOLOv8 architecture with fewer weight parameters (e.g., YOLOv8n, YOLOv8s and YOLOv8m) was relatively greater than that with more weight parameters (e.g., YOLOv8l and YOLOv8x) in detecting smaller objects (mask area < 322) (see APS in Table 3). These results indicated that the detection of smaller objects was not necessary because of their similarity in color and shape. In contrast, YOLOv8l and YOLOv8x had advantages in accurately detecting larger objects (mask area ≥ 642) (see APL in Table 3). However, YOLOv8x did not provide the best architecture even if it has the most weight parameters among the YOLOv8 architectures. Thus, the numerous weight parameters of a large model, such as YOLOv8x, caused overfitting to larger objects with various shapes and colors in the training images (see Section 4.2) and numerous parameters (e.g., YOLOv8x) had a disadvantage in detecting smaller FMPDs from river surface images.
Nevertheless, the five models effectively detected major single-use plastic debris (Figure 1). The AP50-95 values of six categories (“drink bottles,” “other bottles,” “food containers,” “shopping bags,” “other bags” and “other plastics”) determined by the five models are shown in the upper panels of Figure 2; the results revealed that the AP50-95 was significantly dependent on the category of target items. The debris from the categories “drink bottles,” “food containers” and “shopping bags” was more accurately detected than the debris from the other categories. This occurred because these objects have distinctive shapes (Figure 1). Moreover, the other categories of “other bottles,” “other bags” and “other plastics” were shaped differently according to the floating state. In fact, the detection performance was unstable according to YOLOv8 architectures, and some non-plastic objects were misidentified as “other plastics” by our models (Figure 1).
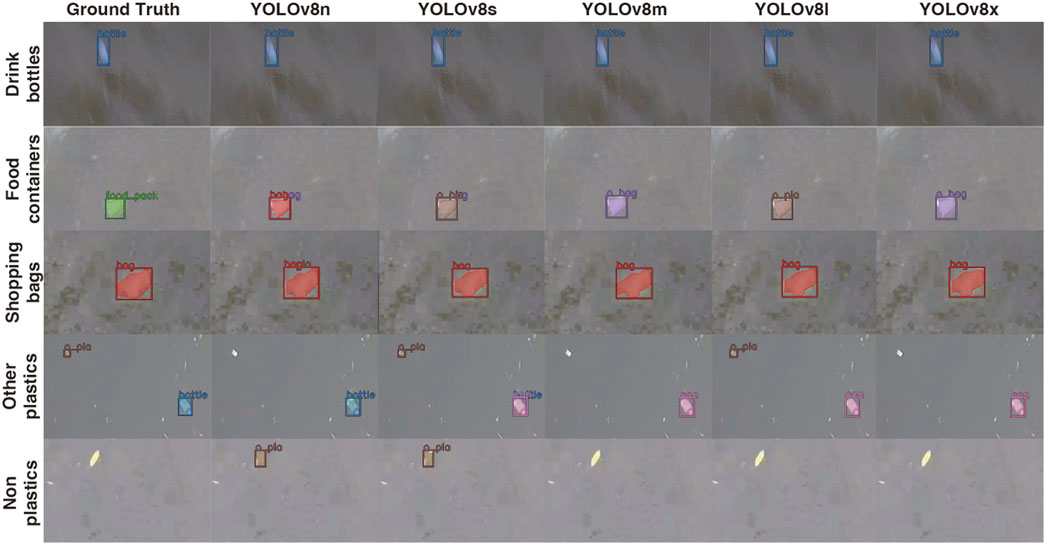
Figure 1. Examples of the detection of three single-use plastics (drink bottles, food containers and shopping bags), other plastics, and non-plastic objects by the five YOLOv8 segment models. The ground truth is shown in the 1st column. The images in the 1st, 2nd, 3rd, 4th and 5th rows were recorded in the Ishite River at the following days and times: 19:23, 23 July 2023; 16:53 7 August 2023; 11:03, 8 August 2023; 14:04 19 February 2024; and 13:03, 31 August 2023, respectively.
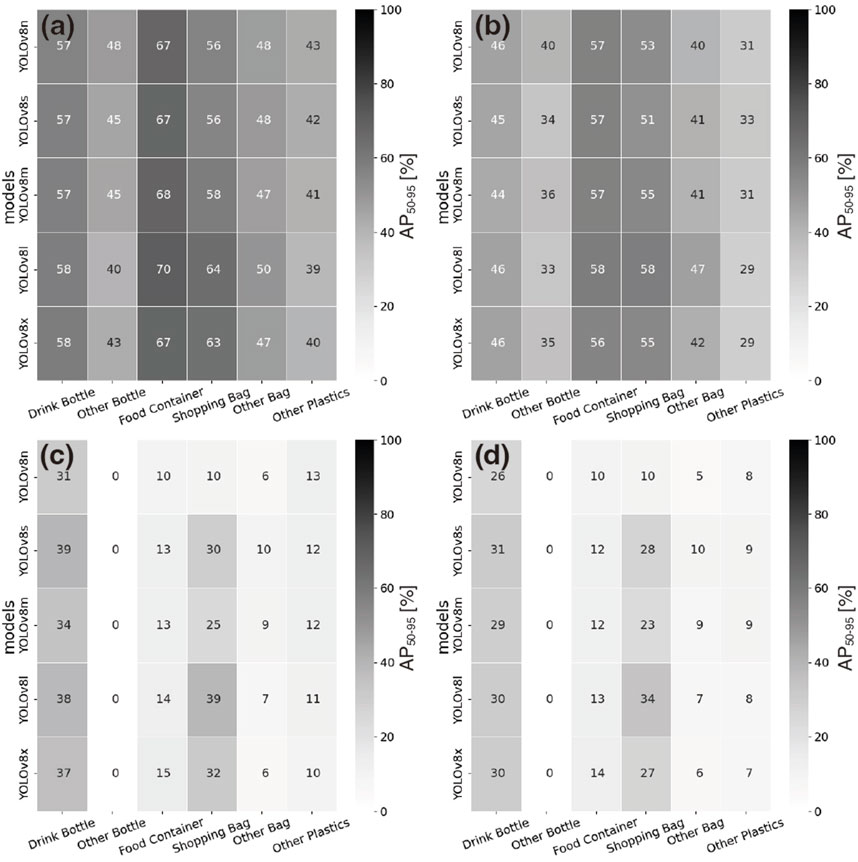
Figure 2. Detection and classification performances (i.e., AP50-95) of each category according to the five YOLOv8 models. The 1st row shows the detection performance for OD (A) and IS (B), and the 2nd row shows the classification performance for OD (C) and IS (D). The value in each box is the percentage of AP50-95, and the color scale is shown on the right side of each panel.
On the other hand, the classification performance of the five models was poor compared with the detection performance and varied according to the YOLOv8 architecture (Table 4). As shown in Figure 1, “food containers” were misclassified into another category according to YOLOv8 architectures. Nevertheless, YOLOv8l had the best classification performance in several metrics (i.e., five metrics except mAPM for OD and four metrics except mAP50 and mAPS for IS; Table 4). These results clearly indicated that more parameters were necessary to classify the category of plastic debris. The AP50-95 of each category is shown in the lower panels of Figure 2. Similar to the detection performance, the categories “drink bottles,” “food containers” and “shopping bags” were more accurately predicted than the other categories. The current models had difficulty recognizing the category “other bottle” because of the visual ambiguity among the categories. Therefore, to improve the performance of classifying the object category, the number of categories could be reduced. These aspects are discussed in Section 4.2. The classification performance of YOLOv8l was higher than those of the other architectures, whereas that of YOLOv8n was the lowest regardless of its good detection performance. Therefore, YOLOv8n was not sufficient to accurately predict the category of plastic debris, and more weight parameters needed to be used, as in YOLOv8l.
3.3 Dependence of the model performance on the image resolution
Next, we examined the dependence of the detection performance on the GSD to address the change in the water level. The GSD ranged between 0.62 and 7.2 mm/px; thus, the AP50-95 was evaluated at 7 levels. Interestingly, the AP50-95 fluctuated according to the GSD (Figure 3). The detection performance of FMPD for OD was optimal at the GSD level of >4.0 mm/px, with the exception of YOLOv8x; YOLOv8x was slightly more accurate at the GSD level of 2.5–3.0 mm/px. Moreover, the detection performance for IS was optimal at the GSD level of 1.0–1.5 mm/px regardless of the YOLOv8 architecture; these results indicated that the current models performed better at the 1.0–1.5 mm/px GSD level.
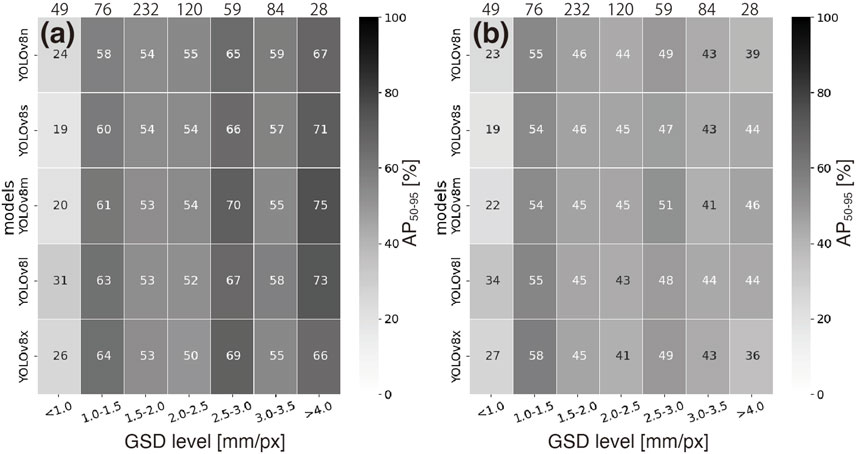
Figure 3. Detection performance dependence of OD (A) and IS (B) on the image resolution. The values above each panel denote the number of images at each resolution. The value in each box is the percentage of AP50-95, and the color scale is shown on the right side of each panel.
The difference in detection performance among the GSD levels was caused by the quality of the training images. Unfortunately, since information on the GSD of the training images was not obtained, we were unable to explore the reason that a certain GSD level was optimal among each YOLOv8 architecture. However, our result indicated that the dependence of the detection performance on the GSD needed to be addressed for monitoring FMPD on river surfaces. To improve the variance of the detection performance due to the GSD, magnification of the training images could be added as image augmentation. This strategy could reduce the variance of the detection performance due to the GSD. Interestingly, the detection performance for OD, except for YOLOv8x, was optimal at a GSD level of > 4.0 mm/px, regardless of the larger GSD level (Figure 3A), whereas the detection performance for IS was optimal at a GSD level of 1.0–1.5 mm/px (Figure 3B). Thus, a smaller GSD was needed to improve the IS detection performance. Specifically, the OD approach could accurately detect FMPD at even a larger GSD.
4 Discussion
4.1 Dependence of the model performance on category selection
As shown in Figures 2C, D, the classification performances of the three other categories (i.e., “other bottles,” “other bags” and “other plastics”) were worse than those of the three single-use plastic categories (i.e., “drink bottles,” “food containers” and “shopping bags”). These categories clearly decreased the mAP50-95. Thus, an experiment to investigate the effect of category selection was performed and consisted of two cases. For Case 1, all of the target objects except “aluminum/steel cans” were categorized into four object types (i.e., “drink bottles,” “food containers,” “shopping bags” and “other plastics”), and the objects belonging to “other bottles” and “other bags” were reannotated as “other plastics.” For Case 2, all plastic objects were reannotated as a single class called “plastics.” The YOLOv8l architecture was selected because its classification performance was optimal. YOLOv8l was retrained by using the reannotated data in both cases, and then, the detection and classification performances were evaluated using the test dataset (see Section 3.3).
The aggregation of the other categories effectively improved both the detection performance and the classification performance (Table 5). Note that the results of the seven categories are referred to as Case 0. For detection performance, compared with those in Cases 0 and 1, the AP50-95 in Case 2 was highest in the OD and IS approaches and slightly improved. Moreover, the aggregation of the other categories was more effective in improving the classification performance than in improving the detection performance. For the OD (IS), compared with that in Case 0, the mAP50-95 in Case 1 increased by 5.2% (4.2%). The classification performance of “drink bottles,” “food containers,” and “other plastics” for both approaches increased, whereas that of “shopping bags” decreased. Note that the classification performance in Case 2 is the same as the detection performance because of the single category.
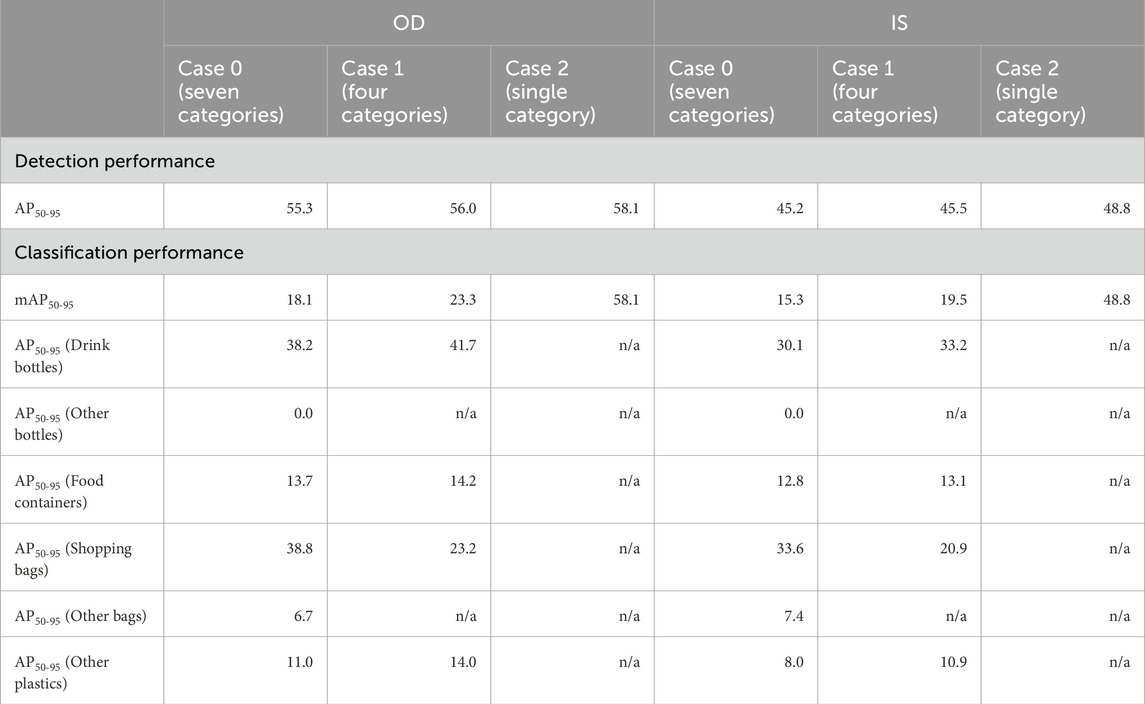
Table 5. Comparison of the detection/classification performance among the models with different categories.
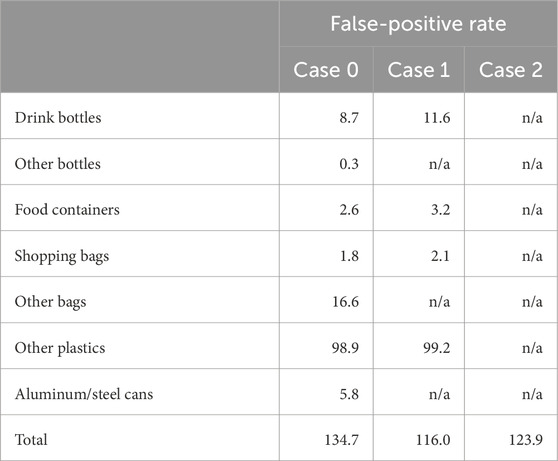
Furthermore, the aggregation of the other categories significantly reduced the frequency with which non-plastic objects (e.g., water surfaces or natural debris) were misidentified as FMPDs (i.e., false positives; see Figure 1). The numbers of false-positive objects per 1,000 tile images (hereinafter referred to as the FP rate) are listed in Table 6. The total FP rates in Cases 0, 1 and 2 were 134.7, 116.0, and 123.9 objects/1,000 images, respectively. The FP rate in Case 1 was significantly lower than that in Case 0, and the aggregation of the other categories had little effect on the FP rates. In particular, the FP rates of “other bags” and “aluminum/steel cans” in Case 0 were relatively high among the seven categories. Removing these categories effectively weeded out false-positive results. Interestingly, the FP rate in Case 1 was lower than that in Case 2; these results indicated that category selection needed to be considered to reduce the FP rates.
4.2 Technical issues and future work for improving model performance
We identified three technical issues to improve the robustness of the YOLOv8 segment model for detecting FMPD on river surfaces. First, YOLOv8l, which had intermediate weight parameters, had the best detection and classification performance (Table 4); this result indicated that the model with fewer parameters had difficulty predicting the object and segmentation mask, whereas the model with more parameters experienced a decrease in accuracy due to overfitting. Ying (2019) proposed four strategies to address these causes: “early stopping,” “network reduction,” “data expansion,” and “regularization.” The “early stopping” strategy stops training before too much fitting to the training data and is used to prevent the learning speed from slowing. Moreover, underfitting provides an insufficient fit for the training data. If we use “early stopping,” we need to determine the optimal timing to obtain a perfect fit between underfitting and overfitting. The “network-reduction” method involves learning the noise from the training dataset. For this strategy, pruning is a significant theory for reducing classification complexity. Moreover, the YOLOv8 model has been used to apply pruning techniques (e.g., Ahmed et al., 2023; Fan et al., 2024). Another way to reduce complexity is to use a simple model. “Data expansion” is a fundamental strategy for avoiding overfitting. To prevent overfitting, image augmentation through several techniques was applied in the present study (see Section 2.2). Based on our findings, magnification of the training images could be added as an image augmentation to reduce the variance in detection performance depending on the GSD (see Section 3.3). Sensitivity analyses could be useful for identifying a strategy for increasing the effect of image augmentation; however, this aspect is beyond the scope of the present study. Finally, to prevent overfitting, the weights of the features that have little influence on the final classification can be minimized, such as using “L2 regularization” (Ying, 2019). Our results demonstrate the capability of the “L2 regularization” strategy using YOLOv8n; YOLOv8n has the fewest parameters and could accurately detect FMPD from river surfaces with several metrics (Table 4). Moreover, YOLOv8x had the most parameters and exhibited poor performance for classification compared with YOLOv8l (Table 4). In addition, aggregating some categories that are difficult to distinguish can improve the classification performance (Table 5) and reduce the occurrence of false-positive results (Table 6). Due to these factors, our model can be more robust and accurate in the future.
Furthermore, the accuracy of FMPD detection depends on the GSD (Figure 3). Our strategy for quantifying FMPD was to use perpendicularly viewed river surface images. The resolution of these images becomes increasingly unclear, particularly for flood events with a significant increase in water level. To resolve this issue, the WLGCAM was used to capture the variability in the water level (Supplementary Figure S2). Moreover, through visual observation, van Emmerik et al. (2023) demonstrated that the amount of FMPD significantly increased during extreme floods, which indicated the importance of quantifying FMPD during floods to clarify its transport. Therefore, this is a critical factor in the quantification of FMPD on river surfaces. To resolve this issue, images with various resolutions can be used in a “data-expansion” strategy. However, improving the models might be limited.
Thus, we recommend identifying the GSD when quantifying FMPD. If water level data can be obtained when videos such as with WLGCAM are recorded, the GSD can be set to detect/identify FMPD (Figure 4). For example, the original resolution was 3.03 mm/px (Figure 4A). The image size was magnified by× 1.5 and × 2.0 times, resulting in the conversion to images with 1.97 and 1.48 mm/px of the GSD (the 2nd and 3rd rows in Figure 4A, respectively). Large-sized plastic objects, such as shopping bags (Figure 4A), were successfully detected and classified regardless of the GSD, whereas medium-sized plastic objects, such as drink bottles (Figure 4B), were inaccurately classified by lowering the GSD. In contrast, small-sized plastic objects, such as other fragmented plastic objects (the arrows in Figure 4C), were detected by the lower GSD. As such, the model performance depends on the GSD according to the object size. This result indicated that we should identify the GSD to manage model performance.
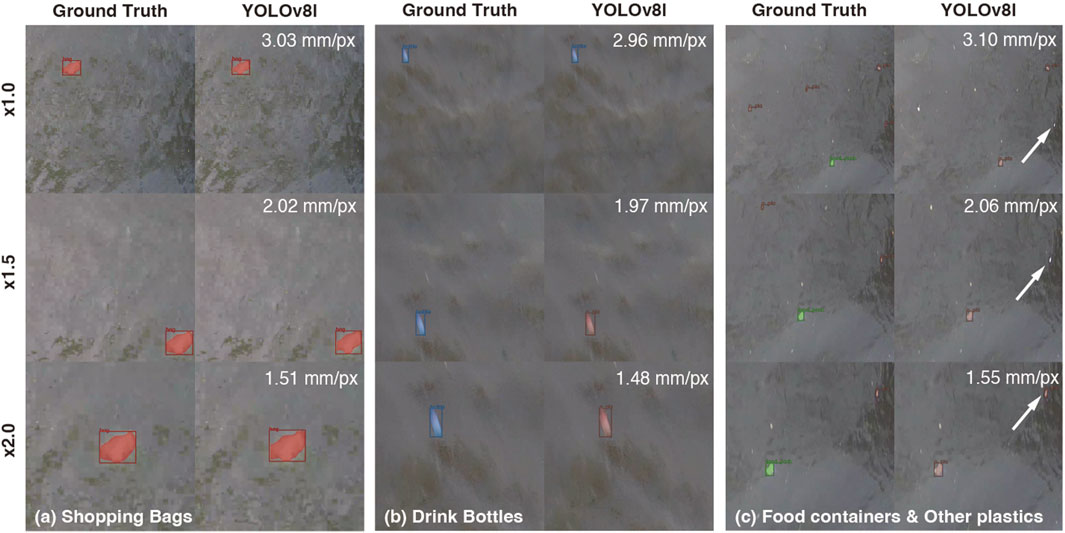
Figure 4. Differences in the categorization of single-use plastics [shopping bags (A), drink bottles (B), and food containers and other plastics (C)] among the different GSDs. The YOLOv8l model was applied to the ×1.0 (1st row), ×1.5 (2nd row) and ×2.0 (3rd row) images. The GSDs are shown at the upper right of each panel.
4.3 Establishment of an application to quantify FMPD transport
Our ultimate goal is to develop an algorithm for quantifying FMPD transport. In our previous work, we developed an algorithm for quantifying the transport of floating debris, including natural debris, via an image processing approach (Kataoka and Nihei, 2020). In that algorithm, the floating debris was identified using the color information in the RGB images. In the future, the image technique for identifying floating debris will be replaced with our instance segmentation models for detecting/classifying FMPD.
Nevertheless, to develop real-world applications, our model needs to undergo fine tuning to avoid the occurrence of false positives. In actuality, several natural objects were misidentified as plastic objects since their shapes and colors were similar to those of the trained plastic objects, and the FP rates were approximately 100 objects/1,000 images (Table 6). If the frequency of false positives is high and if many natural objects, such as trained objects, exist in the images, the number of false positives need to be reduced by fine-tuning them using those images; this factor is a common concern with any model used to implement deep learning models. As a next step, we will develop an application to quantify the plastic transport by incorporating our deep learning models for plastic detection and a template matching algorithm for computing flow velocity using river surface videos (Kataoka and Nihei, 2020).
5 Conclusion
To develop an algorithm for quantifying the transport of floating macroplastic debris (FMPD) from river surface images viewed perpendicularly, we trained five YOLOv8 models; here, an instance segmentation architecture was implemented, and 7,356 training datasets collected by fixed-camera monitoring of seven rivers were used. Our models could detect the FPMD via object detection (OD) and image segmentation (IS) approaches with similar accuracy to that of the pretrained model. Our model performances were tested using 3,802 images generated from 107 frames obtained using a novel camera system with an ultrasonic water level gauge (WLGCAM) installed in three rivers (i.e., the Nakasuka Waterway, Shigenobu River and Ishite River). Interestingly, the model with intermediate parameters (i.e., YOLOv8l) most accurately detected and classified FMPD, whereas the model with the largest number of parameters (i.e., YOLOv8x) exhibited poor performance due to overfitting. Furthermore, we determined the dependence of the detection performance on the ground sampling distances (GSDs); our results indicated that a smaller GSD for IS and larger GSD for OD were capable of accurately detecting FMPD. Furthermore, our results demonstrated that more appropriate category selection needed to be determined, and the four categories (i.e., drink bottles, food containers, shopping bags and other plastics) exhibited the best classification performance. The findings of the present study can aid in the development of guidelines for monitoring FMPD. To note, some false positives (approximately 100 objects/1,000 images) were found from our test dataset; however, our model can be fined tuned using additional datasets if instances of false positives increase. Our instance segmentation model is a major step for the establishment of an application for quantifying FMPD transport in the future.
Data availability statement
The raw data supporting the conclusions of this article will be made available by the authors, without undue reservation.
Author contributions
TK: Conceptualization, Data curation, Formal Analysis, Funding acquisition, Investigation, Methodology, Project administration, Resources, Software, Supervision, Validation, Visualization, Writing–original draft, Writing–review and editing. TY: Data curation, Formal Analysis, Investigation, Writing–review and editing. NY: Data curation, Investigation, Writing–review and editing.
Funding
The author(s) declare that financial support was received for the research, authorship, and/or publication of this article. This work was supported by the Environment Research and Technology Development Fund (JPMEERF21S11900 and JPMEERF20231004) of the Environmental Restoration and Conservation Agency of Japan, KAKENHI (21H01441 and 24K00992), and a project (JPNP18016) commissioned by the New Energy and Industrial Technology Development Organization (NEDO).
Acknowledgments
The authors are grateful to all the technical staff at Yachiyo Engineering Co. Ltd. and the students at the Informatics for Civil Engineering Laboratory of Ehime University, especially Reisuke Ikezumi, Seiichi NY and Kyosuke Takaoka, for their great efforts and contributions to the annotation works. Furthermore, I would like to express my appreciation to all the technical staff at Clealink Technology Co., Ltd., for their cooperation in the installation and operation of the WLGCAM. And we would like to thank American Journal Experts (https://www.aje.com/) for English language editing with high quality, and also thank reviewers for their comments to improve the manuscript.
Conflict of interest
Authors TY and NY were employed by Yachiyo Engineering Co., Ltd.
The remaining author declares that the research was conducted in the absence of any commercial or financial relationships that could be construed as potential conflicts of interest.
Publisher’s note
All claims expressed in this article are solely those of the authors and do not necessarily represent those of their affiliated organizations, or those of the publisher, the editors and the reviewers. Any product that may be evaluated in this article, or claim that may be made by its manufacturer, is not guaranteed or endorsed by the publisher.
Supplementary material
The Supplementary Material for this article can be found online at: https://www.frontiersin.org/articles/10.3389/feart.2024.1427132/full#supplementary-material
References
Ahmed, D., Sapkota, R., Churuvija, M., and Karkee, M. (2023). Machine vision-based crop-load estimation using yolov8. arXiv:2304.13282.
Al-Zawaidah, H., Ravazzolo, D., and Friedrich, H. (2021). Macroplastics in rivers: present knowledge, issues and challenges. Environ. Sci. Process. and Impacts 23 (4), 535–552. doi:10.1039/D0EM00517G
Fan, Y., Mao, S., Li, M., Wu, Z., and Kang, J. (2024). CM-YOLOv8: lightweight YOLO for coal mine fully mechanized mining face. Sensors 24 (6), 1866. doi:10.3390/s24061866
González-Fernández, D., Roebroek, C. T. J., Laufkötter, C., Cózar, A., and van Emmerik, T. H. M. (2023). Diverging estimates of river plastic input to the ocean. Nat. Rev. Earth and Environ. 4 (7), 424–426. doi:10.1038/s43017-023-00448-3
Hao, Y., Liu, Y., Chen, Y., Han, L., Peng, J., Tang, S., et al. (2022). EISeg: an efficient interactive segmentation tool based on PaddlePaddle. arXiv:2210.08788.
Hosang, J., Benenson, R., and Schiele, B. (2017). “Learning non-maximum suppression,” in 2017 IEEE conference on computer vision and pattern recognition (CVPR), 6469–6477.
Hurley, R., Braaten, H. F. V., Nizzetto, L., Steindal, E. H., Lin, Y., Clayer, F., et al. (2023). Measuring riverine macroplastic: methods, harmonisation, and quality control. Water Res., 119902. doi:10.1016/j.watres.2023.119902
Jia, T., Kapelan, Z., de Vries, R., Vriend, P., Peereboom, E. C., Okkerman, I., et al. (2023a). Deep learning for detecting macroplastic litter in water bodies: a review. Water Res. 231, 119632. doi:10.1016/j.watres.2023.119632
Jia, T., Peng, Z., Yu, J., Piaggio, A. L., Zhang, S., and de Kreuk, M. K. (2024). Detecting the interaction between microparticles and biomass in biological wastewater treatment process with Deep Learning method. Sci. Total Environ. 951, 175813. doi:10.1016/j.scitotenv.2024.175813
Jia, T., Vallendar, A. J., de Vries, R., Kapelan, Z., and Taormina, R. (2023b). Advancing deep learning-based detection of floating litter using a novel open dataset. Front. Water 5. doi:10.3389/frwa.2023.1298465
Jrc, E. (2013). MSFD technical subgroup on marine litter (TSG-ML). Guidance on monitoring of marine litter in European seas. EN - Jt. Res. Centre EUR 26113, 128. doi:10.2788/99475
Kataoka, T., and Nihei, Y. (2020). Quantification of floating riverine macro-debris transport using an image processing approach. Sci. Rep. 10 (1), 2198. doi:10.1038/s41598-020-59201-1
Krizhevsky, A., Sutskever, I., and Hinton, G. E. (2017). ImageNet classification with deep convolutional neural networks. Commun. ACM 60 (6), 84–90. doi:10.1145/3065386
Lin, F., Hou, T., Jin, Q., and You, A. (2021). Improved YOLO based detection algorithm for floating debris in waterway. Entropy 23 (9), 1111. doi:10.3390/e23091111
Lin, T.-Y., Maire, M., Belongie, S., Hays, J., Perona, P., Ramanan, D., et al. (2014). “Microsoft coco: common objects in context,” in Computer Vision–ECCV 2014: 13th European Conference, Zurich, Switzerland, September 6-12, 2014 (Springer), 740–755. Proceedings, Part V 13.
Opfer, S., Arthur, C., and Lippiatt, S. (2012). NOAA marine debris shoreline survey field guide, 15.
Redmon, J., and Farhadi, A. (2018). Yolov3: an incremental improvement. arXiv preprint arXiv:1804.02767.
Terven, J., Córdova-Esparza, D.-M., and Romero-González, J.-A. (2023). A comprehensive review of YOLO architectures in computer vision: from YOLOv1 to YOLOv8 and YOLO-NAS. Mach. Learn. Knowl. Extr. 5 (4), 1680–1716. doi:10.3390/make5040083
van Emmerik, T., Kieu-Le, T.-C., Loozen, M., van Oeveren, K., Strady, E., Bui, X.-T., et al. (2018). A methodology to characterize riverine macroplastic emission into the ocean. Front. Mar. Sci. 5 (372). doi:10.3389/fmars.2018.00372
van Emmerik, T., Strady, E., Kieu-Le, T.-C., Nguyen, L., and Gratiot, N. (2019a). Seasonality of riverine macroplastic transport. Sci. Rep. 9 (1), 13549. doi:10.1038/s41598-019-50096-1
van Emmerik, T., Tramoy, R., van Calcar, C., Alligant, S., Treilles, R., Tassin, B., et al. (2019b). Seine plastic debris transport tenfolded during increased river discharge. Front. Mar. Sci. 6. doi:10.3389/fmars.2019.00642
van Emmerik, T. H. M., Frings, R. M., Schreyers, L. J., Hauk, R., de Lange, S. I., and Mellink, Y. A. M. (2023). River plastic transport and deposition amplified by extreme flood. Nat. Water 1 (6), 514–522. doi:10.1038/s44221-023-00092-7
van Lieshout, C., van Oeveren, K., van Emmerik, T., and Postma, E. (2020). Automated River plastic monitoring using deep learning and cameras. Earth Space Sci. 7 (8), e2019EA000960. doi:10.1029/2019EA000960
Keywords: floating macroplastic debris, transport, YOLOv8, instance segmentation, river surface, fixed camera, ultrasonic water level gauge
Citation: Kataoka T, Yoshida T and Yamamoto N (2024) Instance segmentation models for detecting floating macroplastic debris from river surface images. Front. Earth Sci. 12:1427132. doi: 10.3389/feart.2024.1427132
Received: 03 May 2024; Accepted: 11 October 2024;
Published: 23 October 2024.
Edited by:
Daniel González-Fernández, University of Cádiz, SpainReviewed by:
Daniele Cerra, German Aerospace Center (DLR), GermanyYipeng Wu, Tsinghua University, China
Tianlong Jia, Delft University of Technology, Netherlands, in collaboration with reviewer YW
Copyright © 2024 Kataoka, Yoshida and Yamamoto. This is an open-access article distributed under the terms of the Creative Commons Attribution License (CC BY). The use, distribution or reproduction in other forums is permitted, provided the original author(s) and the copyright owner(s) are credited and that the original publication in this journal is cited, in accordance with accepted academic practice. No use, distribution or reproduction is permitted which does not comply with these terms.
*Correspondence: Tomoya Kataoka, a2F0YW9rYS50b21veWEuYWJAZWhpbWUtdS5hYy5qcA==, dGthdGFAY2VlLmVoaW1lLXUuYWMuanA=
 Tomoya Kataoka
 Takushi Yoshida
 Natsuki Yamamoto3