- 1College of Water Resource and Hydropower, Sichuan University, Chengdu, China
- 2PowerChina Chengdu Engineering Corporation Ltd., Chengdu, China
- 3State Key Laboratory of Hydraulics and Mountain River Engineering, Sichuan University, Chengdu, China
- 4Yalong River Hydropower Development Corporation Ltd., Chengdu, China
Introduction: The conventional 3-D point cloud-based deformation analysis methods, such as the shortest distance (SD), cloud-to-cloud (C2C), and multiscale model-to-model cloud comparison (M3C2), essentially regard the closest distance between two periods of point cloud data as the deformation, rather than the true position of the same point in 3-D space before and after deformation.
Methods: This paper proposes a method based on the ICP algorithm to calculate the differences between the chunked multi-period point clouds to recognizes the 3-D deformations.
Results and discussion: The results show that the obtained results are very close to the GNSS data but with a much larger spatial monitoring range. The accuracy is higher than that of the SD method. Moreover, we analyze the statistical relationship between the point cloud block size and the deformation vector error and determine the optimal block size. The aim of this article is to optimize the deformation analysis method and improve its accuracy to provide techniques and ideas for the wider surface deformation monitoring research field. For instance, combining this method with data from contact methods constructs a 3D overall deformation model of the mountain, enabling real-time monitoring and early warning of debris flows.
1 Introduction
Hydroelectric power plants are vital energy infrastructures (Yaseen et al., 2020; Kan et al., 2022; Kumar and Saini, 2022; Zheng et al., 2023). The stability of the dam, as a water retaining structure of a hydropower plant, is key to ensuring the operation of a plant (Han et al., 2022; ICLD, 2023). Ensuring the stability of dams requires careful and thorough deformation analyses. According to the INTERNATIONAL COMMISSION ON LARGE DAMS (ICOLD), the total number of dams worldwide, as of April 2023, is approximately 61,988, of which 67% are earth dams (Evers et al., 2020). However, the operational behavior of earth dams is very complex, and the deployment of monitoring systems can help to examine their service performance (Li et al., 2020; Mai et al., 2023). For example, for earth dams, since the density of the dam is always nonuniform, the consolidation deformation of earth dams under the action of infiltration will be unevenly distributed, leading to inconsistencies between the local and overall deformation of the dam. In addition, in the case of ultrahigh earth dams with such uneven deformations, the complete clarification of the true deformation of the dam implies a significant investment in equipment and labor costs. Therefore, the deformation monitoring of dams is a complex and costly task (Chen et al., 2022; Li et al., 2022; Ai et al., 2023).
Currently, the techniques for monitoring deformation in earthen dams are mainly categorized into contact and noncontact methods. Contact methods, including fracture gauges, Global Navigation Satellite System (GNSS), and inclinometers, provide high accuracies by measuring displacements or accelerations directly on the dam surface, which truly reflect the displacements of the points (Huang et al., 2017; Maltese et al., 2021; Xiao R. et al., 2022). However, the shortcomings are also obvious because these devices can only reflect the displacement or deformation of the point itself, and are unable to identify deformations between points. Therefore, the distribution of the monitoring sites needs to be thoughtfully chosen to balance monitoring effectiveness and cost.
In contrast, noncontact methods, such as terrestrial laser scanning (TLS), unmanned aerial vehicle (UAV) photogrammetry and ground-based synthetic aperture radar (GB-SAR) facilitate easier access to the measurements without physical interactions with the structure (Li et al., 2019a; Li et al., 2019b; Kogut and Pilecka, 2020; Papoutsis et al., 2020; Jiang et al., 2021a; Maltese et al., 2021; Xiao P. et al., 2022; Zhou et al., 2024). Among them, TLS is particularly valued for its accuracy, and is one of the more mature remote sensing technologies. Using high-speed lasers, the instrument is capable of acquiring information such as 3D coordinate values, the reflectance and color of each point on the surface of an object over a wide range, and quickly reproducing a true-color “real-life replica” model with an equal scale (Alba et al., 2006; Gonzalez-Aguilera et al., 2008; Liu et al., 2021).
TLS monitoring of deformation is based on the spatial difference between the point cloud to be matched and the target point cloud. The analysis algorithms used include the point-to-point mode (C2C) (Girardeau-Montaut et al., 2005; Jafari et al., 2017; Mat Zam et al., 2018; Ge et al., 2019), cloud-to-mesh/model (C2M) (Cignoni et al., 1998; Monserrat and Crosetto, 2008; Olsen et al., 2010) and multiscale model-to-model cloud comparison (M3C2) (Lague et al., 2013; Kromer et al., 2015; Veit et al., 2021; Winiwarter et al., 2021; Zahs et al., 2022). These methods are based on the shortest distance (SD) method, which regards the distance of the point cloud to be matched and the target point cloud as the deformation distance of the surface. This makes the calculation results sensitive to the point density, outliers and object surface roughness. Among them, M3C2 selects a sampling point in the point cloud to be matched as the center of the circle and fits a cylinder with radius R to intersect the target point cloud. Then, the distribution mean of the point cloud within the cylinder is calculated. The distance between the mean values is taken as the distance from the sampling point to the target point cloud.
However, these methods are still just at the stage of performing simple calculations of displacement vectors, and the principal method is still the SD method (Teng et al., 2022). For example, when the point cloud is sparse, the deformation direction is not orthogonal to the study surface, and there is a large misregistration between the point cloud to be matched and the target point cloud. All of the methods mentioned above can lead to large calculation errors (Gojcic et al., 2021). This is because the deformation vectors obtained by the SD method are usually far from their true deformation directions.
To address these challenges, many researchers have made attempts to create new methods. Among them, Gojcic et al., 2019 proposed Feature to Feature Supervoxel-based Spatial Smoothing (F2S3), which leverages external points to characterize the object geometry within a specified range. If appropriate parameters are chosen, then the computational results will be close to the actual 3D deformation (Gojcic et al., 2020). However, the complexity of the F2S3 method, and the need to choose accurate parameters, limit its automation and require detailed knowledge of the deformation process.
This article proposes a new analysis of the 3D deformation vector using TLS and the iterative closest point (ICP) algorithm (Paul and Neil, 1992). The core of the method is to use the ICP algorithm to register the point cloud block after the point cloud stitching is completed, and use the deformation matrix in the result of the ICP algorithm to solve the displacement vector of the point cloud. We analyzed the deformation of the earth dam in a hydropower station over a period of 9 months using this method. The results show that the accuracy of our proposed method is relatively high, and the average computational error is controlled within 2.6 mm. Compared with those of the SD method, the accuracies of the deformation values calculated by the ICP algorithm in the x, y and z directions are improved by 93.1%, 90.0%, and 90.5%, respectively. Moreover, we analyzed the statistical relationship between the point cloud block size and the deformation vector error and determined the optimal block size. The aim of this article is to optimize the deformation analysis method and improve its accuracy to provide techniques and ideas for the wider surface deformation monitoring research field (Jiang et al., 2020; Jiang et al., 2021b). For instance, combining this method with data from contact methods constructs a 3D overall deformation model of the mountain, enabling real-time monitoring and early warning of debris flows (Li et al., 2019a; Li et al., 2019b; Kogut and Pilecka, 2020; Papoutsis et al., 2020; Jiang et al., 2021a; Maltese et al., 2021; Xiao P. et al., 2022; Zhou et al., 2024). TLS, photogrammetry, ground observation technology, and sensing technology are commonly used for monitoring rocky slopes. By adopting suitable analysis algorithms and measurement methods, landslides can be reconstructed and monitored, enabling deep analysis of their dynamic evolution (Ye et al., 2022; Fang et al., 2024).
2 Materials and methods
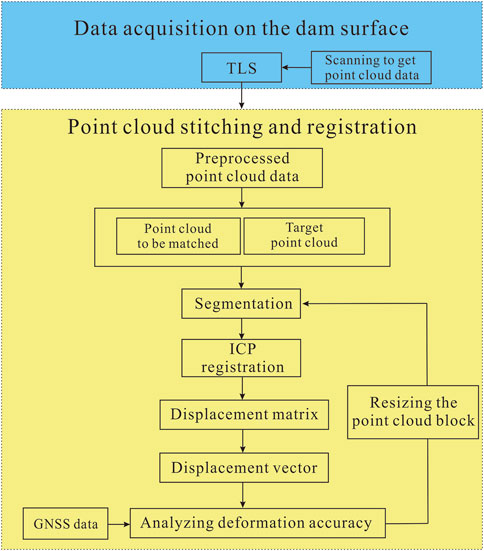
This paper is divided into two main parts. First, TLS is used to acquire the dam’s point cloud data. Then, the preprocessed point cloud is segmented and stitched. Finally, the point cloud is registered using the ICP algorithm to determine the displacement vector. To resize the point cloud block, computational errors were verified using GNSS data (Figure 1).
2.1 Study area
The hydropower station is located downstream of the confluence of the Yalong and Xianshui Rivers, approximately 3 km from the confluence. The river’s elevation is about 2600 m during the dry season, with a width of 40–60 m. The valley slopes steeply, with heights ranging from 500 to 1,000 m. The stratum exposed in the dam’s river section belongs to the Maduo-Maerkang stratigraphic division, a shallow metamorphic rock series of the Upper Triassic Xinduqiao and Lianghekou Formations in the Yajiang stratigraphic area. The Xinduqiao and Lianghekou Formations can be divided into upper, middle, and lower sections. The study focuses on the upper section of the Xinduqiao Formation (T3xd3) and the middle and lower sections of the Lianghekou Formation (T3lh1, T3lh2). The dam site’s geological structure consists of monoclinic strata on a macro level, with a normal stratigraphic sequence and an overall occurrence of N60-80ºW/SW∠50º-80°. The fold classification at the dam site is below three levels, according to the surrounding regional structure. The main structure of the dam’s river section includes the Qingdahekou anticline with a steep dip to the southeast, the longitudinal reverse fault f1 in the northwest steep wing of the anticline, and fault f4 at the interface between T3lh2(2) and T3lh2(3). The Qingdahekou anticline axis is located at the intersection of the Qingda and Yalong Rivers. The basic structural outline and characteristics of the dam’s river section, and the distribution of rock strata, are influenced by these features.
2.2 Data acquisition and processing
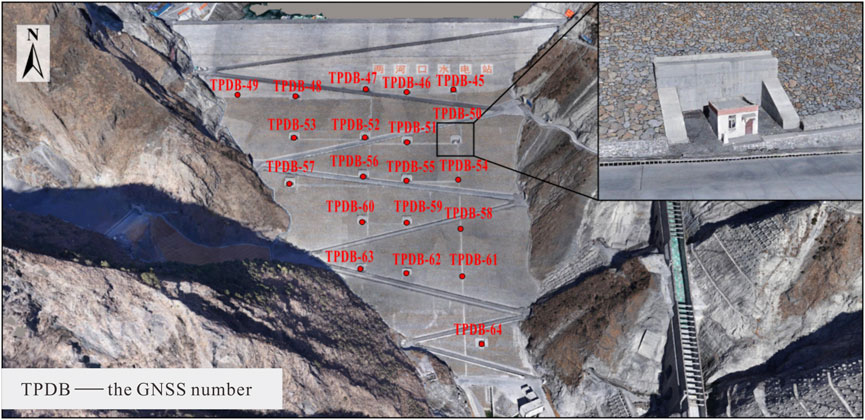
The GNSS arrangement of the earth dam in a hydropower station in Southwest China is as follows (Figure 2).
In this study, a Riegl VZ-2000i instrument, which has a maximum range of 2000 m, a maximum angular resolution of 0.001°, a maximum pitch angle of 60°, a maximum scanning distance parameter of 1500 m and an angular resolution of 0.05°, was used for data acquisition. Two periods of data were collected on 10 January 2023 and October 25 of the same year (Figure 3).
TLS determines the distance from the surface of the target object to the laser scanner is then determined by calculating the time delay and optical path difference of the reflected beam. The horizontal and vertical angles of the scan are also recorded to calculate the relative coordinate difference between the scanning point and the scanning station (Xu et al., 2020). In this study, 11 TLS scanning points were deployed at suitable locations on the top and both sides of the dam. Each point was scanned multiple times by continuously changing the rotation direction and angle. The point spacing of the point cloud is approximately 0.4 m.
Scanners operating in field environments face complex challenges. These include the movement of construction machinery and personnel, as well as environmental factors such as trees, buildings and obstructions. Additionally, construction dust and the variable reflective properties of the scanned targets contribute to instability and noise in the point cloud data. To ensure quality, it is imperative to preprocess the 3D laser scanning data. This preprocessing involves verifying the data integrity and consistency, normalizing the data formats and filtering the point cloud. During the measurement of the earth dam, multistation scanning was employed to capture comprehensive surface details. However, this approach results in significant data overlap after registration, leading to large datasets with considerable redundancy. To enhance the efficiency and quality of surface reconstruction, it is crucial to selectively sparsify the data based on the smoothness of the dam surface. This process effectively reduces the overall data volume.
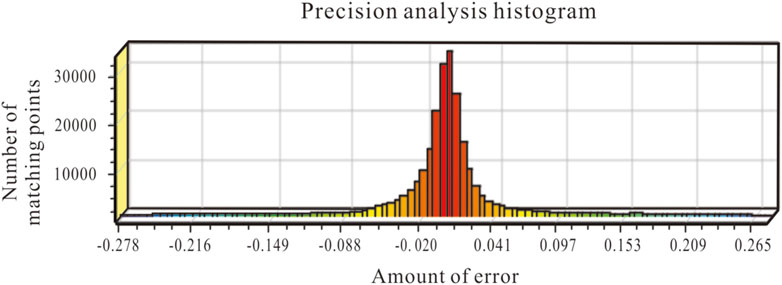
After data preprocessing, segmentation, classification, and registration of point cloud data are imperative for enhancing accuracy. Given the scanner’s operation from multiple locations, each dataset inherits a unique coordinate system. This necessitates registration of point cloud to enable a comprehensive view of the dam’s facade through data integration. Herein, the ICP algorithm plays a pivotal role in the registration processes, beginning with the identification of two point cloud models that share substantial overlap. These models are then merged and aligned within a singular coordinate system, forming a consolidated point cloud model via the ICP algorithm. To enhance the efficiency and accuracy of the ICP algorithm, manual selection of the dam’s point cloud data precedes the sequential registration of data from other sites into the model via the ICP algorithm. To verify registration accuracy, an initial examination of the point cloud uses a co-linear monitoring station along the y-axis as a reference for the profile line, extending from the upstream monitoring station to the downstream base, traversing the entire structure. This procedure was replicated four times based on the distribution of the monitoring stations across the dam surface. The intercepted point clouds, lying within the overlapping scan areas of different stations, should ideally fully overlap. Consequently, distinct layering within the intercepted point cloud may suggest the need for reregistration. A preliminary inspection followed by a quantitative accuracy analysis indicated that the majority of paired points clustered around a zero error margin, suggesting a minimal registration error (Figure 4). Positive values represent the relative vertical uplift values, and negative values represent the subsidence values. The horizontal coordinate represents the amount of error, and the vertical coordinate corresponds to the number of paired points. As the error increases from −0.278 m to 0.265 m, the number of paired points first increases and then decreases. When the error is approximately 0.015 m, the corresponding paired points peak at approximately 32,500. When the error approaches −0.278 m and 0.265 m, the number of paired points is only a few hundred. It was concluded that there was no significant delamination within the point cloud’s overlapping region after stitching and registration, allowing progression to subsequent stages.
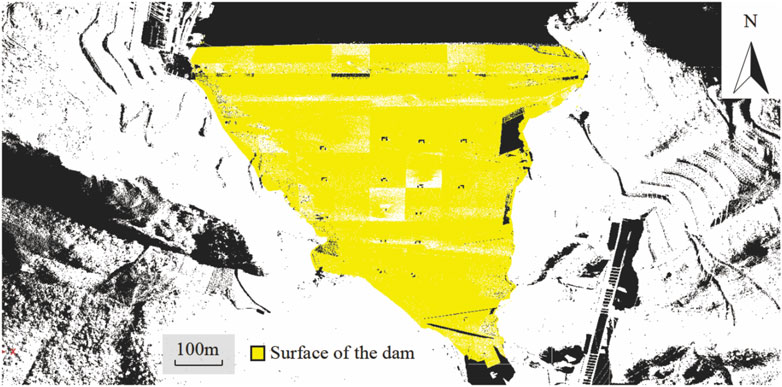
The following figure shows the point cloud data of the earth dam in a hydropower station obtained on 25 October 2023, which were sequentially subjected to noise reduction and stitching registration to obtain a three-dimensional point cloud model of the dam (Figure 5).
2.3 3D deformation analysis method
The ICP algorithm serves as a method for change detection by matching point clouds, utilizing the coordinates of two point clouds to create a cost function that looks for a rigid transformation to minimize its residual error (Feng et al., 2019; An et al., 2024). The accurate calculation between points in 3D space is accomplished by calculating the rotations and translations generated during the matching of point clouds. With the ICP algorithm, the spatial rotation matrix M, and the spatial translation vector
The basic principle of the ICP algorithm is to separate the point cloud to be matched in the
Each iteration of the process yields a spatial rotation matrix
Then, the spatial rotation matrix and the spatial translation vector for each iteration can be combined into the same spatial transformation matrix
Multiply each iteration
In this study, an error analysis method based on the ICP algorithm is proposed to analyze dam deformations by using TLS to collect data and to compensate for the lack of accuracy of algorithms such as the DoD method, the SD method and the M3C2 method.
The deformation values calculated by the ICP algorithm were geometrically compared with the 3D surface model obtained using the SD method. Although the SD method can quickly calculate the surface deformation, it will also lead to a slight measurement error. Since the SD method selects the nearest point on the reference plane, the measurement error will increase as the point cloud data become sparser. Since the point cloud data downstream of the dam were acquired at a longer distance, and the point density obtained was sparse, the ICP algorithm was used for the monitoring points on the downstream dam face. The ICP algorithm is a change detection method in which point clouds are matched, which is accomplished by calculating the rotational translations generated during the matching process of the point clouds. Compared to the SD method, which can only calculate the shortest distance between point clouds, the ICP algorithm can be aligned according to the terrain surface characteristics, and can accurately derive the amount of change on the slope surface even in complex situations.
However, the results of the ICP algorithm calculation cannot be directly used for change detection. The ICP algorithm obtains a transformation matrix after registration, deriving the amount of translation and rotation in the process of registering the matched point cloud to the target point cloud. However, if the ICP algorithm uses the origin of the coordinates as the rotation center for the point cloud to be matched, it will cause a translation in the center of mass of the point cloud. At this point, the final translation amount of the matched point cloud derived from the transformation matrix is not equal to the true translation amount from the center of mass of the matched point cloud to the center of mass of the point cloud after registration (Figure 6A). Therefore, it is unreliable to use the transformation matrix obtained by the ICP algorithm directly for change detection.
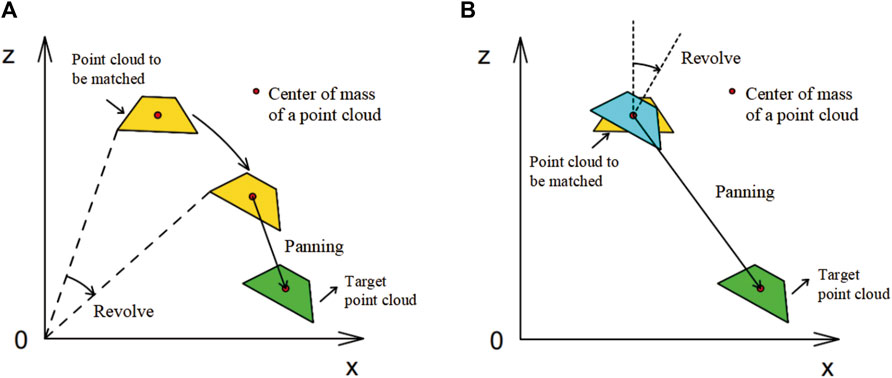
Figure 6. Schematic of point cloud rotation translation: (A) rotation around the coordinate origin and (B) rotation around the geometric center of a point cloud.
To avoid translations in the centre of mass, when using the ICP algorithm to register each point cloud block, the center of mass of the point cloud block should be set as the center of rotation. In this case, the rotations and translations of the point cloud do not interfere with each other, and eventually, a transformation matrix is derived during the ICP registration process. The translations and rotations obtained from this transformation matrix can be regarded as the exact displacement values of the point cloud blocks during the registration process (Figure 6B), which can be used for change detection.
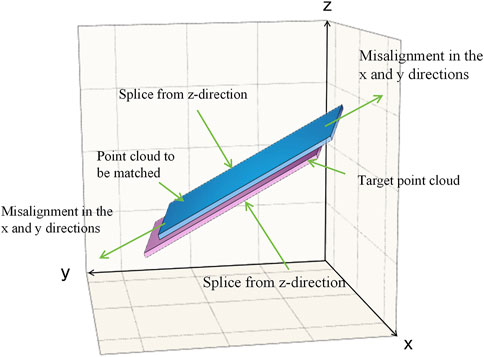
In addition, at least three planes with different normal vectors are required in the ICP algorithm computational object. Otherwise, misregistration of the planes along one of the faces may occur during the stitching process, a phenomenon known as in-plane movements (Figure 7). Since the GNSS monitoring sites are distributed on the surface of the earth dam in the form of houses, each monitoring house provides three planes with different normal vectors for the ICP algorithm (Figure 8). The houses have a regular shape and configuration, which facilitates the ICP algorithm calculations based on these houses. Therefore, when manually intercepting point cloud data from a dam prior to calculating the ICP algorithm, it was necessary to ensure that each point cloud block had a monitoring house.
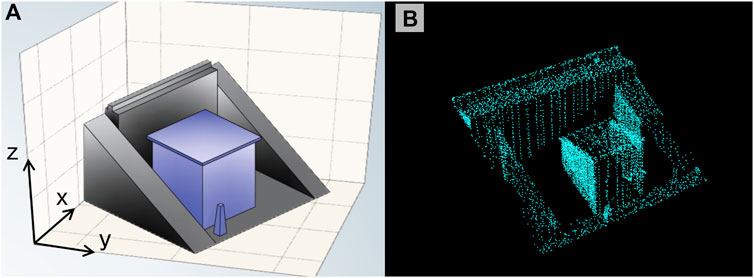
Figure 8. Schematic diagram of the shape of the monitoring site: (A) the three-dimensional model and (B) the original point cloud.
3 Results
3.1 3D deformation analysis based on the proposed method
The terrain occluded the monitoring houses at sites TPDB-49, TPDB-54, TPDB-58 and TPDB-61, precluding a TLS and the ICP algorithm analysis. Hence, these sites are omitted from the figures. In the x-direction, positive and negative values indicate deformation toward the left and right banks, respectively. Similarly, in the y-direction, a positive value indicates that the deformation direction of the dam is pointing upstream, and a negative value indicates that the deformation direction of the dam is pointing downstream. In the z-direction, positive and negative values correspond to vertical uplift and subsidence, respectively.
Analysis of the dam deformation trends reveals a predominant movement toward the right bank in the x-direction (Figure 9A), downstream in the y-direction (Figure 9B)—with some upstream exceptions—and an overall subsidence trend in the z-direction (Figure 9C), with some areas exhibiting uplift. In other words, the dam as a whole, while settling, also deforms toward the right bank and slides downstream on the riverbed. The dam’s settlement is primarily attributed to continuous water pressure on its upstream side and its own weight. The rightward movement is influenced by the topography, with the dam sliding downstream due to horizontal water pressure, creating a larger contact area with the right bank. At this point, this contact surface intersects the trend line of the overall downstream sliding of the dam surface, which takes up some of the force generated by the sliding of the dam. According to the analysis of the data from each site, in the x-direction, the absolute value of the deformation decreases with the increasing site number and is negative. This indicates that the downstream dam surface rotates toward the right bank with the bottom of the dam at the center of the circle. In the y-direction, the larger downstream-oriented deformation is distributed in the connection between the dam face and the right bank. The middle part of the dam appears to have an upstream-oriented deformation trend parallel to that of the right bank, which further confirms that the downstream dam face underwent a “rotational” deformation. In addition, the top of the dam is slightly compressed from the midpoint to the left bank. In the z-direction, the dam settles downward, and the subsidence of the dam face decreases with decreasing elevation. The whole process resulted in a partial uplift of the dam face downstream of the dam base due to extrusion, with a tendency for the dam face to be inserted below the right bank. This asymmetric pressure distribution necessitates focused maintenance on the areas of the downstream dam face near the right bank and the left bank to prevent damage in these stress concentration areas.
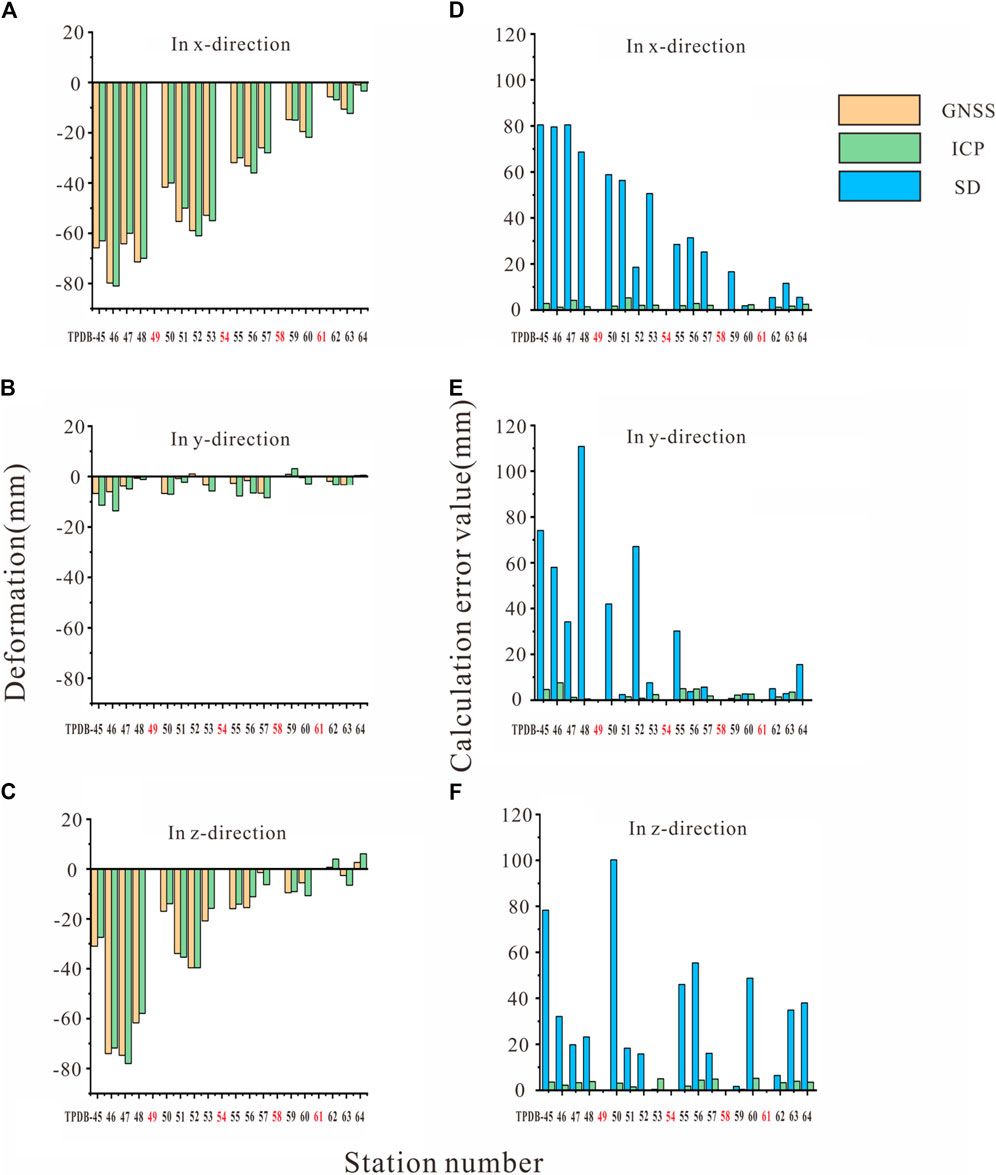
Figure 9. Comparison of the GNSS data and calculated ICP algorithm values: (A) in the x-direction; (B) in the y-direction; (C) in the z-direction. Comparison of the computational error between the SD method and the ICP algorithm: (D) in the x-direction; (E) in the y-direction; (F) in the z-direction.
The calculation results were statistically analyzed. The ICP algorithm demonstrates high accuracy, with mean error values of 2.2 mm, 2.5 mm, and 3.1 mm in the x, y, and z directions, respectively, and standard deviations of 23.3 mm, 3.7 mm, and 23.5 mm. The minimum and maximum errors of the algorithm’s three-dimensional calculated values were 0 mm and 4.2 mm, respectively, with an average error of 2.3 mm and a median of 2.6 mm (Table 1). These results indicate a tight clustering of errors around the mean, especially in the y-direction. The algorithm’s maximum error is 7.6 mm, with some measurements achieving zero error and an average error maintained at 2.6 mm, suggesting strong agreement with GNSS data and confirming the suitability of the ICP algorithm for millimeter-level dam monitoring. In summary, 3D deformation analysis based on TLS and the ICP algorithm can indeed be used to effectively identify the deformation vectors of dam surfaces. For the areas where houses are not scanned, although the displacement vectors of the dam face points cannot be accurately calculated using the ICP algorithm, it is still possible to estimate them based on the general trend.
3.2 Validation of data comparisons
The SD method was utilized to generate a 3D deformation cloud map (Figure 10). In this graph, red represents uplift, and blue represents subsidence. The color gradation from red to blue signifies the deformation magnitude, with deeper hues indicating more substantial deformations. The upstream and central portions of the dam, which experience direct reservoir pressure and minimal lateral restraint, are the most deformed and at greatest risk, necessitating prioritized protection. The entire downstream face of the dam has less stress in contrast to the upstream section and crest. Such discrepancies in deformation distribution are likely due to uneven stresses within the dam structure, drawing attention to the necessity of monitoring the more deformed areas. In the mountainous and alpine canyon regions, TLS scanning stations are often restricted to river valleys, with steep terrain on either side causing significant occlusions and a marked reduction in data completeness. Dense vegetation further exacerbates this challenge. Consequently, the isolated 50 mm bulges on the dam face can be attributed to modeling inaccuracies caused by the sparse density of the point cloud in January and shading by vegetation, highlighting the need for thorough downstream face scans in future surveillance.
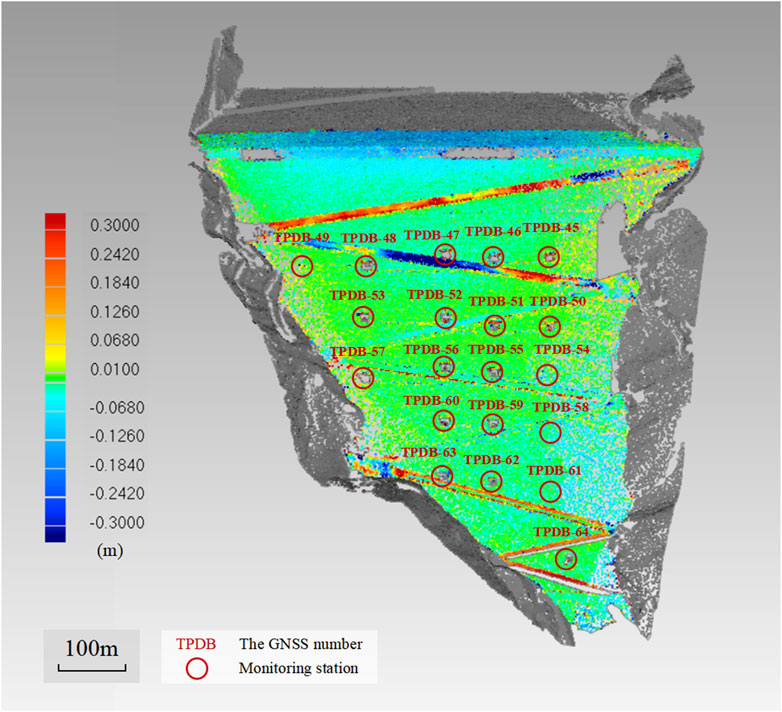
Figure 10. Results of the SD method Bridle paths were analyzed next, numbering them in order of elevation from highest to lowest. A segment of bridle path I near the left bank shows a deformation of approximately 300 mm, with the remainder of the path varying between 60 and 300 mm, as denoted by color variations, and the local lifting amount even surpasses this range. Central bridle path II exhibits deformations greater than 300 mm, with areas near the right bank ranging from 100 to 200 mm and localized depressions of approximately 100 mm. The left bank vicinity of bridle path II is characterized by elevations of approximately 300 mm, with local deformations nearing 250 mm. This deformation pattern is largely attributed to the sustained vertical pressure from vehicular traffic. When a bridleway’s deformation significantly hinders its function as a transit route, localized repairs are conducted to restore its utility, resulting in the effect of localized lifting of the bridleway. Bridle paths III to VI display no significant deformation, while bridle paths VII and VIII could not be modeled due to their location within the TLS scan’s blind spots. The abundance of stone cairns along these paths introduces additional point cloud data that complicate the modeling process, leading to potential errors and deformations of up to 300 mm at the bridle paths.
By annotating ten points surrounding the monitoring station in three-dimensional space, the average value is taken as the deformation calculation result of the SD method and compared with the GNSS data. The precision of the SD method was inconsistent, with a maximum error of 110.8 mm and a minimum of 0.4 mm. The substantial overall calculation error indicates that the SD method is unsuitable for analyses requiring fine-scale deformation monitoring.
To determine the most appropriate algorithm for analyzing deformations in earth dams, a comparative error assessment of the SD method and the ICP algorithm is performed. Consistent with earlier findings, the data from stations TPDB-49, TPDB-54, TPDB-58 and TPDB-61 were excluded. The maximum errors for the SD method in the x (Figure 9D), y (Figure 9E) and z (Figure 9F) directions were 79.6 mm, 109.4 mm and 100.2 mm, with average errors of 32.1 mm, 25.4 mm and 32.9 mm, respectively. This is because the limitations of the SD method stem from its inability to accurately determine the displacement vector direction, which relies instead on calculating the shortest distance between point clouds. Furthermore, identifying identical points within two distinct scans becomes increasingly challenging as the point cloud density diminishes, leading to greater deviations in the displacement vector direction from reality and the associated reference points from their true locations. As a result, the error magnitude escalates. In addition, with increasing monitoring station serial number, the error tends to decrease, especially in the x-direction. Notably, the error tends to decrease with increasing monitoring station number, particularly in the x-direction, where the error of the ICP algorithm distribution tends to decrease. This could suggest a correlation between the actual deformation magnitudes and calculated error values, indicating that the errors tend to decrease as the actual deformation decreases.
Compared with those of the SD method, the accuracies of the ICP algorithm in determining the deformation values at x (Figure 9D), y (Figure 9E) and z (Figure 9F) are significantly improved by 93.1%, 90.0%, and 90.5%, respectively, showing substantial consistency with the field measurement data. This is because the ICP algorithm correctly identifies the direction of displacement, resulting in a displacement vector calculated with minimal error. It can be indicated that the computational errors of the ICP algorithm are lower than those of the SD method, and fall within an acceptable error margin. These findings demonstrate the superiority of the ICP algorithm over the SD method, making the results of the ICP algorithm a reliable foundation for dynamic deformation analysis of dams.
3.3 Optimal block size
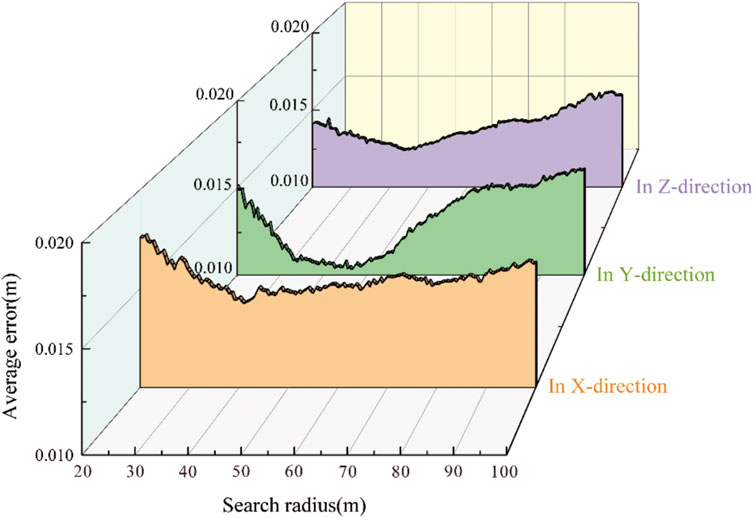
In this study, when point cloud deformation analysis is carried out, the artificial segmentation method is used to divide the point cloud, which introduces subjectivity. The shape, dimensions and positioning of the point cloud segments partially influence the calculation accuracy. Consequently, employing artificial intelligence algorithms is essential for dividing point clouds to eliminate subjective human factors, thereby minimizing subjective bias and registering error estimates more closely to the actual values. The algorithm designates each monitoring station as a circular subunit’s center, divides the point cloud into circular subunits and determines the radius of the circular point cloud subunits. The search radius is incrementally increased to expand the point cloud blocks, and the displacement of the same measurement point is calculated after the registration of different block sizes of the point cloud. The computational results are then compared against GNSS data, and the computation errors of different block sizes are obtained.
The dimensions of the monitoring houses are approximately 6.6 m on the downstream-facing side and 4 m on the riparian-facing side. To satisfy the ICP algorithm calculation conditions, each block must encompass the monitoring house. Therefore, the initial search radius for each site was set to 20 m, and the radius was increased by 1 m for each calculation. Figures 11A–C show the block sizes of 20 m, 30 m, and 40 m, respectively. However, excessively large segments might encompass multiple monitoring sites. Since the deformation of the dam surface is inhomogeneous, the deformation around different monitoring stations is not consistent, precluding their collective analysis. Consequently, the calculation ceases when the radius expands to 100 m. Given the substantial data volume from the results, the error values in three-dimensional space are sorted out by mathematical statistics, and the error value corresponding to each search radius is the average of the errors of the 54 stations, underscoring its statistical relevance (Figure 12).

Figure 11. Point cloud block segmentation: (A) segmentation radius of 20 m; (B) segmentation radius of 30 m; (C) segmentation radius of 40 m.
The results show that the computational accuracy of the ICP algorithm is high, and the errors are all approximately 10 mm, which meets the accuracy requirements of a small deformation analysis. Meanwhile, the error values in three-dimensional space show an obvious V-shape with the gradual increase in the search radius, the average error corresponding to the valley of the V-shape is the smallest error searched for in this study, and the corresponding search radius is the optimal search radius.
Point cloud registration involves adjusting one point cloud
Where
The ICP algorithm seeks to optimize by minimizing
From the scanning results, the shortest distance between two neighboring monitoring houses is approximately 66 m, and the farthest distance is approximately 109 m. To minimize the computational error of the point cloud block covering as many points as possible with only one monitoring house, the optimal radius should be less than 66 m. As shown in the figures, the optimal search radii in the x, y and z directions are 40 m, 45 m, and 44 m, respectively, and the computational error is minimized, and the computational results are most reliable when the corresponding optimal search radius is obtained in each direction. Therefore, in subsequent deformation analyses, the optimal search radius can be determined according to the method described in this study as the basis of the point cloud block size to improve the accuracy and credibility of the calculation results.
4 Discussion
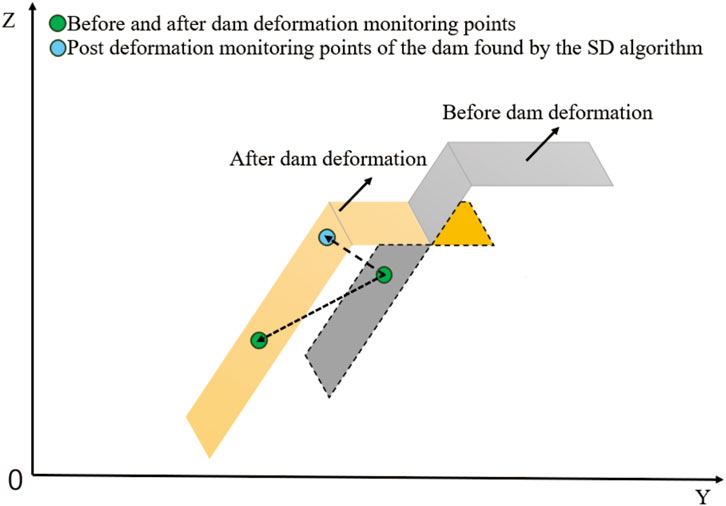
Subject to its inherent gravitational and hydrostatic pressures, an earth dam undergoes continuous deformation. Historically, the SD method utilized for monitoring dam deformation has relied on determining the shortest vector distance from a computation point to a reference surface to represent displacement. This approach, however, fails to accurately represent the deformation dynamics of earth dams, which do not deform normally to the dam surface but rather exhibit settlement and sliding motions. If a characteristic point is taken on the dam surface, the point on the dam surface after the deformation of the earth dam cannot be found correctly using the SD method (Figure 13). As such, identifying accurate matched feature points, postdeformation using the SD method, is problematic. The mismatch between the calculated and actual feature points leads to low accuracy in reflecting the dam’s dynamic deformation.
In contrast to the SD method, the ICP algorithm not only calculates the shortest distance to a reference for error determination but also rotates and translates the point cloud to register with the target cloud. By minimizing error through the distance between identical feature points across point clouds, the ICP algorithm’s computational measurements closely approximate the actual values. This study confirms the efficacy of the ICP algorithm in various applications, including point cloud analysis, 3D reconstruction and scene analysis. Through feature extraction from point cloud data, the ICP algorithm facilitates object detection, recognition and pose estimation and enhances structural understanding by capturing detailed shape and geometric information.
However, the algorithm’s computational accuracy can be compromised by the absence or the low density of point clouds in certain areas. For instance, the ICP algorithm struggles to deliver accurate results in areas where the point cloud data are missing in the scanning blind zone, or where the points at the edge of the point cloud are relatively sparse. Consequently, in the actual calculation process, some unavailable point cloud blocks are discarded, and the error calculation is performed only in the relatively complete region of the TLS point cloud, which affects the precision of the error analysis. Moreover, in the process of the ICP algorithm registration for the edge region of the point cloud, the actual operation does not divide the blocks gradually until the displacement in the block registration process is less than the threshold value. This is because the point cloud at the edges is sparse, and if the block is too small, it is difficult to accomplish the ICP algorithm registration. As a result, larger blocks are retained in edge regions in the final analysis. Therefore, future research should incorporate additional TLS setups at various elevations and in various directions to ensure comprehensive dam surface coverage.
5 Conclusion
This study focuses on the small-scale deformation monitoring of dam surfaces. The accuracy and monitoring applicability of the combined TLS and ICP algorithms were evaluated by analyzing the deformation processes and triggering mechanisms of the dam. The specifics are listed below:
1. The ICP algorithm is based on matching between point clouds and is able to register dam and terrain surface features, which makes it possible to accurately determine the amount of change in the dam surface even in complex situations. The objective is to estimate the rigid transformation matrix by minimizing the error between the point cloud to be matched and the target point cloud. The ICP algorithm continuously optimizes the rigid transformation matrix through iterations until the convergence condition is satisfied. Ultimately, the translations and rotations obtained through this transformation matrix can be considered the exact displacement values for the point cloud block registration process. Dam deformation monitoring can be performed based on this displacement vector.
2. Although the SD method quickly calculates surface deformation, it fails to accurately represent the deformation dynamics of earth dams. This is because earth dam deformation is not typical surface deformation but manifests as settlement and sliding motions. Conversely, the ICP algorithm not only calculates the shortest distance to a reference for error determination but also rotates and translates the point cloud to register with the target cloud. Unlike the SD method, the ICP algorithm significantly enhances computational accuracy in three-dimensional space, demonstrating superior precision and establishing a solid foundation for dynamic deformation analysis of dams.
3. The study identified a distinct V-shaped trend in error values across different block sizes, pinpointing an optimal block size and search radius for minimizing the computational errors in subsequent analyses. Therefore, in the subsequent deformation study, the optimal search radius can be searched according to the method described in this study as the basis for the size of the point cloud block to improve the accuracy and credibility of the calculation results.
In conclusion, the use of the ICP algorithm markedly improves terrain modeling accuracy, optimizes the dam deformation error analysis algorithm and verifies the reliability of the ICP algorithm for dam deformation analysis. The combination of TLS and the ICP algorithm enables more accurate monitoring, facilitating comprehensive and timely understanding of dam deformations over extended periods. This approach offers scientifically sound data and insights for ensuring dam safety, guiding engineering practices and addressing potential risks, underscoring its significance in both research and practical applications.
Data availability statement
The original contributions presented in the study are included in the article/Supplementary Material, further inquiries can be directed to the corresponding author.
Author contributions
X-YN: Writing–review and editing, Writing–original draft, Methodology, Formal Analysis. KZ: Writing–review and editing, Validation, Methodology. NJ: Writing–review and editing, Software, Methodology, Data curation. X-LL: Writing–review and editing, Software, Methodology, Formal Analysis, Data curation. D-MZ: Writing–original draft, Visualization, Resources, Funding acquisition, Data curation. J-WP: Writing–review and editing, Resources, Project administration, Conceptualization. X-XL: Writing–original draft, Software, Methodology, Data curation. Y-SZ: Writing–original draft, Resources, Project administration, Investigation, Funding acquisition. DG: Writing–review and editing, Validation, Methodology, Investigation, Formal Analysis.
Funding
The author(s) declare that financial support was received for the research, authorship, and/or publication of this article. This study has been supported by the Sichuan Youth Science and Technology Innovation Research Team Project (2020JDTD0006).
Acknowledgments
The authors would like to thank the editors, reviewers and all those who contributed to this paper for their important efforts.
Conflict of interest
Authors KZ and J-WP were employed by the PowerChina Chengdu Engineering Corporation Ltd. Authors D-MZ and Y-SZ were employed by Yalong River Hydropower Development Corporation Ltd.
The remaining authors declare that the research was conducted in the absence of any commercial or financial relationships that could be construed as a potential conflict of interest.
Publisher’s note
All claims expressed in this article are solely those of the authors and do not necessarily represent those of their affiliated organizations, or those of the publisher, the editors and the reviewers. Any product that may be evaluated in this article, or claim that may be made by its manufacturer, is not guaranteed or endorsed by the publisher.
References
Ai, Z., Ma, G., Zhang, G., Cheng, X., Zou, Q., Zhou, W., et al. (2023). The use of shape accel array for deformation monitoring and parameter inversion of a 300 m ultrahigh rockfill dam. Struct. Control Health Monit. 2023, 1–18. doi:10.1155/2023/4101604
Alba, M., Fregonese, L., Prandi, F., Scaioni, M., and Valgoi, P. (2006). Structural monitoring of a large dam by terrestrial laser scanning. Int. Archives Photogrammetry, Remote Sens. Spatial Inf. Sci. 36.
An, P., Yong, R., Song, J., Du, S., Wang, C., Xu, H., et al. (2024). Exploring the potential of smartphone photogrammetry for field measurement of joint roughness. Measurement 225, 114055. doi:10.1016/j.measurement.2023.114055
Chen, Z., Yin, Y., Yu, J., Cheng, X., Zhang, D., and Li, Q. (2022). Internal deformation monitoring for earth-rockfill dam via high-precision flexible pipeline measurements. Autom. Constr. 136, 104177. doi:10.1016/j.autcon.2022.104177
Cignoni, P., Rocchini, C., and Scopigno, R. (1998). Metro: measuring error on simplified surfaces. Comput. Graph. Forum 17, 167–174. doi:10.1111/1467-8659.00236
Evers, M., Kyriou, A., Thiele, A., Hammer, H., Nikolakopoulos, K., and Schulz, K. (2020). How to set up a dam monitoring system with PSInSAR and GPS. Proc. SPIE 11534, 115340L. doi:10.1117/12.2573880
Fang, K., Dong, A., Tang, H., An, P., Wang, Q., Jia, S., et al. (2024). Development of an easy-assembly and low-cost multismartphone photogrammetric monitoring system for rock slope hazards. Int. J. Rock Mech. Min. Sci. 174, 105655. doi:10.1016/j.ijrmms.2024.105655
Feng, Y., Wang, Q., and Zhang, H. (2019). Total least-squares iterative closest point algorithm based on lie algebra. Appl. Sci. 9, 5352. doi:10.3390/app9245352
Ge, Y., Tang, H., Gong, X., Zhao, B., Lu, Y., Chen, Y., et al. (2019). Deformation monitoring of earth fissure hazards using terrestrial laser scanning. Sensors 19, 1463. doi:10.3390/s19061463
Girardeau-Montaut, Y., Roux, M., Marc, R., and Thibault, G. (2005). “Change detection on points cloud data acquired with A ground laser scanner,” in ISPRS Workshop–Laser scanning 2005, Enschede, the Netherlands, September 12-14, 2005.
Gojcic, Z., Schmid, L., and Wieser, A. (2021). Dense 3D displacement vector fields for point cloud-based landslide monitoring. Landslides 18, 3821–3832. doi:10.1007/s10346-021-01761-y
Gojcic, Z., Zhou, C., and Wieser, A. (2019). “Robust pointwise correspondences for point cloud based deformation monitoring of natural scenes,” in JISDM 2019, Athens, Greece, 15-19 May, 2019.
Gojcic, Z., Zhou, C., and Wieser, A. (2020). F2S3: robustified determination of 3D displacement vector fields using deep learning. J. Appl. Geodesy 14, 177–189. doi:10.1515/jag-2019-0044
Gonzalez-Aguilera, D., Gómez-Lahoz, J., and Sanchez, J. (2008). A new approach for structural monitoring of large dams with a three-dimensional laser scanner. Sensors 8, 5866–5883. doi:10.3390/s8095866
Han, Z., Li, Y., Zhao, Z., and Zhang, B. (2022). An Online safety monitoring system of hydropower station based on expert system. Energy Rep. 8, 1552–1567. doi:10.1016/j.egyr.2022.02.040
Huang, G., Du, Y., Meng, L., Huang, G., Wang, J., and Han, J. (2017). “Application performance analysis of three GNSS precise positioning technology in landslide monitoring,” in China satellite navigation conference (CSNC) 2017 proceedings: volume I. Editors J. Sun, J. Liu, Y. Yang, S. Fan, and W. Yu (Singapore: Springer Singapore), 139–150.
Jafari, B., Khaloo, A., and Lattanzi, D. (2017). Deformation tracking in 3D point clouds via statistical sampling of direct cloud-to-cloud distances. J. Nondestruct. Eval. 36, 65. doi:10.1007/s10921-017-0444-2
Jiang, N., Li, H., Hu, Y., Zhang, J., Dai, W., Li, C., et al. (2021a). A monitoring method integrating terrestrial laser scanning and unmanned aerial vehicles for different landslide deformation patterns. IEEE J. Sel. Top. Appl. Earth Obs. Remote Sens. 14, 10242–10255. doi:10.1109/jstars.2021.3117946
Jiang, N., Li, H., Liu, M., Zhang, J., and Zhou, J. (2020). Quantitative hazard assessment of rockfall and optimization strategy for protection systems of the Huashiya cliff, southwest China. Geomatics, Nat. Hazards Risk 11, 1939–1965. doi:10.1080/19475705.2020.1819445
Jiang, N., Li, H., and Zhou, J. (2021b). Quantitative hazard analysis and mitigation measures of rockfall in a high-frequency rockfall region. Bull. Eng. Geol. Environ. 80, 3439–3456. doi:10.1007/s10064-021-02137-1
Kan, K., Binama, M., Chen, H., Zheng, Y., Zhou, D., Su, W., et al. (2022). Pump as turbine cavitation performance for both conventional and reverse operating modes: a review. Renew. Sustain. Energy Rev. 168, 112786. doi:10.1016/j.rser.2022.112786
Kogut, J. P., and Pilecka, E. (2020). Application of the terrestrial laser scanner in the monitoring of earth structures. Open Geosci. 12, 503–517. doi:10.1515/geo-2020-0033
Kromer, R. A., Abellan, A., Hutchinson, D. J., Lato, M., Edwards, T., and Jaboyedoff, M. (2015). A 4D filtering and calibration technique for small-scale point cloud change detection with a terrestrial laser scanner. Remote Sens. 7, 13029–13052. doi:10.3390/rs71013029
Kumar, K., and Saini, R. P. (2022). A review on operation and maintenance of hydropower plants. Sustain. Energy Technol. Assess. 49, 101704. doi:10.1016/j.seta.2021.101704
Lague, D., Brodu, N., and Leroux, J. (2013). Accurate 3D comparison of complex topography with terrestrial laser scanner: application to the Rangitikei canyon (N-Z). Isprs-J. Photogramm. Remote Sens. 82, 10–26. doi:10.1016/j.isprsjprs.2013.04.009
Li, B., Yang, J., and Hu, D. (2020). Dam monitoring data analysis methods: a literature review. Struct. Control Health Monit. 27, e2501. doi:10.1002/stc.2501
Li, H., Li, X., Ning, Y., Jiang, S., and Zhou, J. (2019a). Dynamical process of the Hongshiyan landslide induced by the 2014 Ludian earthquake and stability evaluation of the back scarp of the remnant slope. Bull. Eng. Geol. Environ. 78, 2081–2092. doi:10.1007/s10064-018-1233-6
Li, H., Yang, X., Sun, H., Qi, S., and Zhou, J. (2019b). Monitoring of displacement evolution during the pre-failure stage of a rock block using ground-based radar interferometry. Landslides 16, 1721–1730. doi:10.1007/s10346-019-01228-1
Li, J., Wu, Z., Chen, J., Lu, X., and Li, Z. (2022). FEM-Bayesian Kriging method for deformation field estimation of earth dams with limited monitoring data. Comput. Geotech. 148, 104782. doi:10.1016/j.compgeo.2022.104782
Liu, Y., Fan, H., Wang, L., and Zhuang, H. (2021). Monitoring of surface deformation in a low coherence area using distributed scatterers InSAR: case study in the Xiaolangdi Basin of the Yellow River, China. Bull. Eng. Geol. Environ. 80, 25–39. doi:10.1007/s10064-020-01929-1
Mai, D. S., Bui, K. T., and Van Doan, C. (2023). Application of interval type-2 fuzzy logic system and ant colony optimization for hydropower dams displacement forecasting. Int. J. Fuzzy Syst. 25, 2052–2066. doi:10.1007/s40815-022-01452-3
Maltese, A., Pipitone, C., Dardanelli, G., Capodici, F., and Muller, J. (2021). Toward a comprehensive dam monitoring: on-site and remote-retrieved forcing factors and resulting displacements (GNSS and PS–InSAR). Remote Sens. 13, 1543. doi:10.3390/rs13081543
Mat Zam, P. M., Fuad, N. A., Yusoff, A. R., and Majid, Z. (2018). Evaluating the performance of terrestrial laser scanning for landslide monitoring. Gottingen: Copernicus GmbH, 35–55.
Monserrat, O., and Crosetto, M. (2008). Deformation measurement using terrestrial laser scanning data and least squares 3D surface matching. Isprs-J. Photogramm. Remote Sens. 63, 142–154. doi:10.1016/j.isprsjprs.2007.07.008
Olsen, M. J., Kuester, F., Chang, B. J., and Hutchinson, T. C. (2010). Terrestrial laser scanning-based structural damage assessment. J. Comput. Civ. Eng. 24, 264–272. doi:10.1061/(asce)cp.1943-5487.0000028
Papoutsis, I., Kontoes, C., Alatza, S., Apostolakis, A., and Loupasakis, C. (2020). InSAR Greece with parallelized persistent scatterer interferometry: a national ground motion service for big copernicus sentinel-1 data. Remote Sens. 12, 3207. doi:10.3390/rs12193207
Paul, J. B., and Neil, D. M. (1992). A method for registration of 3-D shapes. IEEE. T. PATTERN ANAL. 14 (2), 239–256. doi:10.1109/34.121791
Teng, J., Shi, Y., Wang, H., and Wu, J. (2022). Review on the research and applications of TLS in ground surface and constructions deformation monitoring. Sensors 22, 9179. doi:10.3390/s22239179
Veit, U., Williams, J. G., Zahs, V., Anders, K., Hecht, S., and Höfle, B. (2021). Measurement of rock glacier surface change over different timescales using terrestrial laser scanning point clouds. Earth Surf. Dyn. 9, 19–28. doi:10.5194/esurf-9-19-2021
Winiwarter, L., Anders, K., and Höfle, B. (2021). M3C2-EP: pushing the limits of 3D topographic point cloud change detection by error propagation. Isprs-J. Photogramm. Remote Sens. 178, 240–258. doi:10.1016/j.isprsjprs.2021.06.011
Xiao, P., Zhao, R., Li, D., Zeng, Z., Shunchao, Q., and Yang, X. (2022b). As-built inventory and deformation analysis of a high rockfill dam under construction with terrestrial laser scanning. Sensors 22, 521. doi:10.3390/s22020521
Xiao, R., Jiang, M., Li, Z., and He, X. (2022a). New insights into the 2020 Sardoba dam failure in Uzbekistan from Earth observation. Int. J. Appl. Earth Obs. Geoinf. 107, 102705. doi:10.1016/j.jag.2022.102705
Xu, K., Su, Y., Liu, J., Hu, T., Jin, S., Ma, Q., et al. (2020). Estimation of degraded grassland aboveground biomass using machine learning methods from terrestrial laser scanning data. Ecol. Indic. 108, 105747. doi:10.1016/j.ecolind.2019.105747
Yaseen, Z. M., Ameen, M. S. A., Mohammed, S. A., Mumtaz, A., Haitham, A. A., Zhu, S., et al. (2020). State-of-the art-powerhouse, dam structure, and turbine operation and vibrations. Sustainability 12, 1676. doi:10.3390/su12041676
Ye, X., Zhu, H., Wang, J., Zhang, Q., Shi, B., Schenato, L., et al. (2022). Subsurface multi-physical monitoring of a reservoir landslide with the fiber-optic nerve system. Geophys. Res. Lett. 49, e2022GL098211. doi:10.1029/2022gl098211
Zahs, V., Winiwarter, L., Anders, K., Williams, J. G., Rutzinger, M., and Höfle, B. (2022). Correspondence-driven plane-based M3C2 for lower uncertainty in 3D topographic change quantification. Isprs-J. Photogramm. Remote Sens. 183, 541–559. doi:10.1016/j.isprsjprs.2021.11.018
Zheng, G., Gu, Z., Xu, W., Lu, B., Li, Q., Tan, Y., et al. (2023). Gravitational surface vortex formation and suppression control: a review from hydrodynamic characteristics. Processes 11, 42. doi:10.3390/pr11010042
Keywords: 3D deformation analysis, TLS, ICP algorithm, earth dam, monitoring
Citation: Ning X-Y, Zhang K, Jiang N, Luo X-L, Zhang D-M, Peng J-W, Luo X-X, Zheng Y-S and Guo D (2024) 3D deformation analysis for earth dam monitoring based on terrestrial laser scanning (TLS) and the iterative closest point (ICP) algorithm. Front. Earth Sci. 12:1421705. doi: 10.3389/feart.2024.1421705
Received: 22 April 2024; Accepted: 04 June 2024;
Published: 24 June 2024.
Edited by:
Hongjian Zhu, Yanshan University, ChinaCopyright © 2024 Ning, Zhang, Jiang, Luo, Zhang, Peng, Luo, Zheng and Guo. This is an open-access article distributed under the terms of the Creative Commons Attribution License (CC BY). The use, distribution or reproduction in other forums is permitted, provided the original author(s) and the copyright owner(s) are credited and that the original publication in this journal is cited, in accordance with accepted academic practice. No use, distribution or reproduction is permitted which does not comply with these terms.
*Correspondence: Nan Jiang, MjAxODIyMzA2MDA3M0BzdHUuc2N1LmVkdS5jbg==
 Xing-Yi Ning
 Kun Zhang2
 Nan Jiang