 Mengyun Zhao1,2,3*
- 1State Key Laboratory of Shale Oil and Gas Enrichment Mechanism and Effective Development, Volumetric Fracturing Team, Beijing, China
- 2National Energy Shale Oil R & D Center, Shale Oil Fracturing Laboratory, Beijing, China
- 3Research Institute of Petroleum Exploration and Development, Sinopec, Beijing, China
To understand the key processes of hydraulic fracturing in shale oil reservoirs, such as artificial fracture initiation and extension, proppant transportation and settlement, and the influencing factors of post-fracture production, many hydraulic fracturing field tests have been conducted in the United States. Examples include the ConocoPhillips tests and the National Hydraulic Fracturing Experiment. The results have promoted the innovation and development of fracturing technology. A good correlation exists between lithological changes and the roughness of artificial fractures. Although numerous artificial cracks are created, the number that can provide oil and gas seepage is relatively small, determined by the effectiveness of these cracks. The settlement of proppants in actual geological formations involves factors such as geology, lithology, fractures, and stress. The pressure data indicate that when the reservoir pressure drops below the bubble point pressure, the decline in production sharply increases. The key variables affecting shale oil well production include the horizontal well position, well spacing, horizontal section length, and sand addition intensity. These technologies are suitable for the adaptive process of China’s terrestrial shale oil fracturing, promoting the development and rapid increase of shale oil production.
1 Introduction
Shale oil is an unconventional oil and gas resource characterized by self-generation and self-storage, tight reservoirs, and low natural productivity. The United States was the first country to successfully commercially develop shale oil, with production reaching 8.3 million bbl/d in 2023, accounting for 65% of its national oil production (U.S. Energy Information Administration).
Shale reservoirs have extremely low permeability, and oil and gas rely on hydraulic fracturing to create artificial fractures to flow to the wellbore and be produced (Goral et al., 2020; Yang et al., 2017). Therefore, factors such as morphology, connectivity, degree of support, and coverage of artificial fractures are critical to shale oil and gas production (Yu et al., 2023). However, despite the maturity of fracturing theory and process technology, vital information such as the morphology and connectivity of artificial fractures in underground shale reservoirs can only be indirectly observed through methods such as microseismic monitoring and post-pressure drainage, which significantly limits the technological development of hydraulic fracturing (Moghanloo and Kenneth Imo-Imo Israel Eshiet, 2022).
To directly observe artificial fractures after fracturing, the United States has conducted numerous hydraulic fracturing field experiments that have spurred innovation and development in North American hydraulic fracturing technology (Qiang et al., 2019; Li et al., 2024; Wang et al., 2022). Notable experiments include ConocoPhillips’ Hydraulic Artificial Fracture Network and Modified Volume Observation Experiment (referred to as the ConocoPhillips stimulated reservoir volume (SRV) Experiment) as well as the National Hydraulic Fracturing Experiment Project Phases I and II (referred to as HFTS-1 and HFTS-2) (Raterman et al., 2017; Ciezobka et al., 2018; Ciezobka, 2021). This paper provides a literature review of the aforementioned experiments and analyses the development trends of shale oil fracturing technology in North America, aiming to offer valuable insights for the advancement and enhancement of continental shale oil fracturing technology and the improvement of the fracturing effect.
2 Overview of hydraulic fracturing on-site tests in shale oil reservoirs in the United States
Hydraulic fracturing is a technique employed to enhance oil and gas production from wells. Its basic principle involves injecting fracturing fluid and proppants (including quartz sand) under high pressure into oil and gas layers, causing the rock to fracture and become filled with proppants. This creates artificial fractures with high permeability in low-permeability oil and gas reservoirs, ultimately increasing production from oil and gas wells. Currently, hydraulic fracturing technology has become a crucial technique in the development of unconventional oil and gas reservoirs.
In shale oil development, the U.S. Department of Energy and Oil Company has implemented advanced monitoring methods to conduct field experiments on multistage hydraulic fracturing, focusing on key topics such as the formation and extension of artificial fractures, the transportation and settling of proppants, and the increase in fracturing transformation volume (Ciezobka et al., 2018; Ciezobka, 2021).
2.1 Hydraulic fracture network and stimulated volume observation experiment of ConocoPhillips
In 2014, ConocoPhillips conducted experiments on artificial fracture networks and modified volume observations in the Dwight County shale oil-producing area of Texas. The shale oil reservoir in the Cretaceous period was a clayey limestone reservoir of the Lower Eagle Ford Formation, with a dip angle of 3° in the southeast, a temperature of 162°F, and a pressure coefficient of 1.2–1.3. The experimental well groups are depicted in Figure 1, including P1 (early production well), P2, P3, P4, and P5 (newly drilled experimental wells). Each well has a horizontal section measuring 3,000 feet long, a vertical depth of 13,000 feet, and a spacing of 400 feet between intervals, with 1,200 feet separated at the ends of the toes (Raterman et al., 2017; Raterman et al., 2019). The observation wells are designated with the letter “S” in the figure.
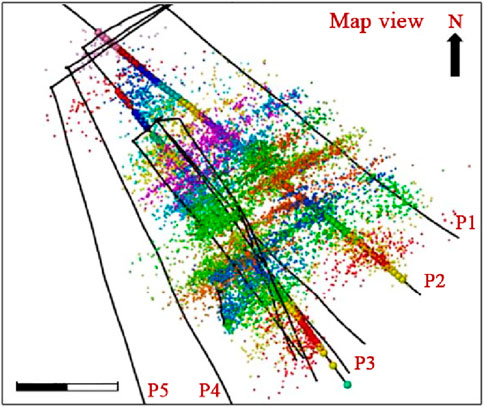
Figure 1. ConocoPhillips SRV experimental well group layout (Raterman et al., 2017).
To ensure the applicability of the experimental results, ConocoPhillips used the mainstream fracturing process at the time to fracture the P2, P3, P4, and P5 wells. Various observation methods and technical measures, such as drilling and coring before and after fracturing, were employed to observe the morphology (Ugueto et al., 2019), distribution, and support degree of the artificial fractures in Well P3 while maintaining normal production in the experimental well group.
2.2 U.S. national hydraulic fracturing experimental site project
To enhance the effectiveness of fracturing stimulation in shale oil horizontal wells, reduce costs, and improve efficiency, the U.S. Department of Energy (DOE) led scientific research institutions, major oil companies, and oil service companies to establish the HFTS Research Alliance (Ciezobka and Reeves, 2020).
The goal of the HFTS project is to deepen the understanding of the fracturing process of horizontal wells, with a focus on artificial fracture propagation, proppant placement processes, and their correlation with reservoir characteristics, engineering processes, and other factors (Reeves et al., 2020). The HFTS project consists of two phases, Phase I and Phase II, as shown in Figure 2 (Maity and Ciezobka, 2019a; Maity and Ciezobka, 2022).
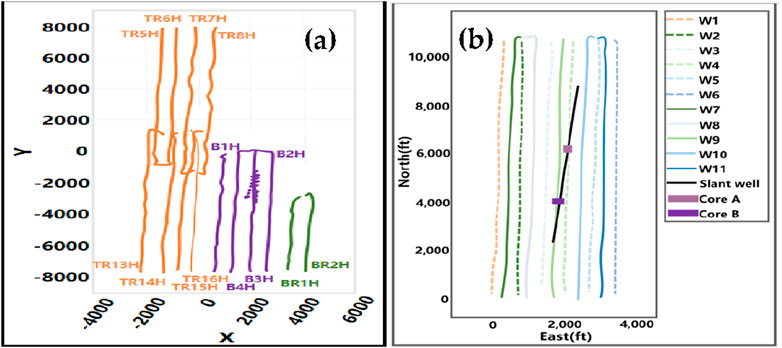
Figure 2. Locations of the HFTS-I stage (A) and II stage (B) in the Permian Basin and the arrangement of well groups (Maity and Ciezobka, 2019a; Maity and Ciezobka, 2022) [The coordinate axis of (A) is based on the B1H wellhead position as the origin, representing the vertical and horizontal distances relative to the wellhead position, with the unit in feet (ft)].
2.2.1 U.S. national hydraulic fracturing experimental site project phase I (HFTS-1)
The HFTS-1 site, which is operated by Laredo Petroleum, is located in the Midland Subbasin. It is divided into two phases: late 2015 to mid-2018 and mid-2018 to late 2020. HFTS-1 implements various techniques, such as different spacings, cluster numbers, proppant particle sizes, and liquid sand strengths. It employs several methods to gather direct information on artificial fracture and proppant placement. Additionally, cores from artificial fractures were collected to enhance the understanding of artificial fracture initiation, proppant behavior, and the correlation between fracture initiation and proppant propagation (Ciezobka and Reeves, 2020; Reeves et al., 2020; Courtier et al., 2017).
The HFTS-1 experimental well group consists of 2 wells, 11 newly drilled horizontal wells, and 2 large scientific wells. The 11 newly drilled horizontal wells are situated in small layers A and B of the Wolfcamp Formation, with a staggered well spacing of 660 feet, an inclined well spacing of 400 feet, and a vertical distance of 2 in layers A and B (80 feet). These wells are completed with 5-inch half-casing, fracturing 450 sections, and zipper fracturing in groups (Li et al., 2019) (refer to Figure 2). After the entire well group is fractured, it is put into production. After 3 months of production, a large-slope scientific well was drilled to obtain core samples from the artificial fracture distribution area, resulting in 850 feet of the core. All the cores were subjected to CT scans to manually identify the fracture types. Additionally, microscopic examinations of all the materials in the cores were conducted to determine the proppant (Ciezobka et al., 2018; Maity and Ciezobka, 2022; Maity and Ciezobka, 2019b).
HFTS-1 employs a variety of monitoring methods, including horizontal toe-end manometers, permanent optical fibers, downhole microseismic inclinometer sensor arrays, eight groups of pressure gauges for large-inclination scientific wells, three types of tracer delivery and testing of oil/water/proppant, and wellbore logging and production logging (Ciezobka et al., 2018; Kumar et al., 2020). Moreover, during the production of the well group, experiments are carried out to examine artificial fracture spreading, proppant deposition, interwell disturbance, and connectivity. The valuable insights obtained from these experiments challenge the prevailing notion of unconventional oil and gas fracturing technology, including artificial fracture propagation, proppant placement effectiveness, and their changes over time (Stegent and Candler, 2018; Rassenfoss, 2018).
2.2.2 U.S. national Hydraulic Fracturing Experimental site phase II (HFTS-2)
Based on the understanding of the HFTS-1 results and unresolved issues, HFTS-2 began operation in November 2018 in Block 55 in Lowean County. Occidental and shell are the operators of the HFTS-2 (Ciezobka, 2021).
The HFTS-2 experimental well group comprises 2 existing wells, 8 newly drilled horizontal wells, and 2 scientific wells, with a spacing of 660 feet between each horizontal well. The technical measures and analysis tests implemented in HFTS-2 have been enhanced compared to those implemented in HFTS-1. These improvements include drilling a scientific well with 540 feet before fracturing and drilling a large, deviated scientific well. After fracturing, permanent fiber optic tubes were installed in 2 horizontal wells and 1 scientific well. Additionally, permanent pressure sensors were installed in 2 scientific wells (8 groups and 12 groups) and 2 scientific wells to improve the understanding of the effectiveness and influencing factors of fracturing measures (Bessa et al., 2021).
A significant difference between HFTS-2 and previous experiments is the installation of advanced permanent fiber monitoring array technology (FO array) in three wells (two horizontal wells and one vertical well) for the first time in North America. This FO array enables the monitoring of artificial fracture propagation and reservoir production in both spatial and temporal dimensions (Zhao et al., 2021). The FO array is instrumental in characterizing the SRV and reservoir production, calibrating subsurface models, and enhancing monitoring of artificial fracture opening, propagation, and proppant placement (Tan et al., 2022).
3 Key technologies and insights for hydraulic fracturing in shale oil reservoirs in the United States
3.1 Artificial fractures formed by fracturing
First, the experiments mentioned above have confirmed the existence of artificial fractures formed by hydraulic fracturing (Raterman et al., 2017). Following the production of each experimental well group, extensive amounts of core were obtained through high-angle scientific wells, enabling manual differentiation between natural fractures, artificial fractures, and induced fractures (Ugueto et al., 2021). These observations have identified a large number of artificial fractures formed by hydraulic fracturing (Gale et al., 2018; Gale et al., 2021), as depicted in Figures 3A-C are core segments containing double fractures located at different positions within Core 3.
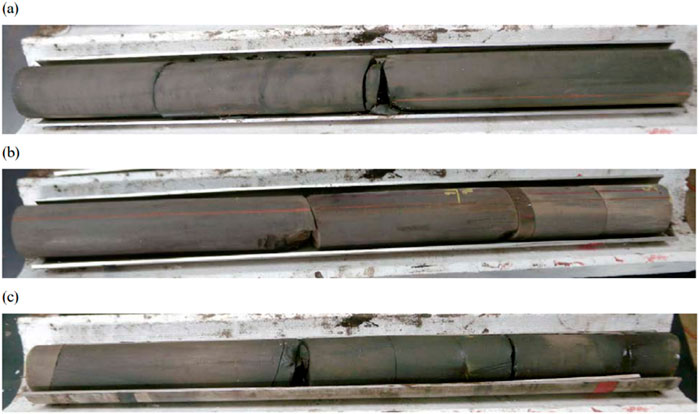
Figure 3. Hydraulic fracture doublets in three tubes from Core 3: (A) in the middle of the tube, (B) above the yellow foot marker, (C) center left of the tube. (Gale et al., 2021) (The diameter of the core in the figure is 3 in).
3.1.1 Artificial fracture occurrence
Based on full-diameter core CT scanning and modeling, HFTS-1 experiments were used to reconstruct the artificial fracture network within the coring range of large-slope scientific wells. When all 11 newly drilled horizontal wells are well arranged in the azimuth direction, the extension direction of most artificial fractures is not parallel to the direction of the minimum horizontal principal stress (SHmin). Instead, they extend in two directions with positive/negative acute angles to the SHmin. The first group of fractures, with a total of 197 fractures, was the most common and trended NE‒SW. The second group of fractures, with a total of 112 fractures, trended WNW‒ESE. Figure 4A shows the two sets of fractures in Section 25 of Well 6U, while Figure 4B shows the fracture azimuth measurements of all the fracturing sections of the 11 wells obtained by microseismic methods. The orientation of the main fractures was consistent in all wells at N76°E, and the secondary fracture orientation was clear in most sections of the wells, which was approximately N46°W (Maity and Ciezobka, 2021a). A similar situation was observed in the cores obtained from the HFTS-2 experiment (Shahri et al., 2021; Fu et al., 2020).
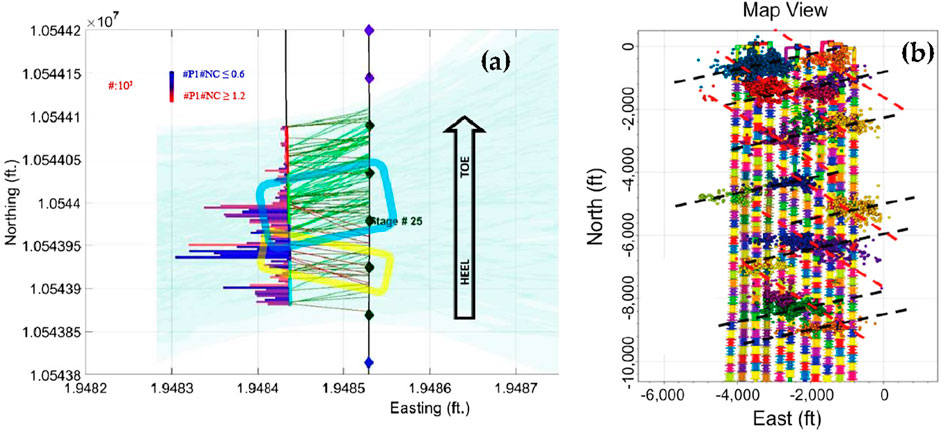
Figure 4. Artificial fracture orientation of a single well/full well site obtained by HFTS-I [(A) artificial fracture distribution in 25 sections of Well 6U (Maity and Ciezobka, 2021a); (B) artificial fracture distribution in the whole well site (Stegent and Candler, 2018)].
The results of hydraulic fracturing experiments in different basins of the ConocoPhillips SRV, HFTS-1, and HFTS-2 in North America show that the artificial fractures formed by hydraulic fracturing mostly exist in the form of dense, parallel, or subparallel artificial fracture clusters. The characteristics of small spacing, parallel extension, and cluster clustering are commonly observed in hydraulic fracturing in shale reservoirs (Raterman et al., 2017; Fu et al., 2020; Ugueto et al., 2022; Maity et al., 2018). Additionally, there is a strong correlation between the significant change in the trend of artificial fractures and the significant change in rock properties. Local stress interference can also cause deviations (Guerrero et al., 2022; Maity and Ciezobka, 2020; Zhao and Gray, 2021; Cao et al., 2022).
3.1.2 Number of artificial fractures
In the ConocoPhillips SRV experiment, a total of 2,466 artificial fractures were discovered in the S3 well and its three sidetracked horizontal wells along the P3 direction, with an average density of 2.6 feet per well. It should be noted that due to the coring of the four wells, including S3, around the P3 well, some fractures may have been repeatedly cored and observed.
In the HFTS-1 experiment, manual observation revealed 361 artificial fractures in the 600-foot core obtained from the high-inclination well, with an average density of 1.6 feet per piece. Similarly, in the HFTS-2 experiment, 500 artificial fractures were identified through manual observation of the acquired 948-foot core, with an average of 1.9 feet per piece (Joseph et al., 2022). The average spacing between these artificial fractures ranged from 1 to 2 feet. Simulation studies also indicated a significant correlation between the distribution of artificial fractures and perforated holes, which was previously unexpected (Maity, 2018). Moreover, despite the significant differences in reservoir conditions and natural fractures at the three experimental sites, the consistent results of the three experiments suggest that high-density parallel artificial fractures may be common in hydraulic fracturing (Fu et al., 2020; Joseph et al., 2022).
3.1.3 Effectiveness of artificial fracture
The effectiveness of artificial fractures and seepage after fracturing in Well P3 was identified by the ConocoPhillips SRV experiment. The decrease in reservoir pressure was primarily influenced by the distance of the nearest main fracture, although the frequency and location of these fractures were not uniform. Over the course of 4 years of production, most manometers exhibited a downward trend, except for one manometer located near the main fracture, which showed an increase over time, indicating a disconnection from the production well (Raterman et al., 2019).
Although a large number of artificial fractures were discovered in the ConocoPhillips RV experiments, only a small number of these fractures were effective for oil and gas seepage. During 2 years of production, the downhole pressure gauges in the production and observation wells showed significant variations in pressure drop at different positions within the reservoir, indicating severe unevenness in reservoir production. This finding aligns with the results obtained regarding the effectiveness of artificial fractures.
3.1.4 Role of artificial and natural cracks and stratification surfaces
The results of the HFTS-1 experiments indicate that the key factors influencing the interaction of natural fractures are their direction, opening degree, texture and composition of the cemented filling, and filling degree relative to artificial fractures. An analysis of in situ stress and fracture properties along the coring section revealed that approximately 52% of the natural fractures in section A of the core remained closed and did not interact with artificial fractures. In contrast, approximately 25% of section B and 36% of section C interacted with artificial fractures. This can be attributed to the greater number of opened natural fractures in the B and C cores under stress, which aligns with the observed distribution of tetragonal calcite (Maity and Ciezobka, 2019a), as shown in Figure 5.
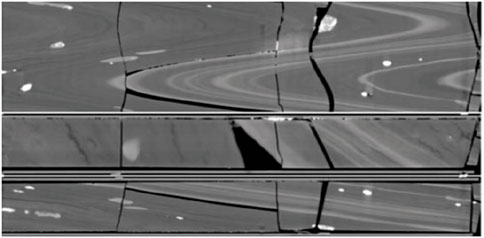
Figure 5. The fracture complexity of HFTS-1 was observed in the core (Gale et al., 2018) (The diameter of the core in the figure is 3 in).
3.1.5 Relationships between artificial fractures and the number of clusters and perforations
Although reservoir coring allows direct observation of artificial fractures after fracturing, determining the initiation and propagation of near-wellbore (NWB) fractures, such as the cluster efficiency and distribution of perforating hole fluid, is challenging. Optical fiber monitoring technology, applied in the HFTS-1 and HFTS-2 experiments, provided real-time temperature and acoustic measurement data near the wellbore, enabling accurate determination of the fluid distribution in the NWB perforated holes (Liu et al., 2021a). Analysis of the microseismic data revealed that the number and spacing of different perforation clusters had a significant effect on the NWB fracture geometry of the experimental well (Stegent and Candler, 2018). As shown in Figure 6, the growth behavior and final geometry of the fractures were consistent across the horizontal section of well 4U, regardless of the cluster design and number of perforations.
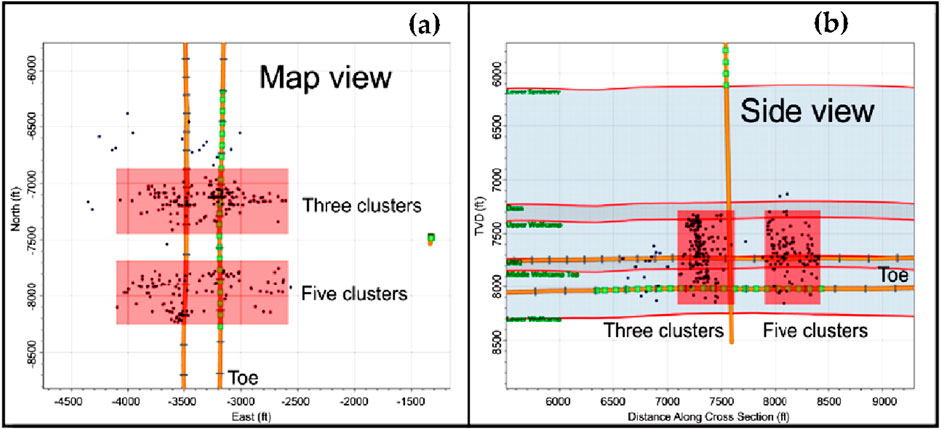
Figure 6. Fracture monitoring results of the 10th (A) and 13th (B) of well 4U (Stegent and Candler, 2018).
3.2 Proppant movement and placement
3.2.1 Profile of the proppant distribution
The ConocoPhillips SRV experiments employed cross-linked jelly for sand transport, but post-fracturing coring revealed that the farthest core sample with proppant was within 75 feet from well P3. Proppant was detected in 76% of the cuttings in the STO3 section (closest) coring barrel, which was situated 56 feet from well P3. However, only 5% of the fractures contained proppant, whereas 5% of the cuttings in the STO1 coring barrel were located 100 feet above well P3 (Raterman et al., 2017).
The HFTS-1 experiments provided insights into the vertical distribution depth of proppants in the UWC formation. The majority of proppants were located approximately 30 feet above and below the horizontal section of well W4 and extended laterally up to 80 feet. The distribution of proppants exhibited abrupt jumps and rapid declines (Elliott and Gale, 2018). In cases where the artificial fracture overlapped with lithological changes, the geometric morphology of the fracture wall underwent significant changes, resulting in a peak of proppant settlement. This demonstrates the influence of geological, lithological, fracture, and stress changes on the proppant distribution, as illustrated in Figure 7.
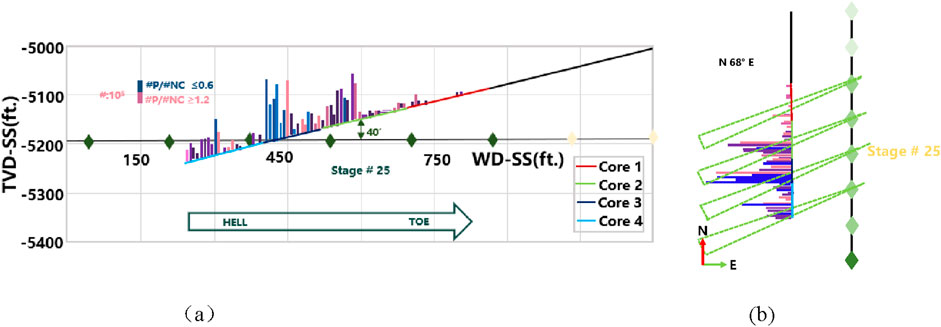
Figure 7. Distribution of proppant (A) and (B) in section 25 of Well 6U in the HFTS-1 experiment [the histogram represents the relative amount of proppant, and the color represents the ratio of any proppant particle (red) to other minerals in the analyzed sample] (Maity and Ciezobka, 2021a).
In relation to the proppant distribution after fracturing in horizontal wells, the ConocoPhillips RV, HFTS-1, and HFTS-2 experiments consistently demonstrate that the proppant distribution is highly uneven in artificial fracture systems. As observed in the core tube and core samples, the amount of proppant in artificial fractures dramatically decreases with increasing distance from the horizontal wellbore. Proppants are rarely observed in core barrels and cores located 100 feet away from horizontal wellbores (Raterman et al., 2017; Raterman et al., 2019; Maity and Ciezobka, 2021b; Kumar et al., 2021). Moreover, the distribution range of small particle-sized (100 mesh) proppant is significantly larger than that of medium particle-sized (40/70 mesh) proppant, with small particle-sized proppant dominating the longitudinal distribution of fracturing wells. Additionally, the concentration of the proppant distribution within segments presents a distinct heel-end advantage (Maity and Ciezobka, 2022; Wood et al., 2018).
3.2.2 Factors influencing proppant delivery and laying
In the HFTS experiment, a systematic analysis of artificial fractures and associated proppants was conducted. The main factors affecting proppant transportation and laying include artificial fractures, changes in lithology, and stress variations in the reservoir (Cao et al., 2022). The presence of artificial fractures in areas with lithology and stress changes often results in variations in fracture surface roughness and flatness. These changes can lead to proppant blockage and settlement in localized areas, preventing further transport to distant locations (Elliott and Gale, 2018; Maity and Ciezobka, 2021c). The experiments revealed a strong causal relationship between fracture surface roughness and the proppant distribution. Over time, artificial fractures located far from rough areas of the fracture wall may contribute less to productivity due to poor connectivity caused by local proppant settlement, resulting in unsupported fractures and limited conductivity for complete production (Gallardo Giozza et al., 2020).
The HFTS-2 experiment was conducted in the vicinity of Well B3H. The proppant placement, as observed through distributed fiber optic monitoring of the fracturing operation, correlated well with the proppant distribution observed in the core. These results were consistent with the pressure drop observed by a large-slope scientific manometer (Gale et al., 2021; Stegent et al., 2019). Therefore, it can be suggested that “primary” artificial fractures, connected to the main artificial fractures and filled with proppant, provide better and greater production over the lifespan of shale wells than “secondary” artificial fractures.
3.2.3 Effect of proppant dosage on estimated ultimate recovery (EUR) in a single well
HFTS-1 was used to investigate the effect of proppant dosage on the EUR in a single well during fracturing construction. The EUR of a single well showed a significant positive correlation with the increase in proppant intensity used in layer A of the Wolfcamp Formation when the proppant amount reached a certain value. However, the increase in proppant dosage in layer B of the Wolf Formation did not affect the EUR of a single well (Li et al., 2019). This suggests that the strength of the proppant should match the reservoir’s characteristics and be determined experimentally for different reservoirs (Ruud et al., 2020).
3.3 Degree of reservoir utilization
3.3.1 Monitoring of the reservoir pressure
The ConocoPhillips SRV experiment utilized pressure changes to assess the degree of reservoir utilization. Reservoir production was found to be severely heterogeneous (Raterman et al., 2017; Raterman et al., 2019; Wang et al., 2019).
In HFTS-1, 8 sets of high-precision manometers were installed in the 6 TW high-inclination coring well, and pressure data were recorded during the 18-month production period of the experimental well group, as shown in Figure 8. The trends of the G5 and G6 manometer data aligned with the toe-end manometer data of production wells 6U and 6 M, with slight differences due to the vertical height variation. The G7 manometer data exhibited a similar trend but with a smaller decrease. The G8 manometer, located farthest from the production well, showed relatively stable pressure. However, pressure gauge G4, situated between the 5U, 6U, 5 M, and 6 M production wells, exhibited a lower pressure drop rate in the reservoir than did the G5 and G6 manometers, with different trends (Li et al., 2019). The manometer data from well 6 TW demonstrated that the pressure decline trend varied at different positions within the reservoir, highlighting the level of impact of artificial fractures and the production distance from the fracturing well reservoir (Liu Xinghui et al., 2021; Gale et al., 2019).
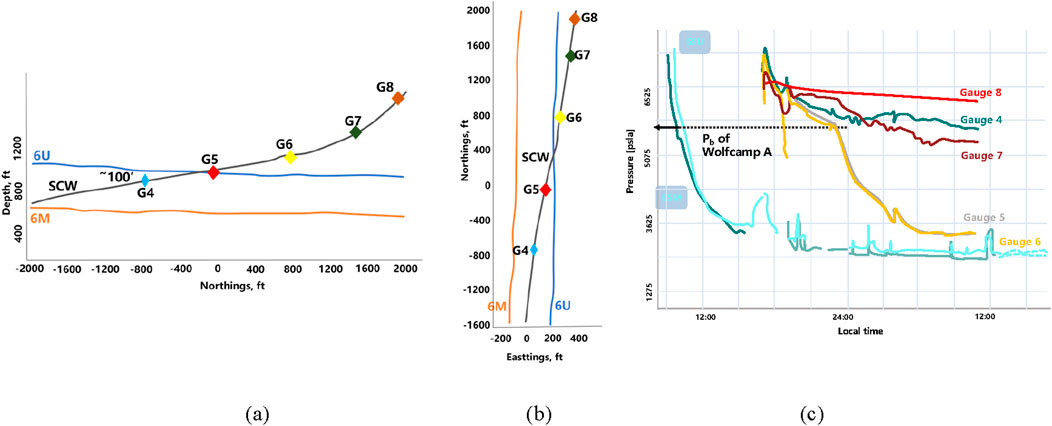
Figure 8. Relative position diagram (A) and (B) of the HFTS-1 experimental well 6 TW, the G4-G8 manometer and the fracturing production wells 6U and 6 M (left). The pressure data (C) of the G4-G8 manometer and the 6U and 6 M well toe end manometers (right figure) in the 18 months of production of the well group (Li et al., 2019).
For HFTS-2, 12 sets of high-precision manometers were installed in the high-inclination coring well B6S. These manometers recorded the pressure data of the experimental well group during the 2-year production period, and the reservoir pressure changes obtained were found to be similar to those observed in HFTS-1.
3.3.2 Main understanding of the degree of reservoir production
After collecting the monitoring data and employing digital simulation technology for analysis, the monitoring results of reservoir production following fracturing and production experiments were consistent. The key findings from this analysis are as follows.
Despite the lengthy production time (2 years) and successful production of the densely superimposed tridimensional development horizontal well group, there were notable variations in the pressure drop among the different reservoir areas. These differences in reservoir production indicate that the artificial fracture coverage rate and effectiveness have not been fully optimized. Therefore, further study is required to improve the reservoir production rate (Raterman et al., 2017; Maity and Ciezobka, 2022; Courtier et al., 2017; Bessa et al., 2021; Zhao et al., 2021).
The pressure data revealed that the depletion rate increases significantly when the reservoir pressure drops below the bubble point pressure. Additionally, the complexity of the contribution of artificial fractures to production was evident from the pressure data. The pressure in the reservoir area located far from the root end fluctuated multiple times, while the pressure drop was relatively stable in the region near the root end. This suggests that liquid production in each region can be discontinuous and dynamic [(Zhao et al., 2021); (Muralidharan and Esmaili, 2021); (Yu et al., 2021); (Stegent et al., 2019)].
The layered recovery factor decreases with increasing vertical distance from the horizontal wellbore. Therefore, carefully selecting the wellbore trajectory and understanding the reservoir stress profile are crucial factors for maximizing the degree of production in thick shale oil reservoirs (Muralidharan and Esmaili, 2021; Akash et al., 2020; Morris et al., 2019; Rafiee and Grover, 2017).
The exploitation coefficients of each small layer, as determined by the numerical model, varied based on the artificial fracture network and reservoir properties. Moreover, vertical artificial fractures and pressure drops do not align with the rectangular shapes set in the numerical model. Thus, employing uniform geometry for fracture modeling differs significantly from the actual situation. This incomplete understanding of reservoir production and the challenges in optimizing the oilfield development scheme are consequences of these modeling discrepancies (Baig et al., 2021; Cao et al., 2017).
The deployment of monitoring wells is considered the most effective method for understanding reservoir production levels. This is due to the correlation between well pressure logging data and microseismic interpretation. It is also a cost-effective means of predicting reservoir production (Kumar Abhash et al., 2018; Wicker et al., 2018; Wang et al., 2018).
Microseismic event clouds are often perceived as the “outer boundary” of the “stimulated reservoir volume” (SRV). However, analysis of the HFTS-1 data revealed that microseismic clouds do not accurately reflect the range of artificial fractures but rather indicate the extent of naturally reactivated fractures (Gross and Dershowitz, 2023). Further analysis of the HFTS-2 data suggests that the microseismic event cloud represents only a subset of the SRV (Tan et al., 2021; Chen et al., 2022; Shrivastava et al., 2018; Weddle et al., 2018).
4 Development trend of hydraulic fracturing technology in shale oil reservoirs and inspirations
4.1 Development of the exploitation concept for shale oil reservoirs
Despite the extremely low permeability of shale oil and gas reservoirs, the pressure drop generated by preproduction wells propagates to adjacent reservoirs through artificial and natural fractures, influencing the performance of densely drilled mid-to-late stage wells in the upper and lower reservoirs (Lorwongngam et al., 2020; Apiwat Ohm et al., 2023). Consequently, the development of shale oil technology is significantly impacted by factors such as development time, well spacing, and interwell connectivity (Kumar Ashish et al., 2018; Wang et al., 2021; Trent, 2017).
Given that the production efficiency of later-stage densely drilled wells is generally inferior to that of early wells, the development approach for shale oil has shifted from staged and layered well placement to one-time tridimensional dense well placement (Adam et al., 2022; Bessa et al., 2023). Following the successful implementation of Encana’s RAB Davidson tridimensional well pattern platform in 2017, shale oil development primarily revolves around tridimensional dense well placement with horizontal spacings ranging from 400 to 660 feet and longitudinal distances ranging from 230 to 400 feet, ensuring no secondary infill space.
4.2 Shale oil reservoir modification technology development
Drawing from conventional reservoir development experience, early North American shale oil fracturing primarily focused on creating large-scale, highly conductive artificial fractures. However, the increase in the EUR did not keep pace with the expansion of fracturing operations. Consequently, the North American industry has enhanced its understanding of key mechanisms related to initiating artificial fractures, delivering proppants, and distributing proppants within shale reservoirs, thanks to findings from ConocoPhillips’s SRV, HFTS-1, and HFTS-2 experiments. These insights have prompted reforms in the fracturing process.
Currently, the factors that greatly impact the production of shale wells are the location of horizontal wells, well spacing, length of the horizontal section, and strength of sand addition. Once the location and spacing of horizontal wells have been determined, the division of matching segment clusters, process design, and scale of sand addition can be used to maximize the transformation of well control reservoirs and tridimensional well pattern control reservoirs. This results in significant improvements in the EUR and ensures the expected return on development investment (Pudugramam et al., 2022). For instance, the average daily oil production per unit horizontal section length of shale oil wells increases as the amount of sand added increases, as long as it is less than 2.8 t/m. However, this pattern becomes less noticeable when the amount of sand added exceeds 2.8 t/m (Srinivasan et al., 2023).
4.3 Development of shale oil in the United States
The successful experience of shale oil development in the US demonstrates that due to the heterogeneity and complexity of unconventional oil and gas reservoirs, it is more suitable to follow the “test prior to development” principle. This approach involves continuous exploration, correction, cost reduction, increased efficiency, and the development of adaptive process technologies. With this model, large-scale development and production can be achieved.
China’s continental shale oil reservoirs are deeper, thicker, and more complex than North American marine reservoirs, making their development more challenging. Currently, China’s continental shale oil development is transitioning from experimental development to large-scale development. It is crucial to apply the “test prior to development” principle from North America and select representative regional strata. This involves systematically designing hydraulic fracturing mine experiments for continental shale oil and obtaining comprehensive knowledge of key information such as artificial fracture morphology, connectivity, support degree, and coverage of hydraulic fractures. Continuous exploration and adjustment of fracturing conduction schemes reduces costs and increases efficiency, ultimately establishing adaptive technology suitable for fracturing transformation of continental shale oil in China.
5 Summary
Numerous hydraulic fracturing field tests have been conducted in shale oil reservoirs in the US. This section provides an overview of the general testing scenarios and highlights the consequential results that have driven the innovation and development of fracturing technology in North America.
a. There is a strong correlation between lithological changes and the roughness of artificial fractures. In carbonate-rich zones, artificial fractures often exhibit texture roughness features that are not typically observed in clay-rich zones. Additionally, there are noticeable variations in the average roughness of artificial fractures across different small layers of cores. The pressure drop is primarily influenced by the proximity of the nearest main fracture, although the frequency and location of the main fracture are not consistent.
b. The distribution of proppant is characterized by a sudden increase followed by a rapid decrease. It has been observed that as artificial fractures expand, they encounter areas with significant lithological variations. Consequently, there are substantial changes in the geometric morphology of the fracture wall. This results in a peak in proppant settlement, indicating the influence of geological, lithological, fracture, and stress changes on the proppant distribution.
c. The development of pertinent technologies is well suited for the adaptive engineering process technology of China’s terrestrial shale oil fracturing transformation, which promotes the advancement and growth of fracturing technology, ultimately leading to a substantial increase in shale oil production.
Author contributions
MZ: Conceptualization, Data curation, Formal Analysis, Funding acquisition, Investigation, Methodology, Project administration, Resources, Software, Supervision, Validation, Visualization, Writing–original draft, Writing–review and editing.
Funding
The author(s) declare that financial support was received for the research, authorship, and/or publication of this article. The National Natural Science Foundation Project No.U23B6004; Sinopec Science and Technology Project NO.P23095.
Conflict of interest
Author MZ was employed by Sinopec.
Publisher’s note
All claims expressed in this article are solely those of the authors and do not necessarily represent those of their affiliated organizations, or those of the publisher, the editors and the reviewers. Any product that may be evaluated in this article, or claim that may be made by its manufacturer, is not guaranteed or endorsed by the publisher.
References
Adam, T., Catherine, D., Zumberge, A., Kanay, J., and Daniel, R. (2022). “Integration of time lapse geochemistry to enhance subsurface characterization at hydraulic fracture test site II,” in The SPWLA 63rd annual logging symposium, stavanger, Norway. doi:10.30632/SPWLA-2022-0086
Akash, D., Kousic, K., and Raj, M. (2020). “Sequencing hydraulic fractures to optimize production for stacked well development in the Delaware basin,” in The unconventional resources technology conference. Austin, Texas, USA. doi:10.15530/urtec-2020-3272
Apiwat Ohm, L., Michael, M. K., Evan, O., and Craig, C. (2023). “One shot wonder xle design: a continuous improvement case study of developing xle design in the bakken,” in The SPE hydraulic fracturing technology conference and exhibition. The Woodlands, Texas, USA. doi:10.2118/212358-MS
Baig, A. M., Witten, B., and Booterbaugh, A. (2021). “Relating microseismicity to geomechanical strain,” in The unconventional resources technology conference. Houston, Texas, USA. doi:10.15530/urtec-2021-5164
Bessa, F., Jerath, K., Ginn, C., Johnston, P., Zhou, Y., Brown, T., et al. (2021). Subsurface characterization of hydraulic fracture test site-2 (HFTS-2), Delaware basin. The unconventional resources technology conference. Houston, Texas, USA. doi:10.15530/urtec-2021-5243
Bessa, F., Sahni, V, Zhao, Y, Han, J, Li, J, Liu, S, et al. (2023). “A comprehensive simulation study of hydraulic fracturing test Site2 (HFTS-2): Part II – development optimization in the Delaware basin using an integrated modeling workflow,” in The unconventional resources technology conference. Denver, Colorado, USA. doi:10.15530/urtec-2023-3851681
Cao, M., Zheng, S., Elliott, B., and Sharma, M. (2022). “Impact of complex fracture networks on well productivity: a case study of the hydraulic fracturing test site #2,” in The SPE hydraulic fracturing technology conference and exhibition. Woodlands, Texas, USA. doi:10.2118/209131-MS
Cao, R., Li, R., Chen, C., and Girardi, A. (2017). “Well interference and optimum well spacing for Wolfcamp development at Permian Basin,” in The unconventional resources technology conference. Austin, Texas, USA, 24–26. doi:10.15530/urtec-2017-2691962
Chen, B., Barboza, B. R., Sun, Y., Bai, J., Thomas, H. R., Dutko, M., et al. (2022). A review of hydraulic fracturing simulation. Arch. Comput. Methods Eng. 29, 1–58. doi:10.1007/s11831-021-09653-z
Ciezobka, J. (2021). “Overview of hydraulic fracturing test site 2 in the permian Delaware basin (HFTS-2),” in The unconventional resources technology conference. Houston, Texas, USA. doi:10.15530/urtec-2021-5514
Ciezobka, J., Courtier, J., and Wicker, J. (2018). “Hydraulic fracturing test site (HFTS) – project overview and summary of results,” in The unconventional resources technology conference. Houston, Texas, USA. doi:10.15530/urtec-2018-2937168
Ciezobka, J., and Reeves, S. (2020). “Overview of hydraulic fracturing test sites (HFTS) in the Permian Basin and summary of selected results (HFTS-I in Midland and HFTS-II in Delaware),” in The Latin America unconventional resources technology conference. online. doi:10.15530/urtec-2020-1544
Courtier, J., Chandler, K., Gray, D., Martin, S., Thomas, R., Wicker, J., et al. (2017). “Best practices in designing and executing a comprehensive hydraulic fracturing test site in the Permian Basin,” in Unconventional resources technology conference. doi:10.15530/URTEC-2017-2697483
Elliott, S. J., and Gale, J. F. W. (2018). “Analysis and distribution of proppant recovered from fracture faces in the HFTS slant core drilled through a stimulated reservoir,” in The unconventional resources technology conference held in. Houston, Texas, USA. doi:10.15530/urtec-2018-2902629
Fu, W., Morris, J. P., Fu, P., Huang, J., Sherman, C. S., and Settgast, R. R. (2020). “Simulating tightly-spaced swarming hydraulic fractures at field scale using an upscaling approach,” in Paper presented at the 54th U.S. Rock Mechanics/Geomechanics Symposium, physical event cancelled.
Gale, J. F. W., Elliott, S. J., and Laubach, S. E. (2018). “Hydraulic fractures in core from stimulated reservoirs: core fracture description of HFTS slant core, Midland basin, west Texas,” in The unconventional resources technology conference. Houston, Texas, USA. doi:10.15530/urtec-2018-2902624
Gale, J. F. W., Elliott, S. J., Li, J. Z., and Laubach, S. E. (2019). Natural fracture characterization in the Wolfcamp Formation at the hydraulic fracture test site (HFTS), Midland basin, Texas. Unconv. Resour. Technol. Conf. held Denver, Colo. U. S. A. doi:10.15530/urtec-2019-644
Gale, J. F. W., Ginn, C. L., Zhang, N., Myers, R. D., Laubach, S. E., et al. (2021). “Fracture description of the HFTS-2 slant core, Delaware basin, west Texas,” in The unconventional resources technology conference. Houston, Texas, USA, 26–28. doi:10.15530/urtec-2021-5175
Gallardo Giozza, G., Torres-Verdin, C., Espinoza, D. N., and Maalouf, E. (2020). “Impact of weak rock interfaces on fracturing patterns of synthetic laminated samples,” in The 54th U.S. Rock Mechanics/Geomechanics Symposium, physical event cancelled.
Goral, J., Panja, P., Deo, M., Andrew, M., Linden, S., Schwarz, J. O., et al. (2020). Confinement effect on porosity and permeability of shales. Sci. Rep. 10, 49. doi:10.1038/s41598-019-56885-y
Gross, M., and Dershowitz, W. (2023). “Conductive and propped networks of induced hydraulic fractures and reactivated fracture networks - evidence from the HFTS-1 in situ experiments,” in The unconventional resources technology conference held in Denver, Colorado, USA. doi:10.15530/urtec-2023-858933
Guerrero, J. O., Nicolas Espinoza, D., and Gale, J. F. W. (2022). High resolution HFTS2 slant core imaging through X-ray computed micro tomography. Houston, Texas, USA: The SPE/AAPG/SEG Unconventional Resources Technology Conference. doi:10.15530/urtec-2022-3709572
Joseph, M., Fu, P., Sherman, C., Wu, H., Huang, J., and Fu, W. (2022). “An investigation of candidate mechanisms for hydraulic fracture swarming through high-fidelity numerical modeling,” in The SPE hydraulic fracturing technology conference and exhibition. The Woodlands, Texas, USA. doi:10.2118/209126-MS
Kumar, A., Chao, K., Hammack, R., and Harbert, W. (2018a). “Surface seismic monitoring of hydraulic fracturing test site (HFTS) in the Midland basin, Texas,” in The unconventional resources technology conference. Houston, Texas, USA. doi:10.15530/urtec-2018-2902789
Kumar, A., Seth, P., Shrivastava, K., Manchanda, R., and Sharma, M. M. (2018b). “Well interference diagnosis through integrated analysis of tracer and pressure interference tests,” in The unconventional resources technology conference held in. Houston, Texas, USA. doi:10.15530/urtec-2018-2901827
Kumar, A., Seth, P., Shrivastava, K., Manchanda, R., and Sharma, M. M. (2020). Integrated analysis of tracer and pressure-interference tests to identify well interference. SPE J. 25 (04), 1623–1635. doi:10.2118/201233-PA
Kumar, A., Shih, C. Y., Liu, G., Holcomb, P., Zhao, S., Hammack, R., et al. (2021). “Machine learning applications for a qualitative evaluation of the fracture network in the Wolfcamp shale using tracer and completion data,” in The unconventional resources technology conference. Houston, Texas, USA. doi:10.15530/urtec-2021-5159
Li, Q., Liu, J., Wang, S., Guo, Y., Han, X., Li, Q., et al. (2024). Numerical insights into factors affecting collapse behavior of horizontal wellbore in clayey silt hydrate-bearing sediments and the accompanying control strategy. Ocean. Eng. 297, 117029. doi:10.1016/j.oceaneng.2024.117029
Li, T., Chu, W., and Leonard, P. A. (2019). “Analysis and interpretations of pressure data from the hydraulic fracturing test site(HFTS),” in The unconventional resources technology conference. Denver, Colorado, USA. doi:10.15530/urtec-2019-233
Liu, X., Tan, Y., Singh, A., Waddle, R., Hilarides, K., Forand, D., et al. (2021b). “Learnings on fracture and geomechanical modeling from the hydraulic fracturing test site in the Midland basin, west Texas,” in The SPE/AAPG/SEG asia pacific unconventional resources technology conference, virtually, 16–18 november. doi:10.15530/AP-URTEC-2021-208377
Liu, Y., Jin, Ge, and Wu, K. (2021a). “New insights on near-wellbore fracture characteristics from high-resolution distributed strain sensing measurements,” in The unconventional resources technology conference. Houston, Texas, USA. doi:10.15530/urtec-2021-5436
Lorwongngam, A., Wright, S., Hari, S., Butler, E., McKimmy, M., Wolters, J., et al. (2020). “Using multidisciplinary data gathering to evaluate eXtreme limited entry completion design and improve perforation cluster efficiency,” in The SPE/AAPG/SEG unconventional resources technology conference. Virtual. doi:10.15530/urtec-2020-2796
Maity, D. (2018). “Microseismicity analysis for HFTS pad and correlation with completion parameters,” in The unconventional resources technology conference held. Houston, Texas, USA. doi:10.15530/urtec-2018-2902355
Maity, D., and Ciezobka, J. (2019a). An interpretation of proppant transport within the stimulated rock volume at the hydraulic-fracturing test site in the Permian Basin. SPE Res Eval and Eng 22 (02), 477–491. doi:10.2118/194496-PA
Maity, D., and Ciezobka, J. (2019b). Designing a robust proppant detection and classification workflow using machine learning for subsurface fractured rock samples post hydraulic fracturing operations. J. Petrol Sci. Eng. 172, 588–606. doi:10.1016/j.petrol.2018.09.062
Maity, D., and Ciezobka, J. (2021a). “Systematic comparison of proppant placement in SRV along two fractured wells at the hydraulic fracturing test site: a case study from Midland basin,” in The unconventional resources technology conference. Houston, Texas, USA. doi:10.15530/urtec-2021-5190
Maity, D., and Ciezobka, J. (2021b). “A systematic interpretation of subsurface proppant concentration from drilling mud returns: case study from hydraulic fracturing test site (HFTS-2) in Delaware basin,” in The unconventional resources technology conference. Houston, Texas, USA. doi:10.15530/urtec-2021-5189
Maity, D., and Ciezobka, J. (2021c). “Digital fracture characterization at hydraulic fracturing test site HFTS-midland: fracture clustering, stress effects and lithologic controls,” in The SPE hydraulic fracturing technology conference and exhibition, virtually, 4–6. doi:10.2118/204174-MS
Maity, D., and Ciezobka, J. (2022). “Quantifying proppant in the SRV along a fractured well at the hydraulic fracturing test site: a proppant log case study from permian-Delaware basin,” in The unconventional resources technology conference held in. Houston, Texas, USA. doi:10.15530/urtec-2022-3704106
Maity, D., Ciezobka, J., Eisenlord, S., et al. (2018). “Assessment of in-situ proppant placement in SRV using through-fracture core sampling at HFTS,” in The unconventional resources technology conference. Houston, Texas, USA. doi:10.15530/urtec-2018-2902364
Maity, D., and Ciezobka, J. (2020). “A data analytics framework for cored fracture imaging and novel characterization workflow - application on samples from hydraulic fracturing test site HFTS in the Midland basin,” in The SPE hydraulic fracturing technology conference and exhibition. Woodlands, Texas, USA, 4–6. doi:10.2118/199754-MS
Moghanloo, R.Kenneth Imo-Imo Israel Eshiet (2022). Emerging technologies in hydraulic fracturing and gas flow modelling. IntechOpen. doi:10.5772/intechopen.87833
Morris, J. P., Sherman, C. S., Fu, P., Settgast, R.R., Huang, J., Fu, W., et al. (2019). “Multiscale geomechanical analysis of the hydraulic fracturing test site,” in The 53rd U.S. Rock mechanics/geomechanics symposium. New York City, New York.
Muralidharan, V., and Esmaili, S. (2021). “New insights into hydraulic fracture dynamics: learnings from a pressure monitoring well in the Permian Basin,” in The unconventional resources technology conference. Houston, Texas, USA. doi:10.15530/urtec-2021-5230
Pudugramam, S., Irvin, R. J., McClure, M., Fowler, G., Bessa, M., Zhao, Y., et al. (2022). “Optimizing well spacing and completion design using simulation models calibrated to the hydraulic fracture test site 2 (HFTS-2) dataset,” in The unconventional resources technology conference. Houston, Texas, USA. doi:10.15530/urtec-2022-3723620
Qiang, Li, Wang, Y., and Owusu, A. B. (2019). A modified Ester-branched thickener for rheology and wettability during CO2 fracturing for improved fracturing property. Environ. Sci. Pollut. Res. 26, 20787–20797. doi:10.1007/s11356-019-05386-6
Rafiee, M., and Grover, T. (2017). “Well spacing optimization in Eagle Ford shale: an operator’s experience,” in The unconventional resources technology conference. Austin, Texas, USA. doi:10.15530/urtec-2017-2695433
Rassenfoss, S. (2018). A look into what fractures really look like. J. Pet. Technol. 70 (11), 28–36. doi:10.2118/1118-0028-JPT
Raterman, K. T., Farrel, H. E., Mora, O. S., Janssen, A. L., Gomez, G. A., Busetti, S., et al. (2017). “Sampling a stimulated rock volume: an Eagle Ford example,” in The unconventional resources technology conference. Austin, Texas, USA. doi:10.15530/urtec-20172670034
Raterman, K. T., Liu, Y., and Warren, L. (2019). “Analysis of a drained rock volume: an Eagle Ford example,” in The unconventional resources technology conference. Denver, Colorado, USA. doi:10.15530/urtec-2019-263
Reeves, S., Ciezobka, J., and Perry, K. (2020). Test site advances hydraulic fracturing in the Permian basin. Oil and Gas J. 118 (7), 39–42.
Shahri, M., Tucker, A., Rice, C., Lathrop, Z., Ratcliff, D., McClureet, M., et al. (2021). “High fidelity fibre-optic observations and resultant fracture modeling in support of planarity,” in The SPE hydraulic fracturing technology conference and exhibition. Virtual, May 2021. doi:10.2118/204172-MS
Shrivastava, K., Hwang, J., and Sharma, M. (2018). “Formation of complex fracture networks in the Wolfcamp shale: calibrating model predictions with core measurements from the hydraulic fracturing test site,” in The 2018 SPE annual technical conference and exhibition. Dallas, Texas, USA.
Srinivasan, A., Mjehovich, J., Wu, K., Jin, G., and Moridis, G. (2023). “Investigate the impact of parent well depletion on fracture geometry based on low-frequency distributed acoustic sensing in hydraulic fracture test site-2,” in The SPE hydraulic fracturing technology conference and exhibition. The Woodlands, Texas, USA. doi:10.2118/212344-MS
Stegent, N., and Candler, C. (2018). “Downhole microseismic mapping of more than 400 fracturing stages on a multiwell pad at the hydraulic fracturing test site (HFTS): discussion of operational challenges and analytic results,” in The unconventional resources technology conference. Houston, USA. doi:10.15530/urtec-2018-290311
Stegent, N., Dusterhoft, R., and Menon, H. (2019). “Insight into hydraulic fracture geometries using fracture modeling honoring field data measurements and post-fracture production,” in The SPE europec featured at 81st EAGE conference and exhibition. London, England, UK. doi:10.2118/195524-MS
Tan, Y., Wang, J., Rijken, M., Zhang, Z., Fang, Z., Wuet, R., et al. (2022). Interpretation of HFTS 2 microseismic data using bedding-plane-slip mechanism. SPE J. 27 (03), 1411–1423. doi:10.2118/209232-PA
Tan, Y., Wang, J., Rijken, P., Zhang, Z., Fang, Z., Wu, R., et al. (2021). “Mechanism of microseismic generation during hydraulic fracturing –with evidence from HFTS 2 observations,” in The unconventional resources technology conference held in Houston, Texas, USA. doi:10.15530/urtec-2021-5296
Trent, J. (2017). Frac hits reveal well spacing may be too tight, completion volumes too large. J. Pet. Technol. 69, 35–38. doi:10.2118/1117-0035-JPT
Ugueto, G., Huckabee, P., Wojtaszek, M., Daredia, T., and Reynolds, A. (2019). “New near-wellbore insights from fiber optics and downhole pressure gauge data the SPE hydraulic fracturing conference and exhibition,”. Woodlands, Texas, 5–7. doi:10.2118/194371-MS
Ugueto, G. A., Haffener, J., Mondal, S., Satviski, A. A., Huckabee, P. T., and Haustveit, K. (2022). “Spatial and temporal effects on low frequency DAS and microseismic implications on hydraulic fracture geometry and well interactions,” in The SPE hydraulic fracturing technology conference and exhibition. The Woodlands, Texas, USA. doi:10.2118/209180-MS
Ugueto, G. A., Wojtaszek, M., Huckabee, P. T., Satviski, A. A., Guzik, A., Jinet, G., et al. (2021). “An integrated view of hydraulic induced fracture geometry in hydraulic fracture test site 2,” in The unconventional resources technology conference. Houston, Texas, USA. doi:10.15530/urtec-2021-5396
U.S. Energy Information Administration US tight oil production. Available at: https://www.eia.gov/petroleum/data.php#crude.
Wang, F., Xiao, Z., Liu, X., Ren, J., Xing, T., Liet, Z., et al. (2022). Strategic design of cellulose nanofibers@zeolitic imidazolate frameworks derived mesoporous carbon-supported nanoscale CoFe2O4/CoFe hybrid composition as trifunctional electrocatalyst for Zn-air battery and self-powered overall water-splitting. J. Power Sources 521, 230925. doi:10.1016/j.jpowsour.2021.230925
Wang, I. H., Fairfield, R., Courtier, J., Gray, D., and Lee, S. (2018). “Using stage level microseismic analysis to gain insight into fracture efficiency and completion effectiveness,” in The unconventional resources technology conference. Houston, Texas, USA. doi:10.15530/urtec-2018-2937228
Wang, J., Tan, Y., Rijken, P., Liu, X., Singh, A., and Liet, Y. (2021). “Observations and modeling of fiber-optics strain on hydraulic fracture height growth in HFTS-2,” in The unconventional resources technology conference held in Houston, Texas, USA, 26–28.
Wang, S., Tan, Y., Sangnimnuan, A., Khan, S., Liang, B., and Rijken, P. (2019). “Learnings from the hydraulic fracturing test site (HFTS) #1, Midland basin, west Texas - a geomechanics perspective,” in The unconventional resources technology conference, denver. Colorado, USA. doi:10.15530/urtec-2019-1570
Weddle, P., Griffin, L., and Pearson, C. M. (2018). “Mining the bakken II – pushing the envelope with extreme limited entry perforating,” in The SPE hydraulic fracturing technology conference and exhibition. The Woodlands, Texas, USA. doi:10.2118/189880-MS
Ruud, W., Nandlal, K., Tugan, M., Dusterhoft, R., Stegent, N., et al. (2020). “Wolfcamp hydraulic fracture test site drained rock volume and recovery factors visualized by scaled complex analysis method (CAM): emulating multiple data sources (production rates, water cuts, pressure gauges, flow regime changes, and b-sigmoids),” in The unconventional resources technology conference. Austin, TX, USA. doi:10.15530/urtec-2020-2434
Wicker, J., Courtier, J., Campbell, T., Lee, S., Fairfield, R., and Trowbridge, S. (2018). “Using stage level microseismic analysis to correlate and ground truth cored hydraulic fractures,” in The unconventional resources technology conference. Houston, Texas, USA. doi:10.15530/urtec-2018-2937221
Wood, T., Leonard, R., Senters, C., Squires, C., and Perry, M. (2018). “Interwell communication study of UWC and MWC wells in the HFTS,” in The unconventional resources technology conference. Houston, Texas, USA. doi:10.15530/urtec-2018-2902960
Yang, J., Hatcherian, J., Hackley, P. C., and Pomerantz, A. E. (2017). Nanoscale geochemical and geomechanical characterization of organic matter in shale. Nat. Commun. 8, 2179. doi:10.1038/s41467-017-02254-0
Yu, H., Xu, W. L., Li, Bo, Huang, H., Micheal, M., Wang, Q., et al. (2023). Hydraulic fracturing and enhanced recovery in shale reservoirs: theoretical analysis to engineering applications. Energy fuels. 37 (14), 9956–9997. doi:10.1021/acs.energyfuels.3c01029
Yu, W., Yong, R., Wu, J., Chang, C., Liu, C., Artieda, L., et al. (2021). “Investigation of complex natural fracture connectivity on well performance using EDFM,” in The 55th U.S. Rock mechanics/geomechanics symposium. Virtual.
Zhao, P., and Gray, K. E. (2021). Analytical and machine-learning analysis of hydraulic fracture-induced natural fracture slip. SPE J. 26 (04), 1722–1738. doi:10.2118/205346-PA
Keywords: shale oil, hydraulic fracturing, field test, fracturing technology, fracturing stimulation
Citation: Zhao M (2024) Field experiments and main understanding of shale oil hydraulic fracturing. Front. Earth Sci. 12:1410524. doi: 10.3389/feart.2024.1410524
Received: 01 April 2024; Accepted: 30 September 2024;
Published: 25 October 2024.
Edited by:
Hu Guo, Sinopec Research Institute of Petroleum Engineering (SRIPE), ChinaReviewed by:
Qiang Li, China University of Petroleum Beijing, ChinaLuyu Wang, Hong Kong Polytechnic University, Hong Kong, SAR China
Copyright © 2024 Zhao. This is an open-access article distributed under the terms of the Creative Commons Attribution License (CC BY). The use, distribution or reproduction in other forums is permitted, provided the original author(s) and the copyright owner(s) are credited and that the original publication in this journal is cited, in accordance with accepted academic practice. No use, distribution or reproduction is permitted which does not comply with these terms.
*Correspondence: Mengyun Zhao, emhhb215LnN5a3lAc2lub3BlYy5jb20=