 Yonghui Zhao
 Kun Hu1
- 1Qinghai Traffic Construction Management Co., Ltd., Xining, China
- 2Guizhou Geological Engineering Investigation Design and Research Institute Co., Ltd., Xining, China
This study delves into the mechanical properties of steep and rocky slopes subjected to long-term freeze-thaw actions. Considering the unique climatic conditions in cold regions, especially the significant impact of seasonal and diurnal temperature variations on slope excavation, the research focuses on a high-cold region iron ore mine. Four types of rocks commonly found in the mining area are thoroughly examined, taking into account the hydrogeological conditions of the mining area. The study systematically analyzes the mechanisms of various factors such as weathering, freeze-thaw cycles, and ice-water phase changes on the stability of cold region fractured rock masses. The research reveals that under prolonged freeze-thaw actions, crack water within the rock continuously undergoes ice-water phase changes, generating substantial freeze expansion forces that result in structural damage to the rock mass. This damage is evident not only in the development of existing microcracks but also leads to the generation of new fractures, ultimately causing deterioration in the rock mass structure. The study of the evolution patterns of freeze-thaw forces contributes to a better understanding of slope stability issues in cold region mineral resource extraction, offering crucial insights for the design, construction, and operation of related engineering projects.
1 Introduction
In the domain of cold region mineral resource exploitation, open-pit mining faces a significant impact from environmental climate conditions, particularly with respect to the pronounced effects of freeze-thaw cycles on steep and rocky slopes (Koide et al., 2016; Timofejeva et al., 2017; Wang et al., 2017). Over an extended period of freeze-thaw action, the rock mass strength diminishes, and structural weathering intensifies, especially in the case of steep rocky slopes composed of high-grade rocks (Wang et al., 2017). Furthermore, the cumulative influence of mining disturbances and seismic events contributes to an increased frequency and scale of disasters such as collapse, land-slides, and rockfalls, thereby heightening the challenges associated with prevention and mitigation (Kia et al., 2016; Yang et al., 2016; Yang et al., 2017; Li et al., 2023).
Jointed fracture rock formations are widely encountered in mining engineering, encompassing slopes, bedrock, underground projects, coal seams, and oil and gas developments (Wang et al., 2019; Dianursanti and Hafidzah, 2021; Profido et al., 2021; Sun et al., 2022). Within these formations, microcracks and joint planes directly influence the stability of the rock mass (Le Gallo et al., 2018). In the destabilization and failure process of fractured rock formations, various factors interact, including weathering, freeze-thaw cycles, ice-water phase changes, atmospheric precipitation, acid rain, engineering excavation, mining explosions, and seismic events (Hong, 2017; Yang et al., 2017; Le Gallo et al., 2018; Nittayacharn et al., 2019). Under external loading, the deformation of the rock mass and the stability of surrounding rocks exhibit complex and variable states, promoting the development of pre-existing micro-cracks within the rock mass (Ramazanov et al., 2016; Yang et al., 2016; Yevdokimov et al., 2016; Josset et al., 2017). This directly affects the design, construction, implementation, and operation of rock engineering projects and may even lead to engineering accidents. Particularly in the fractured rock formations of high-cold regions, due to the unique environmental conditions, they face prolonged and intricate challenges associated with freeze-thaw disasters (Yu et al., 2018). Under the long-term influence of freeze-thaw actions, water within the rock fractures undergoes continuous ice-water phase changes, generating substantial freeze-thaw forces that persistently drive the expansion of fractures or the formation of new cracks. As micro-cracks gradually widen and propagate, the strength of the rock diminishes, deformation increases, leading to the deterioration of the rock mass structure, ultimately exerting a significant and unavoidable impact on the stability of the entire engineered rock mass.
At present, the academic community primarily focuses on studying the characteristics of rocks under freeze-thaw conditions, centering around factors influencing their freeze-thaw damage. These factors can be broadly categorized into two types: firstly, the internal intrinsic factors of rocks, which directly determine the mechanical properties of the rock mass; secondly, external environmental factors, encompassing the complex and variable conditions that promote alterations in the mechanical properties of rocks (Ou et al., 2017). Typically, these studies aim to reflect the freeze-thaw damage to rocks by analyzing their physical properties, chemical status, mechanical characteristics, and degree of weathering. As freeze-thaw cycles progress and damage accumulates, there is a transformative shift in the rock’s characteristics, eventually leading to its failure. This process of deterioration represents a complex and nuanced evolution that warrants in-depth research to unveil its underlying mechanisms.
Yamabe conducted mechanical tests under freezing conditions on rock samples subjected to saturated and dry states. The study results indicate that the loading-unloading process of dry specimens exhibits linear behavior similar to that of elastic materials, with minimal strain deformation. However, for saturated specimens, the induced deformation is larger and not fully recoverable, implying that frozen rocks are not purely elastic mate-rials (Yu et al., 2017). Additionally, the Young’s modulus and uniaxial compressive strength values of dry specimens are significantly greater than those of wet samples. Mutluturk et al. per-formed freeze-thaw tests on various rocks, noting that the integrity of rock mass gradually diminishes with an increasing number of freeze-thaw cycles. Furthermore, there are variations in the mechanical properties of rocks (or saturated frozen rocks) under different temperature conditions (Zhang et al., 2018; Guo et al., 2021). Yamabe further investigated the uniaxial compressive strength of dry and saturated samples of Sirahama sandstone at five temperatures: 20°C, −5°C, −7°C, −10°C, and −20°C. The results show that the uniaxial compressive strength of dry samples is significantly greater than that of wet samples, and the strength increases progressively with decreasing temperature.
Xu et al. conducted compressive strength tests on saturated and dry red sandstone and shale within the temperature range of −20°C to 20°C (Adjonu et al., 2023). They found that as the temperature decreases, the compressive strength and elastic modulus of the rocks gradually increase. Particularly in the temperature range of −5°C to −20°C, there is a significant increase in compressive strength and elastic modulus. Argandofta et al. utilized X-ray tomography to observe changes in pore structure characteristics of limestone under freezing-thawing conditions from −15°C to −10°C (Wang et al., 2022). They observed that the rock samples produced granular fragments after seven freeze-thaw cycles, and through-going cracks after 12 freeze-thaw cycles. Mutlütürk et al. conducted freeze-thaw integrity tests on 10 different types of rocks, indicating significant differences in the progressive breakdown rates of different types of rocks under the same number of freeze-thaw cycles (Li et al., 2021). Tan carried out damage deterioration characteristic tests on muscovite granite from Tibet for 0 to 150 freeze-thaw cycles (temperature cycling from +40°C to −40°C) (Zhang et al., 2022). The research findings reveal that with an increase in the number of freeze-thaw cycles, compressive strength, elastic modulus, and cohesion exhibit exponential decay, while axial peak strain gradually increases. It is noteworthy that the internal friction angle remains relatively stable during the freeze-thaw cycles.
Numerous studies have been dedicated to measuring freeze-thaw forces within rock fractures, but most of these investigations have focused on individual influencing factors. A comprehensive and in-depth understanding of how multiple factors collectively influence the evolution of freeze-thaw forces is still lacking in the current academic literature. This study, set against the engineering backdrop of an iron ore mine in a high-cold region, selects four common rock types prevalent in the mining area as the subject of investigation. Considering the hydrogeological conditions, seasonal temperature fluctuations, and diurnal temperature variations at the mining site, the aim is to explore in-depth the changing patterns of freeze-thaw forces under the combined influence of multiple factors. The goal is to provide a more accurate and comprehensive theoretical basis for relevant engineering practices.
2 Methods
2.1 Geological overview
This study focuses on the Beizhan openpit iron ore mine located in a high-cold region, as shown in Figure 1. The specific geographic coordinates of the mining area range from 85°32′52″ to 85°33′46″ east longitude and 43°14′44″ to 43°15′04″ north latitude, covering a total area of 0.72 square kilometers. To facilitate transportation, a 17-km gravel-hardened road has been constructed between the mining area and the Beizhan iron ore living area.
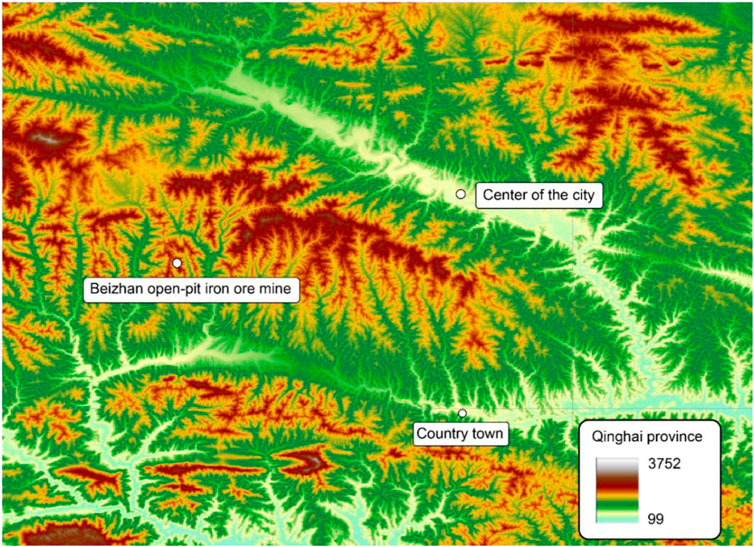
Figure 1. Preparation for iron ore remote sensing geographic location map.
In the vicinity of the mining area, the Tianshan mountain ridge is clearly visible, characterized by steep slopes and perennial glacier coverage. Distinctive features of glacial topography, such as sharp-edged iceeroded cliffs and glacier Ushaped valleys, are widespread. The Beizhan mining area falls within a continental temperate semiarid climate zone, surrounded by permanent glaciers of the Quaternary period, resulting in a cold climate with year-round snow accumulation. The climate is characterized by frequent rain and snow throughout the year, long and extremely cold winters with strong winds. Temperature fluctuations are significant, ranging from a minimum of −40°C to a maximum of 20°C.
The mining area has well-developed water systems, with the surrounding rivers classified as alpine juvenile rivers. These rivers flow year-round, rarely freezing, and their primary sources include snowmelt and atmospheric precipitation, ensuring abundant water supply due to the convergence in the mountain valleys.
In terms of engineering geology, the rock formations in the mining area are categorized into three major types based on stratigraphic characteristics: Quaternary loose soil layers, Carboniferous stratified rock layers, and blocky rock layers. The rock structures surrounding the magnetite ore body exhibit significant development of structural surfaces, leading to poor rock mass integrity. The internal cohesion of the roof and floor rocks is relatively weak, with interlayer bonding forces also being comparatively low.
In the context of engineering geology in the mining area, the division of lithological units is based on a detailed analysis of their stratigraphic characteristics. According to the geological characteristics of the strata, the engineering geological lithological units within the mining area can be classified into three major categories: Quaternary loose soil units, Carboniferous layered rock units, and block rock units. To describe the engineering geological characteristics of each lithological unit more accurately, we further subdivide the lithological units into five specific units based on geological epoch types, stratigraphic divisions, and the engineering geological characteristics of the surrounding rocks, and assign corresponding codes:
(1) Quaternary loose layer lithological unit (Code A): This unit is mainly composed of Quaternary loose sediments, with low density and high porosity. Its engineering geological properties mainly manifest as looseness and susceptibility to deformation.
(2) Lower Carboniferous layered rock lithological unit (Code B): This unit consists of layered rocks formed in the early Carboniferous period, characterized by well-developed bedding and relatively homogeneous rock properties. Its engineering geological properties manifest as stable layered structures.
(3) Block rock lithological unit (Code C): This unit is composed of rock with blocky structures, lacking distinct bedding or layered structures. Its engineering geological properties typically manifest as overall stability, but local discontinuities such as fractures or faults may exist.
(4) Siliceous schist lithological unit at the top and bottom of the magnetite orebody (Code D): This unit specifically refers to the siliceous schist located at the top and bottom of the magnetite orebody. Its engineering geological properties are influenced by the magnetite orebody, typically exhibiting high hardness and brittleness, and may be accompanied by geological phenomena such as hydrothermal alteration.
(5) Magnetite ore block rock lithological unit (Code E): This unit is composed of blocky rocks within the magnetite orebody. Its engineering geological properties mainly manifest as high hardness, high density, and good overall stability. However, attention should be paid to its potential magnetic characteristics and corresponding magnetic effects.
For a detailed engineering geological classification and stability assessment of each lithological unit, refer to Table 1. This table systematically summarizes and evaluates the engineering geological characteristics of each lithological unit based on field surveys and laboratory analyses, providing important reference data for engineering design and construction in the mining area.
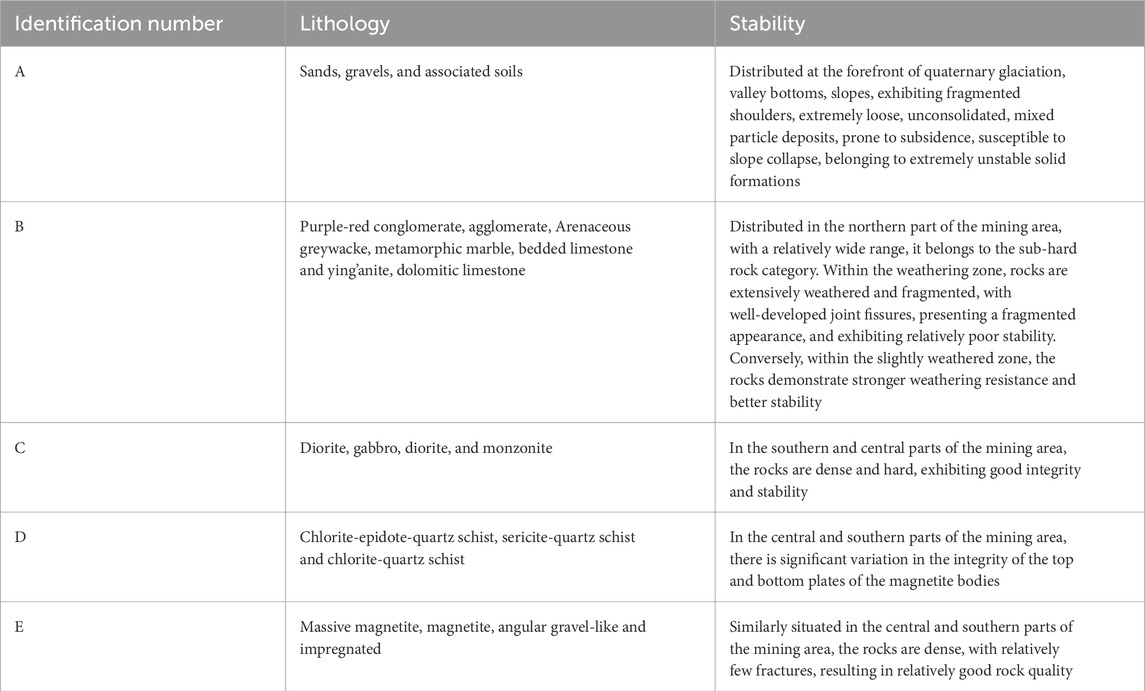
Table 1. Stratigraphic subdivision data.
Additionally, the terrain in the mining area is steep with significant slope gradients, and the rocks are fragmented with distinct joint development, accompanied by small-scale rock layer fractures. Due to insufficient vegetation, the overall geological features of the mining area present a morphology of two slopes enclosing a valley: the east and west slopes forming the mining area’s excavation slopes, while the north and south slopes constitute the spoil disposal area.
2.2 Specimen preparation
In the open-pit slope area of the Beizhan iron ore mine, rock core collection and statistical work were carried out. During this process, several large rock blocks with a diameter of 0.5 m were obtained, as shown in Figure 2. To ensure the integrity of the rock samples and the accuracy of subsequent experiments, the rock blocks were deeply marked, briefly described, and wrapped in plastic foam for preservation.
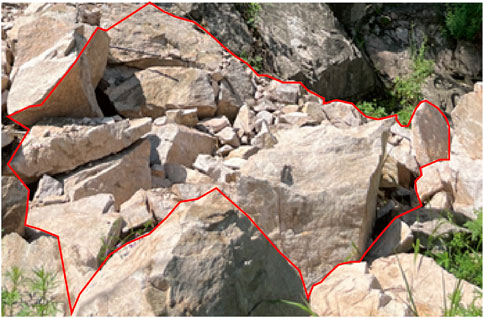
Figure 2. Rock collected at the mine.
Following the relevant requirements of the “Code for Rock Testing in Hydraulic and Hydroelectric Engineering,” we conducted detailed processing of the large rock samples collected on-site. Through drilling, cutting, and grinding steps, we processed the rock samples into standard cylindrical specimens with dimensions of
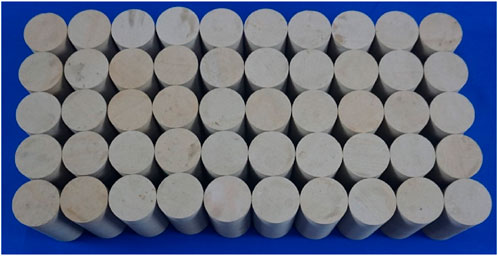
Figure 3. Prepared rock specimens.
For an in-depth study of the strength evolution of different open-type cracks under freeze-thaw action, we employed high-pressure water jet technology to treat standard cylindrical granite specimens, as shown in Figure 4. By using high-pressure nozzles with diameters of 0.75, 1.5, and 2 mm, we successfully cut through the rock samples to create cracks of different size specifications. Specifically, we generated prefabricated cracks with widths of 1, 2, and 3 mm, and under the same crack width conditions, further cut cracks with lengths of 12, 24, and 36 mm. This precise processing method provided a reliable experimental foundation for subsequent freeze-thaw strength research.
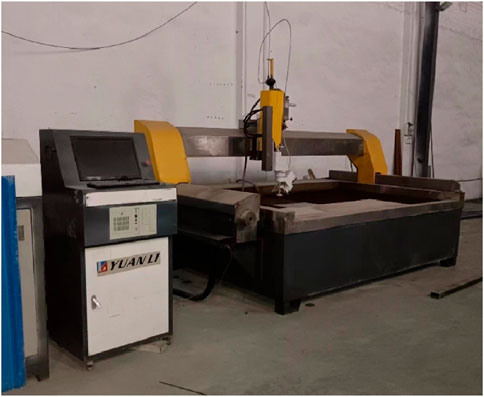
Figure 4. Preparation of rock specimen cracks by cutting.
2.3 Experiment
Following the preparation of rock specimens containing prefabricated cracks, we subjected the rock samples to a 24-hour vacuum saturation treatment using a vacuum saturator, followed by freeze-thaw cycling experiments. To accurately monitor the evolution of freeze-thaw forces during the water-ice phase transition, we employed an 8-channel freeze-thaw measurement system for real-time measurements, as shown in Figure 5. The system consisted of an ultra-low temperature freezer, real-time freeze-thaw force monitoring software, FSR400 thin-film pressure sensors (sized 38 mm in length × 6 mm in width), and temperature sensors as core components.
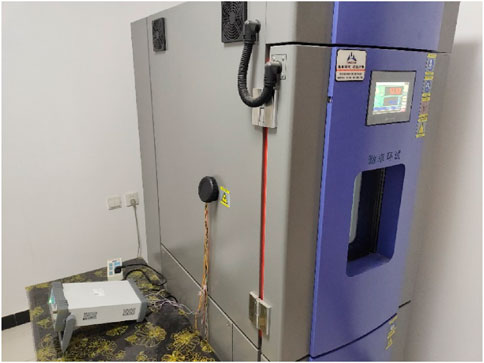
Figure 5. Freeze-thaw strength testing machine.
The FSR400 thin-film pressure sensor served as a crucial component of this system, constructed from flexible nano-functional materials, providing both waterproof and pressure-sensitive capabilities. Its operating principle involved the conversion of pressure to resistance through the thin-film pressure pad, enabling high-sensitivity pressure measurements. As the pressure on the thin-film pressure pad increased, the resistance value of the pressure pad gradually decreased. The sensor’s driving force was 0.2 N, with a sensitivity range from 0.2 N to 20 N, and an operating temperature range from −50°C to 85°C. During the testing process, the data acquisition frequency for freeze-thaw forces was set to 5 Hz, while the temperature sensor utilized a waterproof metal probe with an accuracy of ±0.2°C, a recording range of −200°C to 80°C, and a data acquisition frequency of 5 Hz as well.
In the design and selection of pressure measurement systems, the FSR400 thin film pressure sensor has become a critical component due to its unique advantages. This sensor is meticulously crafted from flexible nanomaterials, offering not only outstanding waterproof performance but also pressure-sensitive capabilities, allowing it to operate stably and reliably in various environments. Particularly in applications requiring highly sensitive and durable pressure detection, the FSR400 thin film pressure sensor is the preferred choice. The operating principle of the FSR400 thin film pressure sensor is based on the piezoresistive effect. When external pressure acts on the thin film pressure pad on the sensor surface, the film undergoes slight deformation. This deformation causes a change in the resistance network structure within the film, resulting in a change in resistance value. Specifically, as the pressure on the thin film pressure pad increases, the resistance value decreases, and this change can be precisely measured by the circuit. Through this method, the FSR400 thin film pressure sensor achieves high-sensitivity pressure measurement and finds extensive applications in various scenarios requiring precise pressure control.
The driving force and sensitivity range of the sensor are among its key performance parameters. To ensure the accuracy of the FSR400 thin film pressure sensor in testing, the driving force of the FSR400 thin film pressure sensor is 0.2 N, with a sensitivity range from 0.2 N to 20 N, meaning it can provide accurate measurements across a wide pressure range. To monitor the real-time impact of environmental temperature on sensor performance, we employ a waterproof metal probe as a temperature sensor. This temperature sensor boasts high precision (±0.2°C) and a wide recording range (−200°C to 80°C), ensuring accurate understanding of temperature variations in the sensor’s operating environment. During testing, we set the data acquisition frequency of the temperature sensor to 5 Hz, matching the data acquisition frequency of the FSR400 thin film pressure sensor, to ensure simultaneous acquisition of pressure and temperature data for comprehensive analysis.
To ensure the precision of the experiments, we connected all testing instruments to a computer and continuously collected freeze-thaw force and temperature data during the freezing and thawing processes of crack water. The specific experimental steps are outlined below:
Firstly, the rock samples underwent water saturation treatment. The rock specimens with prefabricated cracks were immersed in water naturally for 48 h to achieve water saturation. Subsequently, high-viscosity waterproof tape was applied to seal and water-proof one end of the through cracks. The FSR400 thin-film pressure sensors were also waterproofed.
Secondly, pressure calibration for freeze-thaw forces was conducted. Prior to freeze-thaw force testing, channels 1 to 8 were sequentially connected to the sensors, and a known standard pressure of 100 N was applied to each sensor. The software system displayed a specific pressure value. By inputting the pressure calibration coefficient, the system desktop showed the calibrated 100 N pressure. Saving the calibration coefficients completed the mechanical conversion relationship calibration for the software.
Next, the rock specimens underwent freezing treatment. The test samples were placed in an ultra-low-temperature environmental chamber, and water was injected into the cracks of the specimens. After water injection, the natural state of water-filled cracks in natural conditions was simulated. Subsequently, the waterproofed thin-film pressure sensors and temperature sensor probes were placed in the middle of the crack in the specimen. The freeze-thaw force acquisition software and temperature recorder were activated to record and observe the freeze-thaw force curve and temperature trend during the freezing process. When the freeze-thaw force acquisition system displayed a gradual decrease from high values to a low stable value, it indicated that the water had completely condensed into ice.
Afterward, the rock specimens underwent thawing treatment. The frozen rock samples were taken out and placed at room temperature for natural thawing. Simultaneously, the freeze-thaw force curve and temperature curve were recorded and observed during the melting process, representing the complete melting of ice into water. After completing the experiment, data collection was stopped, and the data were saved.
Finally, by iteratively conducting the third and fourth steps outlined above, we obtained freeze-thaw force and temperature data for crack water under multiple freeze-thaw cycles. These steps collectively constituted the entire process of freezing and melting of crack water, achieving freeze-thaw force testing for one freeze-thaw cycle.
3 Results and discussion
3.1 Effect of single freeze-thaw cycle on freeze-thaw forces
After conducting the freeze-thaw cycle tests, we obtained the typical freeze-thaw force evolution curve for rock prefabricated cracks during a single freeze-thaw process as shown in Figure 6.
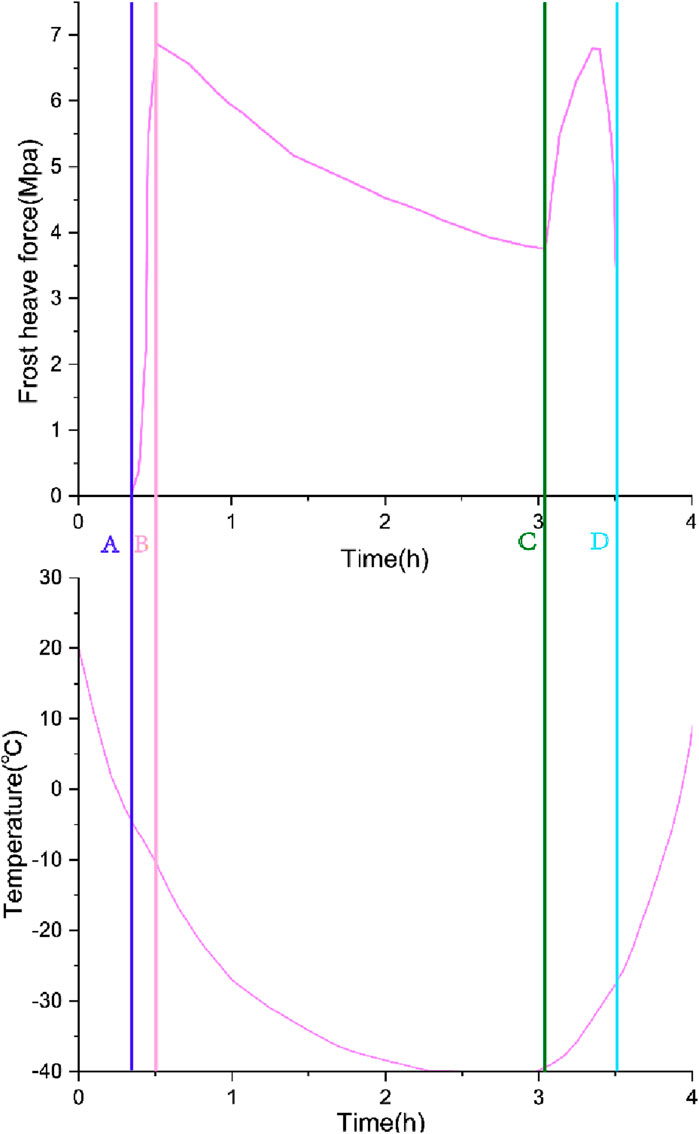
Figure 6. Single frost heave force and temperature evolution curve.
Based on the illustrated Figure 6, the evolution of freeze-thaw forces in crack water can be divided into five typical stages, each characterized by specific freeze-thaw evolution features and corresponding freezing mechanisms as described below:
(1) Freeze-thaw Incubation Stage: In this stage, the temperature gradually decreases from 20°C to zero. During this process, crack water begins to transform into a mixture of ice and water, undergoing initial freezing. However, no freeze-thaw force is generated in the prefabricated crack during this stage.
(2) Rapid Increase in Freeze-thaw Force Stage: As the temperature continues to drop, the degree of freezing of the specimen gradually increases. The water-ice phase transition within the crack leads to the generation of significant freeze-thaw forces. In particular, when the temperature drops to approximately −5°C, freeze-thaw forces start to increase significantly. For granite crack water (gap width = 2 mm, gap length = 24 mm), the maximum freeze-thaw force reaches 5.78 MPa.
(3) Steady Decline Stage: In this stage, as the temperature continues to decrease, freeze-thaw forces gradually decrease and tend to stabilize. This is mainly due to two rea-sons: firstly, the density of ice changes with temperature, and during the process where crack ice decreases from 0°C to −40°C, the crystal structure of ice changes, resulting in in-creased density and reduced volume, causing freeze-thaw forces to slowly decrease. Secondly, freeze-thaw leads to cracking of the rock wall, continuous expansion of rock microcracks, causing freeze-thaw forces to gradually disperse and disappear.
(4) Temperature Rise Freeze-thaw Stage: After freeze-thaw forces stabilize, the specimen is removed from the low-temperature chamber and allowed to melt at room temperature. With increasing temperature, secondary freeze-thaw forces are generated within the crack ice, and for granite cracks, the freeze-thaw forces generated during temperature rise reach 5.26 MPa. The mechanism of temperature rise freeze-thaw consists of two parts: the change in ice density as crack ice changes from −40°C to 0°C, and the regelation theory. The latter involves the gradual melting of crack ice during the melting process, migrating towards the rock wall and ice interface under the influence of gravity and hydrostatic pressure, generating secondary freeze-thaw when encountering internally supercooled ice. It is noteworthy that due to the continuous occurrence of regelation, the duration of temperature rise freeze-thaw (approximately 30 min) is significantly longer than the duration of freeze-thaw caused by water-ice phase transition (approximately 1–2 min). However, temperature rise freeze-thaw forces are usually smaller than the initial peak freeze-thaw forces, which is related to the damage generated on the rock wall during the initial freeze-thaw process.
Figure 7 present the linear expansion coefficients of ice. From the Figure, it can be observed that solid ice exhibits thermal expansion and contraction phenomena below zero degrees. Specifically, the linear expansion coefficient of 0°C ice is 111.2% of that of −40°C ice. Therefore, as the temperature increases, the volume of ice gradually increases, leading to the phenomenon of temperature rise freeze-thaw in crack ice.
(5) Melting Stage: In this stage, the ice in the crack gradually melts, and the freeze-thaw damage phenomenon disappears, with freeze-thaw forces rapidly decreasing to zero. The aforementioned stages collectively constitute the complete evolution process of freeze-thaw forces in crack water, lasting approximately 4 h.
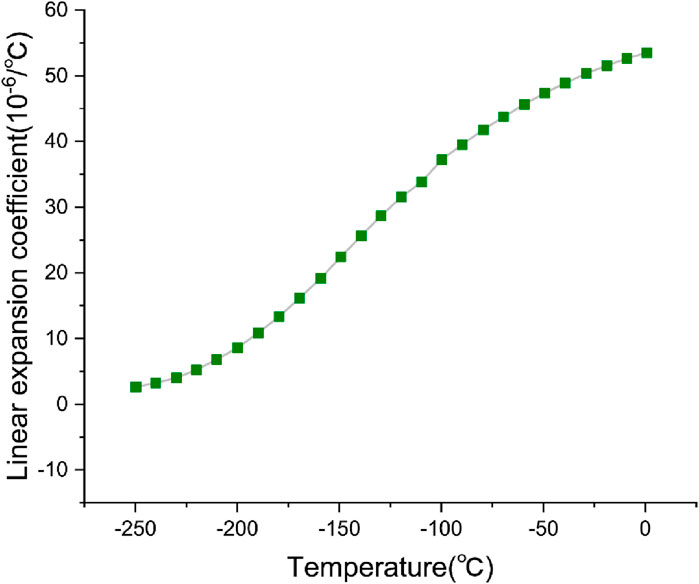
Figure 7. The coefficient of linear expansion of ice.
3.2 Effect of crack length on freeze-thaw forces
The study selected prefabricated crack specimens with a constant gap width (2 mm) but varying gap lengths (12, 24, 36 mm) as experimental subjects. Through a care-fully designed experimental procedure, we plotted the curves showing the variation of freeze-thaw forces over time for different crack lengths. Each specimen underwent six rigorous freeze-thaw cycles, and the results are presented in Figures 8–10.
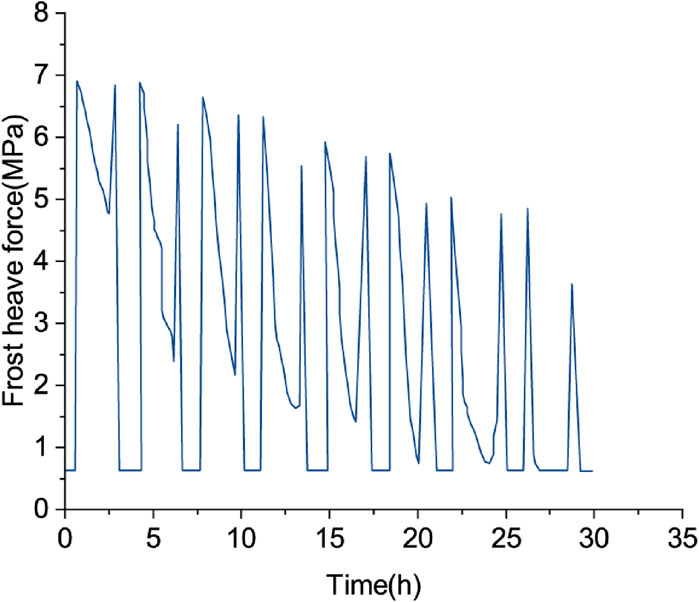
Figure 8. Crack length 12 mm frost heave force duration curve.
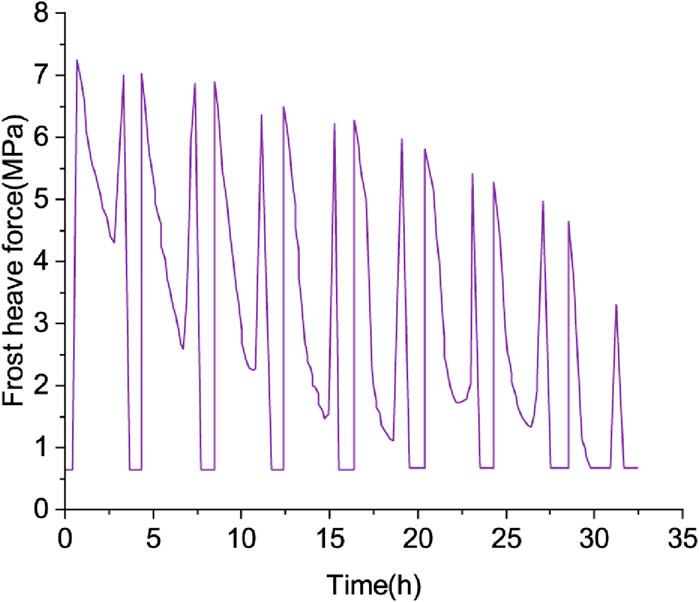
Figure 9. Crack length 24 mm frost heave force duration curve.
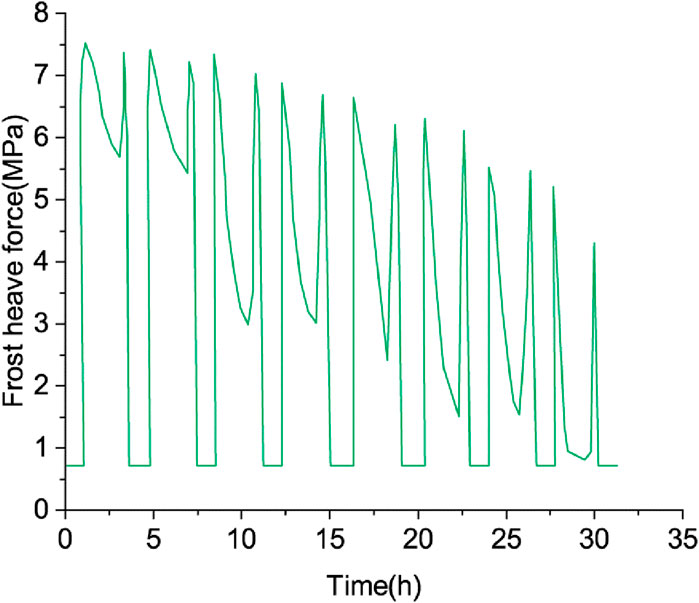
Figure 10. Crack length 36 mm frost heave force duration curve.
Observing the Figures 8–10, it is evident that there are significant differences in the peak freeze-thaw forces experienced by each specimen during the first freeze-thaw cycle. Specifically, when the gap length is 12 mm, the peak freeze-thaw force is 6.84 MPa; as the gap length increases to 24 mm, the peak freeze-thaw force reaches 7.09 MPa; and when the gap length further extends to 36 mm, the peak freeze-thaw force reaches 7.31 MPa. This trend clearly indicates that with an increase in crack length, the corresponding crack volume increases, allowing for the accommodation of more crack water, resulting in the accumulation of larger freeze-thaw forces.
3.3 Effect of crack width on freeze-thaw forces
The study selected prefabricated crack specimens with a crack length of 24 mm and crack widths of 1, 2, and 3 mm as experimental subjects. Through six freeze-thaw cycles on these specimens, we plotted the freeze-thaw force-duration curves under different crack widths, as shown in Figures 11–13.
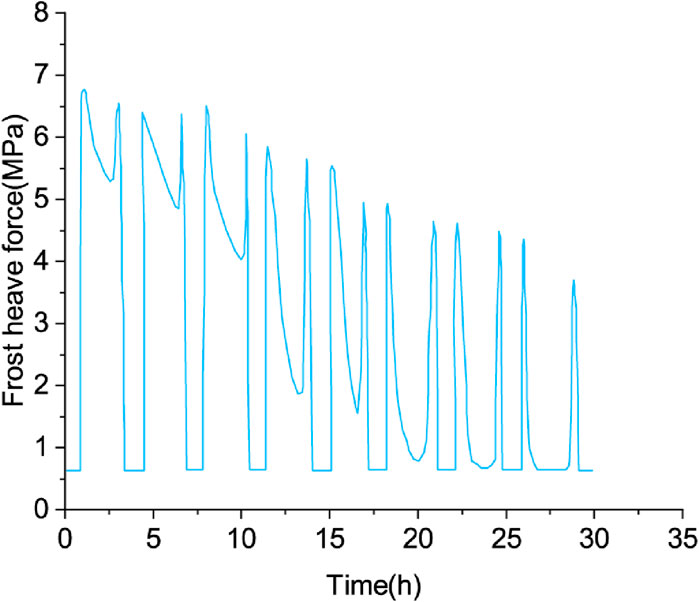
Figure 11. Crack width 1 mm frost heave force duration curve.
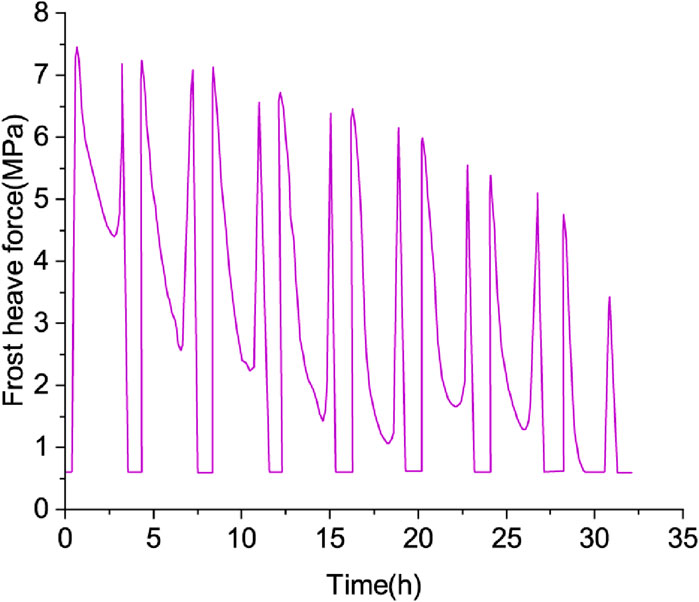
Figure 12. Crack width 2 mm frost heave force duration curve.
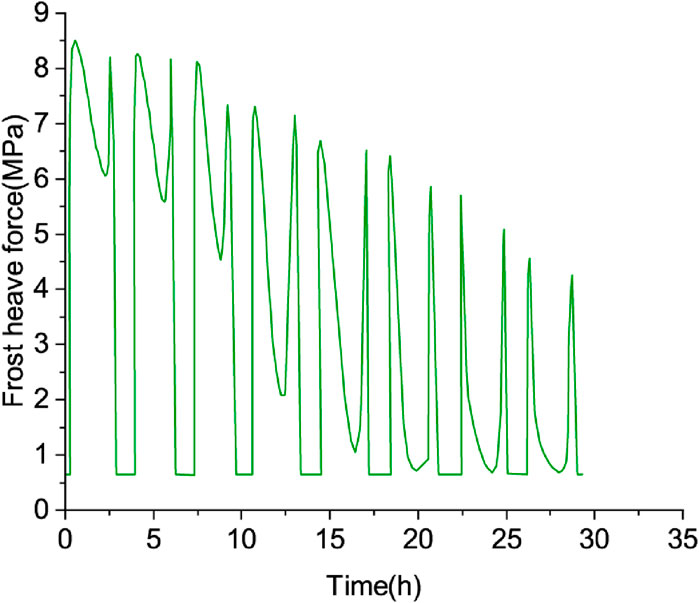
Figure 13. Crack width 3 mm frost heave force duration curve.
Observing the Figures 11–13, it can be observed that the multi-cycle freeze-thaw force evolution patterns of specimens with different crack widths exhibit similar trends to the freeze-thaw force decay patterns of specimens with different crack lengths in previous studies. During the first freeze-thaw cycle, the peak freeze-thaw forces produced by each specimen were 6.21 MPa (width 1 mm), 7.09 MPa (width 2 mm), and 8.45 MPa (width 3 mm). This result indicates that changes in crack width significantly affect the crack volume, thereby influencing the freeze-thaw forces generated by stored crack water. Specifically, the wider the crack width, the greater the peak freeze-thaw force generated by the specimen.
Meanwhile, it can be observed that, under constant gap width conditions, there is no significant trend in the variation of peak freeze-thaw forces with increasing gap length. However, when the gap length remains constant, an evident increasing trend in peak freeze-thaw forces is observed with increasing gap width. Upon further investigation, it is found that the increase in gap width significantly promotes the enlargement of the crack ice volume, a magnitude far surpassing the effect of increased gap length. Consequently, this facilitates the accumulation of larger freeze-thaw forces within the crack.
With an increase in the number of freeze-thaw cycles, the freeze-thaw force decay rates under each width gradually accelerate. Particularly, it is evident from Figures 11–13 that the specimen with a width of 3 mm exhibits the highest peak freeze-thaw force decay rate, indicating a greater susceptibility to freeze-thaw damage for this specimen.
4 Conclusion
This study revealed five typical stages in the evolution of freeze-thaw forces and identified temperature and crack dimensions as the primary factors influencing the magnitude of freeze-thaw forces, with temperature playing a decisive role. As temperature de-creases and increases, crack water produces peak freeze-thaw forces and secondary warming freeze-thaw forces, respectively. Furthermore, an increase in the water content within cracks enlarges the frozen ice volume, accumulating greater freeze-thaw forces. In this process, the influence of temperature is most significant, followed by crack width and length. Larger freeze-thaw forces promote the expansion of microscopic cracks in rock walls, intensifying damage to large-scale fractured rock masses after multiple freeze-thaw cycles, with a noticeable decline in freeze-thaw forces. This study deepens the under-standing of the freeze-thaw force mechanism in cracks, providing crucial insights for assessing rock mass freeze-thaw damage.
Data availability statement
The original contributions presented in the study are included in the article/Supplementary Material, further inquiries can be directed to the corresponding author.
Author contributions
YZ: Methodology, Writing–original draft. KH: Investigation, Resources, Writing–review and editing. DH: Investigation, Resources, Writing–review and editing. YL: Investigation, Resources, Writing–review and editing. LZ: Formal Analysis, Software, Writing–review and editing.
Funding
The author(s) declare that financial support was received for the research, authorship, and/or publication of this article. This research is financially supported by the Key R$D and Transformation Plan of Qinghai Province (2023-GX-C06).
Conflict of interest
Authors YZ, KH, DH, and YL were employed by Qinghai Traffic Construction Management Co., Ltd. Author LZ was employed by Guizhou Geological Engineering Investigation Design and Research Institute Co., Ltd.
Publisher’s note
All claims expressed in this article are solely those of the authors and do not necessarily represent those of their affiliated organizations, or those of the publisher, the editors and the reviewers. Any product that may be evaluated in this article, or claim that may be made by its manufacturer, is not guaranteed or endorsed by the publisher.
References
Adjonu, R., Doran, G., Torley, P., and Agboola, S. (2023). Stability of whey protein bioactive peptide-stabilised nanoemulsions: effect of pH, ions, heating and freeze–thawing. Int. J. Food Sci. Technol. 58 (4), 1787–1794. doi:10.1111/ijfs.16292
Dianursanti, D., and Hafidzah, M. A. (2021). The enhancement of phycocyanin yield and purity from Spirulina platensis using freeze-thawing method on various solvents. AIP Conf. Proc. 2344 (1). doi:10.1063/5.0047581
Guo, Y. L., Wu, M., Li, R. Q., Cai, Z., and Zhang, H. (2021). Thermostable physically crosslinked cryogel from carboxymethylated konjac glucomannan fabricated by freeze-thawing. Food Hydrocoll. 122, 107103. doi:10.1016/j.foodhyd.2021.107103
Hong, K. H. (2017). Polyvinyl alcohol/tannic acid hydrogel prepared by a freeze-thawing process for wound dressing applications. Polym. Bull. 74 (7), 2861–2872. doi:10.1007/s00289-016-1868-z
Josset, S., Hansen, L., Orsolini, P., Griffa, M., Kuzior, O., Weisse, B., et al. (2017). Microfibrillated cellulose foams obtained by a straightforward freeze–thawing–drying procedure. Cellulose 24, 3825–3842. doi:10.1007/s10570-017-1377-8
Kia, H. D., Razavian, S. M., Dodran, H. V., et al. (2016). Effect of adding Rosa canina extract and Ascorbic Acid as natural and Synthetic antioxidants on freeze-thawing process of ram semen. Anim. Repord 13, 567.
Koide, H., Okamoto, A., Tsuchida, H., Ando, H., Ariizumi, S., Kiyokawa, C., et al. (2016). One-step encapsulation of siRNA between lipid-layers of multi-layer polycation liposomes by lipoplex freeze-thawing. J. Control. Release 228, 1–8. doi:10.1016/j.jconrel.2016.01.032
Le Gallo, M., de la Motte Rouge, T., Poissonnier, A., Lavoué, V., Tas, P., Leveque, J., et al. (2018). Tumor analysis: freeze–thawing cycle of triple-negative breast cancer cells alters tumor CD24/CD44 profiles and the percentage of tumor-infiltrating immune cells. BMC Res. Notes 11, 401–420. doi:10.1186/s13104-018-3504-5
Li, J. H., Sonje, J., and Suryanarayanan, R. (2023). Role of Poloxamer 188 in preventing ice-surface-induced protein destabilization during freeze–thawing. Mol. Pharm. 20 (9), 4587–4596. doi:10.1021/acs.molpharmaceut.3c00312
Li, Y., Li, B., Zhang, L., Ma, C., Zhu, J., Li, M., et al. (2021). Chloride ion corrosion pattern and mathematical model for C60 high-strength concrete after freeze-thawing cycles. Adv. Civ. Eng. 2021, 1–11. doi:10.1155/2021/5523499
Nittayacharn, P., Dai, K., Therdrattanawong, C., et al. (2019). The effect of freeze/thawing on the physical properties and acoustic performance of perfluoropropane nanobubble suspensions. IEEE Int. Ultrason. Symp. (IUS), 2279–2282. doi:10.1109/ULTSYM.2019.8926224
Ou, K. K., Dong, X., Qin, C. L., Ji, X., and He, J. (2017). Properties and toughening mechanisms of PVA/PAM double-network hydrogels prepared by freeze-thawing and anneal-swelling. Mater. Sci. Eng. C. Mater. Biogical Appl. 77, 1017–1026. doi:10.1016/j.msec.2017.03.287
Porfido, C., Rizzo, R. E., Healy, D., Spagnuolo, M., Terzano, R., and Allegretta, I. (2021). Investigating the evolution of fractures in clay–based ceramics during repeated freeze-thawing cycles using X-ray micro-computed tomography and image analysis. Mat. Charact. 177, 111185. doi:10.1016/j.matchar.2021.111185
Ramazanov, V. V., Volovelskaya, E. L., and Bondarenko, V. A. (2016). Thromboplastic activity of erythrocytes after freeze-thawing in combined media. Probl. Kriobiol. Kriomed. 26 (3), 229–237. doi:10.15407/cryo26.03.229
Sun, J. H., Deng, Y. F., Li, S. H., Xu, W., and Liu, G. (2022). Enhanced efficiency of enzymatic hydrolysis of wheat straw via freeze–thaw pretreatment. Environ. Sci. Pollut. Res. 29, 56696–56704. doi:10.1007/s11356-022-18893-w
Timofejeva, A., D'Este, M., and Loca, D. (2017). Calcium phosphate/polyvinyl alcohol composite hydrogels: a review on the freeze-thawing synthesis approach and applications in regenerative medicine. Eur. Polym. J. 95, 547–565. doi:10.1016/j.eurpolymj.2017.08.048
Wang, L., Qi, Y., Dong, Y., Peng, Q., Guo, S., He, Y., et al. (2017). Effects and mechanism of freeze-thawing cycles on the soil N2O fluxes in the temperate semi-arid steppe. J. Environ. Sci. 56, 192–201. doi:10.1016/j.jes.2016.09.013
Wang, S. Y., Zhang, C., Liu, Q. Q., Wang, Z. J., Wan, K. X., Qian, J. Y., et al. (2022). Modification of potato starch by critical melting pretreatment combined with freeze-thawing: preparation, morphology, structure, and functionality. LWT 158, 113109. doi:10.1016/j.lwt.2022.113109
Wang, Z., Zhou, W. W., Zhang, Z. G., et al. (2019). Comparison of pregnancy outcome after D5 and D6 blastocyst under freeze-thawing in two kinds of embryo transfer catheter. Acta Univ. Med. Anhu.
Yang, L., Sun, W., Liu, C., Zhang, Y., and Liang, F. (2017). Water absorption and chloride ion penetrability of concrete damaged by freeze-thawing and loading. J. Wuhan Univ. Technology-Mater. Sci. Ed. 32 (2), 330–337. doi:10.1007/s11595-017-1599-5
Yang, R. Q., Feng, L., Wang, S., Yu, N., and Gu, Z. (2016). Accumulation of -aminobutyric acid in soybean by hypoxia germination and freeze–thawing incubation. J. Sci. Food Agric. 96, 2090–2096. doi:10.1002/jsfa.7323
Yevdokimov, I., Larionova, A., and Blagodatskaya, E. (2016). Microbial immobilisation of phosphorus in soils exposed to dry-ing-rewetting and freeze-thawing cycles. Biol. Fertil. Soils 52, 685–696. doi:10.1007/s00374-016-1112-x
Yu, K. K., Zhang, Y., Zhao, R. Y., Zhang, Y., and Zhao, L. (2017). Effect of multiple cycles of freeze–thawing on the RNA quality of lung cancer tissues. Cell Tissue Bank. 18, 433–440. doi:10.1007/s10561-016-9600-7
Yu, L., Zhao, A. Q., Yang, M., Wang, C. J., Wang, M. M., and Bai, X. (2018). Effects of the combination of freeze-thawing and enzymatic hydrolysis on the microstructure and physicochemical properties of porous corn starch. Food Hydrocoll. 83, 465–472. doi:10.1016/j.foodhyd.2018.04.041
Zhang, C., Han, J. A., and Lim, S. T. (2018). Characteristics of some physically modified starches using mild heating and freeze-thawing. Food Hydrocoll. 77, 894–901. doi:10.1016/j.foodhyd.2017.11.035
Keywords: high-cold region, rock mechanics, freeze-thaw action, freeze expansion force, rock crack
Citation: Zhao Y, Hu K, Han D, Lang Y and Zhang L (2024) Multifactor-coupled study on freeze-thaw forces of rocks in cold regions. Front. Earth Sci. 12:1404153. doi: 10.3389/feart.2024.1404153
Received: 20 March 2024; Accepted: 24 July 2024;
Published: 06 August 2024.
Edited by:
Pengjiao Jia, Soochow University, ChinaReviewed by:
Juan Yang, Shanghai Institute of Technology, ChinaGuo Xiaolong, Shijiazhuang Tiedao University, China
Copyright © 2024 Zhao, Hu, Han, Lang and Zhang. This is an open-access article distributed under the terms of the Creative Commons Attribution License (CC BY). The use, distribution or reproduction in other forums is permitted, provided the original author(s) and the copyright owner(s) are credited and that the original publication in this journal is cited, in accordance with accepted academic practice. No use, distribution or reproduction is permitted which does not comply with these terms.
*Correspondence: Lin Zhang, bGluejY1ODMwQGdtYWlsLmNvbQ==