- 1Center for Water Resources Development, Bandung Institute of Technology, Bandung, Indonesia
- 2Center for Coastal and Marine Development, Bandung Institute of Technology, Bandung, Indonesia
- 3Faculty of Civil and Environmental Engineering, Bandung Institute of Technology, Bandung, Indonesia
- 4Department of Environmental and Civil Engineering, Toyama Prefectural University, Toyama, Japan
The relocation of the national capital from DKI Jakarta to the East Kalimantan region and its people migration requires energy escalation. This project will require an additional 1,555 MW of electricity from existing conditions. In line with Indonesia's clean energy transition, this need can be addressed by developing renewable energy infrastructure, particularly hydropower. This study evaluates the hydropower potential in the Mahakam River using a run-of-river scheme. Given the limited availability of hydro-climatological ground stations, satellite data such as CFSR-TRMM, SRTM DEM, DSMW, and land-cover data were utilized, supported by the SWAT rainfall-runoff model for hydrological analysis. Data calibration was applied, and discharge results were analyzed using a new diversion algorithm to estimate potential power output. Innovative resampling of headrace arrangements was introduced to mitigate potential hydropower conflict sites. Social factors, including protected areas and water transportation routes, were also incorporated to minimize land disputes. The study identified 25 mini-hydropower sites and 16 micro-hydropower sites with a total capacity of 105.4 MW and 9 MW, respectively. These small-scale hydropower systems could supply 3.4% of the projected electricity demand for the new capital city called Nusantara (IKN), and potentially reduce annual carbon emissions by approximately 480,000 tons. The use of satellite data requires meticulous attention to ensure that data acquisition and processing yield reliable results while accurately reflecting field conditions. This research position also provides an initial overview of energy transition strategies in the IKN area through hydropower development and the subsequent potential assessment.
1 Introduction
Indonesia has been gradually relocating its capital from Jakarta to the North Penajam Paser area since the enactment of Law Number 3 of 2022. This move is driven by several factors including population density, economic contributions, land use, environmental degradation, and water issues (Kementerian PPN/Bappenas, 2021). The relocation will shift the governmental and administrative centers to the new location, while Jakarta will remain the economic hub of Indonesia. The population in the new capital is projected to reach 1.7–1.9 million by 2045 due to urbanization, significantly impacting the sustainability of energy resources, particularly in the electricity sector (Alsaleh et al., 2023). Currently, East Kalimantan’s power supply capacity stands at 1,765.91 MW, requiring an additional 1,555 MW to meet the initial demands of the relocation.
Furthermore, Steam Power Plants (SPPs) contribute to over 60% of Indonesia’s electricity production, a trend also observed in East Kalimantan where they produce 834.13 MW or 47.23% of the region’s total output. This region holds the highest national coal potential, accounting for 83% of Kalimantan Island’s total coal reserves (Afin and Kiono, 2021). However, the environmental impact of these SPPs is significant, contributing to greenhouse gas emissions, diminishing air quality, and increasing the frequency of extreme weather events globally (Intergovernmental Panel On Climate Change, 2023). Coal-fired power plants produce between 675 and 1,689 gCO2-eq/kWh of emissions, significantly higher than other types of electricity generation, which are generally below 100 gCO2-eq/kWh (Whitaker et al., 2012; Amponsah et al., 2014). In Europe, the use of fossil fuels has been linked to increasing water resource pollution (Alsaleh and Abdul-Rahim, 2022a).
Under the Paris Agreement, which aims to limit global warming to 1.5°C, reducing carbon dioxide emissions is crucial. One strategy is through the development of renewable energy sources (IRENA, 2023). Indonesia’s Net Zero Emission (NZE) 2060 initiative aims to shift energy supply towards more efficient and sustainable sources by phasing out coal-fired power plants and reducing greenhouse gas emissions by 29% by 2030. By 2025, renewable energy is expected to contribute 23% to the energy mix, increasing to 26.5% by 2030, with a significant role played by hydropower, geothermal, and solar energy (Ministry of Energy and Mineral Resources (ESDM), 2021).
Since the first hydropower plant was built in 1771, hydropower has become a significant global energy source, contributing over 15% of the world’s electricity in 2022 with a total installed capacity of 1,397 GW (International Hydropower Association, 2023). Indonesia, with its vast potential alongside countries like Colombia, Myanmar, and Madagascar, ranks sixth among over 20 countries in East Asia and the Pacific for hydropower capacity at 6,602 MW—much lower than the potential capacity of about 75,000 MW (Erinofiardi et al., 2017). With an average surface water potential of 2.78 trillion m3/year (Radhika et al., 2018), hydropower in Indonesia offers a clean energy solution, producing low greenhouse gas emissions between 2 and 75 gCO2-eq/kWh. It serves as a bridge between other renewable technologies like wind, tidal, wave, and geothermal energy (Amponsah et al., 2014; Ubierna et al., 2022). In the EU, hydropower supports the decarbonization of the economy and enhances the sustainability and security of the energy mix (Alsaleh and Abdul-Rahim, 2022b; 2023b). Given these benefits, further development of hydropower technology in Indonesia is essential.
An extensive study of hydropower potential was conducted in the Mahakam River area to support its development in the IKN area. Besides the potential for large-scale hydropower, which depends on sediment deposition, Indonesia also has opportunities to develop smaller-scale hydropower projects throughout the country based on run-of-river schemes (Soekarno, 2020; Ardiansyah, 2022).
Numerous studies have explored hydropower potential globally, encountering various limitations. For instance, the assessment of hydropower in the Indian region utilized historical hydrological models (Kusre et al., 2010), while global assessments often employ composite discharge data through climate water balance models (Hoes et al., 2017). Additionally, a recent study in Indonesia used a diversion algorithm to identify potential sites in two provinces, revealing that viable locations are often limited to one side of the river, leading to potential conflicts in usage (Kardhana et al., 2017; Wahab et al., 2023).
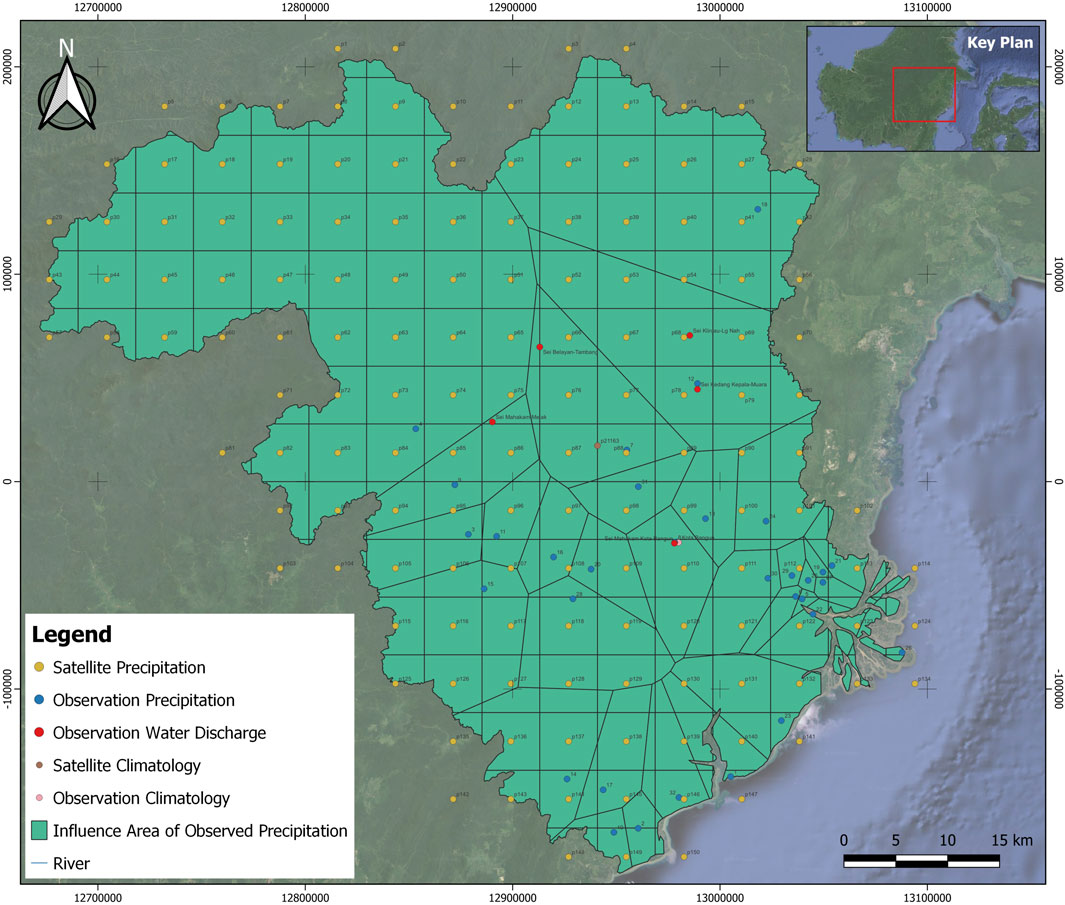
Moreover, the scarcity of observational data poses a significant challenge. According to World Meteorological Organization standards, the minimum coverage area for a manual rain gauge station in flat and hilly areas should be 575 km2, and for discharge stations, 1,875 km2 (World Meteorological Organization, 2008). In the study area, there are only 32 rainfall stations with an average density of 2.636 km2 per station and five discharge stations covering 16.870 km2 each. This limitation necessitates the use of satellite data as an alternative method for accurate assessments.
Open-source satellite climate data has become a valuable tool in exploring potential resources and studying water-related hazards (Burnama et al., 2023). The diversion algorithm, enhanced by the SWAT hydrological model and SRTM DEM, has been pivotal in calculating hydropower potential (Kardhana et al., 2017), according to the utilization of Information, Communication, and Technology (ICT) could lead to hydropower growth as well in the European area (Wang et al., 2024). SWAT is one of the most used hydrologic models in the world for eco-hydrologic modeling (Tan et al., 2019), provides spatial discharge data for each subwatershed with high accuracy, closely reflecting actual conditions (Farid et al., 2011). Combined with regional and river DEM data and SWAT flow accumulation results, this approach helps identify optimal hydropower sites by evaluating both sides of the river. Additionally, headwater resampling minimizes conflicts within river reaches. A holistic approach that considers existing land use and water transportation routes is crucial to preserving natural resources and mitigating the potential environmental impacts of hydropower projects (Alsaleh et al., 2021; Alsaleh and Abdul-Rahim, 2021a; 2023a). This study offers preliminary insights into the potential of hydropower to meet Indonesia’s future energy needs and supports the country’s energy transition strategy.
2 Study area
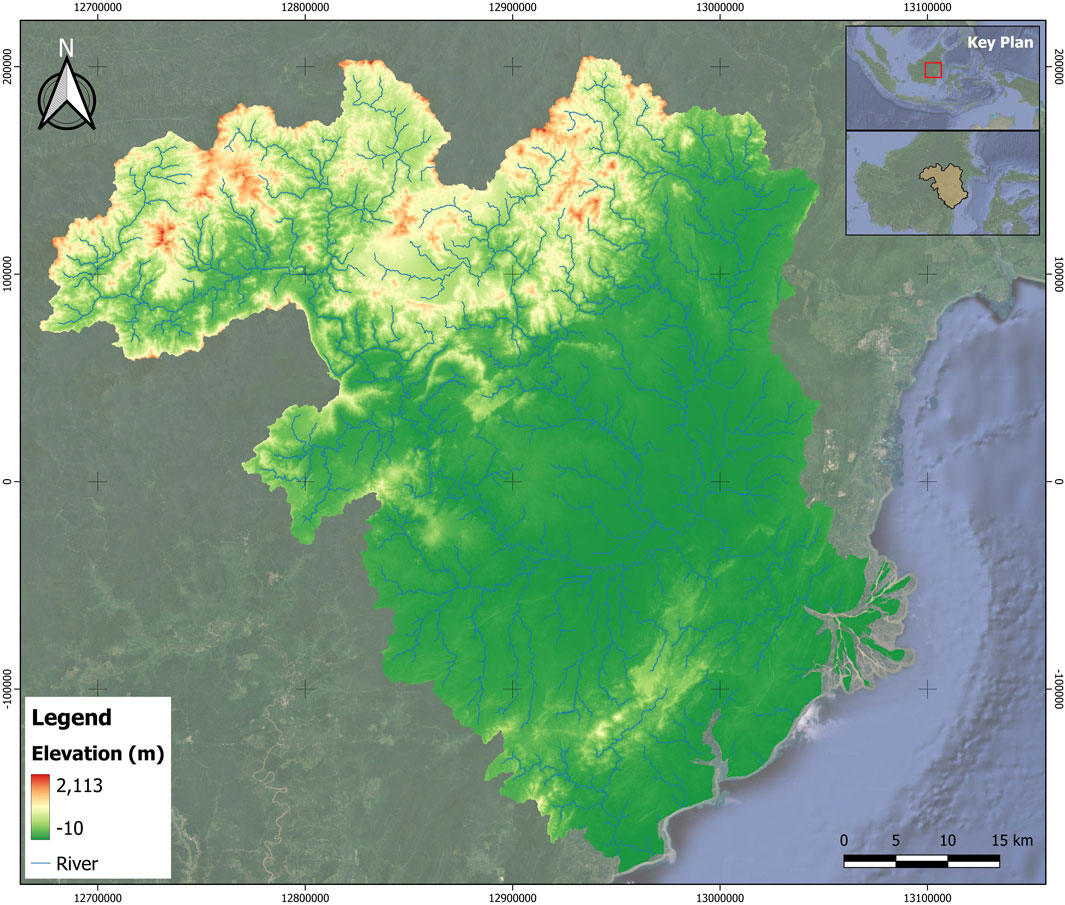
This study focuses on identifying potential hydropower sites within the Mahakam River region, as illustrated in (Figure 1). The region encompasses diverse basins that traverse various regencies and cities across the island of Kalimantan, situated between longitudes 114⁰53′49″-117⁰57′43″ and latitudes 0⁰31′30″-1⁰31′33”. Covering an area of 85,236 km2, most of this region 93.84% lies within East Kalimantan, encompassing six districts and two cities, with the remainder in Malinau Regency, North Kalimantan. The region includes 85 rivers, comprising main rivers and their tributaries, with gradients ranging from 0.0002 to 0.0077. The Mahakam River, the longest river in the area, stretches approximately 980 km southeast before discharging into the Makassar Strait, covering a basin area of 77,100 km2 (Hadibarata et al., 2020). The topography of the country is predominantly flat, with steeper areas located on the northwestern side of the river basin near the Indonesia-Malaysia border.
The upland area of East Kalimantan significantly influences the Mahakam River region. Meteorological data from the Temindung area, spanning 2019 to 2021, indicates an average annual rainfall of 3,108 mm and an average of 241 rainy days per year. The region experiences an average monthly temperature of 27.64°C with humidity levels at 85%, atmospheric pressure at 1,009.97 mb, solar irradiation of 48.52%, and wind speeds average between 2.1 and 3.8 m/s.
Currently, East Kalimantan has a hydropower capacity of 0.34 MW (Ministry of Energy and Mineral Resources, 2021). However, detailed data on the location, scheme, and other relevant factors remain unavailable for this research. The region has plans for three hydropower projects: Kelai, Tabang, and Lambakan. The Kelai Hydropower project, expected to be operational by 2025, aims for a capacity of 55 MW. The Tabang Hydropower project, with a planned capacity of 90 MW, is still in the preliminary stages of development and is expected to commence operations in 2028. The Lambakan Hydropower project is also slated for completion in 2025, with a capacity of 18.2 MW. Unfortunately, detailed site information for these projects is lacking, which limits their inclusion in this study.
3 Datasets
3.1 Digital Elevation Model (DEM)
This research utilizes the NASA Shuttle Radar Topographic Mission (SRTM) Digital Elevation Model (DEM) to represent the Earth’s topographic surface. SRTM DEMs, which are available free of charge, are renowned for their homogeneous quality across various fields such as geology, geomorphology, water resources, and hydrology (Yang et al., 2011). The resolution of the DEM used is three arc seconds, approximately 90 m horizontally, providing a more accurate topographic representation compared to the ASTER GDEM (Lahsaini et al., 2018). This data is crucial for initially identifying potential hydropower locations across extensive areas. The vertical accuracy of the SRTM DEM is noted to be 16 m (Rodríguez et al., 2006), and it is instrumental in analyzing basin areas, slopes, discharge rates, stream power, erosion rates, and more. (Preety et al., 2022).
3.2 Hydro climatology data
Hydroclimatological data utilized in this study encompasses precipitation, climate, and runoff data. Precipitation data is sourced from the Tropical Rainfall Measurement Mission (TRMM), specifically the seventh version of TRMM 3B42, which offers daily precipitation records from 1998 to 2015 with a spatial resolution of 0.25⁰ x 0.25⁰, covering latitudes from 50⁰N to 50⁰S (Michot et al., 2018). For this study, data from 2004 to 2013 are used to meet the Indonesian standard requirement of a 10-year baseline for mainstay discharge data. However, TRMM data tends to overestimate precipitation in both light and heavy rainfall conditions, and its accuracy varies across different seasons (Guo and Liu, 2016). Therefore, more reliable ground-based rainfall data is needed to calibrate the satellite data. Rainfall observation data, sourced from the Directorate of Water Resources Engineering (Bintek SDA), vary in duration and are collected from 32 rain measurement stations. Applying bias correction to TRMM and rain gauge data reduces errors and enhances their correlation with extended rainfall records (Mohd Zad et al., 2018).
Global hydroclimatological data from the Climate Forecast System Reanalysis (CFSR) by the National Oceanic and Atmospheric Administration’s National Center for Environmental Prediction are also employed. CFSR provides a resolution of 0.3125⁰ or about 38 km, which is useful for simulating watershed runoff (Fuka et al., 2014). Besides rainfall, CFSR data include daily maximum and minimum temperatures, relative humidity, wind speed, and solar radiation for each grid satellite (Dile and Srinivasan, 2014). Widely used in the SWAT hydrological model, CFSR data are formatted to meet SWAT’s requirements (Zhu et al., 2016). This data was notably evaluated in areas like the Karuvannur River in India, where observational data are scarce (Tomy and Sumam, 2016). However, caution is advised as CFSR tends to overestimate rainfall, particularly noted in regions like Bolivia (Blacutt et al., 2015), necessitating calibrated temporal runoff values for accurate rainfall-runoff modeling.
Discharge data is crucial for calibrating the rainfall-runoff hydrological model (Mengistu et al., 2019), were obtained from the Research and Development Center of Water Resources (PUSAIR) at five locations: Sei Mahakam Kota Bangun, Sei Mahakam-Melak, Sei Kedang Kepala-Muara, Sei Belayan-Tambang, and Sei Klinjau-Lg Nah, spanning from 2005 to 2012. Some datasets contained discrepancies, such as mismatched coordinates and quality issues labeled “should not be used.” Thus, the data from Sei Belayan-Tambang in 2009 was selected as the most reliable for this study. See Figure 2 for a detailed visualization of the precipitation-discharge-climatology data.
3.3 Land cover data
Land cover data, a critical parameter in the SWAT hydrologic model, influences the model’s output in a watershed. For instance, land cover changes towards built-up areas in Brantas have been shown to increase water runoff values (Astuti et al., 2019). The land cover data for this study, sourced from the Ministry of Environment and Forestry of the Republic of Indonesia (KLHK), is mapped at a 1:250,000 scale from 2018. This data forms the basis for defining Hydrologic Response Units (HRU), which are then converted into Curve Number (CN) values. Due to the local origin of this data, it is necessary to reclassify land cover definitions to align with the SWAT model’s standards. Table 1 outlines the land cover classification process, and Figure 3 displays the resulting classifications.
3.4 Soil type data
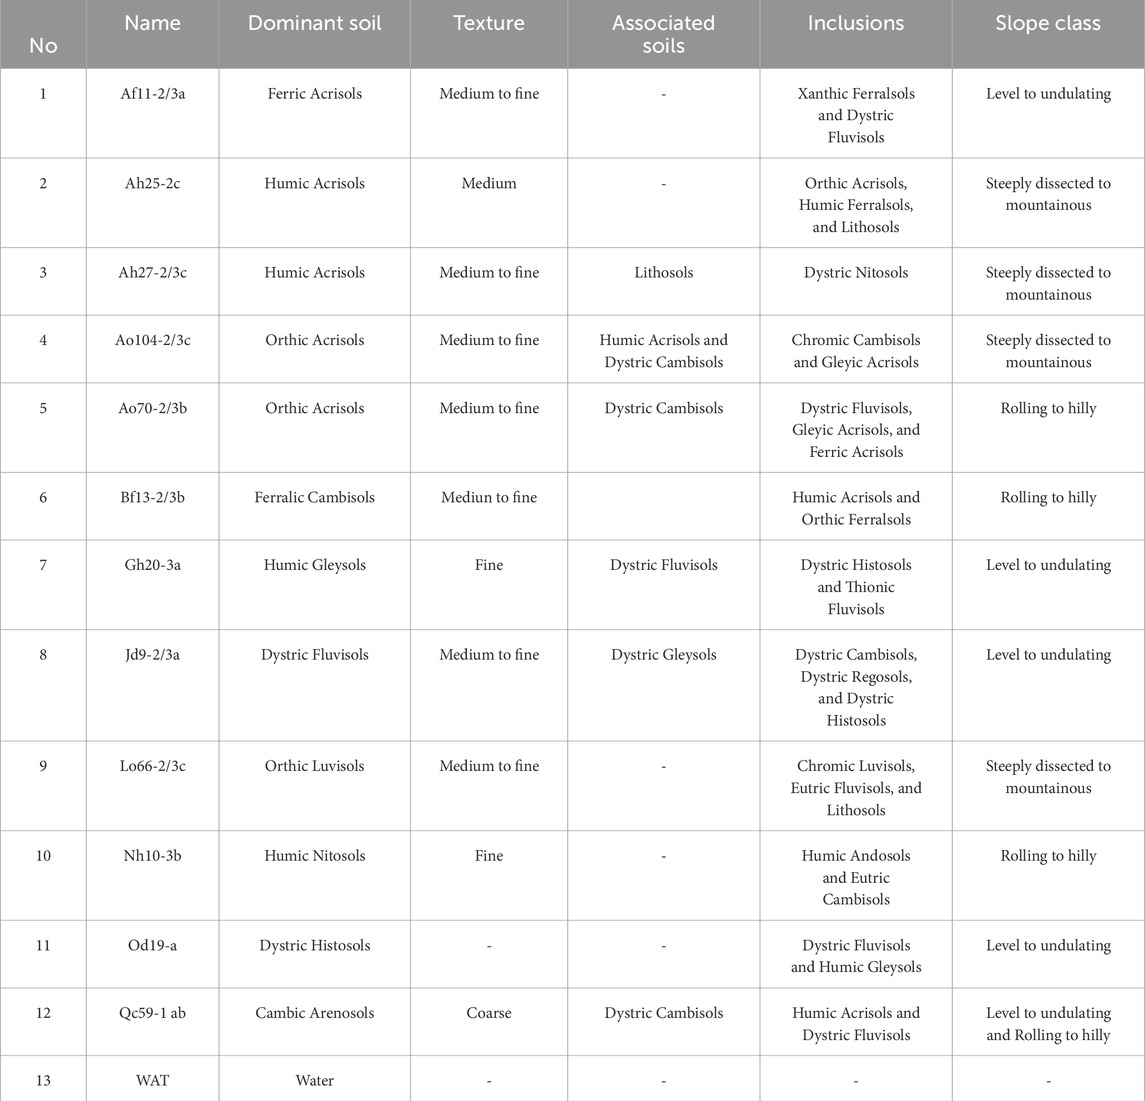
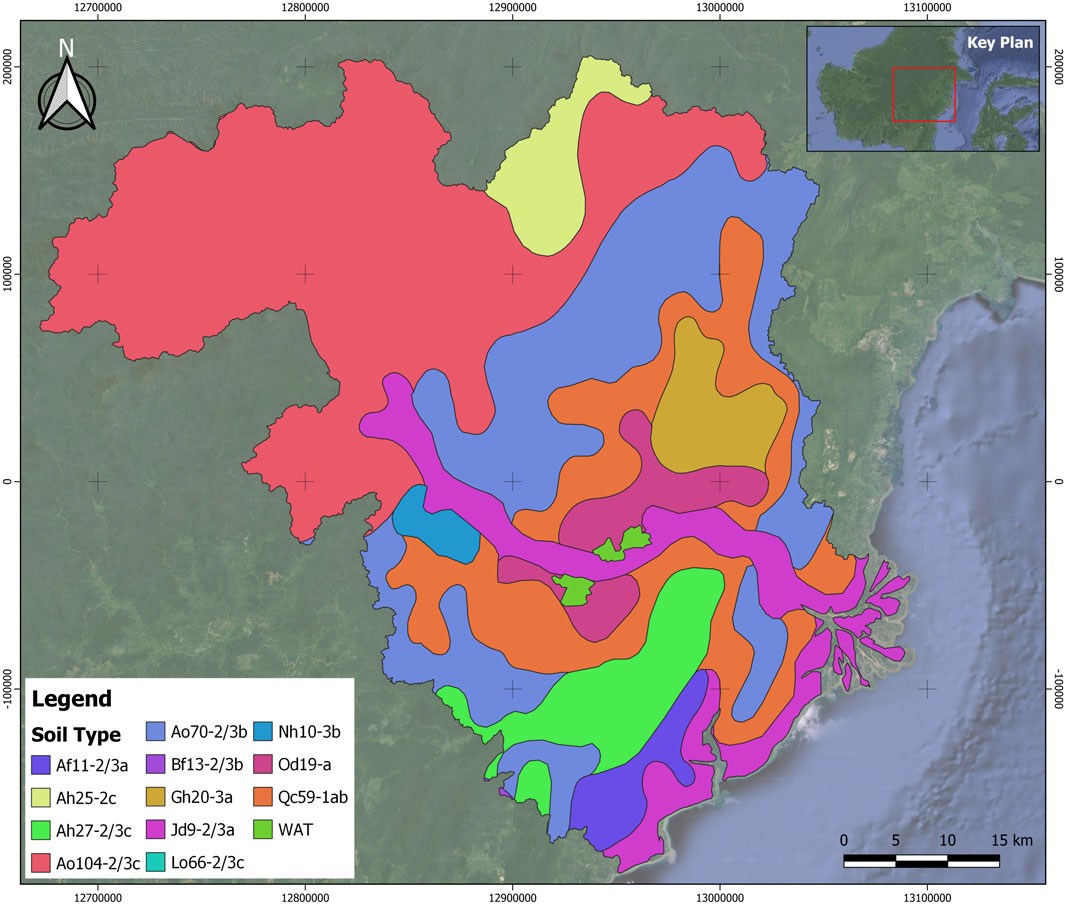
The Food and Agriculture Organization and the United Nations Educational, Scientific and Cultural Organization (UNESCO) provide the Digital Soil Map of the World (DSMW), freely available online. Updated in 2007, the DSMW offers a vast scale of 1:5,000,000, representing most soil types across various countries in soil map polygon units (Grunwald et al., 2011). Streamflow results from DSMW usage in the SWAT model are competitive with those derived from local soil data, despite the DSMW’s relatively coarse resolution (Busico et al., 2020). Table 2; Figure 4 illustrate the soil condition identification in the study area.
4 Methods
This research commences with the collection of various data types, including DEM topographic data, CFSR climatology, land cover, soil type, precipitation, and observed runoff. These datasets are processed using the SWAT hydrological model to generate spatial discharge values. These values, along with topographic data and flow accumulation, are utilized in a diversion algorithm to identify potential hydropower sites. The selection of these sites also considers social aspects, such as land cover conditions and existing water transportation routes, which are identified through satellite imagery. Refer to Figure 5 for more details.
4.1 Soil and Water Assessment Tool (SWAT)
The data processing starts with the creation of subwatershed delineations using the SWAT software integrated with ArcMap. SWAT, a daily continuous-time hydrologic model, manages water resources within a watershed or large river basin (Arnold et al., 1998). Watershed delineation is informed by topographic data, administrative boundaries, existing river networks, and streamflow gauging stations. Additionally, the model generates essential outputs like flow accumulation, streamflow, and outlet points for each sub-basin.
Land use data are classified according to SWAT model standards, as they are initially defined based on Indonesian guidelines. Meanwhile, soil type data from DSMW are already classified to fit SWAT standards. The model also requires slope discretization, categorized by the Ministry of Environment and Forestry into five levels based on steepness (0%–8% flat, 8%–15% gentle, 15%–25% reasonably steep, 25%–45% steep, and >45% very steep), which are crucial for determining the Hydrologic Response Units (HRU) in each sub-watershed (Abbaspour et al., 2007).
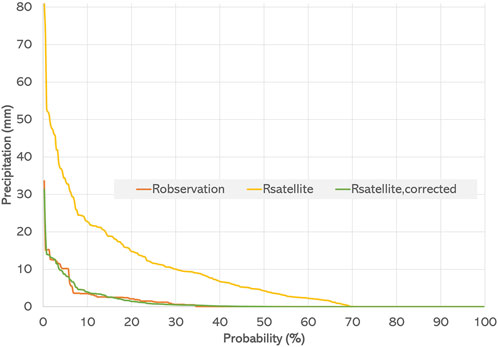
Weather data processing begins with aligning global rainfall data to observational data using the Quantile-Weibull calibration method. This calibration, performed on 150 CFSR grid data against data from 32 observation stations for 2009, produces correction factor equations based on rainfall intensity, applicable to other years. Calibration is evaluated on a probabilistic basis, aiming to minimize discrepancies. The calibrated precipitation data, along with CFSR climatology data, are then formatted to be compatible with SWAT.
The model’s output includes runoff values for subwatersheds, which are further calibrated against observational data using two methods: SWAT-CUP software and manual adjustments. SWAT-CUP employs a Sequential Uncertainty Fitting Version two optimization algorithm for sensitivity analysis and model calibration (Yang et al., 2008; Abbaspour et al., 2015; Hosseini and Khaleghi, 2020). Parameters such as CN2, Alpha BF, GW Delay, GWQMN, and GW Revap are optimized during this process (Singh et al., 2013). The hydrological model’s calibration is evaluated using the Nash-Sutcliffe Efficiency (NSE) method, which is adaptable to various model types but requires careful sample distribution to achieve optimal NSE values (McCuen et al., 2006). Based on various studies, the annual minimum flow for run-of-river hydropower is typically 75% (Kuriqi et al., 2019a; 2019b). However, this study has chosen to use 80% to better accommodate environmental considerations. The discharge values were then converted into an ASCII file for processing in the diversion algorithm.
4.2 Diversion algorithm and resample headrace
The diversion algorithm inputs include DEM data, river elevation, and flow accumulation (Kardhana et al., 2017). The algorithm begins by identifying grids defined as rivers with specific discharge values, known as headraces. The route of the headrace is traced by selecting grids with the smallest elevation difference to minimize head loss, while also considering certain elevation limits for excavation or landfill efforts (Farid et al., 2021). This parameter significantly impacts energy output, with other studies indicating a range of 1800–2000 m (Larentis et al., 2010; Yi et al., 2010). In contrast, this study has opted for a maximum of 30 iterations to reduce construction costs, corresponding to a maximum headrace length of 2,700 m. Additional technical considerations include avoiding river crossings to reduce the complexity of water infrastructure and maintaining angles less than 45⁰ to minimize head loss along the headrace route.
Each grid is assessed to determine the potential hydraulic head (Larentis et al., 2010), calculated as the difference in elevation between the intake and the nearest river, within a two-grid radius to avoid barriers, minimize penstock length, and optimize tailrace points. This process continues until a forebay point is identified that offers the maximum head with the shortest headrace. The flow accumulation value, representing the river order in the downstream section, must exceed that of the upstream section (Yi et al., 2010).
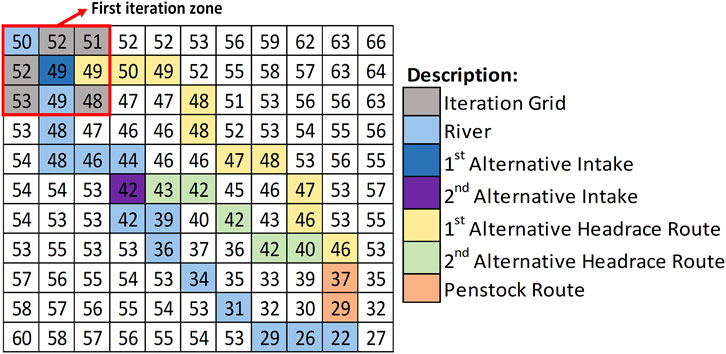
A resample headrace technique was developed to prevent overlay in hydropower applications, where one site might impinge on another’s water use path (see Figure 6). This technique involves storing and sorting power data from the river network from highest to lowest, prioritizing the hydropower plant with the highest potential. The path from intake to tailrace is then traced, removing any overlapping hydropower sites and those with power levels below 500 kW to prevent overestimation of the model’s runoff potential.
4.3 Land cover and existing water transport route filter
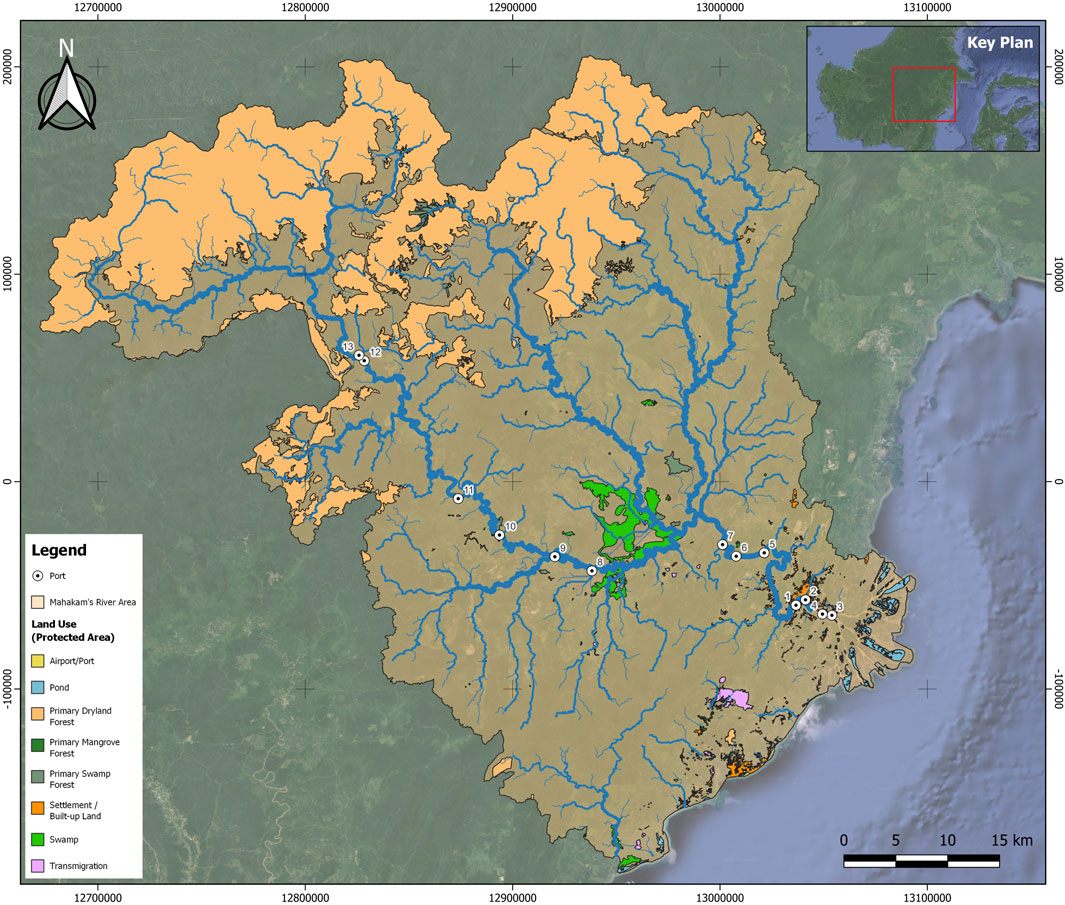
In determining potential hydropower sites, factors such as land cover and existing water transportation routes are considered. Areas unsuitable for development, such as protected forests, peaty and coastal areas, nature reserves, and zones prone to natural disasters, are excluded based on Presidential Regulation No. 32 of 1990. Existing water transportation routes are identified using 2022 Google satellite imagery, noting the presence of boats and other watercraft along river segments or docks (see Figure 7 for locations of protected areas and ports).
5 Results and discussion
5.1 Hydro climatology analysis
Before inputting data into the hydrological model, a consistency assessment was conducted, particularly focusing on hydroclimatology data. This data includes satellite-observed rainfall, runoff, and climatology. The Sei Kedang Kepala-Muara area was selected for verification due to its proximity of data points within a grid scope. TRMM satellite precipitation data were compared with data from the Muara Ancalong Observational Rain Station and the Sei Kedang Kepala-Muara Observational Discharge Station, using 2009 as the reference year, aligned with the availability of discharge data.
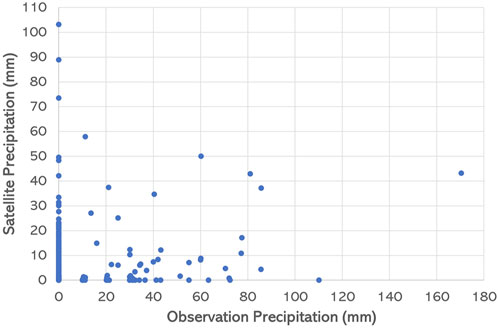
The correlation check was conducted at daily intervals, as shown in Figure 8. The correlation between satellite rainfall data and ground observations resulted in an NSE value of −0.19, indicating a weak correlation with notable discrepancies. This is evident in several rain events where the satellite data either failed to capture the rainfall or significantly overestimated it. Furthermore, satellite data frequently overestimate rainfall when no precipitation is recorded at observation stations, which can lead to overestimation in the hydrological model during dry conditions. This issue is consistent with findings from other studies, which indicate that the correlation between satellite and rain gauge data in East Kalimantan is low to nonexistent (Prasetia et al., 2013) and that the TRMM rainfall product shows a weak correlation in the flat areas of Kalimantan compared to ground data (Giarno et al., 2018).
Visual comparisons were conducted between satellite-recorded rainfall data, observed rainfall data, and field-measured discharge data. Typically, rainfall events in a region should lead to increased runoff in streams. However, as illustrated in Figure 9, some field runoff events did not coincide with increased rainfall observed or recorded by satellites, particularly in June and September. This discrepancy may occur if the rainfall occurs upstream, where conditions differ from those at the assessment location. Conversely, there were periods, such as from October to December, where field-recorded rainfall did not align with increased discharge. These inconsistencies underscore the lack of synergy between observational and satellite data, necessitating careful consideration when utilizing these datasets. Similar inconsistencies have been observed in other regions of Indonesia, including Java Island, where only five out of thousands of watersheds meet the consistency requirements (Yanto et al., 2017). Consequently, this research will focus on aligning conditions as closely as possible with field realities.
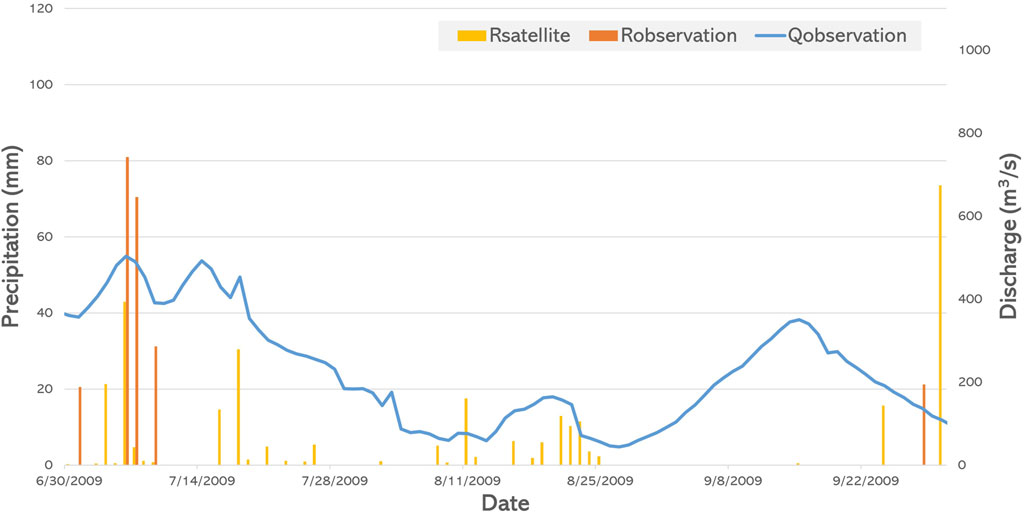
Figure 9. Satellite-observation precipitation and observation discharge data consistency comparison in July-September.
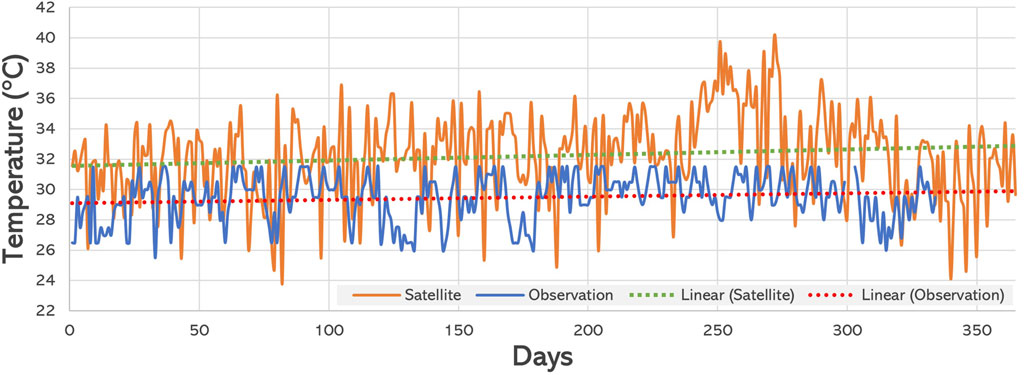
An additional assessment was conducted on temperature, one of the climatological parameters. Using CFSR satellite climatology data, a comparison was made with data from the Kota Bangun ground observation climatology station. The evaluation covered data from January to November 2009, with 3 days of missing data. The NSE (Nash-Sutcliffe Efficiency) value calculated from these datasets was −0.69 for the maximum condition and −0.16 for the minimum condition, indicating an unsatisfactory correlation (see Figure 10 for the maximum condition illustration). More comprehensive satellite data tend to show higher maximum temperatures and lower minimum temperatures. This discrepancy may affect the evapotranspiration values calculated by the hydrologic model, potentially resulting in higher values than actual field events. Although these discrepancies have minimal impact on the hydrological data, the field approach will prioritize model runoff results. Climatological satellite data will still be used as the foundation for the model due to its longer time parameter availability and broader maximum-minimum temperature ranges.
5.2 Discharge calculation with SWAT model
The TRMM rainfall data approach was applied to observation data spatially, based on the grid and influence of observation stations in the study area. This approach helps mitigate issues related to the uneven distribution of observation stations and incomplete rainfall data. Observation stations often face disruptions, such as equipment damage, repair periods, or manual recording errors, like missed rain measurements. Calibration was performed on 2009 data, resulting in an NSE (Nash-Sutcliffe Efficiency) value of 0.97 (see Figure 11). This high value indicates a very strong correlation between the datasets. However, this result was influenced by the fact that many observations recorded zero or no rainfall. In the 2009 dataset, zero rainfall values were found starting from the 127th data point out of 365 daily entries. Satellite data also indicated that rainfall values below 9 mm were adjusted to be close to or equal to zero, based on comparisons with observation data. A correction factor derived from each adjustment was applied as a multiplier to the original satellite rainfall value for other satellite data.
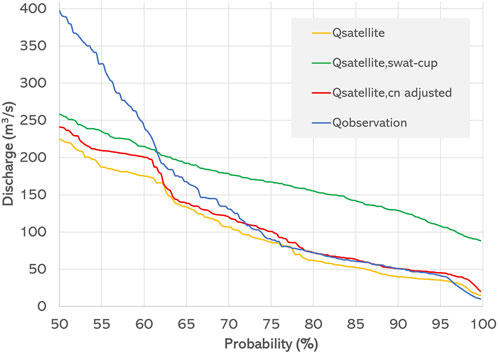
In addition to rainfall calibration, the discharge values generated by the SWAT hydrological model were also calibrated. This was done daily for 2009, using the Sei Belayan-Tambang site as the calibration point, which correlated with the 416th sub-basin data. Calibration involved trial and error adjustments on five SWAT parameters: CN2, ALPHA_BF, GW_REVAP, GW_DELAY, and GWMQN, using SWAT-CUP. Additionally, manual calibration was performed by adjusting CN2 values. The best discharge calibration was achieved by manually reducing the CN2 value by 3, resulting in an NSE of 0.57 (see Figure 12). In contrast, calibration using SWAT-CUP yielded an NSE of 0.51. In this case, the SWAT-CUP iteration could not adequately align model runoff with observed runoff.
Furthermore, some limitations were generated by the model. First, the model struggled to account for high discharge areas, particularly at probabilities below 60%. This issue may arise in small watersheds with high infiltration, where significant water absorption reduces discharge. Second, the calibration site in Sei Belayan-Tambang spans a large area of 5,600 km2, the discharge observation data indicating a high base flow influence. Upstream rainfall events may not significantly impact discharge fluctuations in this area, as evidenced by stable, less fluctuating graphs.
It is recommended that discharge measurement points in the field be evenly distributed across both small and large basins. This approach enhances the reliability of the hydrological model by providing more comprehensive data. Additionally, the calibration parameters used in this study are only valid for large basins, as the calibration was based on large basin data. This raises concerns about the model’s applicability if these parameters are used for smaller basins.
5.3 Hydropower potential locations
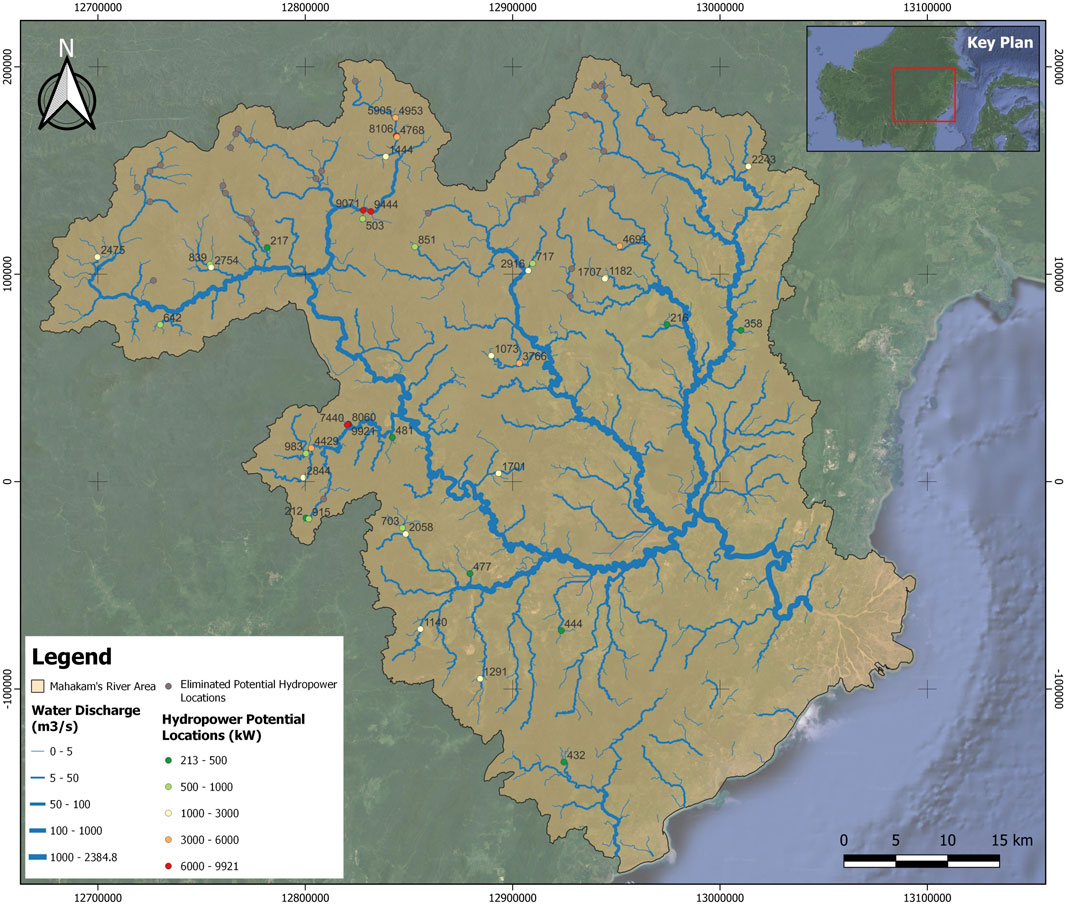
This analysis identified 79 potential hydropower sites with a total potential power of 240 MW. When classified by scale, 55 sites are identified as mini-hydropower, with a total power of 227 MW, and 24 sites as micro-hydropower, with a total power of 13 MW.
Considering these values, it is important to account for existing land use conditions to minimize potential social conflicts arising from hydropower development. Areas to be excluded include airports or ports, primary dry forests, primary mangrove forests, primary swamp forests, settlements or built-up areas, swamps, ponds, and transmigration areas. After these exclusions, 73.48% of the total land area remains as potential sites for hydropower development (see Figure 13). Following this filtration, there are 25 mini-hydropower sites with a total capacity of 105.4 MW and 16 micro-hydropower sites with a total power potential of 9 MW.
In comparison, a World Bank study shows that there are 69 hydropower sites with a total capacity of 10,817 MW, the largest in East and North Kalimantan (The World Bank, 2017). Based on this value, a potential site will likely have a value of more than 100 MW. On the contrary, this study provides an upper limit to this value considering the technical capabilities of implementing small hydropower.
The World Bank did not provide detailed information on their search methodology, making it difficult to directly compare their process with this study. But interestingly, both the World Bank results and this study show a tendency for potential locations to cluster in the western upstream area. This suggests that the region likely has significant elevation differences compared to other areas, making it a promising area for further study.
Another aspect considered in this study is water transportation. The Mahakam River, known for its width, serves as a vital transportation channel for local communities (Effendy, 2022). This presents a limitation for hydropower development, as the river’s depth must be maintained, preventing damming or tapping that would obstruct planned ship passage. Transportation routes were identified using Google Earth satellite imagery, which showed ports along the riverbanks and captured images of ships in transit. This identification revealed 13 ports or crossings in the river channel, from the Sungai Kapal and Barang ports on the Kunjang River to the Batu Majang port upstream. Based on our results, no potential power plant sites were found that would interfere with navigation channels.
5.4 General hydropower contribution in IKN relocation and energy transition
With a total projected hydropower potential of 114.4 MW, if fully utilized, it can contribute to the projected electricity system by 3.4% (including existing and additional). This could have an impact on the local energy transition process. Although it cannot replace the still dominating position of coal-fired power plants, this study emphasizes that the government plays an important role in hydropower planning, because weak governance organizations could drive inadequate hydropower development (Alsaleh and Abdul-Rahim, 2021b).
In addition to its contribution to total electrification, hydropower can also benefit the environment. Based on the maximum emission values of hydropower (Amponsah et al., 2014; Ubierna et al., 2022), hydropower can reduce carbon emissions that would be released if coal-fired power plants continued to operate in East Kalimantan. The total emissions from coal-fired power plants (PLTU) with the same amount of energy generation can reach 540 thousand tons of CO2 per year. Meanwhile, hydropower only produces about 60 thousand tons of CO2, which is even 1/9 of that amount. This can significantly reduce emissions and mitigate the environmental impact of power generation activities.
6 Conclusion
Identifying potential hydropower locations can be accomplished through the development of rainfall-runoff hydrological models and the application of diversion algorithms. Using TRMM rainfall data addresses the limitations of CFSR data, while the Quantile-Weibull grid calibration method improves the spatial distribution of rainfall. However, this approach requires support from several evenly distributed observation stations covering the entire study area.
The limitations of the model in generating discharge present a challenge. The discharge values obtained in this study are generally valid for large basin conditions, but reliability decreases as the basin area becomes smaller. Therefore, we used 80% as the minimum flow for hydropower utilization to reduce overestimation and improve reliability. In cases where the model and observations align, an approach that considers periodic discharge and flow duration curves above 55% is needed to maximize energy values.
Additionally, the use of diversion algorithms, leveraging SRTM DEM and runoff discharge, can identify initial potential hydropower location points. The resolution and vertical accuracy of the DEM are crucial in determining the calculated potential height difference. Higher values of these factors enhance model reliability, though the algorithm process becomes longer and demands higher hardware specifications. In this research, due to the limitations of the resulting discharge model, the potential height difference value serves as a benchmark parameter defining hydropower potential.
This study provides an overview of energy potential and emission reduction. The potential generation capacity of mini hydropower is 25 sites with a total power of 105.4 MW, and micro-hydropower is 16 sites with a total power of 9 MW. These values were determined after considering potential locations against social aspects of land use and water transportation flows. Further verification is needed to refine model results using improved elevation data, observation data, and field surveys, which can provide a comparison between the model and existing conditions. Moreover, these findings contribute 3.44% to the electricity supply and reduce CO2 emissions by 480,000 tons compared to fossil fuels, positioning this research as a pre-feasibility study for hydropower’s role in the IKN energy plan. Future research should include assessing climate change impacts on hydropower infrastructure, conducting economic analyses to enhance reliability, and integrating hydropower energy into the energy mix network of the IKN area.
Data availability statement
The datasets presented in this article are not readily available because several datasets have been restricted. It was obtained from the Directorate for Engineering Development of the Ministry of Public Works and Housing of Indonesia (Direktorat Bintek SDA, Kementerian PUPR) and the Ministry of Environment and Forestry of Indonesia (Kementerian LHK). Request access to those datasets should be directed to Bintek SDA, aW5mb3JtYXNpYmludGVrc2RhQGdtYWlsLmNvbQ== and Sigap KLHK, c2lnYXBAbWVubGhrLmdvLmlk..
Author contributions
AAK: Conceptualization, Formal Analysis, Funding acquisition, Methodology, Project administration, Supervision, Writing–review and editing, Writing–original draft. AR: Conceptualization, Data curation, Formal Analysis, Methodology, Resources, Software, Visualization, Writing–original draft, Writing–review and editing. MF: Conceptualization, Formal Analysis, Funding acquisition, Methodology, Project administration, Supervision, Writing–original draft, Writing–review and editing. HK: Conceptualization, Formal Analysis, Methodology, Supervision, Writing–original draft. FR: Conceptualization, Formal Analysis, Methodology, Supervision, Writing–original draft. AR: Conceptualization, Software, Writing–original draft. MK: Conceptualization, Supervision, Writing–original draft. MA: Conceptualization, Supervision, Writing–original draft. AW: Writing–original draft, Writing–review and editing.
Funding
The author(s) declare that financial support was received for the research, authorship, and/or publication of this article. This research was funded by the Ministry of Research, Technology, and Higher Education of Indonesia (RISTEKDIKTI) through its Applied Research program.
Acknowledgments
The authors gratefully acknowledge the financial support for this research provided by the Applied Research program of the Ministry of Research, Technology, and Higher Education of Indonesia (RISTEKDIKTI). The authors also extend their gratitude to the collaborative partnership between Institut Teknologi Bandung (ITB), the National Research and Innovation Agency (BRIN), and Delft University of Technology, facilitated through the Merian Fund of the Dutch Research Council (NWO) under the Cooperation Indonesia–the Netherlands Renewable Energy initiative. The authors also thank the Directorate for Engineering Development of the Ministry of Public Works and Housing of Indonesia (Direktorat Bina Teknik, Kementerian PUPR) and the Ministry of Environment and Forestry of Indonesia (Kementerian LHK) for providing data for this research activity.
Conflict of interest
The authors declare that the research was conducted in the absence of any commercial or financial relationships that could be construed as a potential conflict of interest.
Publisher’s note
All claims expressed in this article are solely those of the authors and do not necessarily represent those of their affiliated organizations, or those of the publisher, the editors and the reviewers. Any product that may be evaluated in this article, or claim that may be made by its manufacturer, is not guaranteed or endorsed by the publisher.
References
Abbaspour, K. C., Rouholahnejad, E., Vaghefi, S., Srinivasan, R., Yang, H., and Kløve, B. (2015). A continental-scale hydrology and water quality model for Europe: calibration and uncertainty of a high-resolution large-scale SWAT model. J. Hydrology 524, 733–752. doi:10.1016/j.jhydrol.2015.03.027
Abbaspour, K. C., Yang, J., Maximov, I., Siber, R., Bogner, K., Mieleitner, J., et al. (2007). Modelling hydrology and water quality in the pre-alpine/alpine Thur watershed using SWAT. J. Hydrology 333, 413–430. doi:10.1016/j.jhydrol.2006.09.014
Afin, A. P., and Kiono, B. F. T. (2021). Potensi Energi Batubara serta Pemanfaatan dan Teknologinya di Indonesia Tahun 2020 – 2050: Gasifikasi Batubara. J. Energi Baru Dan. Terbarukan 2, 144–122. doi:10.14710/jebt.2021.11429
Alsaleh, M., and Abdul-Rahim, A. (2022a). Moving toward sustainable environment: the effects of hydropower industry on water quality in EU economies. Energy and Environ. 33, 1304–1325. doi:10.1177/0958305X211039452
Alsaleh, M., and Abdul-Rahim, A. S. (2021a). Do global competitiveness factors effects the industry sustainability practices? Evidence from European hydropower industry. J. Clean. Prod. 310, 127492. doi:10.1016/j.jclepro.2021.127492
Alsaleh, M., and Abdul-Rahim, A. S. (2021b). The nexus between worldwide governance indicators and hydropower sustainable growth in EU 28 region. Int. J. Environ. Res. 15, 1001–1015. doi:10.1007/s41742-021-00366-6
Alsaleh, M., and Abdul-Rahim, A. S. (2022b). The pathway toward pollution mitigation in EU28 region: does hydropower growth make a difference? Renew. Energy 185, 291–301. doi:10.1016/j.renene.2021.12.045
Alsaleh, M., and Abdul-Rahim, A. S. (2023a). Does hydropower growth threaten fish security under the pathway of sustainable development? Evidence from European Union economies. Energy and Environ. 34, 78–98. doi:10.1177/0958305X211046317
Alsaleh, M., and Abdul-Rahim, A. S. (2023b). Does hydropower production influence agriculture industry growth to achieve sustainable development in the EU economies? Environ. Sci. Pollut. Res. 30, 12825–12843. doi:10.1007/s11356-022-22583-y
Alsaleh, M., Abdulwakil, M. M., and Abdul-Rahim, A. S. (2021). Land-use change impacts from sustainable hydropower production in EU28 region: an empirical analysis. Sustainability 13, 4599. doi:10.3390/su13094599
Alsaleh, M., Yang, Z., Chen, T., and Abdul-Rahim, A. S. (2023). Unveiling the linkage between hydropower growth and tourism sustainability in EU27 region: an empirical analysis. Sustain. Dev. 31, 1704–1719. doi:10.1002/sd.2477
Amponsah, N. Y., Troldborg, M., Kington, B., Aalders, I., and Hough, R. L. (2014). Greenhouse gas emissions from renewable energy sources: a review of lifecycle considerations. Renew. Sustain. Energy Rev. 39, 461–475. doi:10.1016/j.rser.2014.07.087
Ardiansyah, H. (2022). “Hydropower technology: potential, challenges, and the future,” in Indonesia post-pandemic outlook: strategy towards net-zero emissions by 2060 from the renewables and carbon-neutral energy perspectives. Editors H. Ardiansyah, and P. Ekadewi (BRIN Publishing/Penerbit BRIN). doi:10.55981/brin.562.c6
Arnold, J. G., Srinivasan, R., Muttiah, R. S., and Williams, J. R. (1998). Large area hydrologic modeling and assessment Part I: model Development1. JAWRA J. Am. Water Resour. Assoc. 34, 73–89. doi:10.1111/j.1752-1688.1998.tb05961.x
Astuti, I. S., Sahoo, K., Milewski, A., and Mishra, D. R. (2019). Impact of land use land cover (LULC) change on surface runoff in an increasingly urbanized tropical watershed. Water Resour. Manage 33, 4087–4103. doi:10.1007/s11269-019-02320-w
Blacutt, L. A., Herdies, D. L., de Gonçalves, L. G. G., Vila, D. A., and Andrade, M. (2015). Precipitation comparison for the CFSR, MERRA, TRMM3B42 and combined scheme datasets in Bolivia. Atmos. Res. 163, 117–131. doi:10.1016/j.atmosres.2015.02.002
Burnama, N. S., Rohmat, F. I. W., Farid, M., Kuntoro, A. A., Kardhana, H., Rohmat, F. I. W., et al. (2023). The utilization of satellite data and machine learning for predicting the inundation height in the majalaya watershed. Water 15, 3026. doi:10.3390/w15173026
Busico, G., Colombani, N., Fronzi, D., Pellegrini, M., Tazioli, A., and Mastrocicco, M. (2020). Evaluating SWAT model performance, considering different soils data input, to quantify actual and future runoff susceptibility in a highly urbanized basin. J. Environ. Manag. 266, 110625. doi:10.1016/j.jenvman.2020.110625
Dile, Y. T., and Srinivasan, R. (2014). Evaluation of CFSR climate data for hydrologic prediction in data-scarce watersheds: an application in the Blue Nile River Basin. JAWRA J. Am. Water Resour. Assoc. 50, 1226–1241. doi:10.1111/jawr.12182
Effendy, M. A. R. (2022). River transportation network and the development of civilization on the East coast of kalimantan at the end of colonial era:, (makassar, Indonesia). Advances in Social Science, Education and Humanities Research doi:10.2991/assehr.k.220408.020
Erinofiardi, , Gokhale, P., Date, A., Akbarzadeh, A., Bismantolo, P., Suryono, A. F., et al. (2017). A review on micro hydropower in Indonesia. Energy Procedia 110, 316–321. doi:10.1016/j.egypro.2017.03.146
Farid, M., Mano, A., and Udo, K. (2011). Distributed flood model for urbanization assessment in a limited-gauged river basin. Riverside, California, USA, 83–94. doi:10.2495/RM110081
Farid, M., Rizaldi, A., Prahitna, A., Badri Kusuma, M. S., Kuntoro, A. A., and Kardhana, H. (2021). Rapid hydropower potential assessment for remote area by using global data. IOP Conf. Ser. Earth Environ. Sci. 813, 012006. doi:10.1088/1755-1315/813/1/012006
Fuka, D. R., Walter, M. T., MacAlister, C., Degaetano, A. T., Steenhuis, T. S., and Easton, Z. M. (2014). Using the Climate Forecast System Reanalysis as weather input data for watershed models. Hydrol. Process. 28, 5613–5623. doi:10.1002/hyp.10073
Giarno, , Hadi, M. P., Suprayogi, S., and Murti, S. H. (2018). Distribution of accuracy of TRMM daily rainfall in Makassar Strait. Forum Geogr. 32, 38–52. doi:10.23917/forgeo.v32i1.5774
Grunwald, S., Thompson, J. A., and Boettinger, J. L. (2011). Digital soil mapping and modeling at continental scales: finding solutions for global issues. Soil Sci. Soc. Am. J. 75, 1201–1213. doi:10.2136/sssaj2011.0025
Guo, R., and Liu, Y. (2016). Evaluation of satellite precipitation products with rain gauge data at different scales: implications for hydrological applications. Water 8, 281. doi:10.3390/w8070281
Hadibarata, T., Kristanti, R. A., and Mahmoud, A. H. (2020). Occurrence of endocrine-disrupting chemicals (EDCs) in river water and sediment of the Mahakam River. J. Water Health 18, 38–47. doi:10.2166/wh.2019.100
Hoes, O. A. C., Meijer, L. J. J., Van Der Ent, R. J., and Van De Giesen, N. C. (2017). Systematic high-resolution assessment of global hydropower potential. PLoS ONE 12, e0171844. doi:10.1371/journal.pone.0171844
Hosseini, S. H., and Khaleghi, M. R. (2020). Application of SWAT model and SWAT-CUP software in simulation and analysis of sediment uncertainty in arid and semi-arid watersheds (case study: the Zoshk–Abardeh watershed). Model. Earth Syst. Environ. 6, 2003–2013. doi:10.1007/s40808-020-00846-2
Intergovernmental Panel On Climate Change (2023). Climate change 2021 – the physical science basis: working group I contribution to the sixth assessment report of the intergovernmental Panel on climate change. 1st Edn. Cambridge University Press. doi:10.1017/9781009157896
IRENA (2023). World energy transitions outlook 2023: 1.5°C pathway. Int. Renew. Energy Agency, Abu Dhabi. Available at: www.irena.org/publications.
Kardhana, H., Arya, D. K., Hadihardaja, I. K., Riawan, E., and Lubis, A. (2017). Small hydropower spot prediction using SWAT and a diversion algorithm, case study: upper Citarum Basin. Plb. Indones., 100015. doi:10.1063/1.5011625
Kementerian PPN/Bappenas (2021). Pemindahan ibu Kota negara. Available at: https://www.ikn.go.id/storage/buku-saku-ikn-072121.pdf.
Kuriqi, A., Pinheiro, A. N., Sordo-Ward, A., and Garrote, L. (2019a). Flow regime aspects in determining environmental flows and maximising energy production at run-of-river hydropower plants. Appl. Energy 256, 113980. doi:10.1016/j.apenergy.2019.113980
Kuriqi, A., Pinheiro, A. N., Sordo-Ward, A., and Garrote, L. (2019b). Influence of hydrologically based environmental flow methods on flow alteration and energy production in a run-of-river hydropower plant. J. Clean. Prod. 232, 1028–1042. doi:10.1016/j.jclepro.2019.05.358
Kusre, B. C., Baruah, D. C., Bordoloi, P. K., and Patra, S. C. (2010). Assessment of hydropower potential using GIS and hydrological modeling technique in Kopili River basin in Assam (India). Appl. Energy 87, 298–309. doi:10.1016/j.apenergy.2009.07.019
Lahsaini, M., Tabyaoui, H., Mounadel, A., Bouderka, N., and Lakhili, F. (2018). Comparison of SRTM and ASTER derived digital elevation models of inaouene river watershed (North, Morocco)—arc hydro modeling. GEP 06 06, 141–156. doi:10.4236/gep.2018.69011
Larentis, D. G., Collischonn, W., Olivera, F., and Tucci, C. E. M. (2010). Gis-based procedures for hydropower potential spotting. Energy 35, 4237–4243. doi:10.1016/j.energy.2010.07.014
McCuen, R. H., Knight, Z., and Cutter, A. G. (2006). Evaluation of the nash–sutcliffe efficiency index. J. Hydrologic Eng. 11, 597–602. doi:10.1061/(ASCE)1084-0699(2006)11:6(597)
Mengistu, A. G., van Rensburg, L. D., and Woyessa, Y. E. (2019). Techniques for calibration and validation of SWAT model in data scarce arid and semi-arid catchments in South Africa. J. Hydrology Regional Stud. 25, 100621. doi:10.1016/j.ejrh.2019.100621
Michot, V., Vila, D., Arvor, D., Corpetti, T., Ronchail, J., Funatsu, B. M., et al. (2018). Performance of TRMM TMPA 3B42 V7 in replicating daily rainfall and regional rainfall regimes in the amazon basin (1998–2013). Remote Sens. 10, 1879. doi:10.3390/rs10121879
Ministry of Energy and Mineral Resources (2021). Electricity statistic 2021. Available at: https://gatrik.esdm.go.id/assets/uploads/download_index/files/6e4c6-statistik-2021-rev-2-.pdf.
Ministry of Energy and Mineral Resources (ESDM) (2021). Electricity supply business plan (RUPTL) PT PLN 2021-2030. Ministry Energy Mineral Resour. (ESDM).
Mohd Zad, S. N., Zulkafli, Z., and Muharram, F. M. (2018). Satellite rainfall (TRMM 3B42-V7) performance assessment and adjustment over pahang river basin, Malaysia. Remote Sens. 10, 388. doi:10.3390/rs10030388
Prasetia, R., As-syakur, A. R., and Osawa, T. (2013). Validation of TRMM Precipitation Radar satellite data over Indonesian region. Theor. Appl. Climatol. 112, 575–587. doi:10.1007/s00704-012-0756-1
Preety, K., Prasad, A. K., Varma, A. K., and El-Askary, H. (2022). Accuracy assessment, comparative performance, and enhancement of public domain digital elevation models (ASTER 30 m, SRTM 30 m, CARTOSAT 30 m, SRTM 90 m, MERIT 90 m, and TanDEM-X 90 m) using DGPS. Remote Sens. 14, 1334. doi:10.3390/rs14061334
Radhika, R., Firmansyah, R., and Hatmoko, W. (2018). Perhitungan ketersediaan air permukaan di Indonesia berdasarkan data satelit. jsda 13, 115–130. doi:10.32679/jsda.v13i2.206
Rodríguez, E., Morris, C. S., and Belz, J. E. (2006). A global assessment of the SRTM performance. Photogramm. Eng. remote Sens. 72, 249–260. doi:10.14358/PERS.72.3.249
Singh, V., Bankar, N., Salunkhe, S. S., Bera, A. K., and Sharma, J. R. (2013). Hydrological stream flow modelling on Tungabhadra catchment: parameterization and uncertainty analysis using SWAT CUP. Curr. Sci. 104, 1187–1199. Available at: https://www.jstor.org/stable/24092398 (Accessed December 8, 2023).
Soekarno, I. (2020). CIRATA RESERVOIR LIFETIME PREDICTION USING NEW HYDROMETRICS AND SEDIMENT APPROACHES. GEOMATE 18. doi:10.21660/2019.64.18023
Tan, M. L., Gassman, P. W., Srinivasan, R., Arnold, J. G., and Yang, X. (2019). A review of SWAT studies in southeast Asia: applications, challenges and future directions. Water 11, 914. doi:10.3390/w11050914
The World Bank (2017). “Small hydro resource mapping in Indonesia,” in Small hydropower potential report. The World Bank.
Tomy, T., and Sumam, K. S. (2016). Determining the adequacy of CFSR data for rainfall-runoff modeling using SWAT. Procedia Technol. 24, 309–316. doi:10.1016/j.protcy.2016.05.041
Ubierna, M., Santos, C. D., and Mercier-Blais, S. (2022). “Water security and climate change: hydropower reservoir greenhouse gas emissions,” in Water security under climate change. Editors A. K. Biswas, and C. Tortajada (Singapore: Springer), 69–94. doi:10.1007/978-981-16-5493-0_5
Wahab, M. F., Yanti, R. M. K., Fauzi, A., Hermawan, M. I., Arya, D. K., and Rizaldi, A. (2023). Identifikasi Potensi Hydropower untuk Menyokong Ketersediaan Energi di Wilayah Ibu Kota Negara (IKN). CIVED 10, 140. doi:10.24036/cived.v10i1.122066
Wang, X., Alsaleh, M., and Abdul-Rahim, A. S. (2024). The role of information and communication technologies in achieving hydropower sustainability: evidence from European Union economies. Energy and Environ. 35, 1550–1572. doi:10.1177/0958305X221137566
Whitaker, M., Heath, G. A., O’Donoughue, P., and Vorum, M. (2012). Life cycle greenhouse gas emissions of coal-fired electricity generation: systematic review and harmonization. J Industrial Ecol. 16. doi:10.1111/j.1530-9290.2012.00465.x
World Meteorological Organization (2008). in Guide to hydrological practices. 6th ed. (Geneva, Switzerland: WMO).
Yang, J., Reichert, P., Abbaspour, K. C., Xia, J., and Yang, H. (2008). Comparing uncertainty analysis techniques for a SWAT application to the Chaohu Basin in China. J. Hydrology 358, 1–23. doi:10.1016/j.jhydrol.2008.05.012
Yang, L., Meng, X., and Zhang, X. (2011). SRTM DEM and its application advances. Int. J. Remote Sens. 32, 3875–3896. doi:10.1080/01431161003786016
Yanto, , Livneh, B., Rajagopalan, B., and Kasprzyk, J. (2017). Hydrological model application under data scarcity for multiple watersheds, Java Island, Indonesia. J. Hydrology Regional Stud. 9, 127–139. doi:10.1016/j.ejrh.2016.09.007
Yi, C.-S., Lee, J.-H., and Shim, M.-P. (2010). Site location analysis for small hydropower using geo-spatial information system. Renew. Energy 35, 852–861. doi:10.1016/j.renene.2009.08.003
Keywords: the Nusantara capital city (IKN), energy transition, hydropower, potential, diversion algorithm, SWAT
Citation: Kuntoro AA, Roesbianto ASB, Farid M, Kardhana H, Rohmat FIW, Rizaldi A, Kusuma MSB, Adityawan MB and Wahid AN (2024) Utilization of satellite data in determining hydropower potential to support energy security in new capital city region of Indonesia. Front. Earth Sci. 12:1371356. doi: 10.3389/feart.2024.1371356
Received: 16 January 2024; Accepted: 20 November 2024;
Published: 04 December 2024.
Edited by:
Paweł Tomczyk, Wroclaw University of Environmental and Life Sciences, PolandReviewed by:
Muhammad Shahid, Brunel University London, United KingdomMohd Alsaleh, Shanghai Ocean University, China
Copyright © 2024 Kuntoro, Roesbianto, Farid, Kardhana, Rohmat, Rizaldi, Kusuma, Adityawan and Wahid. This is an open-access article distributed under the terms of the Creative Commons Attribution License (CC BY). The use, distribution or reproduction in other forums is permitted, provided the original author(s) and the copyright owner(s) are credited and that the original publication in this journal is cited, in accordance with accepted academic practice. No use, distribution or reproduction is permitted which does not comply with these terms.
*Correspondence: Azman Syah Barran Roesbianto, YXptYW5zeWFoYnJAZ21haWwuY29t
 Arno Adi Kuntoro
 Azman Syah Barran Roesbianto
 Mohammad Farid
 Hadi Kardhana3
 Faizal Immaddudin Wira Rohmat
 Akbar Rizaldi