 Ismael Torres-Romero
 Alexander J. Clark
 Hongrui Zhang
 Heather M. Stoll
95% of researchers rate our articles as excellent or good
Learn more about the work of our research integrity team to safeguard the quality of each article we publish.
Find out more
ORIGINAL RESEARCH article
Front. Earth Sci. , 04 July 2024
Sec. Biogeoscience
Volume 12 - 2024 | https://doi.org/10.3389/feart.2024.1331179
This article is part of the Research Topic Application of Lipid Biomarkers and Compound-Specific Isotopes to Reconstruct Paleoenvironmental Changes in Terrestrial and Marine Sedimentary Records View all 7 articles
Introduction: The stable carbon isotope ratio of long-chain alkenones produced by marine haptophyte phytoplankton has often been used to estimate past variations in atmospheric CO2 throughout the Cenozoic. However, previous experimental studies and surveys of alkenones from surface sediment and suspended particulate matter document additional environmental and physiological influences on carbon isotopic fractionation in alkenones.
Methods: To clarify the non-CO2 effects on the alkenone carbon isotope fractionations, an important alkenone producer, Gephyrocapsa oceanica, was cultured in laboratory. To separate effects of different environment parameters, G. oceanica was grown in continuous cultures under a matrix of environmental conditions in order to explore the influence of temperature independently of CO2(aq). Through careful manipulation of the media carbon system, we can control the variation of the media CO2(aq) independently of temperature solubility. Carbon isotope fractionations from alkenones, coccolith, and particulate organic carbon were measured from this steady state system.
Results and Discussion: We find εp in alkenones and particulate organic carbon inversely correlates with temperature, and temperature affects εp more strongly than CO2(aq). The magnitude of the temperature effect can be explained by higher growth rates at warmer temperatures with a similar growth rate dependence as observed in previous cultures in which growth rate was regulated by other factors. Where the past temperature influence on growth rate could be constrained using the UK’37 alkenone index in the same samples, our finding offers an approach to deconvolve an important physiological factor affecting ancient alkenones εp, and may therefore improve past pCO2 estimates.
Carbon isotope fractionation has been documented in phytoplankton for over half a century (Deuser et al., 1968). Early cellular models, inspired by similar models for land plants (Farquhar et al., 1982), considered a fractionation control of phytoplankton cells in which the diffusive carbon flux that entered the cell was partly fixed into organic carbon, while subject to fractionation through the Rubisco enzyme. In such a system it was shown that the overall photosynthetic fractionation (εp) was dependent on the CO2 aqueous (CO2(aq)) supply, the phytoplankton growth rate, the cells surface area to volume ratio, and the cell permeability to CO2 (Rau et al., 1996). Since then, carbon isotope fractionation has been used to estimate growth rates of living photic zone phytoplankton (Laws et al., 1995; 1997), or to estimate trophic levels and animal migration (Magozzi et al., 2017), but the widest use has been to estimate variations in atmospheric CO2 in the geological past (see review by Pagani et al., 2011; Rae et al., 2021).
Biomarkers such as alkenones have been an appealing class of stable lipids for carbon isotopic analysis of both water column and sediments because their production is restricted to certain haptophytes of the Isochrysidales order. In particular, marine haptophytes with Reticulofenestrid coccoliths are the dominant alkenone producers in the modern ocean and their alkenone profile falls into the Group III haptophyte classification of Longo et al. (2016). This group includes species such as Emiliania huxleyi, Gephyrocapsa oceanica, and Gephyrocapsa muellerae, which allows for better constraining cell geometry by their carbonate fossils, coccoliths. Therefore, the use of alkenones attributable to this select group can potentially limit the known influence of the surface area/volume ratio on fractionation.
Genomics studies have concluded that these alkenone producers–species of the Gephyrocapsa genus, E. huxleyi and some Reticulofenestrids–are genetically similar and monophyletic (Bendif et al., 2019). In the modern ocean, E. huxleyi is dominant in subtropical to subpolar settings characterized by deep winter mixing and production in the spring, while G. oceanica occurs at temperatures between 12°C and 27°C but favors temperatures above 20°C such as in low latitude upwelling settings (Sett et al., 2014; von Dassow et al., 2021). E. huxleyi emerged 0.27 million years ago, and diverse Gephyrocapsa strains are recognized from the fossil record over more than 5 million years (Bown, 1998).
Yet, even when the alkenone-producing organism and its cell geometry are well constrained, previous studies from suspended particulate matter (SPM) in the ocean (Bidigare et al., 1997), surface sediments (Benthien et al., 2007; Hernández-Almeida et al., 2020; Phelps et al., 2021b), and laboratory experiments have demonstrated significant non-CO2-related effects on alkenone εp. Indeed, alkenone samples obtained from SPM produced at a range of CO2(aq) in the modern surface ocean, demonstrated that the CO2(aq) concentration is not the dominant component of variation in alkenone εp. Lower than expected εp in SPM of the higher latitudes and upwelling regions were initially attributed to higher growth rates in these regions (Bidigare et al., 1997). However, subsequent models of coccolithophorid growth rate in the ocean (Krumhardt et al., 2017; Nissen et al., 2018) have simulated significantly lower growth rates in the high latitude regions compared to low latitude regions. This is because at the low temperatures of higher latitude regions, models simulate lower maximum growth rates for a given degree of nutrient or light limitation. This paradox in explanations has been reviewed in (Hernández-Almeida et al., 2020; Phelps et al., 2021b). Experimental cultures of alkenone producers have evaluated the effects of varying CO2(aq) on fractionation. In some studies changing nitrogen availability (Bidigare et al., 1997), varying irradiance, or day length have been employed to modulate growth rate variability (Rost et al., 2002; Tchernov et al., 2014). Given a strong influence of light, growth rate has been considered to have negligible effect on εp in some formulations (Phelps et al., 2021b). To date, the effect of temperature-regulated growth rate variations on εp has not been rigorously evaluated. One published experiment varied temperature but maintained a constant pCO2, leading to an inverse variation of CO2(aq) and growth rate due to temperature-controlled CO2 solubility (Tchernov et al., 2014).
To better characterize the influence of temperature on εp, we grew continuous cultures of G. oceanica. We used a turbidostat system, in which the CO2(aq) can be manipulated independently of the temperature solubility effect through manipulating the partial pressure of CO2 bubbled into the media as well as the media pH and DIC. Our continuous cultures will therefore permit for the first time, the separation of the influence of CO2(aq) and temperature on εp. We find temperature to have a significant effect on εp of a magnitude consistent with control by phytoplankton growth rate. This confirms that standard temperature-dependent growth rate formulations for phytoplankton (Fielding, 2013) apply to the fractionation process. Since multiple temperature proxies exist, some derived directly from alkenones, our results can thus contribute to improved estimations of past changes in phytoplankton growth rates and more robust pCO2 reconstructions from alkenone εp.
Cultures of the monoclonal coccolithophore strain G. oceanica RCC1303 (Roscoff Culture Collection) were grown in 1 or 3-L flat panel photobioreactors (PBR; FMT150, Photon Systems Instruments) with cool-white LED panels. The setup for continuous cultivation was the same as described in Zhang et al. (2022). The PBRs were equipped with a Peltier element at the bottom to maintain a constant temperature (±0.1°C), with tested temperatures ranging from 15°C to 27°C. A sinusoidal diurnal cycle of 16:8 light/dark hours was set at different intensity maxima, with photosynthetically active radiations (PAR) between 50–200 µE (µmol photon m-2 s−1). Light intensity was checked with an external quantum photometer (LI-COR) (±1 µE). Shading was estimated by measuring the light on the opposite wall of the LED panel past the vessel with the turbid culture and accounts for less than 30% of maximum light intensity for the employed low threshold of cell concentration. In total, the cultures were grown at 22 different combinations of temperature, CO2(aq), and light (Figure 1).
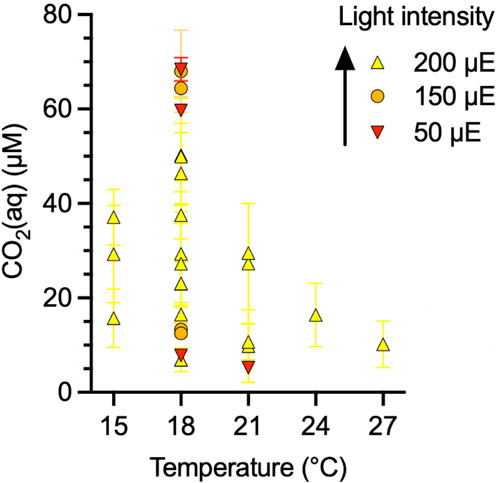
Figure 1. Matrix of growth conditions for Gephyrocapsa oceanica continuous culture samples (N = 22).
In order to maintain the cultures in log-phase, the PBRs were operated in turbidostat mode through continuous measurement of the optical density at 680 nm (OD680). Automatic dilution would be triggered when the OD680 exceeded a set threshold equivalent to 1–2×10⁵ cells mL−1. Above this threshold, a peristaltic pump would initiate dilution inflow pulses equivalent to <3% vessel volume into the PBR. Equivalent outflow volumes were discharged into a waste bottle through an outlet tubing placed at ≈10% volume air headspace. Gas overpressure within the air headspace would facilitate liquid outflow and a constant vessel liquid volume was maintained. A gently rotating magnet was placed in the middle of the PBR and, with the aid of bubbling and daily manual resuspension, cells were kept in suspension.
Cells were kept in artificial seawater (ASW) K/2 media (Kester et al., 1967; Keller et al., 1987). To better characterize the water chemistry, Tris buffer was not added. Media was adjusted to yield an initial dissolved inorganic carbon (DIC) concentration of 2.05 or 4.10 μmol kg−1 through addition of 2.33 mmol kg−1 NaHCO3 and 1.74 mmol kg−1 HCl (double amounts for the higher DIC). The lower DIC concentration was to simulate modern ocean and the higher DIC concentration media was employed to prevent pH from falling below 7.8 during high pCO2 bubbling at 2000 ppm and still allow for coccolithophore growth. The CO2SYS excel macro (Pierrot et al., 2006) was used with inputs of pH and DIC, the NBS scale, 35‰ salinity, 7 µM phosphate, and 0 µM silicate to calculate the media’s carbonate system.
Continuous pH monitoring was done with an internal pH-probe with an integrated temperature sensor (InPro 3253SG/120/PT1000, Mettler Toledo) inserted into the PBR. The pH of harvested samples was measured externally using a pH-meter (FiveEasy, Mettler Toledo) and calibrated with NIST buffer standards (Mettler Toledo). Variability of the internal and external pH probes was within error (±0.1).
After external pH measurement, 50 mL of the harvested sample was centrifuged at 4,000 g for 5 minutes. Aliquots were taken of the supernatant and subsequently analyzed for DIC on an Apollo AS-D1 DIC-δ13C Analyzer (Apollo Scitech, United States) coupled to a Picarro G-2131-I Cavity Ringdown Spectrometer (CRDS; Picarro Inc, United States). 3.5 mL of the aliquoted supernatant were reacted with 0.9 mL of a 3% H3PO4 and 7% NaCl solution in the Apollo AS-D1. The DIC concentration was subsequently measured from the released CO2. Each measurement was performed twice for each sample. Seawater reference material from the National Oceanic and Atmospheric Administration (NOAA) batch 186 and two in-house NaHCO3 of known concentrations were used for calibration. The coupled Apollo-Picarro instrument had an analytical error of 10 µM for DIC. To confirm that stable DIC concentrations were maintained within the PBR, DIC was measured at cell harvest and at least once the day before.
Carbonate chemistry equilibrium was maintained through pre- and continuous bubbling of the PBR and fresh input media with different compressed air and CO2 mixtures. Firstly, an NDC-140 CO2 scrubber (F-DGSi) was used to remove residual CO2 from compressed air. Subsequently, a Gas Mixing System (GMS 150, Photon Systems Instruments) was used to create a mixture with a set pCO2, which flowed into a Mass Flow Controller (MFC; Vögtlin Instruments). Mixtures containing 200–2000 ppm pCO2 were used. The MFC regulated and maintained the bubbling rate at 50–100 mL min−1. Backflow and system overpressure were prevented through a metallic air tank equipped with a safety valve that would trigger above 0.2 bar between the MFC and the fresh media bottle.
After the safety valve, the mixture with set pCO2 went through a 0.2 μm gas filter and into the fresh media bottle. Bubbling occurred from the bottom of the bottle to allow for complete humidification and equilibration of the fresh media. Gas from the bottle headspace subsequently went through two more gas filters and a bubble-interrupting valve, which interrupted flow during OD680 measurements, before flowing into a U-shaped sparger at the bottom of the PBR vessel. The gas in the vessel headspace exited the PBR through shared gas- and liquid outflow tubing into the outflow bottle. Gas exited the system through a one-way gas filter valve fitted into the outflow bottle cap.
The CO2 concentration of the gaseous mixtures inputted into the PBR were measured using the Picarro CRDS and corrected with certified gas mixtures of known ppm (PanGas and Air Liquide). An aliquot from the GMS150 was used to fill air-tight gas bags and subsequently inserted into the Picarro inlet tube. Stable CO2 measurements were considered to have been reached after the inserted gas maintained a pCO2 of ±2 ppm.
At least once a day, 1 mL of culture was harvested for cell growth monitoring. Care was taken to harvest at the same hour every day throughout each experiment to minimize cell size variability. Cell density per mL and mean cell diameter were measured with a Multisizer 4e particle counter and sizer (Beckman Coulter). Cell volume per mL was also measured, assuming a spherical shape. As coccolithophores tend to divide during the dark and grow in size during the light period, care was taken to include entire day/night cycles for growth rate (μ) calculations. As such, cell concentrations were measured at 24-h intervals. For an ideal turbidostat, µ is the same as the dilution rate (D). However, there are several factors in our system that cause differences from an ideal turbidostat: (i) non-homogenous growth due to day/night cycles, (ii) dilution occurred in pulses rather than constant dilution, and (iii) a fraction of cells flocculated and did not grow in suspension with equal exposure to light. Thus, to account for small daily fluctuations in cell concentration, we adapted the growth rate calculation from Shuler and Kargi, (2008) in Eq. 1:
where X0 is the cell concentration at time 0 (t0), X1 is the cell concentration after 1 day (t1), V0 is the outflow volume, VH is the volume harvested during sampling, and VPBR is the PBR vessel liquid volume without in or outflow.
Cell growth in the turbidostat varied considerably between conditions. During our experiments, we experienced difficulties in establishing steady state, continuous cultures after initial inoculation. The method that led to a higher degree of success included halting the magnet stirring and gas bubbling after inoculation. The culture would then be kept in batch mode until the target concentration was reached and, when switching to turbidostat mode, stirring and bubbling were kept at a minimal intensity to homogenize the cultures but still reach the target pH or CO2(aq) levels. Nonetheless, a peak of loose coccoliths was visible in our Coulter counter measurements and microscope observations. Altogether, we believe that during growth inside our PBRs, coccolithophores must be affected by different degrees of shear stress potentially triggering partial cell damage or lysis (Thomas and Gibson, 1990). Given that cultures had 1.2 ± 0.9 loose coccoliths per cell, the mortality rate should be below 10% assuming more than 10 coccoliths per cell.
An aliquot of 50 mL of cultures was snap-frozen in liquid nitrogen and filtered on precombusted quartz fiber filters (QM-A, Whatman). In order to remove the inorganic carbon through conversion of CaCO3 into gaseous CO2, the filters were placed inside a desiccator and exposed to acid fumes originating from 50 mL of a 6% H2SO3 solution. The acid solution was evaporated through maintaining the vacuum below 20 mbar. The desiccator was closed for at least 24 h before reopening to allow for a complete reaction. This procedure was verified to fully remove CaCO3 carbon from filters. Subsequently, the filters were dried overnight at 60°C, compacted, and wrapped in tin cups using a manual press. The wrapped filter pellets were first introduced to a ThermoFisher Flash-EA 1112 with a Conflo IV interface, combusted in an oxidation column at 1,020°C, and then passed through a reduction column at 650°C to produce N2 and CO2. These gases were separated by chromatography and transferred to a ThermoFisher Delta V-IRMS through an open split for on-line isotope measurement.
One to five million cells were filtered in triplicate on 0.8 μm polycarbonate membranes (Whatman Cyclopore), with their ASW flow-through discarded. The residue on the filters were washed with milli-Q water and stored at −20°C. The PIC of the filter residue was dissolved through the immersion and vortexing in 1 mL 2% HNO3 solution. The solution was then centrifuged at 11,000 g for 2 min, with cell debris collecting at the bottom while the dissolved PIC went into the supernatant. An aliquot of 400 μL of the supernatant was transferred into Teflon tubes for Inductively Coupled Plasma-Mass Spectrometry analysis (Agilent 8800 ICP-QQQ-MS). The concentration of PIC was calculated through the measured molar concentration of Ca and harvested cell count, and is expressed as pg CaCO3 per cell.
About 106–107 cells were harvested from the PBRs in duplicate. Cells were pelleted at 4,000 g for 5 min, the supernatant discarded, and the pellet snap-frozen in liquid nitrogen and stored at −20°C. Pellets were thoroughly resuspended in 1 mL pure methanol and transferred to 1.5 mL tubes. Pigment extraction was then allowed for at least 1 hour at −20°C. Tubes were centrifuged for 5 min at 11,000 g, with supernatants transferred into polystyrene cuvettes for spectrophotometer readings at 470, 652.4, 665.2, and 750 nm. The empirical formula in Eq. 2 was employed to quantify chlorophyll (Lichtenthaler, 1987):
After the methanol extraction of the previous section, cell pellets were dried at 60°C overnight. Aliquots of 300 µg of the remaining coccolith powder were transferred into glass vials, then closed air-tightly and flushed with He. Calcite was dissolved with five drops of orthophosphoric acid at 70°C in the same Gas Bench system. The reacted PIC δ13C and δ18O were measured and calibrated with in-house standards that were calibrated with the above-mentioned international standards. The carbon isotope fractionation between coccoliths (or PIC) and DIC was calculated as in Eq. 3:
Water δ18O was analyzed on a Picarro L2120-i cavity ringdown spectrometer using reference water materials: SLAP2, GRESP and VSMOW2. Each water sample without cells was injected ten times and first two to four injections were discarded to avoid effects of instrumental memory. Accuracy (2σ) for δ18O was 0.2‰, based on reproducibility of six measurements of USGS W-67400-S international standard.
The oxygen isotope fractionation between coccoliths and water was calculated as follows in Eq. 4:
where δ18O (‰ VSMOW) = 1.03092* δ18O (‰VPDB) + 30.92.
Duplicate or triplicate samples of 100–200 mL of G. oceanica were harvested on precombusted glass fiber filters, snap-frozen in liquid nitrogen, and stored at −20°C. Extraction and quantification of the total lipid fraction was performed using an isopropanol and methyl tert-butyl ether (MTBE) protocol (Légeret et al., 2016). One mL of preheated isopropanol containing 0.01% butylated hydroxytoluene was added to a vial containing the filter in order to unfreeze the pellet. Vortexing and sonication then homogenized and suspended the pellet into the solution. Immediate heating at 85°C for 10 min caused cells lysis and inactivation of lipases. The solution was then allowed to cool down to room temperature. To account for extraction yield and quantification of lipids, 10 µg of standard C27 alkenone (14-heptacosanone) (Sigma) were added. Then to allow for phase separation, 3 mL of MTBE were added, the solution was vortexed, 1 mL of DI water was added, and centrifuged for 5 min at 3,200 g. The upper organic phase, which is free of cell debris and the filter, was transferred to a clean glass tube. Re-extraction with an additional 1 mL MTBE and pooling of the organic phases gave higher extraction yields. The organic solvents were evaporated in a bath of ≤30°C and under a gentle N2 (g) stream. Lipids were re-dissolved in hexane or toluene for gas chromatographic (GC) analysis of alkenones.
The alkenone compositions of the continuous cultures were quantified through gas chromatography-flame ion detection (GC-FID). Alkenones were separated with a Thermo GC-FID (Trace 1,310) on a VF-200 ms of 60 m x 0.25 mm, 0.25 µm film column. Samples were injected with a TriPlus RSH Autosampler to the column using the PTV inlet in pulsed splitless mode with H2 as carrier gas. The detector temperature was 320°C with the following oven settings: 120°C for 1 min, ramp up to 200°C at 40°C/min, and up to 300°C at 5°C/min, then hold for 15 min, heat up to 320°C at 10°C/min and hold for 1 min. Alkenones were quantified with the internal standard C27 alkenone accounting for extraction yields.
The stable carbon isotopic compositions were determined using GC-isotope ratio mass spectrometry (GC-IRMS) consisting of a Thermo Trace 1310 GC detector and a combustion reactor oxidating alkenones to CO2 (GC Isolink II). Alkenones were separated in a Rtx 200, 0.32 mm ID, 0.5 µm, 60 m column (Restek). Injection was splitless with helium as a carrier gas at a constant flow of 2 mL min−1 and detector temperature of 320°C. Oven temperature cycle was set at 90°C for injection to be ramped after 1 min to 250°C at 25°C min−1, 1°C min−1 to 305°C, and finally to 320°C at 10°C min−1. The, temperature was kept isothermal for 10 min. Reported C isotope values were corrected with an n-alkane mixture (A7, Dr. Arndt Schimmelmann, Indiana University). Each biological replicate was injected three times and mean values were reported in ‰ relative to VPDB for δ13C.
The carbon isotope fractionation between alkenones and CO2(aq) (
Similarly, the carbon isotope fractionation between POC and CO2(aq) (
The δ13CCO2aq in Eqs 5 and 6 was calculated by measured DIC carbon isotope ratios (
where T is the temperature in K.
In our dataset of 22 cultures at different CO2(aq), temperature and light conditions (Figure 1), the δ13C of alkenones, POC and coccoliths span from −34.5 to −24.4‰, −30.8 to −19.9‰, and −6.0 to −1.4‰, respectively (Dataset 1). The difference between δ13C of POC and δ13C of alkenone is not constant as it varies from −1.4 to −5.1‰ (Figure 2). Their relationship can be estimated with the regression in Eq. 8:
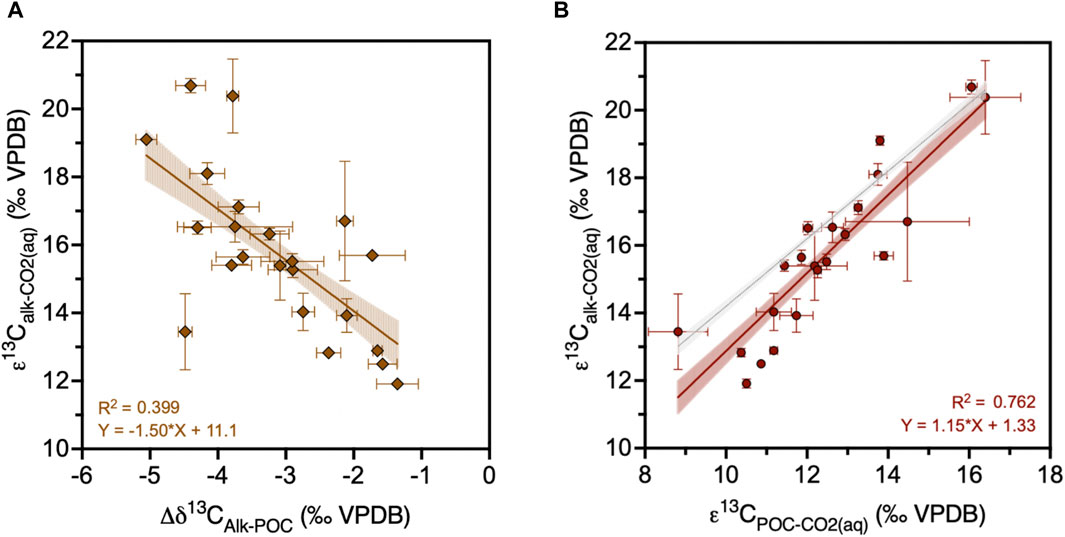
Figure 2. Carbon isotope fractionation of alkenone (εalk) samples (N = 22) in function of (A) the difference between δ13C of alkenones and δ 13C of POC, and (B) carbon isotope fractionation of POC (εPOC). Red line shows best fit for measured εalk against measured εPOC. Regression slope is 1.15 ± 0.0582 (SE), significantly different than 1 (at 95% confidence). Black line shows εalk calculated from εPOC assuming a constant 4.2‰ difference between δ13C of alkenones and δ 13C of POC.
The isotope measurements are analyzed together with environmental and physiological parameters and plotted in a correlation matrix (Figure 3). The δ13C difference between alkenones and POC (Δδ13Calk-POC) is not correlated with the amount of POC per cell nor its allocation into alkenones (alkenones/POC). However, the Δδ13Calk-POC is reduced when the carbon isotopic fractionation into alkenones (εalk) and POC (εPOC) is lower, indicating a greater divergence of isotopic composition in conditions that cause greater carbon isotopic fractionation. Both εalk and εPOC are similarly controlled: both have a positive correlation with light and a negative correlation with temperature, UK’37, alkenones/POC, chlorophyll/cell, and µ. Because higher light levels correlate with an increased fractionation, the Δδ13Calk-POC is also moderately correlated with light. Surprisingly, our correlation matrix did not identify a positive linear correlation between εalk or εPOC with CO2(aq).
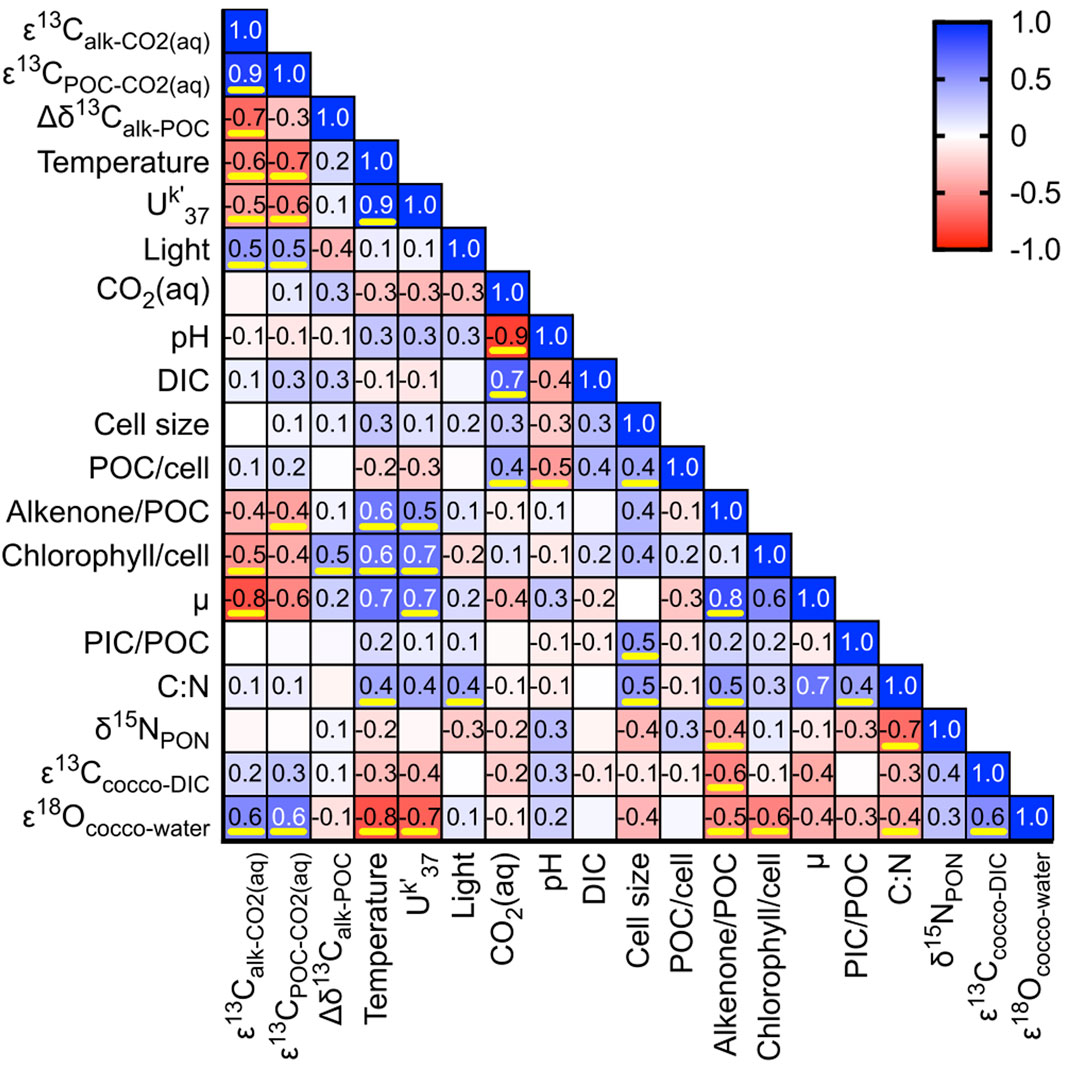
Figure 3. Heatmap of Pearson correlation coefficients. Pairs whose two-tailed p-value is <0.05 are underlined in yellow. Abbreviations: cocco, coccolith, C:N, carbon/nitrogen ratio; DIC, dissolved inorganic carbon; µ, growth rate; PIC, particulate inorganic carbon; POC, particulate organic carbon; PON; particulate organic nitrogen; ε13C, carbon isotope fractionation; ε 18O, oxygen isotope fractionation.
When we group cultures by temperature, at any given temperature there is a positive correlation between εalk (and εPOC) and CO2(aq) within the CO2(aq) range of 5.2–37.5 µM, but not for the four cultures grown at the lowest pH conditions and higher CO2(aq) range of 59.7–68.4 µM (Figure 4AB). When examining the subset of the 14 cultures at 200 µE light, the positive correlation of εalk (and εPOC) with CO2 is also evident for a given temperature (Figure 4CD). Since CO2(aq) solubility is affected by temperature, and both parameters show opposite relationships with εalk (and εPOC), we isolate the temperature effect in Figure 5. Indeed, at similar CO2(aq), higher temperatures lead to lower εalk (and εPOC). In our culture subset with available growth rate data (N = 9), µ has a significantly negative correlation with εalk (Pearson r = −0.79, p = 0.012) (Figure 6).
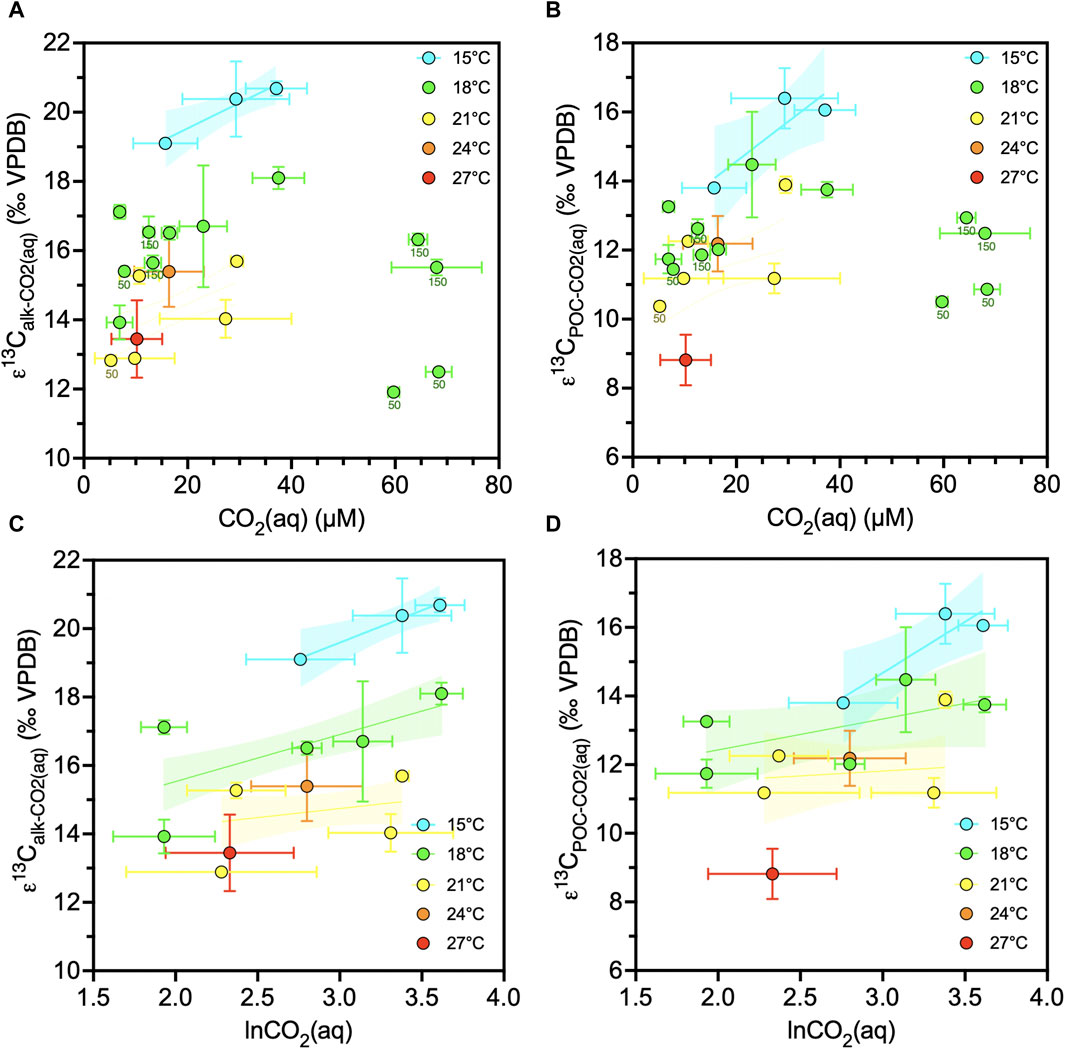
Figure 4. Changes of alkenone or POC carbon isotope fractionation due to CO2. (A) Alkenone ε13C in function of linear CO2(aq) for all the cultures (N = 22). (B) POC ε13C in function of linear CO2(aq) for all the cultures (N = 22). (C) Alkenone ε13C in function of lnCO2(aq) for the 200 µE subset (N = 14). (D) POC ε13C in function of lnCO2(aq) for the 200 µE subset (N = 14). Culture data are grouped per temperature and showing regression lines with 95% confidence intervals for each temperature. Datapoint labels indicate light intensity in µE when different than 200 µE. Error bars show one standard deviation.
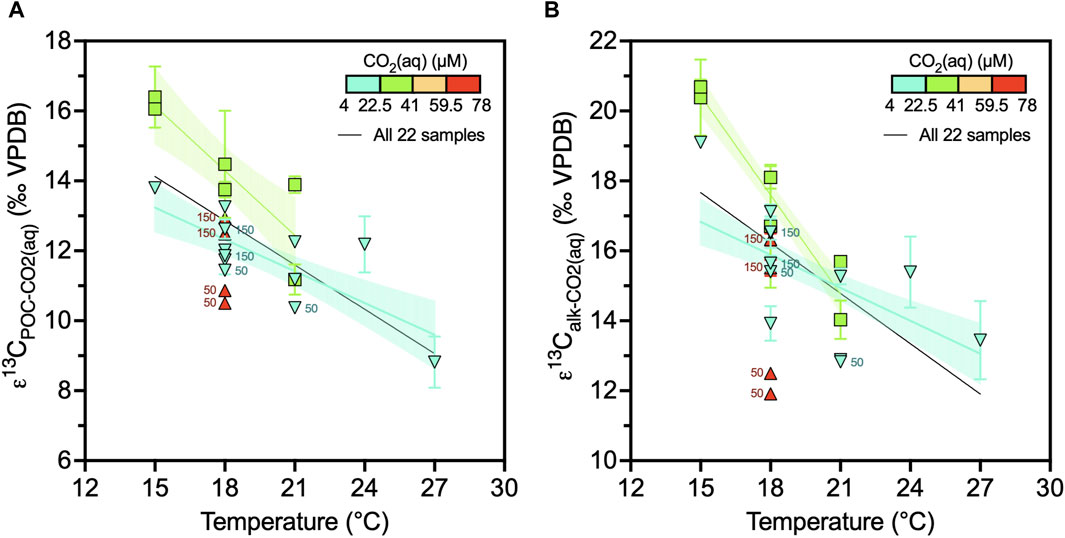
Figure 5. Changes of alkenone or POC carbon isotope fractionation due to temperature. (A) Alkenone ε13C in function of temperature for all the cultures (N = 22). (B) POC ε13C in function of temperature for all the cultures (N = 22). Culture data are grouped per CO2(aq) and showing regression lines with 95% confidence intervals for each CO2(aq) interval. Datapoint labels indicate light intensity in µE when different than 200 µE. Error bars show one standard deviation.
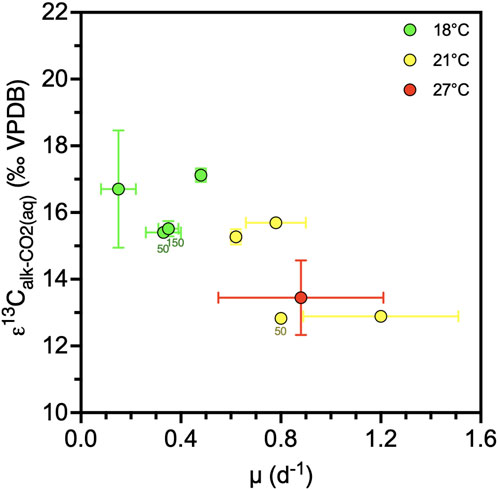
Figure 6. Changes of alkenone carbon isotope fractionation (ε13C) due to growth rate (µ) (N = 9). Colors indicate temperature. Datapoint labels indicate light intensity in µE when different than 200 µE. Error bars show one standard deviation.
After identifying the complex non-linearity and multivariate effects of temperature, light, and CO2(aq) on εalk or εPOC, we run several combinations of multiple linear regressions to obtain the highest R2 that gives the best prediction of carbon isotope fractionations from environmental variables (shown in bold in Table 1). The highest R2 regression using the cultures from the 5.2–37.5 µM range of CO2(aq) (i.e., N = 18) can predict up to 80% of variance. In this model, temperature is the most significant influence on εalk (and εPOC), with the lowest p-value, followed by CO2(aq) or ln(CO2(aq)). In this data subset, the influence of light could not be rigorously evaluated due to the dominance of experiments at 150 and 200 µE and only two at a significantly lower light intensity (50 µE), and therefore there is a low statistical significance of light on εalk and εPOC. εcocco varies from −1.2‰ to 1.1‰, and is not well predicted by temperature, light and CO2(aq) (R2 = 0.29). A linear combination of temperature, light, and CO2(aq) also provides only a weak prediction of µ (R2 = 0.42) (Table 1), potentially because the studied variable range flanks the point of maximal growth rate, and because the range of pH and DIC also influence the energy required for calcification and affect growth rate.
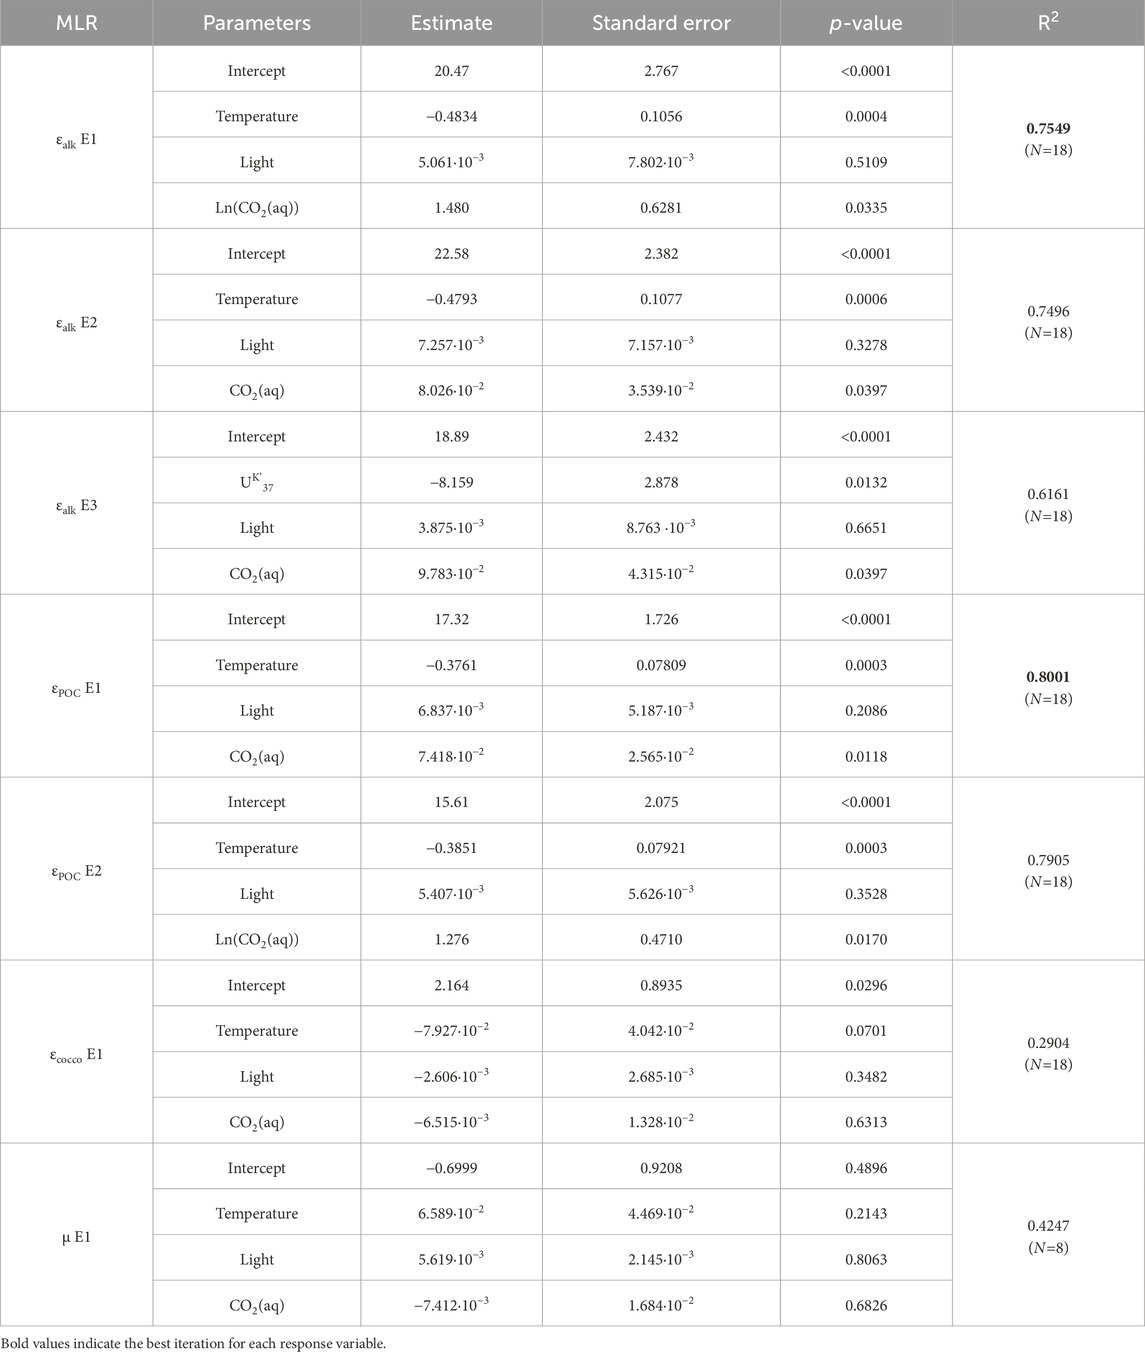
Table 1. Multiple linear regression (MLR) analysis using least squares as regression type. For each response variable (carbon isotope fractionation ε, or growth rate µ), the most significant iterations (equations E1, E2 … ) using different explanatory variables (parameters) are listed.
Our results suggest a more variable Δδ13Calk-POC compared to previous studies that suggested a constant −4.2‰ offset (Popp et al., 1998). Our maximum difference (−5‰) was similar to previous reports (Figure 2), but in our experiments, the Δδ13Calk-POC was significantly smaller when the carbon isotopic fractionation between alkenones and CO2(aq) was lower (Pearson r = −0.69, p = 0.0004). It has been previously described that alkenones or lipids in general are lower in δ13C, i.e., more 13C-depleted, than other cellular components (Popp et al., 1998). Although we have not quantified the relative abundance of lipids, previous studies suggest that alkenones reflect a high proportion of storage lipids (Bakku et al., 2018). However, we find no significant correlation between the Δδ13Calk-POC and the relative abundance of alkenones per POC. Potentially, other biomass composition changes such as the amount of carbohydrates, which we have not measured, or other parameters affecting alkenone biosynthesis and function can lead to variability in the fractionation. While both POC and alkenone δ13C show similar relationships with CO2(aq) and temperature in our study (Figures 4, 5; Table 1), future studies with larger datasets should test if the quantitative sensitivities of εalk on CO2 differ from those of εPOC on CO2, which should be accounted for when applying εPOC culture calibrations to sedimentary εalk determinations.
Our results suggest a limited range of variation in εcocco; the δ13C of coccoliths (δ13Ccocco) is relatively close to the δ13C of DIC (δ13CDIC) and shows no systematic change with CO2(aq). For studies of the past ocean, to calculate εp, the δ13CDIC has been estimated by measuring the δ13C of planktic foraminifera or by measuring the δ13Ccocco. We find a very strong correlation (R2 = 0.894) between δ13Calk - δ13Ccocco and the εalk calculated from the measured δ13CDIC and the slope of this relationship is statistically indistinguishable from −1 (Figure 7). This relationship could be advantageous because in paleo applications, the estimation of δ13C of DIC can be challenging due to limited planktic foraminifera abundance, uncertain vital effects in extinct planktic forams, and different depth or seasonal habitat of alkenone producers and planktic foraminifera. Several studies have applied δ13Ccocco as a DIC indicator (Pagani et al., 2005; Badger et al., 2013) and our results support this practice for sediment fractions with coccoliths dominated by alkenone producer species.
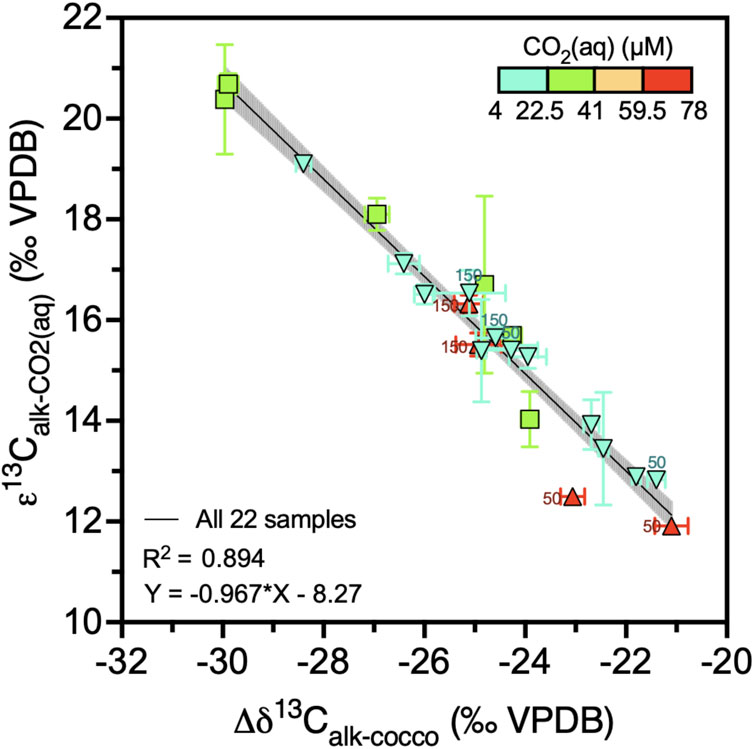
Figure 7. Alkenone carbon isotope fractionation in function of the difference between alkenone δ13C and coccolith δ13C. Colors indicate the CO2(aq) range and black line shows regression with 95% confidence intervals. Datapoint labels indicate light intensity in µE when different than 200 µE. Error bars show one standard deviation.
We find that the carbon isotope fractionation due to photosynthesis, εp, decreases significantly with increasing temperature (Pearson r = −0.6, N = 22, p = 0.0034) (Figure 5). One explanation could be that higher temperature increases enzymatic rates and metabolic rates. We do not have accurate growth rate measurements for all experiments; thus, we cannot confirm whether higher metabolic rates directly translate to higher net cell division rates. In a subset of our data with more robust cell division rates, we do find higher division rates at higher temperatures, as predicted by numerous previous studies of phytoplankton growth within their temperature range. G. oceanica RCC1303 was isolated at the Arcachon Bay on the coast of France, where monthly average sea surface temperatures range between 12°C and 20°C, and the cultured range therefore falls well within the temperature variation to which the strain was exposed. Attempts of growing this strain at 12°C or 30°C in our continuous cultivation setup were unsuccessful.
On the basis of theoretical grounds (Rau et al., 1996) as well as a previous culture metanalysis (Stoll et al., 2019), it has been shown that higher coccolithophorid growth rate, µ, decreases εp. Most culture experiments measuring εp have regulated growth rate using light intensity and/or day length (Rost et al., 2002; 2006), and a few have regulated nutrients (Bidigare et al., 1997). Our results suggest that the temperature influence on growth rate may strongly affect εp. As shown in our subset of cultures with more robust cell division rates (Figure 5), we estimate a slope of εp dependence on instantaneous growth rate of −3.85‰ ± 0.583‰ day div−1, which is a similar order of magnitude as that found in previous culture metanalysis: slope of −6.98‰ day div−1 (95% CI: 8.16 to −5.81) (Stoll et al., 2019). Given the uncertainties in our growth rate quantification, to better evaluate whether a temperature dependence on growth rate might drive the temperature dependence of εp in our dataset, we estimate the expected growth rate for each temperature using the temperature sensitivity of Fielding (2013). A maximum growth rate of 1.3–2.1 d−1 over the temperature range 15°C–27°C for nutrient replete conditions such as our cultures is found.
We then estimate the consequences of this growth rate variation on εp, using the εp sensitivity to growth rate from Stoll et al. (2019): 95% CI of −8.16 to −5.81‰ day div−1. This calculation predicts a 5‰ range in εp across our temperature range (Figure 8). The resulting calculated temperature sensitivity of εp is statistically identical to the sensitivity determined from the MLR between temperature and εp in our cultures (Table 1; Figure 8). This strongly suggests that the magnitude of the temperature-sensitive εp variation we observe could be fully explained by the temperature sensitivity of µ. Because of the dominance of light-regulated growth rate culture studies, there have been suggestions that µ is not a significant term for εp prediction and that only the light intensity was sufficient (Phelps et al., 2021a; 2021b). Our results suggest that, independent of light, growth rate itself is a necessary term for εp prediction.
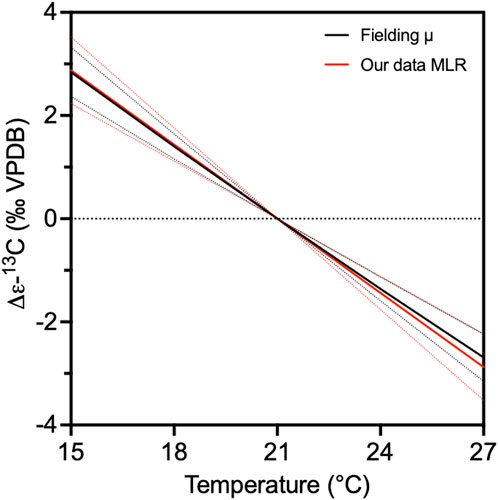
Figure 8. Temperature sensitivity of ε13C. We plot the difference in εp (Δε13C) at a given temperature relative to εp calculated for a temperature of 21°C. The black line shows the dependence between ε13C and temperature when growth rate is calculated from the temperature dependence described by Fielding, (2013), and the growth rate effect on εp is calculated from Stoll et al. (2019) using the slope of −6.98 (95% CI -8.16 to −5.81). The red line shows the ε13C variation in function of temperature derived from the MLR (εalk E2 in Table 1).
In a previous turbidostat culture growing E. huxleyi with 24 h illumination (Tchernov et al., 2014), constant pCO2 was maintained while manipulating temperature, leading to covariation of temperature and CO2(aq). As temperature decreased from 18°C to 7°C, CO2(aq) increased from 12 to 18 μM and εp increased from 10‰ to 18‰. From the slope between temperature and POC in our G. oceanica cultures, the 11° cooling would be expected to contribute about 4‰ increase in εp, suggesting that the remaining 4‰ increase in εp was due either to the increased CO2(aq) or to the amplified change in growth rate (decreased from 1.2 to 2 days−1) compared to that expected from the growth rate sensitivity to temperature of cultures reported in Fielding (2013) (Supplementary Figure S1).
Our finding of a temperature effect on εp could be relevant for pCO2 proxy reconstructions. Diverse studies confirm temperature-regulated growth rates in natural ocean settings. In situ estimations of phytoplankton community µ in the upper photic zone (<30m depth), determined by radiolabel incubations with correction for grazing losses, reveal a strong temperature-growth rate relationship which is also reflected in lower growth rates in higher latitudes (Sherman et al., 2016). A field compilation (835 determinations) found a similar temperature-µ relationship to culture experiments (Fielding, 2013) and to µ estimates from satellite and various earth system models (Behrenfeld et al., 2005; Sherman et al., 2016). In marine particulates of the southern Yellow Sea, εp correlated strongly with temperature but not to in situ CO2(aq) (Liu et al., 2022). The residual non-CO2 variation in εp in alkenone photic zone samples is significantly correlated with temperature (Hernández-Almeida et al., 2020).
While some studies have proposed that cell size may be an indicator that allows growth rate effects on εp to be accounted for in pCO2 studies (Zhang et al., 2020), this approach has been controversial (Phelps et al., 2021a). We find no significant correlation between εalk (and εPOC) and cell size, or between temperature and cell size (Figure 3). This suggests that the large temperature influence on metabolic rates and εp fractionation is not manifest in cell or coccolith size. We conclude that other approaches must be used to account for this temperature driven growth rate effect in pCO2 estimations.
The significance of temperature-modulated growth rate effects on εp suggests that direct coccolithophore-derived temperature proxies may be more useful to constrain growth rate effects on εp for estimation of past CO2. One approach would be a direct regression of εp from CO2(aq) and temperature sensitive proxy parameters such as the UK’37 ratio from the same alkenones. This multivariate regression has a r2 of 0.62 (Table 1, εalk E3). We additionally note a strong correlation of εp to ε18Ococco-water as temperature is the dominant control on oxygen isotope fractionation in our study (Figure 3). However, for estimation of coccolith calcification temperatures in past oceans, δ18Ococco is likely less useful than alkenone temperature, as the seawater δ18O is variable and cannot be independently constrained. A disadvantage of the linear regression of UK’37 to estimate εp is that it does not account for the nonlinear relationship between temperature and growth rate.
We therefore suggest that a more robust approach may be the use of alkenone-derived temperature proxies to estimate the temperature influence on growth rate for past alkenone production using standard formulations of coccolithophorid growth rate in the ocean (Krumhardt et al., 2017). The results from our new G. oceanica cultures suggest a net εp dependence on temperature-regulated growth statistically indistinguishable from that derived previously from metanalysis of culture εp and temperature sensitivity of growth rate (section 4.2). Consequently, the new culture results support the approach used in previous studies accounting for the temperature sensitive growth rate effects on εp such as applied to glacial-interglacial sequences (Stoll et al., 2019) or Late Miocene pCO2 estimations from εp (Tanner et al., 2020).
Because declining atmospheric pCO2 leads to a decline in earths mean surface temperature with a magnitude defined by earth system sensitivity, coupled declines in pCO2 and temperature (and growth rates) may lead to opposing effects on εp. Several published paired εp and alkenone SST records for the Pliocene feature 3°C–7°C cooling and 0.4‰–2‰ declines in εp. If the measured εp were adjusted to remove the effect of changing temperature and growth rate as determined in our G. oceanica cultures, the adjusted εp would exhibit a steeper decline in all sites, ranging from 2.6‰ to 5.6‰ (Supplementary Figure S2). Of two examined Paleogene paired εp and alkenone SST records, that of ODP 511 exhibits a 9°C cooling over the latest Eocene, which could contribute to a nearly 5‰ increase in εp due to temperature-stimulated growth rate. Accounting for this potential effect would impose a 5‰ decrease in adjusted εp. Because temperatures in low latitude sites exceed the alkenone proxy sensitivity, the magnitude of cooling over the Cenozoic is not well constrained for sites such as western tropical Atlantic ODP Site 925, which provides the longest continuous phytoplankton pCO2 estimates (Zhang et al., 2013). If GDGT temperature estimates at this site are accurate, then the temperature-growth rate effect has little influence on the εp over this time interval. Clumped isotopic temperatures on coccoliths (Mejía et al., 2023) might be used to test the stability of coccolithophorid growth temperatures over this time interval at this site.
While our new results, coupled with estimates of coccolithophorid growth temperature, provide a mechanism for accounting for the effect of temperature-driven variation in phytoplankton growth rates on εp, temperature is not the only influence on phytoplankton growth in the ocean. Nutrient and light limitation also have the potential to reduce growth rates, and independent proxies for these factors have been elusive. Relieving light limitation may increase growth rate which would tend to decrease εp. Yet, in culture experiments, light intensity and photoperiod have been shown to have a large positive direct effect on εp in coccolithophorids as well as other phytoplankton (Rost et al., 2002; Cassar et al., 2006; Phelps et al., 2021a). A comprehensive assessment of light and growth rate effects in εp should consider these parameters as well.
Culture experiments of a strain of G. oceanica document that increasing temperature decreases the carbon isotopic fractionation during photosynthesis (εp) when measured either as εPOC or εalk. This result is consistent in trend and magnitude with the expected increase in growth rate with increasing temperature, and decreased εp with increasing growth rate. Our experiments characterized the effect in a single alkenone-producing species, which could be grown in continuous culture only over the range from 15°C to 27°C, so it could be advantageous for future experiments to confirm the observed effect in strains which can be cultured in the lower temperature ranges typical of higher latitude oceans. This experiment evaluated the effect of temperature in nutrient-replete cultures, and future experiments would be required to evaluate the interplay of temperature and nutrients on growth limitation and isotopic fractionation.
The finding that temperature influences εp via growth rate has significant implications for the application of εp from marine sediments as an indicator of past pCO2. Where the surface ocean has experienced significant cooling accompanying a decline in pCO2, the decreased growth rate may attenuate the declining trend in εp resulting from declining CO2(aq). Employing estimates of SST decline from alkenone unsaturation to correct for this temperature-induced growth rate effect may be one approach to improve the detection of past trends in pCO2 from alkenone-producing phytoplankton.
The original contributions presented in the study are included in the article/Supplementary Material, further inquiries can be directed to the corresponding authors.
IT-R: Conceptualization, Data curation, Formal Analysis, Investigation, Methodology, Visualization, Writing–original draft, Writing–review and editing. AC: Formal Analysis, Investigation, Methodology, Writing–review and editing, Writing–original draft. RW: Investigation, Methodology, Validation, Writing–review and editing. MJ: Investigation, Methodology, Validation, Writing–review and editing. HZ: Investigation, Writing–review and editing. HS: Conceptualization, Funding acquisition, Investigation, Supervision, Writing–original draft, Writing–review and editing.
The author(s) declare financial support was received for the research, authorship, and/or publication of this article. This study was supported by the Swiss National Science Foundation (Award 200,021_182070 to HMS) and ETH core funding. Open access funding by ETH Zurich.
The authors declare that the research was conducted in the absence of any commercial or financial relationships that could be construed as a potential conflict of interest.
All claims expressed in this article are solely those of the authors and do not necessarily represent those of their affiliated organizations, or those of the publisher, the editors and the reviewers. Any product that may be evaluated in this article, or claim that may be made by its manufacturer, is not guaranteed or endorsed by the publisher.
The Supplementary Material for this article can be found online at: https://www.frontiersin.org/articles/10.3389/feart.2024.1331179/full#supplementary-material
Badger, M. P. S., Lear, C. H., Pancost, R. D., Foster, G. L., Bailey, T. R., Leng, M. J., et al. (2013). CO2 drawdown following the middle Miocene expansion of the Antarctic Ice Sheet. Paleoceanography 28, 42–53. doi:10.1002/palo.20015
Bakku, R. K., Araie, H., Hanawa, Y., Shiraiwa, Y., and Suzuki, I. (2018). Changes in the accumulation of alkenones and lipids under nitrogen limitation and its relation to other energy storage metabolites in the haptophyte alga Emiliania huxleyi CCMP 2090. J. Appl. Phycol. 30, 23–36. doi:10.1007/s10811-017-1163-x
Behrenfeld, M. J., Boss, E., Siegel, D. A., and Shea, D. M. (2005). Carbon-based ocean productivity and phytoplankton physiology from space. Glob. Biogeochem. Cycles 19. doi:10.1029/2004GB002299
Bendif, E. M., Nevado, B., Wong, E. L. Y., Hagino, K., Probert, I., Young, J. R., et al. (2019). Repeated species radiations in the recent evolution of the key marine phytoplankton lineage Gephyrocapsa. Nat. Commun. 10, 4234–4239. doi:10.1038/s41467-019-12169-7
Benthien, A., Zondervan, I., Engel, A., Hefter, J., Terbrüggen, A., and Riebesell, U. (2007). Carbon isotopic fractionation during a mesocosm bloom experiment dominated by Emiliania huxleyi: effects of CO2 concentration and primary production. Geochimica Cosmochimica Acta 71, 1528–1541. doi:10.1016/j.gca.2006.12.015
Bidigare, R. R., Fluegge, A., Freeman, K. H., Hanson, K. L., Hayes, J. M., Hollander, D., et al. (1997). Consistent fractionation of 13C in nature and in the laboratory: growth-rate effects in some haptophyte algae. Glob. Biogeochem. Cycles 11, 279–292. doi:10.1029/96GB03939
Bown, P. R. (1998). Calcareous nannofossil biostratigraphy. 1st ed. London, UK, Norwell, MA, U.S.A. Chapman & Hall ; Kluwer Academic. [distributor].
Cassar, N., Laws, E. A., and Popp, B. N. (2006). Carbon isotopic fractionation by the marine diatom Phaeodactylum tricornutum under nutrient- and light-limited growth conditions. Geochimica Cosmochimica Acta 70, 5323–5335. doi:10.1016/j.gca.2006.08.024
Deuser, W. G., Degens, E. T., and Guillard, R. R. L. (1968). Carbon isotope relationships between plankton and sea water. Geochimica Cosmochimica Acta 32, 657–660. doi:10.1016/0016-7037(68)90055-0
Farquhar, G. D., O’Leary, M. H., and Berry, J. A. (1982). On the relationship between carbon isotope discrimination and the intercellular carbon dioxide concentration in leaves. Funct. Plant Biol. 9, 121–137. doi:10.1071/pp9820121
Fielding, S. R. (2013). Emiliania huxleyi specific growth rate dependence on temperature. Limnol. Oceanogr. 58, 663–666. doi:10.4319/lo.2013.58.2.0663
Hernández-Almeida, I., Krumhardt, K. M., Zhang, H., and Stoll, H. M. (2020). Estimation of physiological factors controlling carbon isotope fractionation in coccolithophores in photic zone and core-top samples. Geochem. Geophys. Geosystems 21, e2020GC009272. doi:10.1029/2020GC009272
Keller, M. D., Selvin, R. C., Claus, W., and Guillard, R. R. L. (1987). Media for the culture of oceanic ultraphytoplankton. J. Phycol. 23, 633–638. doi:10.1111/j.1529-8817.1987.tb04217.x
Kester, D. R., Duedall, I. W., Connors, D. N., and Pytkowicz, R. M. (1967). Preparation of artificial seawater. Limnol. Oceanogr. 12, 176–179. doi:10.4319/lo.1967.12.1.0176
Krumhardt, K. M., Lovenduski, N. S., Iglesias-Rodriguez, M. D., and Kleypas, J. A. (2017). Coccolithophore growth and calcification in a changing ocean. Prog. Oceanogr. 159, 276–295. doi:10.1016/j.pocean.2017.10.007
Laws, E. A., Bidigare, R. R., and Popp, B. N. (1997). Effect of growth rate and CO2 concentration on carbon isotopic fractionation by the marine diatom Phaeodactylum tricornutum. Limnol. Oceanogr. 42, 1552–1560. doi:10.4319/lo.1997.42.7.1552
Laws, E. A., Popp, B. N., Bidigare, R. R., Kennicutt, M. C., and Macko, S. A. (1995). Dependence of phytoplankton carbon isotopic composition on growth rate and Dependence of phytoplankton carbon isotopic composition on growth rate and (CO2)aq: theoretical considerations and experimental results (CO2)aq: theoretical considerations and experimental results. Geochimica Cosmochimica Acta 59, 1131–1138. doi:10.1016/0016-7037(95)00030-4
Légeret, B., Schulz-Raffelt, M., Nguyen, H. M., Auroy, P., Beisson, F., Peltier, G., et al. (2016). Lipidomic and transcriptomic analyses of Chlamydomonas reinhardtii under heat stress unveil a direct route for the conversion of membrane lipids into storage lipids. Plant, Cell & Environ. 39, 834–847. doi:10.1111/pce.12656
Lichtenthaler, H. K. (1987). [34] Chlorophylls and carotenoids: pigments of photosynthetic biomembranes. Methods Enzym. 148, 350–382. doi:10.1016/0076-6879(87)48036-1
Liu, Q., Kandasamy, S., Zhai, W., Wang, H., Veeran, Y., Gao, A., et al. (2022). Temperature is a better predictor of stable carbon isotopic compositions in marine particulates than dissolved CO2 concentration. Commun. Earth Environ. 3, 303–314. doi:10.1038/s43247-022-00627-y
Longo, W. M., Theroux, S., Giblin, A. E., Zheng, Y., Dillon, J. T., and Huang, Y. (2016). Temperature calibration and phylogenetically distinct distributions for freshwater alkenones: evidence from northern Alaskan lakes. Geochimica Cosmochimica Acta 180, 177–196. doi:10.1016/j.gca.2016.02.019
Magozzi, S., Yool, A., Vander Zanden, H. B., Wunder, M. B., and Trueman, C. N. (2017). Using ocean models to predict spatial and temporal variation in marine carbon isotopes. Ecosphere 8, e01763. doi:10.1002/ecs2.1763
Mejía, L. M., Bernasconi, S. M., Zhang, H., Guitián, J., Fernandez, A., Hernández-Almeida, I., et al. (2023). Clumped isotopes in globally distributed Holocene coccoliths reveal their habitat depth. Earth Planet. Sci. Lett. 619, 118313. doi:10.1016/j.epsl.2023.118313
Nissen, C., Vogt, M., Münnich, M., Gruber, N., and Haumann, F. A. (2018). Factors controlling coccolithophore biogeography in the Southern Ocean. Biogeosciences 15, 6997–7024. doi:10.5194/bg-15-6997-2018
Pagani, M., Huber, M., Liu, Z., Bohaty, S. M., Henderiks, J., Sijp, W., et al. (2011). The role of carbon dioxide during the onset of antarctic glaciation. Science 334, 1261–1264. doi:10.1126/science.1203909
Pagani, M., Zachos, J. C., Freeman, K. H., Tipple, B., and Bohaty, S. (2005). Marked decline in atmospheric carbon dioxide concentrations during the Paleogene. Science 309, 600–603. doi:10.1126/science.1110063
Phelps, S. R., Hennon, G. M. M., Dyhrman, S. T., Hernández Limón, M. D., Williamson, O. M., and Polissar, P. J. (2021a). Carbon isotope fractionation in noelaerhabdaceae algae in culture and a critical evaluation of the alkenone paleobarometer. Geochem. Geophys. Geosystems 22, e2021GC009657. doi:10.1029/2021GC009657
Phelps, S. R., Stoll, H. M., Bolton, C. T., Beaufort, L., and Polissar, P. J. (2021b). Controls on alkenone carbon isotope fractionation in the modern ocean. Geochem. Geophys. Geosystems 22, e2021GC009658. doi:10.1029/2021GC009658
Pierrot, D., Lewis, E., and Wallace, D. W. R. (2006). “MS Excel program developed for CO2 system calculations (CO2sys_v2.3xls),” in Carbon dioxide information analysis center (CDIAC) (Oak Ridge, TN: Oak Ridge National Laboratory, U.S. Department of Energy). doi:10.3334/CDIAC/otg.CO2SYS_XLS_CDIAC105a
Popp, B. N., Kenig, F., Wakeham, S. G., Laws, E. A., and Bidigare, R. R. (1998). Does growth rate affect ketone unsaturation and intracellular carbon isotopic variability in Emiliania huxleyi? Paleoceanography 13, 35–41. doi:10.1029/97PA02594
Rae, J. W. B., Zhang, Y. G., Liu, X., Foster, G. L., Stoll, H. M., and Whiteford, R. D. M. (2021). Atmospheric CO2 over the past 66 million years from marine archives. Annu. Rev. Earth Planet. Sci. 49, 609–641. doi:10.1146/annurev-earth-082420-063026
Rau, G. H., Riebesell, U., and Wolf-Gladrow, D. (1996). A model of photosynthetic 13C fractionation by marine phytoplankton based on diffusive molecular CO2 uptake. Mar. Ecol. Prog. Ser. 133, 275–285. doi:10.3354/meps133275
Rost, B., Riebesell, U., and Sültemeyer, D. (2006). Carbon acquisition of marine phytoplankton: effect of photoperiod length. Limnol. Oceanogr. 51, 12–20. doi:10.4319/lo.2006.51.1.0012
Rost, B., Zondervan, I., and Riebesell, U. (2002). Light-dependent carbon isotope fractionation in the coccolithophorid Emiliania huxleyi. Limnol. Oceanogr. 47, 120–128. doi:10.4319/lo.2002.47.1.0120
Sett, S., Bach, L. T., Schulz, K. G., Koch-Klavsen, S., Lebrato, M., and Riebesell, U. (2014). Temperature modulates coccolithophorid sensitivity of growth, photosynthesis and calcification to increasing seawater pCO2. PLOS ONE 9, e88308. doi:10.1371/journal.pone.0088308
Sherman, E., Moore, J. K., Primeau, F., and Tanouye, D. (2016). Temperature influence on phytoplankton community growth rates. Glob. Biogeochem. Cycles 30, 550–559. doi:10.1002/2015GB005272
Shuler, M. L., and Kargi, F. (2008). Bioprocess engineering: basic concepts 14. print, 2. Upper Saddle River, NJ: Prentice Hall PTR.
Stoll, H. M., Guitian, J., Hernandez-Almeida, I., Mejia, L. M., Phelps, S., Polissar, P., et al. (2019). Upregulation of phytoplankton carbon concentrating mechanisms during low CO2 glacial periods and implications for the phytoplankton pCO2 proxy. Quat. Sci. Rev. 208, 1–20. doi:10.1016/j.quascirev.2019.01.012
Tanner, T., Hernández-Almeida, I., Drury, A. J., Guitián, J., and Stoll, H. (2020). Decreasing atmospheric CO2 during the late Miocene cooling. Paleoceanogr. Paleoclimatology 35, e2020PA003925. doi:10.1029/2020PA003925
Tchernov, D., Gruber, D. F., and Irwin, A. (2014). Isotopic fractionation of carbon in the coccolithophorid Emiliania huxleyi. Mar. Ecol. Prog. Ser. 508, 53–66. doi:10.3354/meps10840
Thomas, W. H., and Gibson, C. H. (1990). Effects of small-scale turbulence on microalgae. J. Appl. Phycol. 2, 71–77. doi:10.1007/BF02179771
von Dassow, P., Muñoz Farías, P. V., Pinon, S., Velasco-Senovilla, E., and Anguita-Salinas, S. (2021). Do differences in latitudinal distributions of species and organelle haplotypes reflect thermal reaction norms within the emiliania/gephyrocapsa complex? Front. Mar. Sci. 8. doi:10.3389/fmars.2021.785763
Zhang, H., Torres-Romero, I., Anjewierden, P., Jaggi, M., and Stoll, H. M. (2022). The DIC carbon isotope evolutions during CO2 bubbling: implications for ocean acidification laboratory culture. Front. Mar. Sci. 9. doi:10.3389/fmars.2022
Zhang, Y. G., Henderiks, J., and Liu, X. (2020). Refining the alkenone-pCO2 method II: towards resolving the physiological parameter ‘b. Geochimica Cosmochimica Acta 281, 118–134. doi:10.1016/j.gca.2020.05.002
Keywords: carbon isotopic fractionation (εp), Climate proxy, alkenone, coccolithophore, paleo-CO2, Gephyrocapsa oceanica, continuous cultivation
Citation: Torres-Romero I, Clark AJ, Wijker RS, Jaggi M, Zhang H and Stoll HM (2024) Temperature-dependent carbon isotope fractionation in coccolithophores. Front. Earth Sci. 12:1331179. doi: 10.3389/feart.2024.1331179
Received: 31 October 2023; Accepted: 11 June 2024;
Published: 04 July 2024.
Edited by:
Julie Lattaud, University of Basel, SwitzerlandReviewed by:
Jun Sun, China University of Geosciences, ChinaCopyright © 2024 Torres-Romero, Clark, Wijker, Jaggi, Zhang and Stoll. This is an open-access article distributed under the terms of the Creative Commons Attribution License (CC BY). The use, distribution or reproduction in other forums is permitted, provided the original author(s) and the copyright owner(s) are credited and that the original publication in this journal is cited, in accordance with accepted academic practice. No use, distribution or reproduction is permitted which does not comply with these terms.
*Correspondence: Ismael Torres-Romero, aXNtYWVsLnRvcnJlc0BlcmR3LmV0aHouY2g=; Heather M. Stoll, aGVhdGhlci5zdG9sbEBlcmR3LmV0aHouY2g=
Disclaimer: All claims expressed in this article are solely those of the authors and do not necessarily represent those of their affiliated organizations, or those of the publisher, the editors and the reviewers. Any product that may be evaluated in this article or claim that may be made by its manufacturer is not guaranteed or endorsed by the publisher.
Research integrity at Frontiers
Learn more about the work of our research integrity team to safeguard the quality of each article we publish.