 Qingyuan Yang
 Yaobo Lu1
 Song Chen
95% of researchers rate our articles as excellent or good
Learn more about the work of our research integrity team to safeguard the quality of each article we publish.
Find out more
ORIGINAL RESEARCH article
Front. Earth Sci. , 09 April 2024
Sec. Geohazards and Georisks
Volume 12 - 2024 | https://doi.org/10.3389/feart.2024.1322036
This article is part of the Research Topic Geohazard Monitoring, Modeling, and Assessment in Harsh Environments View all 7 articles
In practical engineering, the magnitude of soil unloading rebound is closely related to the physical and mechanical properties of the soil. Therefore, there are significant differences in geological conditions among the different regions. As such, targeted research on the rebound law and calculation methods of foundation pits is needed. This article reports indoor experiments and numerical simulation methods which are used to study the trends and calculation methods of foundation pit rebound based on typical geological conditions in South China. Our findings are as follows. 1) At maximum consolidation stress ranging from 100 kPa to 400kPa, the maximum rebound rate of plain fill soil in typical soil layers is 0.0539–0.0704, the rebound rate of silty clay is 0.0373–0.0528, the rebound rate of coarse sand is 0.0296–0.0343, the rebound rate of gravelly cohesive soil is 0.0159–0.0305, the rebound rate of fully weathered granite is 0.0175–0.0344, and the rebound rate of strongly weathered granite is 0.0170–0.0379. 2) The rebound indices do not change with changes in the unloading ratio or initial consolidation stress. The rebound indices of the soil layer from top to bottom are 0.0143, 0.0119, 0.0077, 0.0096, 0.0083, and 0.0076, respectively, and a formula for calculating the rebound modulus of typical soil layers in South China was proposed. 3) The pore ratio of the soil after the end of the recompression process is lower than that which occurs after the first compression. The difference between the compression porosity ratio of the soil layer from top to bottom and the compression porosity ratio is 0.1, 0.08, 0.02, 0.06, 0.02, and 0.03, respectively. 4) The calculation of the depth of influence by the self-weight stress offset method is based on the theory of eliminating self-weight stress and unloading stress. The calculation depth is not affected by geological conditions, the formula for calculating the rebound modulus is consistent with the formula obtained from experimental research, and the calculation results are in good agreement with the numerical values.
In recent years, research has been conducted on the rebound deformation caused by excavation of foundation pits. The main related research areas are divided into three aspects: 1) the study of factors affecting rebound deformation at the pit bottom, which mainly focuses on the characteristics of the soil layer in the area where the foundation pit is located, the form of foundation pit support, excavation depth, and other factors affecting the rebound deformation of the foundation pit. 2) the study of calculation methods for rebound deformation at the pit bottom, that is, through theoretical analysis methods, to study the calculation method of foundation pit rebound deformation. 3) the study of numerical simulation of excavation of foundation pits, that is, using numerical simulation calculation methods to study the rebound deformation law of foundation pits.
When studying the influencing factors of pit bottom rebound deformation, Lambe (Lambe, 1967; Lambe, 2010) proposed that the stress path method is suitable for indoor soil tests and on-site survey tests. Many efforts use this method to qualitatively study the stress state of the soil at the bottom of a pit after unloading and to study the rebound deformation law of various soils through a large number of triaxial tests. Long et al. (Long, 2001) collected data on the deformation of soil and support structures in multiple foundation pit projects in many countries and regions and studied the deformation of foundation pits under various conditions based on the category of soil layers. Factors such as the foundation pit support stiffness, excavation depth, and pit bottom rebound stability coefficient are proposed to influence foundation pit engineering. Liu et al. (Liu and Cheng, 2010) noted that the rebound deformation can be directly calculated using the rebound modulus of the soil in the foundation pit and conducted many indoor stress path tests on the soil in soft soil areas to study the influencing factors of the rebound modulus. Their results indicate that the rebound modulus of soft soil is greater than the compression modulus obtained from conventional triaxial compression and other indoor tests and is also related to the physical properties and stress path of the soil. Li et al. (Li et al., 2011) conducted extensive consolidation and triaxial compression rebound tests on foundation pit soil samples in the Shanghai area and studied the variation in soil deformation parameters with load at different depths in the Shanghai area. The initial rebound modulus and rebound amount of soft soil are related to factors such as soil properties and maximum consolidation stress. Chen et al. (Chen et al., 2016) studied the stress changes in the soil on the sidewalls of foundation pits before, during, and after excavation and conducted a series of triaxial consolidation and shear tests. By analysing the variation characteristics of the pore water pressure, shear strength, and stress‒strain relationship of soil under different stress paths, the stress deformation characteristics of soil under complex stress conditions caused by excavation of foundation pits are obtained. Zhang et al. (Zhang et al., 2021) considered a long and large tunnel project to study the rebound deformation of foundation pits by using the finite element software PLAXIS 3D. Their results showed that the pile length, pile diameter, and pile stiffness of engineering piles significantly influence the rebound deformation of foundation pits within a certain range, but these influences are not obvious after a certain range.
Considering calculation methods for rebound deformation at the bottom of pits, Liu et al. (Liu et al., 2000) proposed the residual stress and residual stress coefficient in the excavation of foundation pits. Based on the stress path method and the residual stress principle, a residual stress method calculation model was proposed to calculate the rebound deformation at the bottom of pits. Research has shown that the unloading rebound modulus of soft soil is related to the stress path and basic physical and the mechanical effects it experiences during unloading. Pan et al. (Pan and Hu, 2002) and Li et al. (Li and Teng, 2011) analysed the rebound path characteristics of soil samples through experiments and proposed approximating the range of the soil rebound zone and strong rebound zone below the pit bottom. On the basis of defining indicators such as the rebound rate, rebound modulus, and unloading ratio, an estimation method for the rebound deformation at the bottom of the pit is proposed. Yang et al. (Yang et al., 2014) combined the Boussinesq solution and Mindlin elastic solution (Mindlin, 1953) to calculate the rebound stress and the rebound modulus calculated by the Duncan‒Chang model (Chang and Duncan, 1970) and e-lgp model; they combined these two methods to determine the final rebound deformation at the bottom of the pit. A comparison of the results calculated by the above four calculation methods with the measured results of a certain foundation pit in Tianjin showed that the combination of the e-lgp model and Mindlin elastic solution calculation method calculated the size and variation in the pit bottom rebound amount, which were in good agreement with the measured values; moreover, the use of the e-lgp model did not require specialized calculations of the rebound modulus. Chen et al. (Chen et al., 2021) derived a calculation formula for the rebound deformation of the foundation pit bottom under unloading stress, which takes into account the changes in the elastic modulus of the soil with the unloading stress path during the excavation process.
Considering numerical simulation research for foundation pit excavation, Chan C Chan et al. (Chan and Morgenstern, 1987) studied the stability of foundation pit excavation in a soft soil area. Comparing and analysing the numerical simulation calculation results with actual engineering monitoring data revealed that the numerical simulation calculation results are essentially consistent with the engineering monitoring data and that the softening properties of the soil severely affect the excavation of foundation pits in soft soil areas. Borja R. I (Borja, 1990). used the modified Cambridge model to simulate the constitutive relationship of soil in the nonlinear finite element numerical simulation of foundation pit excavation and calculated the deformation law of soil caused by foundation pit excavation under the action of supporting structures. The numerical simulation method yielded highly reliable results, and there was no divergence in the calculation results without damaging the soil model. Finno et al. (Finno et al., 1991) analysed the establishment of a numerical analysis model, the setting of boundary conditions in the model, and the selection of soil constitutive relationships. We provided valuable suggestions for the establishment of computational models in numerical simulation methods and utilized this method to study aspects of soil mechanics pertaining to underground structure construction. Zhang et al. (Zhang et al., 2014) used numerical simulation software to simulate the excavation and support process of an open-cut subway station foundation pit in Chengdu and obtained some deformation laws of the soil and support structure during the excavation process. A three-dimensional model was established in the numerical simulation software to simulate the actual excavation process of the foundation pit, and the calculation results of the pit bottom rebound and support structure deformation in different construction steps were obtained. Roscoe (Roscoe, 1963). and Schofield et al. (Schofield and Wroth, 1968) proposed the Cambridge model based on critical state theory. Schofield et al. subsequently modified the yield surface of the Cambridge model and obtained the modified Cambridge model. Liu et al. (Liu and Cheng, 2010) analysed the characteristics and parameter selection of the Cambridge model used and modified it in ABAQUS software. Research has shown that there are differences between the D-P model and the modified Cambridge model in terms of the scope, conditions, and selection of calculation parameters for the applicable soil layers. The former is suitable for granular materials such as sand, while the latter is suitable for weakly consolidated clay and normally consolidated clay. Qin et al. (Qin et al., 2010) reported that the Mohr–Coulomb model cannot accurately capture the changes in the compression modulus, rebound modulus, or compressibility of soil. The calculation results of foundation pit excavation reveal unreasonable phenomena, such as surface displacement around the foundation pit, which is not suitable for simulating excavation problems. The modified Cambridge model can effectively reflect the soil mechanics and deformation characteristics during the unloading process of foundation pit excavation, and the calculation results of foundation pit excavation are consistent with the rules displayed by on-site monitoring results, making it a better choice for simulating the problem of foundation pit excavation. Lv (Lv, 2016). used ABAQUS software to apply the modified Cambridge model as the constitutive relationship model of soil; established a two-dimensional calculation model; simulated triaxial drained and undrained tests of overconsolidated soil and normally consolidated soil; and verified the accuracy of the model. A detailed analysis was conducted on the parameter selection of the modified Cambridge model using a validated two-dimensional computational model, providing a reference for the selection of soil constitutive models and parameters in numerical simulation. Wang et al. (Wang and Zhang, 2017) used finite element software to simulate the excavation process of foundation pits and analysed the influence of different lengths of engineering piles on the rebound deformation of foundation pit bottoms. He found that engineering piles effectively reduced the rebound amount and rebound difference at the top of each pile and ensured that the rebound difference of each pile remained basically unchanged during the excavation process. The use of engineering piles with different radii only had a certain effect on reducing the rebound difference at the top of each pile, and the effect on reducing the rebound amount at the top of the pile was not significant.
According to the summary of the above literature, scholars at home and abroad mainly focus on specific regional strata, using theoretical analysis or numerical simulation methods to study the laws or calculation methods of rebound deformation at the bottom of foundation pits. Based on typical soil layers in South China, there is relatively little research on the laws and mechanisms of soil unloading rebound deformation, as well as the applicability of calculation methods for pit bottom rebound deformation.
Moreover, the magnitude of soil unloading rebound is closely related to the physical and mechanical properties of the soil itself, and foundation rebound research in other regions is not applicable. Therefore, it is highly important to study the trends and calculation methods of rebound deformation at the bottom of the pit. Our research objectives are as follows. 1) Building upon prior research, this article presents an analysis of the compression laws of six typical soil layers in South China through indoor experiments. 2) this article presents an analysis of the unloading rebound deformation laws of six typical soil layers in South China through indoor experiments. 3) A comparative analysis of existing calculation methods for pit bottom rebound deformation is conducted, and A rebound deformation method suitable for typical soil layers of foundation pits in South China has been proposed.
To study the compression consolidation, unloading rebound, and recompression deformation laws of soil, conventional consolidation tests were conducted. These tests were divided into three stages: loading, unloading, and reloading. The entire testing process was carried out in strict accordance with the provisions of the “Standard for geotechnical testing method” (GB/T 50123-2019).
The test instrument is a triple medium pressure consolidation instrument, as shown in Figure 1. Before the start of the test, the consolidation instruments and dial indicators were carefully inspected according to “Standard for geotechnical testing method” (GB/T 50123-2019). to ensure smooth completion of the test.
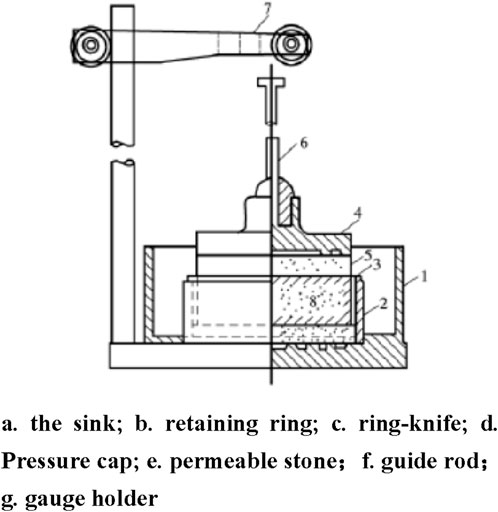
Figure 1. Consolidated container diagram.
Six typical soil samples were collected within the excavation range of the foundation pit project, as shown in Figure 2. Figure 2 a) shows the site of soil sampling. Figure 2 b) shows a soil sample obtained on site. Figure 2 c) shows the packaging of the soil samples. Each type of soil sample was prepared into four 2 cm high and 30 cm2 samples using a ring cutter, as shown in Figure 2 d) and 2 e). Figure 2 d) shows the dimensions of a soil sample specimen. Figure 2 e) shows multiple soil sample specimens. The basic physical and mechanical parameters of each type of soil were measured through density tests using the ring knife method and moisture content tests using the drying method, as shown in Table 1.
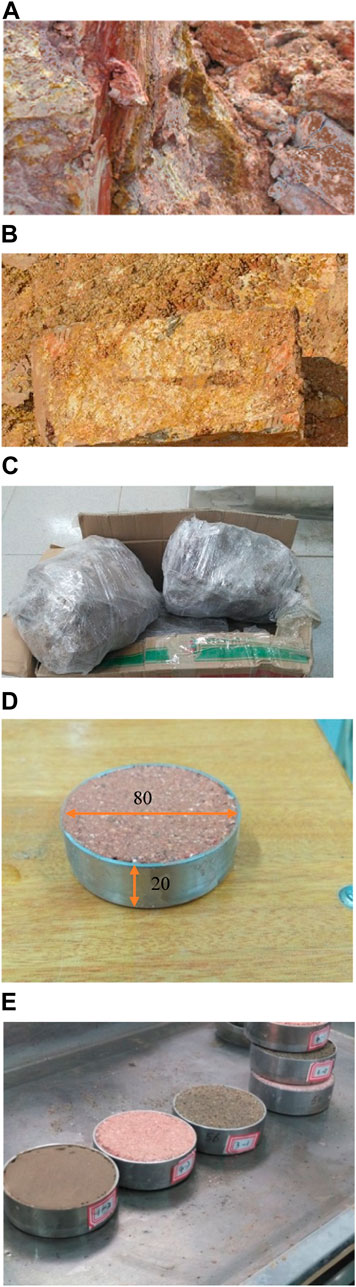
Figure 2. Sampling on site and the production of soil sample specimens. (A) The site of soil sampling; (B) A soil sample obtained on site; (C) The packaging of soil samples; (D) The dimensions of a soil sample specimen; (E) Multiple soil sample specimens.
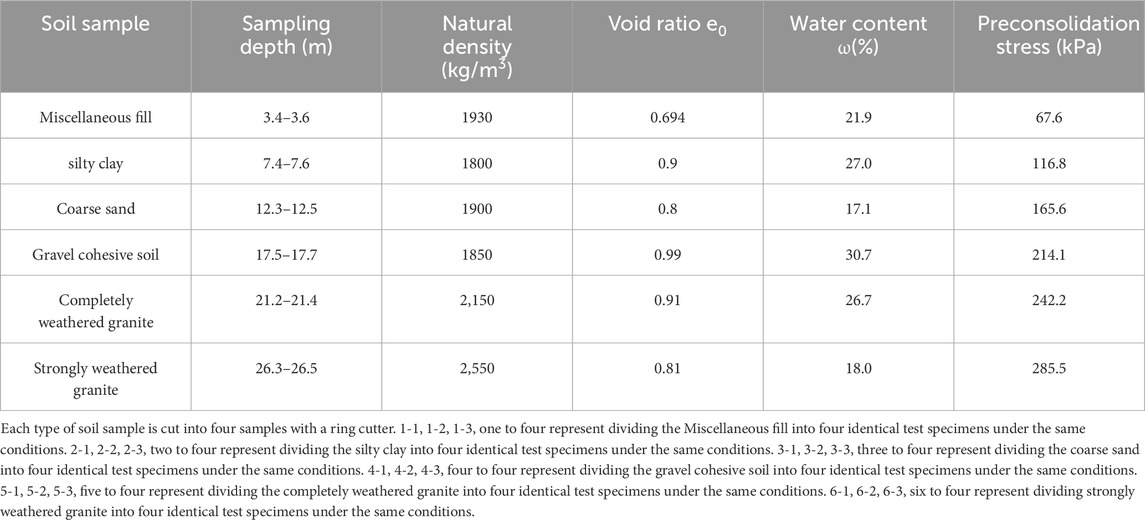
Table 1. Basic physical and mechanical parameters of the soil samples.
Four sets of tests were conducted on each type of soil sample on a consolidation apparatus, with each set of maximum consolidation stresses added to 100 kPa, 200 kPa, 300 kPa, and 400 kPa. The applied loading and unloading pressures are shown in Table 2. The height changes in the sample after each stage of loading and unloading stabilized for 24 h was measured. In addition, for each type of soil, a soil sample with a maximum consolidation stress of 300 kPa is selected for re loading, and the level of re loading is the same as that of the first loading.
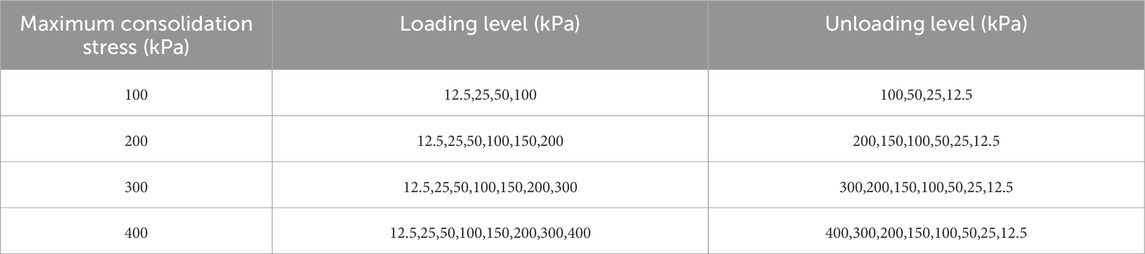
Table 2. Loading and unloading ratings.
According to “Standard for geotechnical testing method” (GB/T 50123-2019), to describe the basic laws of deformation of soil samples during compression, rebound, and recompression, the following indicators and the corresponding calculation methods are defined:
(1) Rebound rate δi
emin——Void ratio of the soil sample under maximum consolidation load.ei——Pore ratio of the soil sample after unloading at level i.
(2) Unloading ratio Ri
pmax——Maximum consolidation stress during compression (kPa).pi——Stress value after unloading at level i (kPa).
(3) Resilience modulus Eri
n0——Porosity of the soil sample under the maximum preloading load.
Each soil sample underwent consolidation and rebound tests in strict accordance with the experimental procedure, after which the test results were statistically analysed, organized, and calculated. This study mainly considers the unloading rebound law of soil and the calculation method of the rebound modulus. The following describes the changes in deformation indicators such as the pore ratio, rebound rate, and rebound modulus.
The experimental data are organized and calculated to obtain the compression rebound curve, recompression curve, and rebound rate and modulus of soil samples under different unloading conditions for various types of soil samples. The changes in various indicators under different unloading conditions are analysed.
The four maximum consolidation stress curves in Figure 3 show the following:
(1) The magnitude of the soil rebound rate is closely related to the unloading ratio. At the initial stage of unloading (R<0.4), the rebound rate of the various soil samples exhibited almost no increase. At the middle stage of unloading, the rebound rate of each soil sample slowly increased, but the growth rate was still very low. At the later stage of unloading (when R>0.8), the rebound rate of each soil sample significantly increased, even exceeding the sum of the growth in the early and middle stages.
(2) The type of soil sample and the maximum consolidation stress are also important factors affecting the rebound deformation of the soil. The final rebound rate of the same soil sample also increases to varying degrees with increasing maximum consolidation stress. Under the same consolidation stress, the rebound rate of plain fill is the highest, followed by that of silty clay, coarse sand, gravelly cohesive soil, completely weathered granite, and strongly weathered granite.
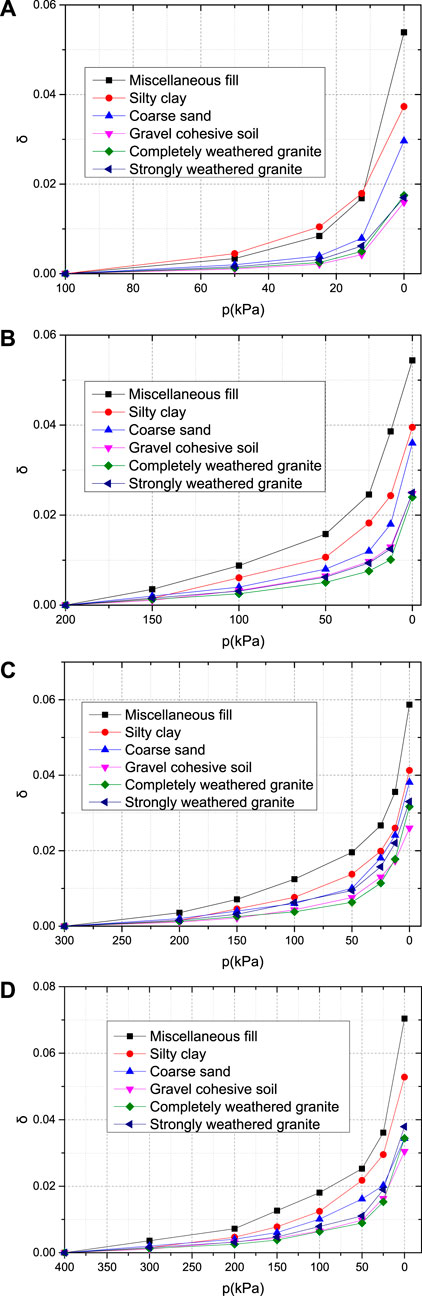
Figure 3. Variation curve of the rebound rate of the soil samples. (A) The maximum consolidation stress is 100 kPa; (B) The maximum consolidation stress is 200 kPa; (C) The maximum consolidation stress is 300 kPa; (D) The maximum consolidation stress is 400 kPa.
The amount of rebound deformation at the bottom of the pit is closely related to the excavation unloading of the overlying soil layer and is also influenced by the soil sample type and maximum consolidation stress. The shorter the distance between the soil layer below the pit bottom and the surface of the pit bottom is, the greater the rebound amount, and the deeper the soil layer is, the smaller the weight of the rebound amount in the soil layer below the pit bottom.
Through calculations Eqs (1)–(3), The compression rebound deformation curves of each soil sample were drawn, as shown in Figures 4–9.
(1) Compression rebound deformation curve of miscellaneous fill
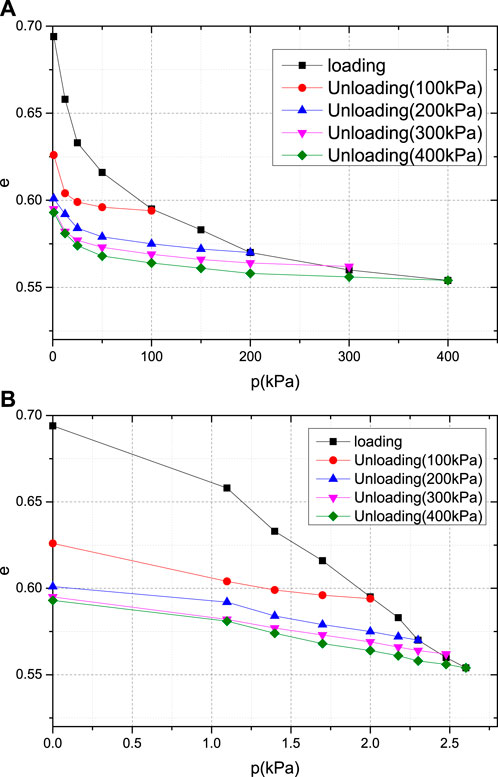
Figure 4. e-p and e-lgp curves of the plain fill. (A) e-p curve of the plain fill; (B) e-lgp curve of the plain fill.
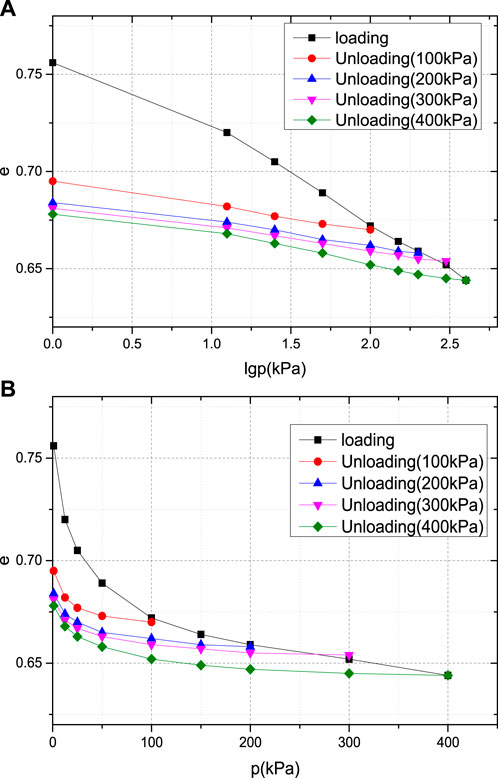
Figure 5. e-p and e-lgp curves of silty clay. (A) e-p curve of silty clay; (B) e-lgp curve of silty clay.
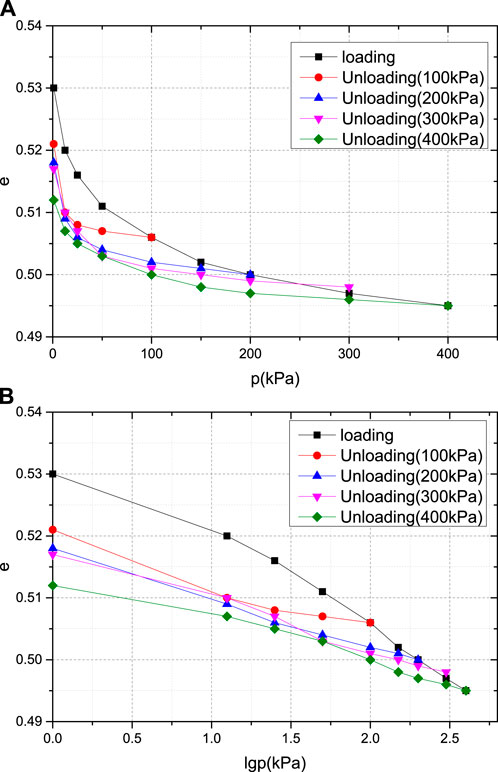
Figure 6. e-p and e-lgp curves for coarse sand. (A) e-p curve of coarse sand; (B) e-lgp curve of carse sand.
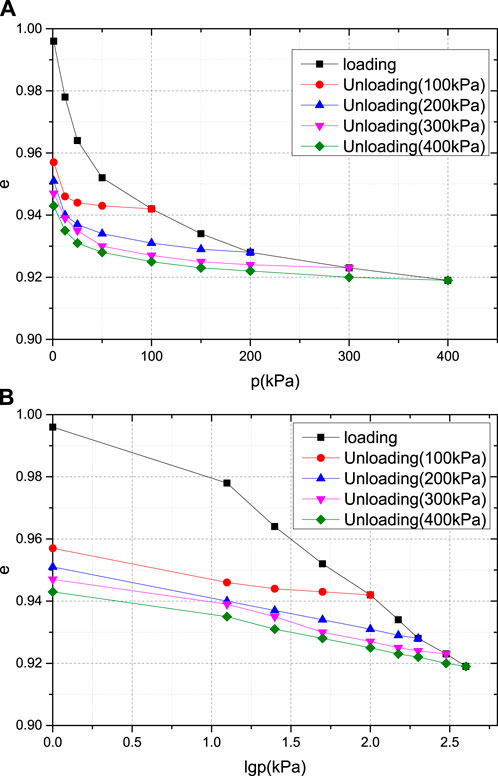
Figure 7. E-p and e-lgp curves of gravitational clay. (A) e-p curve of gravitational clay; (B) e-lgp curve of gravitational clay.
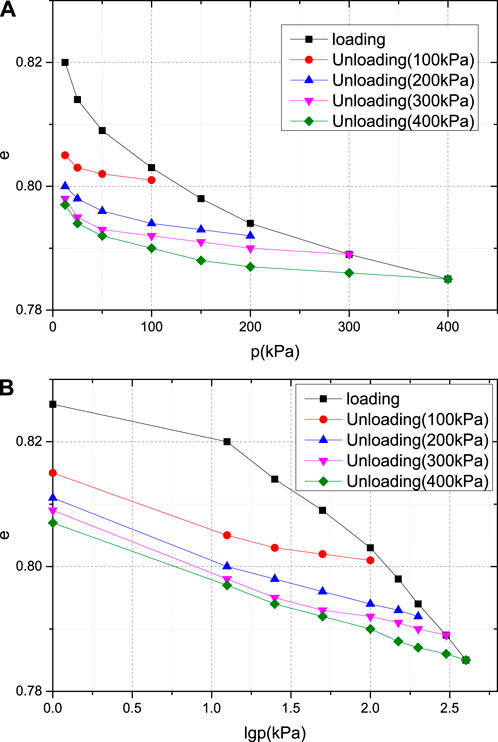
Figure 8. e-p and e-lgp curves of the completely weathered granite. (A) e-p curve of completely weathered granite; (B) e-lgp curve of the completely weathered granite.
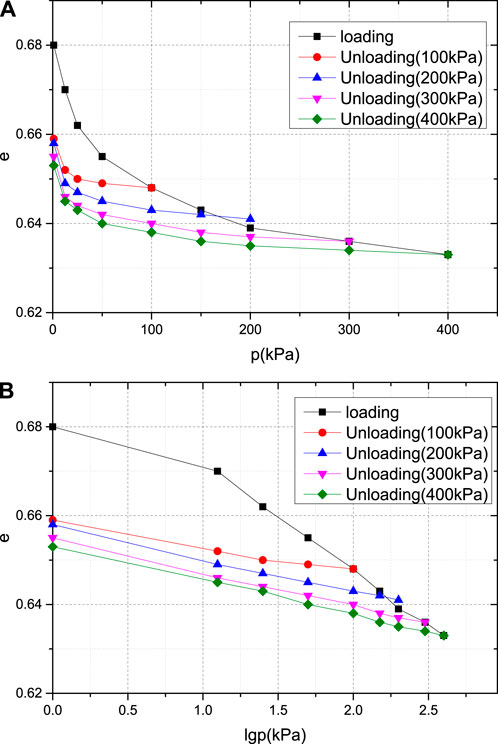
Figure 9. e-p and e-lgp curves of strongly weathered granite. (A) e-p curve of strongly weathered granite; (B) e-lgp curve of strongly weathered granite.
As shown in Figure 4 a and b, the e-p and e-lgp curves are obtained from the consolidation of plain fill samples under a maximum consolidation stress of 400 kPa and unloading under consolidation stresses of 100 kPa, 200 kPa, 300 kPa, and 400 kPa, respectively.
Figure 4 a) shows that the path of e changing with p in the e-p curve of the plain fill is a smooth curve. The response contains a loading consolidation stage: When the p-value is low, e decreases rapidly, and as the p-value increases, the rate of decrease in the e value gradually slows, and the compression curve gradually tends to flatten. The response also contains an unloading rebound stage: In the early unloading stage, the e value hardly increases; as the p-value gradually decreases, the e value begins to slowly increase; and in the later stage of unloading, the e value increases rapidly.
Figure 4 b) shows that the path of e in the e-lgp curve of the plain fill varies with lgp in a straight or broken line shape. The loading and consolidation stage is depicted as a broken line. At the beginning, the slope of the broken line segment is relatively flat, and then the broken line segment maintains a straight decline. When stable, the slope is the compression index. During the unloading and rebound stage, the change path follows a straight and broken line shape, and the four rebound curves remain approximately parallel, i.e., the rebound indices are approximately equal.
(2) Compression rebound deformation curve of silty clay
As shown in Figure 5 a and b, the e-p and e-lgp curves are obtained from the consolidation of silty clay samples under a maximum consolidation stress of 400 kPa and unloading under consolidation stresses of 100 kPa, 200 kPa, 300 kPa, and 400 kPa, respectively. The changes in the e-p curve and e-lgp curve of silty clay are essentially the same as those of plain fill, but with differences in the sizes of the e-values.
(3) Compressive rebound deformation curve of coarse sand
Figure 6 a and b show the e-p and e-lgp curves obtained from the consolidation of coarse sand samples under a maximum consolidation stress of 400 kPa and unloading under consolidation stresses of 100 kPa, 200 kPa, 300 kPa, and 400 kPa, respectively. The variation trend of the compression rebound deformation curve of coarse sand is essentially the same as that of plain fill and silty clay. The variation amplitude of the e-value is smaller than that of the first two types of soil. In the unloading and rebound stage of the e-lgp curve, the change curve is generally parallel, but the trend is not as significant as that of the first two types of soil.
(4) Compressive rebound deformation curve of gravelly cohesive soil
As shown in Figure 7 a and b show the e-p and e-lgp curves obtained from the consolidation of gravelly cohesive soil samples under a maximum consolidation stress of 400 kPa and unloading under consolidation stresses of 100 kPa, 200 kPa, 300 kPa, and 400 kPa, respectively. The variation law of the compression rebound deformation curve of gravelly cohesive soil is similar to that of the first three types of soil.
(5) Compression rebound deformation curve of the completely weathered granite
As shown in Figure 8 a and b show the e-p and e-lgp curves obtained from the fully weathered granite soil samples under a maximum consolidation stress of 400 kPa and unloading under consolidation stresses of 100 kPa, 200 kPa, 300 kPa, and 400 kPa, respectively. The variation trend of the compression rebound deformation curve of the completely weathered granite is basically the same as that of the first four types of soil, and the amplitude of the change in the e value is smaller than that of the first four types of soil.
(6) Compression rebound deformation curve of strongly weathered granite
Figure 9 a and b show the e-p and e-lgp curves obtained from the consolidation of strongly weathered granite soil samples under a maximum consolidation stress of 400 kPa and unloading under consolidation stresses of 100 kPa, 200 kPa, 300 kPa, and 400 kPa, respectively. The compression rebound deformation curve of strongly weathered granite also exhibits the same variation trend.
Upon analysing the characteristics of each e-p and e-lgp curve mentioned above, the following conclusions are drawn:
(1) According to the e-p curve of the soil, the change in the pore ratio during the consolidation and rebound process of each type of soil is closely related to the applied load, soil sample type, and maximum consolidation stress. Therefore, when calculating the rebound amount at the bottom of a pit, it is necessary to comprehensively consider the influence of factors such as the unloading ratio, soil type, and initial consolidation stress.
(2) The e-lgp curves of the soil samples exhibit a straight or broken line trend. The e-lgp curves of the same type of soil are almost the same during the compression stage, but the extension length ratios are the same. The e-lgp curve of each type of soil is approximately a straight line with equal slopes during the rebound stage. The recommended values of the compression index Cr and rebound index Cr for each type of soil can be calculated based on the test results and the “Standard for geotechnical testing method” (Ministry of Water Resources of the People’s Republic of China, 2019), as shown in Table 3.
Referring to the calculation method of the compressive modulus, the rebound index Cr can be used to calculate the rebound modulus Er, with the following formula:
pmax——Maximum consolidation stress.
Pi——Stress after unloading level i.

Table 3. Soil compression and rebound indices.
The e-p curve of each soil sample was drawn for further compression, as shown in Figure 10.
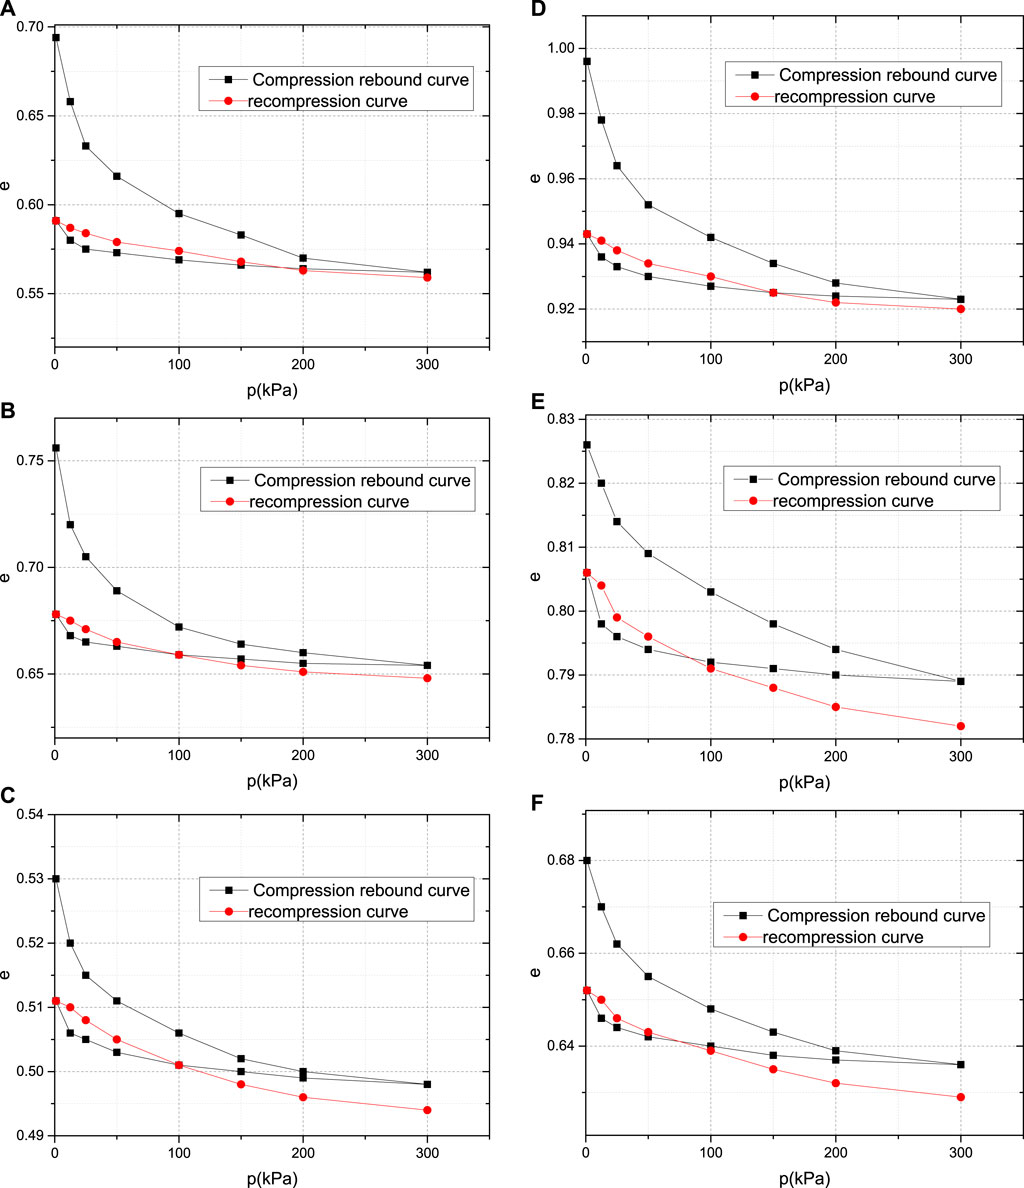
Figure 10. Recompression e-p curves of the soil samples. (A) Plain fill; (B) Silty clay; (C) Coarse sand; (D) Gravelly cohesive soil; (E) Completely weathered granite; (F) Strongly weathered granite.
Figure 10 shows the recompression e-p curves of various soil samples at a maximum consolidation stress of 300 kPa. Note that the compression rebound curve in the figure was analysed above and is shown again here as a reference. The variation trend of the re compression curve is similar to that of the compression curve, but the variation amplitude of the e value is much smaller than that of the compression curve. After the recompression of each type of soil sample is completed, the e value is smaller than that of the first compression.
Therefore, after the excavation of the foundation pit is completed, the self-weight of subsequent buildings such as houses and subway stations cause the soil layer below the pit bottom to undergo a similar process of recompression, ultimately reducing the rebound amount at the pit bottom and even causing settlement.
The rebound modulus values of each soil sample under different consolidation stress and unloading ratios are calculated using Formula (4), and by analysing the variation law of the rebound modulus on the load, the rationality of using the rebound index to calculate the rebound modulus can be evaluated.
Figure 11 shows the variation in the rebound modulus of each soil sample with respect to the unloading ratio under four maximum consolidation stresses. The rebound modulus of the soil sample gradually decreases with increasing unloading ratio, and Figure 11 a) was not analysed due to the limited amount of data. Figure 11 b), c), and d) show that the rebound modulus of the six soils decreases with increasing unloading ratio, and the change curve gradually tends to flatten. When the unloading ratio R=1, the rebound modulus is approximately 15 MPa–35 MPa. Based on this, the following conclusions can be drawn:
(1) The rebound modulus is not a fixed value, nor does it change linearly with increasing unloading ratio; rather, it decreases with increasing unloading ratio, and the entire variation curve shows an exponential distribution.
(2) The maximum consolidation stress also affects the rebound modulus. There are also certain differences in the values of the rebound modulus obtained during unloading under different maximum consolidation stresses.
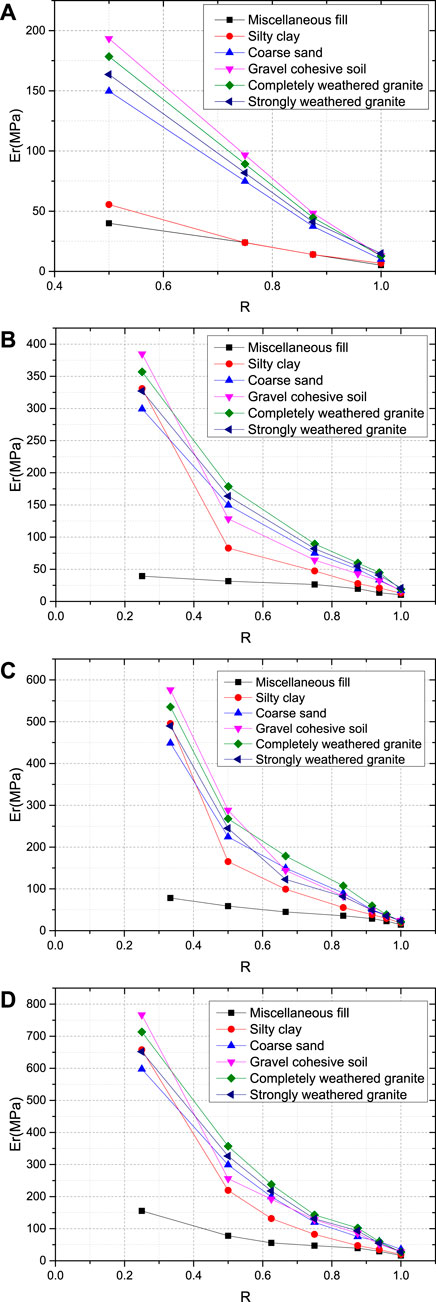
Figure 11. Variation curve of the rebound rate of the soil samples. (A) The maximum consolidation stress is 100 kPa; (B) The maximum consolidation stress is 200 kPa; (C) The maximum consolidation stress is 300 kPa; (D) The maximum consolidation stress is 400 kPa.
Therefore, using the rebound modulus to calculate the rebound modulus can not only reflect the exponential trend of the change in the rebound modulus with the unloading ratio but also consider the influence of the soil type and maximum consolidation stress on the rebound modulus.
Existing calculation methods for pit bottom rebound deformation mainly include the standard method, the empirical formula method, the theoretical formula method, the residual stress method, and the self-weight stress offset method.
The empirical formula method includes the use of an empirical formula that is obtained through indoor model tests without considering changes in soil layers. Some parameters in these formulas are obtained through statistical analysis of certain soil tests, so this approach is applicable only to homogeneous foundations where the test soil samples are located.
The theoretical formula method considers the spatial effect of foundation pit rebound, including the influence of factors such as the size, shape, and depth of the foundation pit on the rebound amount at the bottom of the excavation pit. However, soil is an elastic‒plastic material, and using Mindlin displacement solutions under ideal elastic bodies to calculate the unloading and rebound deformation of elastic‒plastic materials is unreliable. Moreover, this method is relatively cumbersome and rarely used in practical engineering.
Therefore, we select the normative method, residual stress method, and self-weight stress reduction method and apply these three methods to calculate excavation engineering under the same conditions as those used in the numerical simulation. The existing method calculation results are compared with the numerical simulation results to verify the accuracy of the above calculation method in calculating the rebound deformation of the pit bottom. The model adopts typical soil layer data from a foundation pit project in South China, and the basic physical and mechanical parameters of the soil layer are shown in Table 1. The methods used here are all based on the idea of the layered summation method. Referring to the requirements of various formulas and calculation examples, the influence of the thickness of the stratification on the calculation results was ignored. The layering principle adopted in this article is as follows: the standard method requires a greater calculation depth, and the calculation should be layered.
According to the type of soil layer. The residual stress method and self-weight stress reduction method can calculate the depth of influence, but the depth required for calculation is relatively small. When performing the calculation, based on the classification and layering of the soil, each soil layer was further divided into multiple sublayers with a thickness of no more than 2 m.
To better verify the accuracy of the calculation results of each formula at different excavation depths. An excavation surface size of 60 m×20 m was selected, and three different depths of foundation pits were calculated with excavation depths of 4.3 m, 15.5 m, and 25.5 m.
(1) Standard Method Calculation Formula
The Code for Design of Building Foundations (GB 50007-2011) stipulates that the calculation of rebound deformation at the bottom of foundation pits should refer to the calculation method of soil settlement, and the formula is:
(2) Standardized method calculation process
The weight of the soil above the groundwater level is taken as the natural weight, while the weight below the groundwater level is taken as the floating weight. No regional experience,
(3) Calculation results using standardized methods
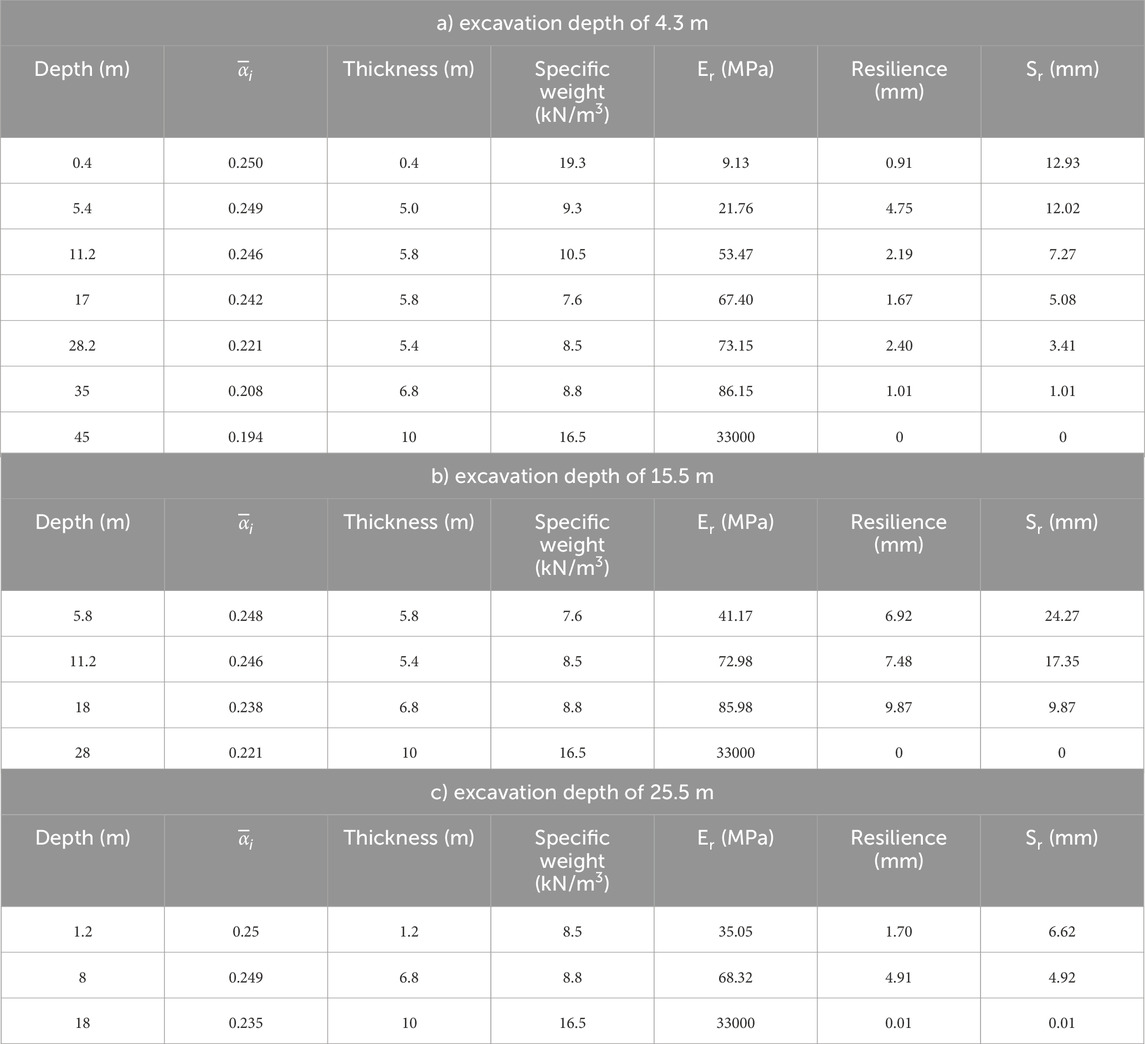
Table 4. Calculation results of the standard method.
The remaining indicators of the three deep foundation pits and the final rebound calculation results are shown in Table 4.
A comparison of the calculation results in Table 4 reveals that the scenario in which the total rebound of the deeper soil layer is less than 4.3 m in the foundation pit may not be consistent with a true scenario. During the calculation process, the influence of factors such as depth and unloading ratio was not considered, and the use of fixed values for rebound stress can lead to excessively high calculation results.
(1) Calculation steps of the residual stress method
Liu et al. (Liu et al., 2000) proposed the residual stress and residual stress coefficient in the excavation of foundation pits. The rebound stress σzi is calculated using Formulas (6), (7), and (8):
H——Excavation depth of the foundation pit (m);
hr——Influence depth (m)
α——Residual stress coefficient.
h——Calculate the thickness of the soil layer above depth (m);
α0——0.3
σ0——Total unloading stress (kPa).
The stress in the soil below the bottom of the pit was calculated using Formula (9) for narrow foundation pits (B ≤ 2.5H) and Formula (10) for wide foundation pits (B>2.5H) (Taking i-layer soil as an example)
σmi, σVi, σHi——Average stress of the ith layer soil mass, Horizontal stress and Vertical stress (kPa);
K0, R——Unloading ratio, Static soil pressure coefficient;
γ, h——Unit weight (kN/m3), thickness of a certain layer of soil m).
The unloading modulus Eri of each layer of soil is calculated using Formula (11) (The ith layer of soil is taken as an example.)
c——Cohesion.
φ——Friction angle (°);
Rf ——Failure ratio.
Using the layered summation method, the rebound amount is calculated.
(2) Residual stress method calculation process
Referring to the example of residual stress method calculations, the rebound deformation of foundation pits in South China is calculated, and many of the parameters and formulas (6)–(12) involved are based on the analysis of engineering data or soil test data from other regions; however, these results may not be applicable to South China. To analyse the applicability of this method in South China, this article applies calculation methods or suggestions provided by the reference literature to complex parameters (such as
When the excavation depth is 4.3 m, the results are calculated based on the width of the foundation pit: hr=9.49 m; σ0=82.99 kPa; and
(3) Results of calculating the residual stress method
The remaining indicators of the three deep foundation pits and the final rebound calculation results are shown in Table 5.
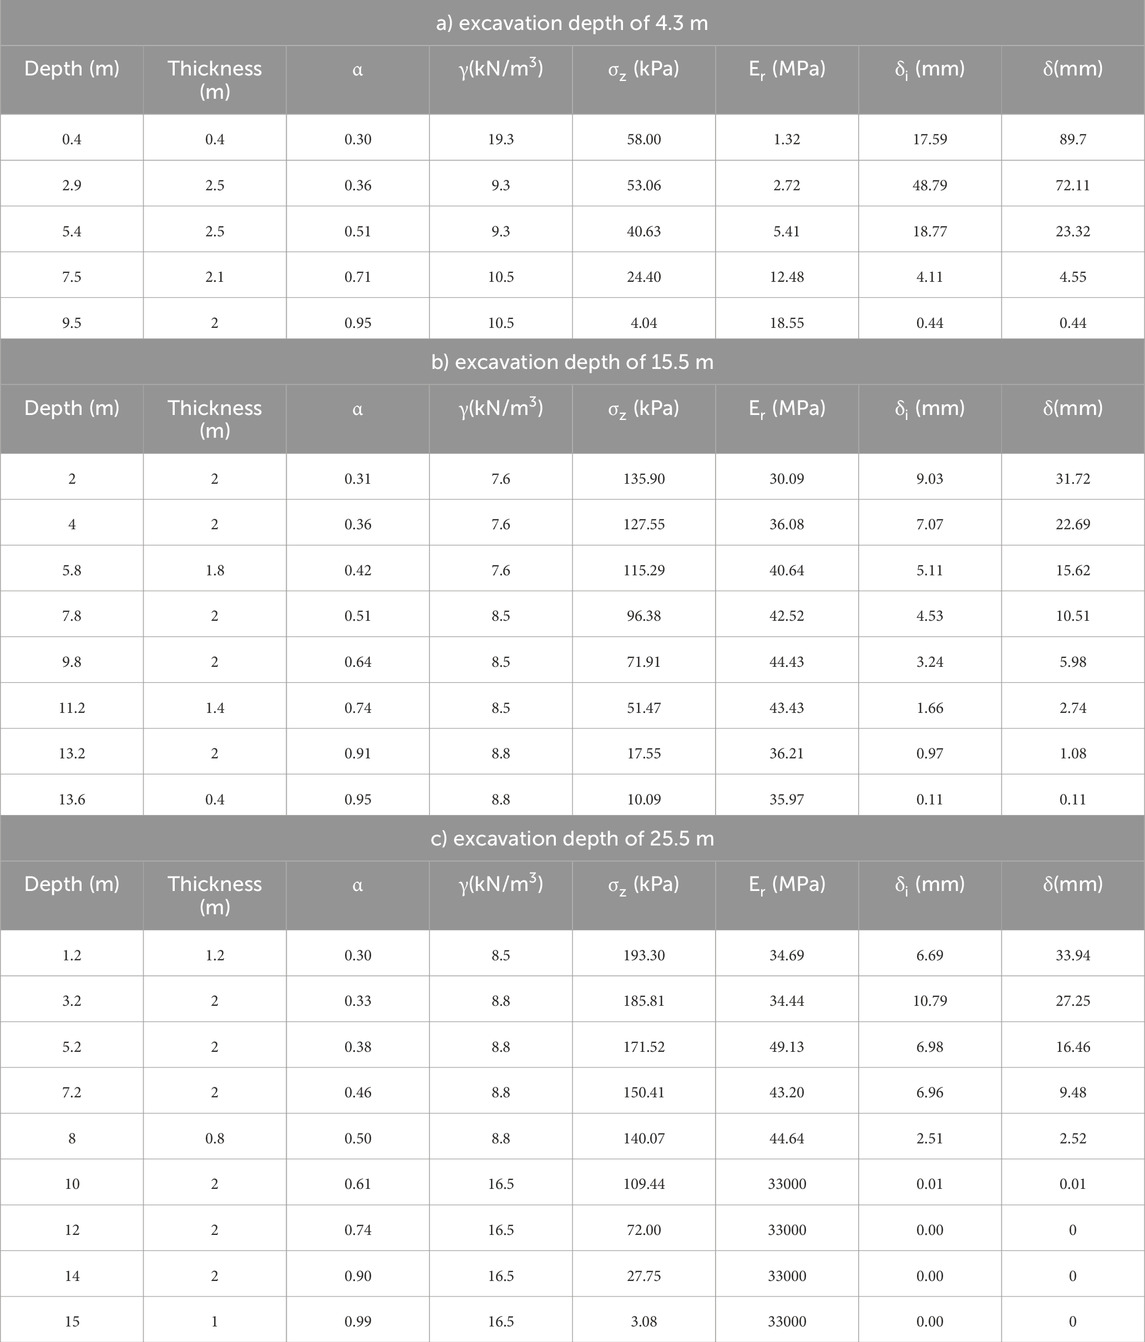
Table 5. The calculation results of the residual stress method.
The calculation results in Table 5 show that the depth of the three foundation pits varies greatly, but the impact of rebound deformation on the depth changes is relatively small. Similar to the results of the standard method, there was a problem in the calculation results where the total rebound of the 15.5 m foundation pit was less than that of the 4.3 m foundation pit. There is a deviation between the variation in the soil rebound modulus and the variation in the rebound modulus obtained in Section 1 of this article.
(1) Basic Theory of Self-weight Stress Relief Method
Lou et al. (2012) proposed the theory of self-weight stress relief method in the study of rebound stress and rebound deformation of deep foundation pit bottom foundation. The consolidation of the soil caused by self-weight stress before excavation in the foundation pit has already been completed, but the influence of self-weight stress is not considered when calculating settlement. When calculating the rebound deformation caused by unloading, the soil undergoes upwards rebound deformation due to the decrease in the original stress, and the downwards reaction of the self-weight stress of the soil below the pit bottom cannot be ignored.
Moreover, in this method, the attenuation of rebound stress in the soil below the pit bottom is influenced mainly by self-weight stress. Based on the theory of elastic half space, the following formula for calculating rebound stress is derived:
The calculation method for the rebound modulus is the same as that for Formula (4) in Section 1 of this article.
Using the layered summation method, the rebound amount is calculated.
(2) Calculation process of the self-weight stress reduction method
According to this method definition,
(3) Results of the self-weight stress reduction method
The remaining indicators of the three deep foundation pits and the final rebound calculation results are shown in Table 6 using Formula (13)∼(14).
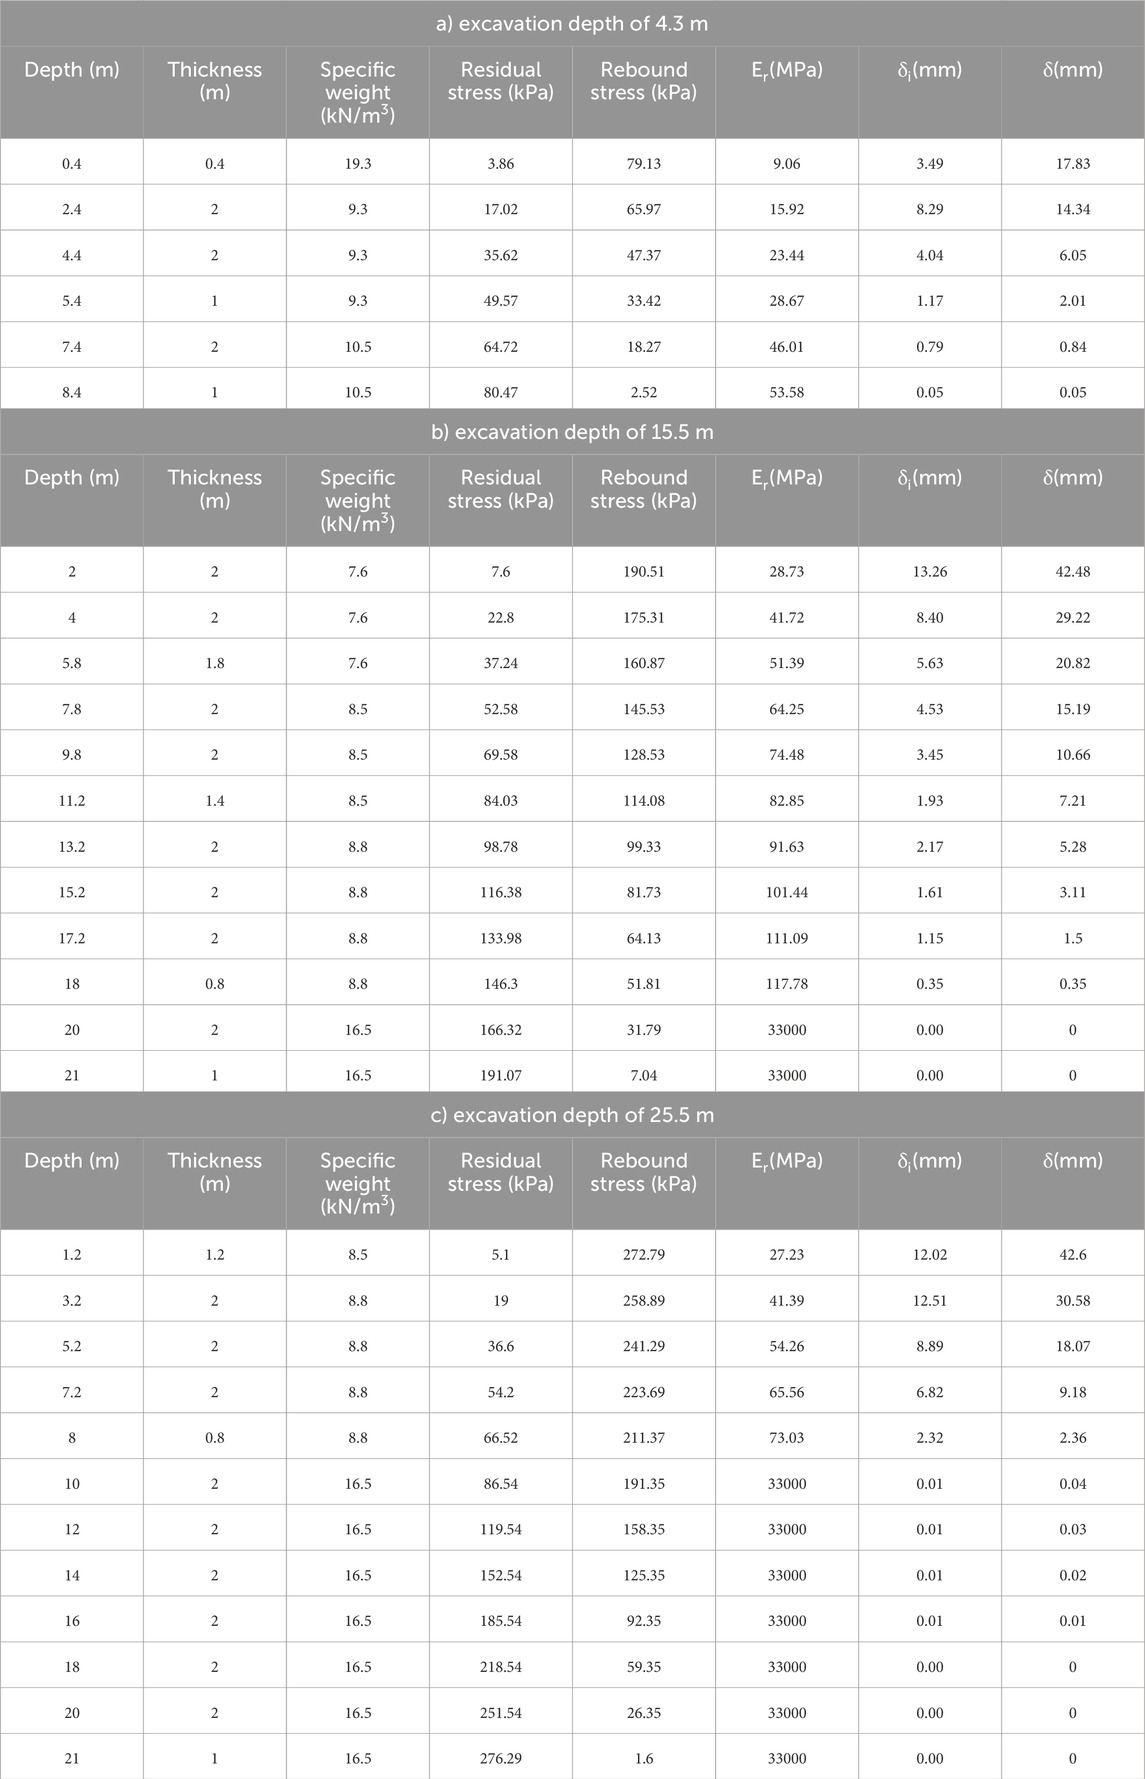
Table 6. Calculation results of the self-weight stress offset method.
The remaining indicators of the three deep foundation pits and the final rebound calculation results are shown in Table 6. The calculation results of the three self-weight stress reduction methods mentioned above indicate that the calculated depth of influence is related to the excavation depth of the foundation pit, which is approximately 1-2 times the excavation depth. The formula for calculating the rebound modulus is the same as Formula (4) as provided above. The rebound modulus increases with increasing soil depth. In general, the calculated rebound amount at the bottom of a deeper foundation pit is greater than that at the bottom of a shallower foundation pit.
ABAQUS software was used to establish a computing domain of 180 m×100 m×70 m, and the plane size of the foundation pit was 60 m×20 m. According to the excavation depth of the foundation pit, excavation is divided into three working conditions: 4.3 m, 15.5 m, and 25.5 m.
The continuous wall is simulated as a homogeneous solid unit with a wall thickness of 1 m and an insertion depth of 33.5 m. The material is C35 concrete, which has an elastic modulus of 3.15×10⁴ MPa, a Poisson’s ratio of 0.2, and a density of 2,800 kg/m3. The foundation pit is supported by steel pipes (Q235) according to beam element simulation. The cross section is a circular ring with d=609 mm and t=16 mm, and the spacing between transverse braces is 3 m. The elastic modulus is 200 GPa, Poisson’s ratio is 0.25, and the density is 7,800 kg/m3.
The division of grids varies depending on the size, position, and importance of the components. Soil masses other than the retaining wall are composed of three-dimensional hexahedral elements with a side length of 3 m. The retaining wall and the soil inside the wall are composed of three-dimensional hexahedral elements with a side length of 1 m. The support adopts a beam element with a length of 1 m.
Based on the literature review of Section 1, we use ABAQUS software to simulate the excavation of foundation pits and the modified Cambridge model as the constitutive relationship model for six typical soils in South China. The basic physical and mechanical parameters of each layer of soil and the modified Cambridge model parameters are taken according to Table 1.
When excavating a foundation pit at a depth of 4.3 m under Condition 1, the method of completing the excavation is chosen. When excavating the foundation pit at depths of 15.5 m and 25.5 m under working Conditions 2 and 3, the soil inside the foundation pit is excavated in layers, and support is added while excavating to ensure that the deformation of the retaining wall is within the actual engineering deformation range.
To achieve a better understanding of the rebound deformation response at the bottom of the pit, the model considers the left and bottom boundaries of the pit as coordinate origins in both the horizontal and vertical directions. A row of elements on the horizontal (x direction) and vertical (z direction) centrelines of each layer of soil on the upper surface of each layer is taken as the vertical displacement analysis object, as shown in Figure 12.
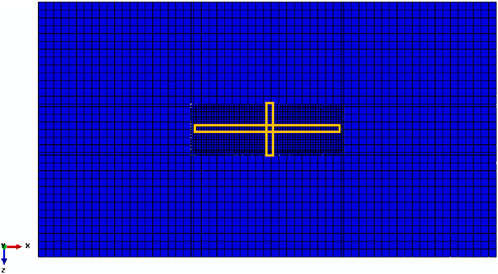
Figure 12. Data extraction location diagram.
The calculation method of the rebound amount at the bottom of a foundation pit excavation uses the layered summation method, through which the rebound amount is calculated based on the depth from the pit bottom or the soil layer. Finally, the total rebound amount on the surface of the pit bottom is calculated by summing the rebound amount of each layer. Therefore, to verify the applicability of the formula, it is necessary to consider the variation in the pit bottom rebound with depth. Figures 16 show the rebound amount at different depths of the pit bottom under working Conditions 1, 2, and 3.
As shown in Figure 13, the maximum rebound amount of the foundation pit under Condition 1 is 18.87 mm, the maximum rebound amount of the foundation pit under Condition 2 is 34.74 mm, and the maximum rebound amount of the foundation pit under Condition 3 is 39.03 mm. For most soil layers, the greater the excavation depth is, the greater the rebound amount at the bottom of the pit.
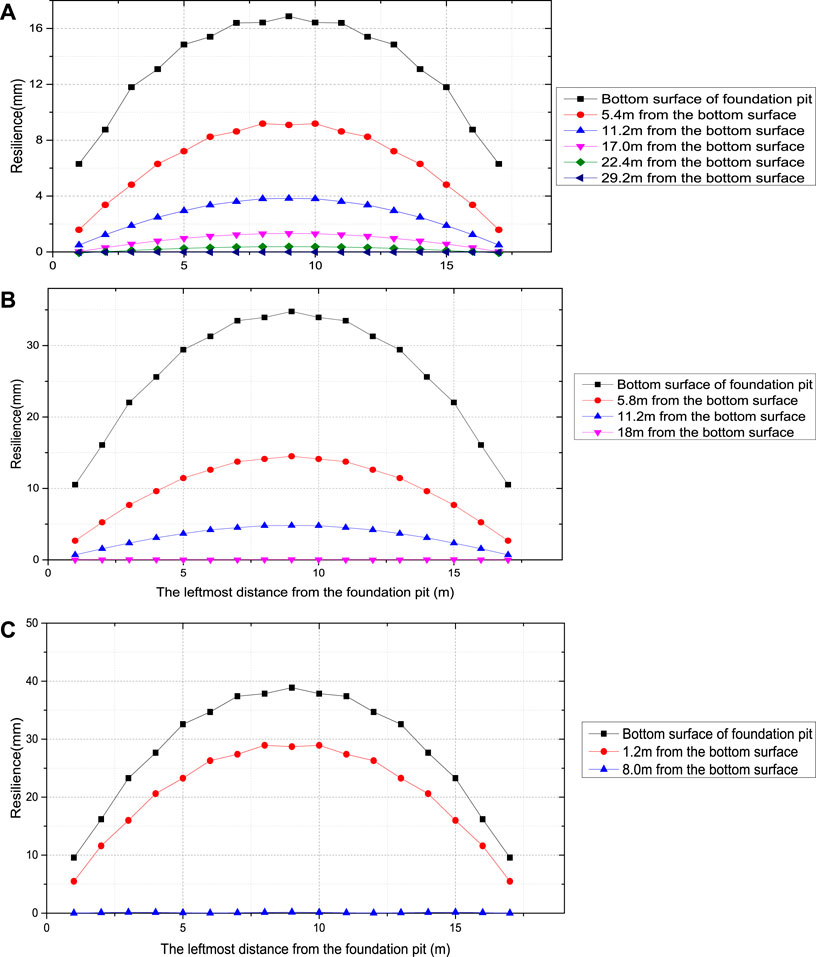
Figure 13. Case 3 Rebound volume at the different depths. (A) Case 1; (B) Case 2; (C) Case 3.
The trends exhibited by different depths of foundation pits are the same: the rebound amount in the middle of the longitudinal pit bottom is relatively small when it is closer to the retaining wall, and the rebound amount continuously increases with increasing distance. Finally, the rebound amount in each layer remains at a certain value. The rebound amount in the middle of the horizontal pit bottom continuously increases with increasing distance from the retaining wall, but the rate of increase gradually decreases. The rebound amount in the soil layer below the pit bottom decreases with increasing depth from the pit bottom. At first, it decreases rapidly, then the rate of decline gradually slows down, and finally, the rebound amount tends to zero.
This section compares the calculation results of existing methods and numerical simulations in terms of the rebound modulus and depth of influence and analyses the applicability of the three calculation methods to specific soil layers in South China.
Table 7 shows the calculation results for the depth affected by the rebound deformation of the foundation pit using three calculation methods. By comparing and analysing the calculation results of each method, the accuracy of each calculation method can be qualitatively judged.
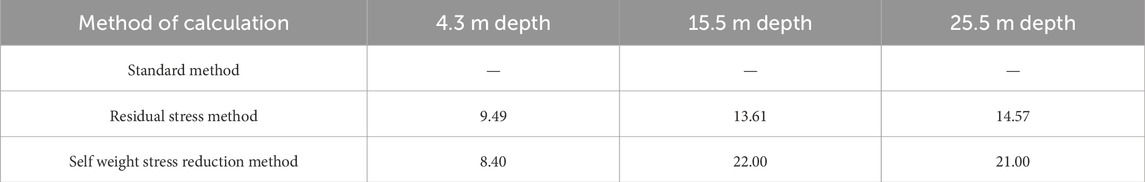
Table 7. Calculation results for the rebound deformation depth (unit: m).
Table 7 shows that the standard method does not explicitly specify a calculation method for determining the influence of depth. The calculation formula in the residual stress method is based on engineering principles derived from experience investigating other regions. When the excavation depth is 15.5 m, the calculation result of the affected depth is 13.61 m, and when the excavation depth is 25.5 m, it is 14.57 m, which affects the accuracy of the rebound amount. The calculation of the depth of influence by the self-weight stress offset method is based on the theory of eliminating self-weight stress and unloading stress. The calculation depth is not affected by geological conditions, and the calculation results are within the range of excavation depth proposed by many previous reports, which is approximately 1-2 times the impact depth of rebound deformation.
Because all three calculation methods adopt the idea of layered summation, the comparison between the calculation results of the increase in rebound at the bottom of the pit and the numerical simulation results can best reflect the advantages and disadvantages of the computational algorithm.
As shown in Figure 14 a), the residual stress method results in the largest deviation, which is approximately 4 times greater than the numerical simulation results. The standard method results in a greater rebound amount for deeper soil layers, while the rebound amount for shallower soil layers is actually smaller. The calculation results of the self-weight stress relief method show that the rebound amount is very small at greater depths and increases rapidly at shallower depths. The final results are similar to the numerical simulation results.
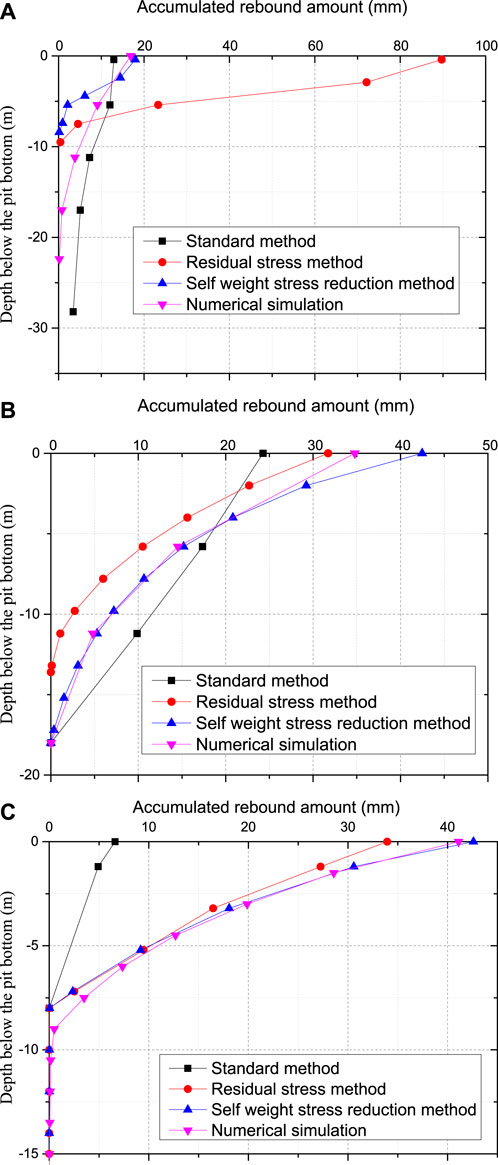
Figure 14. Rebound volume growth comparison. (A) Excavation depth of 4.3 m; (B) An excavation depth of 15.5 m; (C) An excavation depth of 25.5 m.
As shown in Figure 14 b), the growth trend of the rebound amount obtained by the standard method is linear, which is significantly different from that of the numerical simulation results. The trend of rebound obtained by the residual stress method is similar to that of the numerical simulation, but there are deviations in the magnitude of rebound at different depths. The variation trend of the rebound amount obtained by the self-weight stress cancellation method is highly consistent with the numerical simulation results, and the difference in the final rebound amount is relatively small.
As shown in Figure 14 c), the growth trend of the rebound amount obtained by the standard method is linear, and the calculated results are relatively small. The variation trend of the rebound amount calculated by the residual stress method and the self-weight stress relief method is basically consistent with that of the numerical simulation, but there is a slight deviation in the final rebound amount. Compared with the self-weight stress relief method, the two methods have greater accuracy.
After comparing the results of various calculation methods, the following conclusions can be drawn:
Through indoor experimental research, a calculation method suitable for the rebound modulus of typical soil layers in South China was proposed in this paper. This method was then combined with the self-weight stress reduction method to obtain a calculation method suitable for the rebound deformation of typical soil layers in South China. By comparing and analyzing the applicability of this method with existing methods for calculating rebound deformation at the bottom of pits in South China, it can be concluded that the proposed method requires fewer parameters, has higher accuracy in calculation results, and is more suitable for calculating rebound deformation of typical soil layers in South China.
The variation pattern of the re compression curve and compression curve of various types of soil samples is similar when the maximum consolidation stress is 300 kPa, but the amplitude of the change in e value is much smaller than that of the compression curve. The e value of each type of soil sample after re compression is completed is smaller than that of the first compression. This is because when the soil is first loaded and compressed, it is in an initial loose state, and the pore volume inside the soil decreases significantly. The soil particles are redistributed, resulting in elastic and plastic deformation of the soil. After unloading, the soil generates rebound force, and the elastic deformation recovers. When reloading, due to the soil being in a dense state, the elastic deformation amplitude of the soil is small, the reduction of soil pores is small, and thus the rebound deformation is reduced. In the actual construction process, after the excavation of the foundation pit is completed, the self-weight of subsequent buildings such as houses and subway stations will cause the soil layer below the pit bottom to undergo a similar re compression process, ultimately reducing the rebound amount at the pit bottom. After the excavation of the foundation pit is completed, the construction of the cushion layer and bottom plate should be completed in a timely manner to weaken the adverse effects of rebound.
Here, we summarize existing theories of soil unloading and rebound and study the rebound deformation laws of six typical soils in South China through indoor experiments. Moreover, through theoretical research, different rebound deformation calculation methods are compared. The main conclusions of this work are as follows:
(1) The calculation of the rebound amount at the bottom of the pit needs to comprehensively consider the effects of the unloading ratio, soil type, and initial consolidation stress. The shorter the distance between the soil layer below the pit bottom and the surface of the pit bottom is, the greater the rebound amount, and the deeper the soil layer is, the smaller the weight of the rebound amount in the soil layer below the pit bottom. At maximum consolidation stress ranging from 100 kPa to 400 kPa, the maximum rebound rate of plain fill soil in typical soil layers is 0.0539–0.0704, the rebound rate of silty clay is 0.0373–0.0528, the rebound rate of coarse sand is 0.0296–0.0343, the rebound rate of gravelly cohesive soil is 0.0159–0.0305, the rebound rate of fully weathered granite is 0.0175–0.0344, and the rebound rate of strongly weathered granite is 0.0170–0.0379.
(2) The slope of the e-lgp curve of the soil during the unloading and rebound stage is approximately a certain value; that is, the rebound indices are approximately equal and do not change with changes in the unloading ratio or initial consolidation stress. By calculating the rebound index of each soil layer, By calculating the rebound indices of each soil layer, the rebound indices of the soil layer from top to bottom are 0.0143, 0.0119, 0.0077, 0.0096, 0.0083, and 0.0076, respectively, and a formula for calculating the rebound modulus of typical soil layers in South China was proposed.
(3) The pore ratio of the soil after the end of the recompression process is lower than that which occurs after the first compression. The difference between the compression porosity ratio of the soil layer from top to bottom and the compression porosity ratio is 0.1, 0.08, 0.02, 0.06, 0.02, and 0.03, respectively. The self-weight stress generated by the subsequent construction of houses and subway stations on the foundation causes the soil layer below the pit bottom to undergo a similar process of recompression, which ultimately reduces the rebound amount at the pit bottom.
(4) The standard method does not explicitly specify a calculation method for determining the influence of depth. The calculation formula in the residual stress method is based on engineering principles derived from experience investigating other regions. When the excavation depth is 15.5 m, the calculation result of the affected depth is 13.61 m, and when the excavation depth is 25.5 m, it is 14.57 m, which affects the accuracy of the rebound amount. The calculation of the depth of influence by the self-weight stress offset method is based on the theory of eliminating self-weight stress and unloading stress. The calculation depth is not affected by geological conditions, the formula for calculating the rebound modulus is consistent with the formula obtained from experimental research, and the calculation results are in good agreement with the numerical values.
The raw data supporting the conclusions of this article will be made available by the authors, without undue reservation.
QY: Data curation, Software, Writing–original draft. YL: Investigation, Methodology, Writing–original draft. SW: Data curation, Resources, Writing–review and editing. MW: Conceptualization, Investigation, Writing–review and editing. SC: Project administration, Writing–review and editing. XW: Formal Analysis, Writing–review and editing.
The author(s) declare that financial support was received for the research, authorship, and/or publication of this article. This study is supported by the National Science Fund (52272341) and Guangzhou Panyu Polytechnic project (XJ2023000601) and National Natural Science Foundation Youth Program (41902298) and funded by Science and Technology Project of Hebei Education Department (QN2023060) and Guangzhou Science and Technology Bureau Basic and Applied Basic Research Project (202201011855).
Authors SW and MW were employed by Changda Municipal Engineering (Guangdong) Co Ltd.
The remaining authors declare that the research was conducted in the absence of any commercial or financial relationships that could be construed as a potential conflict of interest.
All claims expressed in this article are solely those of the authors and do not necessarily represent those of their affiliated organizations, or those of the publisher, the editors and the reviewers. Any product that may be evaluated in this article, or claim that may be made by its manufacturer, is not guaranteed or endorsed by the publisher.
Borja, R. I. (1990). Analysis of incremental excavation based on critical state theory. J. Geotechnical Eng. 116 (6), 964–985. doi:10.1061/(asce)0733-9410(1990)116:6(964)
Chan, D. H., and Morgenstern, N. R. (1987). Analysis of progressive deformation of the edmonton convention centre. Can. Geotechnical J. 24 (24), 430–440. doi:10.1139/t87-053
Chang, C. Y., and Duncan, J. M. (1970). Analysis of soil movement around a deep excavation. J. Soil Mech. Found. Div 96 (5), 1655–1681. doi:10.1061/jsfeaq.0001459
Chen, X. D., Dong, J. H., and Dong, H. (2021). Calculation methods for rebound deformation of foundation pit bottom considering unloading deformation modulus. China Earthq. Eng. J. 43 (5), 1134–1141.
Chen, Z. B., Zhong, L. F., and Cai, L. J. (2016). Stress pathtriaxial tests on the lateral soil of foundation pit during excavation process. J. Disaster Prev. Mitig. Eng. 6, 943–949.
Finno, R. J., Harahap, I. S., and Sabatini, P. J. (1991). Analysis of braced excavations with coupled finite element formulations. Comput. Geotechnics 12 (2), 91–114. doi:10.1016/0266-352x(91)90001-v
Lambe, T. W. (1967). Stress path method. J. Soil Mech. Found. Div 93 (118), 309–331. doi:10.1061/jsfeaq.0001058
Lambe, T. W. (2010). Braced excavations. Lateral stresses in the ground and Design of earth-retaining structures. Reston, Virginia, United States: ASCE.
Li, D. N., Lou, X. M., and Yang, M. (2011). Experimental researches on unloading resilient deformation properties during excavations in Shanghai area. Rock Soil Mech. 32 (S2), 244–249.
Li, J. M., and Teng, Y. J. (2011). Test study of law of recompression deformation of soil. Rock Soil Mech. 32 (S2), 463–468.
Liu, G. B., and Hou, X. Y. (1996). Unloading modulus of the Shanghai soft clay. Chin. J. Geotechnical Engineering-Chinese Ed. 18 (6), 18–23.
Liu, G. B., Huang, Y. X., and Hou, X. Y. (2000). A practical method for calculating heave of excavated foundation. China Civ. Eng. J. 33 (4), 61–67.
Liu, S. T., and Cheng, P. F. (2010). Based on ABAQUS for numerical analysis of soil constitutive model. Low. Temp. Archit. Technol. 2 (1), 90–92.
Long, M. (2001). Database for retaining wall and ground movements due to deep excavations. J. Geotechnical Geo-environmental Eng. 127 (3), 203–224. doi:10.1061/(asce)1090-0241(2001)127:3(203)
Lou, X. M., Li, D. N., and Liu, J. H. (2012). Rebound stress and deformation below the bottom of deep excavations. Chin. Civ. Eng. J. 45 (4), 134–138.
Lv, Y. (2016). Modified cam clay model parameters in ABAQUS from triaxial tests. Soil Eng. Found. 30 (6), 651.
Mindlin, R. D. (1953). Force at a point in the interior of a semi-infinite solid. Physics 7 (5), 195–202. doi:10.1063/1.1745385
Ministry of Water Resources of the People's Republic of China (2019). Standard for geotechnical testing method. GB/T 50123-2019. Beijing, China: Ministry of Water Resources of the People's Republic of China.
Pan, L. Y., and Hu, Z. X. (2002). Experimental study on the resilience of pit under unloading. Chin. J. Geotechnical Engineering-Chinese Ed. 24 (1), 101–104.
Qin, H. L., Zhang, J., Guo, Y., and Li, F. (2012). Application of ABAQUS in calculating deformation of excavations. Chin. J. Geotechnical Eng. 34, 82–86.
Roscoe, K. H. (1963). Mechanical behavior of an idealized wet clay. In Proc. 2nd European Conf. Soil Mech, 1963 (pp. 47–54).
Wang, L., and Zhang, G. (2017). Finite element analysis of the differential rebound of piles in pit during top-down excavation. J. Univ. Sci. Technol. China 47 (3), 274–282.
Yang, J. M., and Duncan, J. M. (2014). A practical method for calculating layerwise rebound at the bottom of foundation pit, Rock and Soil Mechanics, 35(5):1413–1420.
Zhang, L. Z., Zhang, B., and Feng, J. (2014). Study on numerical simulation of the deformation of surrounding soil during foundation excavation of metro station. J. Eng. Geol. 22 (07), 202–208.
Keywords: deep foundation pit, rebound deformation, consolidation test, resilience modulus, calculation of rebound amount
Citation: Yang Q, Lu Y, Wang S, Wang M, Chen S and Wang X (2024) Research on the rebound rule of a pit bottom caused by excavation of typical strata. Front. Earth Sci. 12:1322036. doi: 10.3389/feart.2024.1322036
Received: 15 October 2023; Accepted: 20 February 2024;
Published: 09 April 2024.
Edited by:
Dao-Yuan Tan, Hong Kong Polytechnic University, Hong Kong SAR, ChinaReviewed by:
Pengju An, Ningbo University, ChinaCopyright © 2024 Yang, Lu, Wang, Wang, Chen and Wang. This is an open-access article distributed under the terms of the Creative Commons Attribution License (CC BY). The use, distribution or reproduction in other forums is permitted, provided the original author(s) and the copyright owner(s) are credited and that the original publication in this journal is cited, in accordance with accepted academic practice. No use, distribution or reproduction is permitted which does not comply with these terms.
*Correspondence: Song Chen, Y2hlbm5zb25nZ0AxNjMuY29t
Disclaimer: All claims expressed in this article are solely those of the authors and do not necessarily represent those of their affiliated organizations, or those of the publisher, the editors and the reviewers. Any product that may be evaluated in this article or claim that may be made by its manufacturer is not guaranteed or endorsed by the publisher.
Research integrity at Frontiers
Learn more about the work of our research integrity team to safeguard the quality of each article we publish.