
94% of researchers rate our articles as excellent or good
Learn more about the work of our research integrity team to safeguard the quality of each article we publish.
Find out more
ORIGINAL RESEARCH article
Front. Earth Sci., 21 June 2024
Sec. Solid Earth Geophysics
Volume 12 - 2024 | https://doi.org/10.3389/feart.2024.1253315
This article is part of the Research TopicRock Physics of Unconventional Reservoirs, volume IIView all 15 articles
 Jiang Bici1,2*
Currently, hydraulic fracturing technology is widely implemented for controlling the surrounding rock and enhancing permeability in low-permeability coal seams. Evaluating the effectiveness of hydraulic fracturing is a critical component of hydraulic fracturing operations. This study addresses the challenges in assessing the location, extension angle, and initial width of fracturing fractures within the current framework of hydraulic fracturing effectiveness evaluation in coal mines. We propose utilizing single-hole reflection borehole radar to evaluate the hydraulic fracturing effect, and through numerical simulation, we analyze the response characteristics of borehole radar when detecting various hydraulic fracturing-induced cracks. Initially, five models representing hydraulic fracturing cracks and two models for non-hydraulic fracturing cracks were established. Subsequently, the responses of borehole radar with central frequencies of 100, 200, and 400 MHz to cracks of identical shapes were analyzed. Additionally, the response characteristics of borehole radar with a 200 MHz central frequency to cracks of varying lengths (1, 2, 3 m), widths (4, 8, 40 cm), and angles (90°, 45°, 15°) were examined. Finally, a comparative analysis was conducted between hydraulic and non-hydraulic fracturing cracks. A branch hole was employed to simulate a hydraulic fracturing crack, allowing for an analysis of the borehole radar’s response characteristics in practical scenarios. The findings indicate that borehole radar is a viable tool for assessing hydraulic fracturing effects, providing a theoretical foundation for identifying the position of cracks, evaluating their effectiveness, and determining the regional effectiveness of the hydraulic fracturing crack system.
Hydraulic fracturing technology, a crucial enhancement method in the oil and gas industry, is utilized to manage the surrounding rock and increase permeability within low-permeability coal seams (Song, 2015; Wang, 2015; Zhao, 2020). Hydraulic fracturing technology uses liquid to transmit pressure and form artificial fractures in formation rocks. Continuous injection of liquid makes the artificial fractures larger, and the liquid brings high-strength solid particles into and fills the fractures. After construction is completed, the liquid is discharged back, and the proppant remains in the fractures, forming a channel with high flow capacity and expanding the seepage area of oil and gas.
The hydraulic fracturing effect evaluation is an important technology in hydraulic fracturing engineering (Shan et al., 2022). The most influential factors on the hydraulic fracturing effect are the expansion form, extension direction and distance of the fracture formed by hydraulic fracturing (Hei et al., 2021; Yuan X, 2019). The fracture-diagnostic technologies include indirect and direct methods. The indirect methods include Well test and History match analysis. The major limitations of this two methods are the following: 1) Model-based assumptions; 2) Requires known values of perm and pressure; 3) Wellbore storage effect; 4) Not suitable for real-time operations. The direct methods include Radioactive Tracers, Caliper log, Temperature log, Production log, Borehole Image Log, Video Camera, Hydraulic Impedance Test, Cross-Dipole Acoustic Log, Deep Shear Wave Imaging, Battery-based Wireless Sensor Network, Battery-less Wireless Sensor Network, Microseismic (Borehole),Microseismic (Surface), Tiltmeter (at Surface), Tiltmeter (Downhole at Offset Well), Tiltmeter at Treatment Well (Downhole), Fiber Optic Cable, Sealed Wellbore Pressure Monitoring,Controlled-Source Electromagnetics, Single hole transient electromagnetic (Zhao et al., 2019; Mo et al., 2020; Zhang et al., 2019; Fan et al., 2016; Duan et al., 2018; Feng et al., 2018). The major limitations for those methods are list in Table 1. In short, the starting position, width, and angle of each single crack in the fracturing fracture cannot be evaluated.
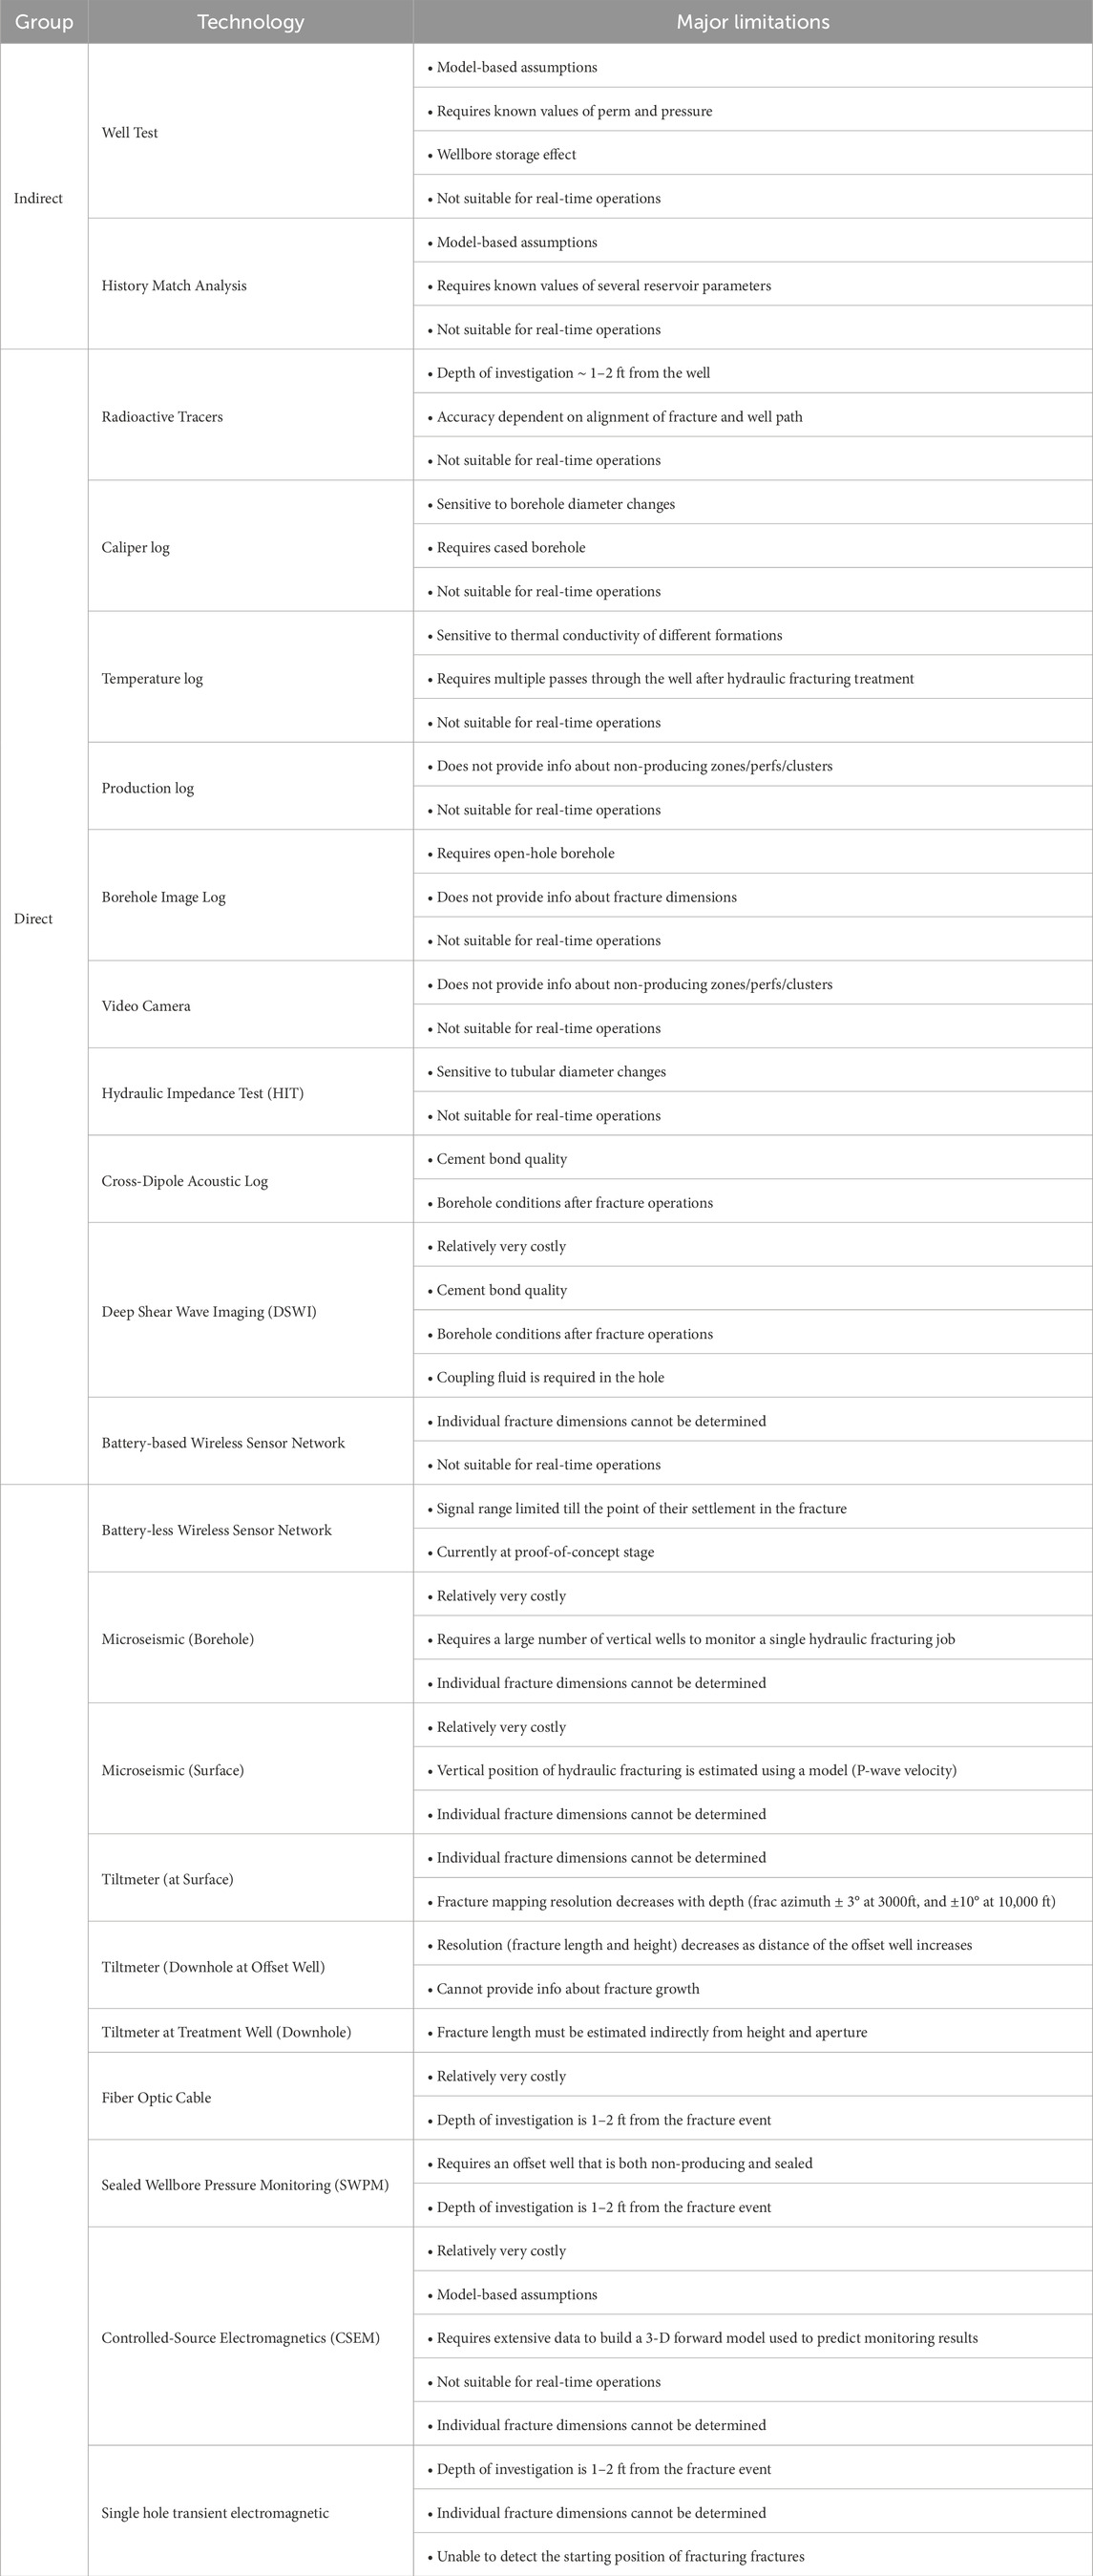
Table 1. Summary of various fracture-diagnostic technologies with limitations.
As a geophysical prospecting method with high detection accuracy and large detection range, borehole radar (BHR) has the advantages of continuity, high efficiency and high accuracy. Through the processing and image interpretation of the reflected signals received by the radar host, the purpose of identifying hidden targets can be achieved (Annan et al., 1973; Rossiter et al., 1975). Using BHR to detect cracks in vertical holes on the ground by single hole reflection measurement and cross hole measurement is effective (Liu et al., 2006). Therefore, this paper proposes to use BHR single hole reflection method to detect the hydraulic fracturing cracks in near horizontal holes in coal mine.
This paper uses numerical simulation to analyze the response characteristics of hydraulic fracturing cracks detected by BHR in near horizontal borehole in coal mine. It analyzes the response characteristics of BHR at different crack angles, crack widths and crack lengths. It provides a theoretical basis for using BHR to evaluate the hydraulic fracturing effect in horizontal borehole in coal mine.
At present, there are three kinds of electromagnetic wave numerical simulation methods: ray tracing method, finite difference time domain (FDTD) method and finite element method (Zeng et al., 2010). In this paper the software Gprmax is used. Gprmax is an open source FDTD based ground penetrating radar (GPR) forward simulation software developed by Edinburgh University (Warren et al., 2016). The Gprmax is widely used in the GPR forward simulation.
FDTD divides the simulation space into finite spatial grids (Figure 1). The electromagnetic field of each grid can be determined by six components of Ex, Ey, Ez, Hx, Hy and Hz, and then the Maxwell equation in time domain can be directly solved by finite difference.
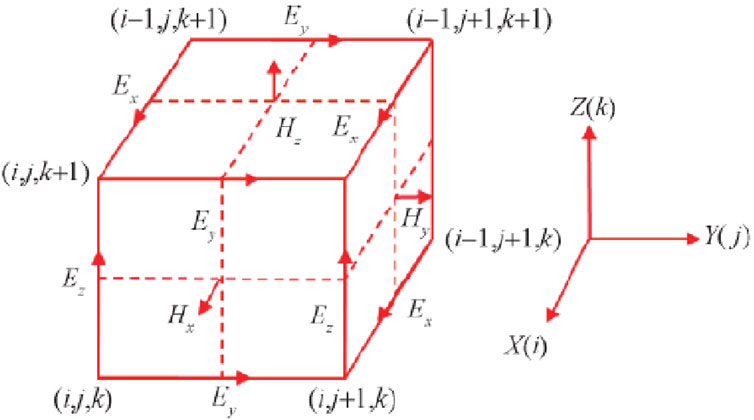
Figure 1. FDTD method difference grid.
After the initial conditions and boundary conditions of the field are given, the distribution values of the spatial electromagnetic field at each time are obtained in turn, that is, the simulation results of the electromagnetic field in the simulation space area are obtained.
When using Gprmax for FDTD forward modeling of BHR, there are three main parameters to be set: 1) antenna parameters, including excitation source type, antenna spacing, antenna frequency, antenna type, output signal and recording time; 2) Geometric parameters of the model, including model size and mesh size; 3) The physical parameters of the model, that is, the physical parameters of the medium in the model area, including the relative dielectric constant, conductivity, relative permeability, etc., The default boundary condition is the fully absorbed boundary condition (PML) (Zhong, 2008). The details of the rules for setting key parameters are listed on the website https://docs.gprmax.com/en/latest/input.html.
The analysis is based on the analysis of the hydraulic fracturing in the coal seam, so the non-hydraulic fracturing crack is also considering the crack developed in the coal seam roof. The basic model is a 20 m × 11 m 2D model, in which the coal seam thickness is 5 m, the roof and floor are sandstone, the thickness is 3 m, the borehole diameter is 90 mm, the borehole is 1 m away from the coal seam floor and 4 m from the roof. In practice, workers operate instruments in the roadway, so the designed roadway in the model is 2 m × 5 m. The basic model is shown in Figure 2.
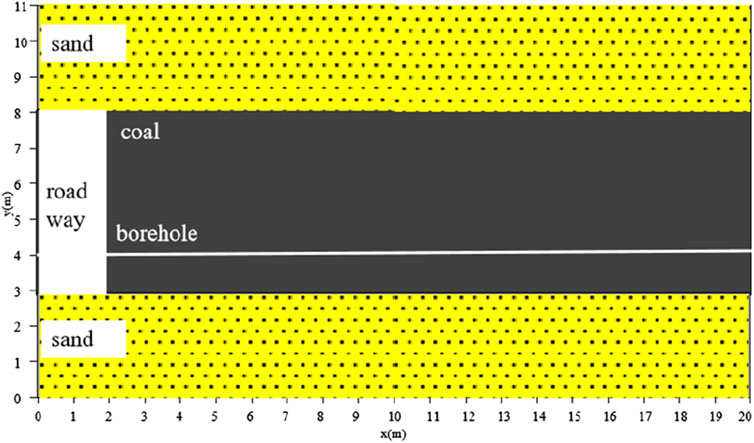
Figure 2. Schematic diagram of basic model.
The hydraulic fracturing crack is filled with fracturing fluid or proppant, the non-hydraulic fracturing crack is filled with fissure filler, the roadway is filled with air, and the borehole is filled with fracturing fluid.
The BHR is designed in the form of single hole reflection. There is an offset between the transmitting antenna and the receiving antenna. The offset is 0.5 m. The transmitting antenna is in the front and the receiving antenna is in the rear; The antenna type is dipole antenna, the excitation source is Ricker wavelet, the recorded signal is electric field intensity, the transmitted and received signals of the antenna are Z-direction signals, the recorded and analyzed signals are Z-direction electric field intensity Ez, the center frequency of the antenna is changed as required, and the grid division is uniform 0.01 m. The boundary condition adopts perfectly matched layer (PML) boundary. According to the model size, the recording time window is 0–100 ns.
According to the parameters requirements of Gprmax, the parameters are shown in Table 2.
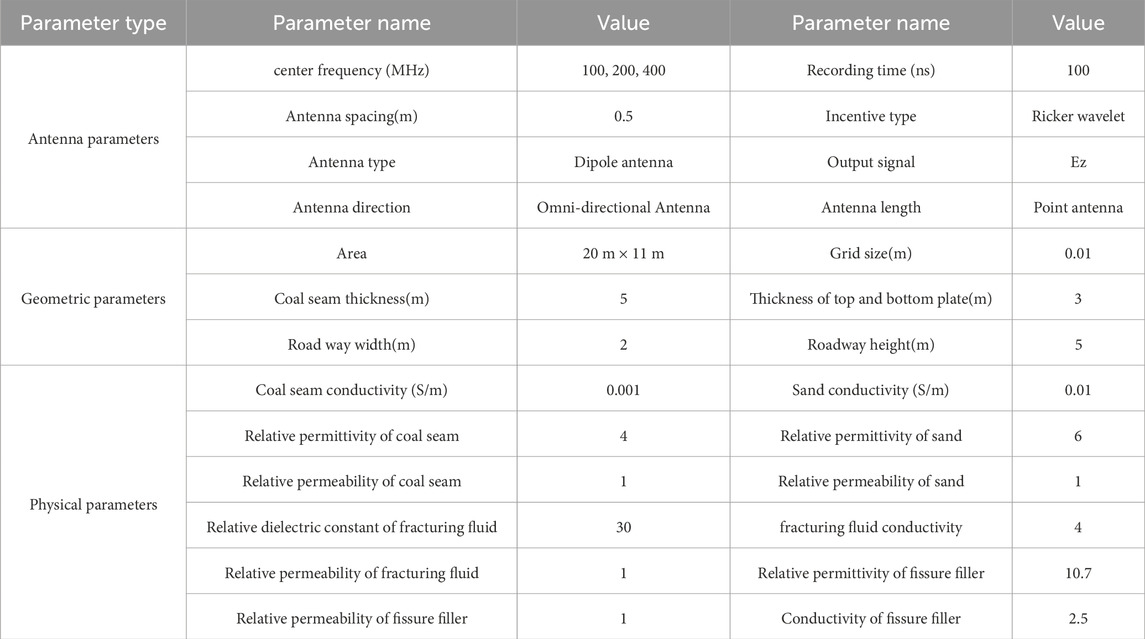
Table 2. The parameters table.
During the hydraulic fracturing in the coal seam, the crack propagation mechanism is complex, and the crack morphology is also complex (Jiang et al, 2015; 2018; Kang 2015). In order to analyze the response characteristics of the BHR, the model is simplified. When establishing the model of the BHR detecting crack in the coal seam, it is assumed that the hydraulic fracturing crack starts from the borehole wall and extends into the formation, and the crack is considered as a line. In Figure 2, it is marked as f. Firstly, the response of the BHR antenna at different center frequencies is simulated and analyzed, Then, the parameters of the crack f are changed, we established five hydraulic fracturing crack models:
1) Model I: the crack length is 2 m, the angle between the crack and the borehole is 90°, the crack width is 0.04 m, and the center frequencies of the radar antenna are 100, 200, and 400 MHz respectively, as shown in Figure 3.
2) Model II: the crack length is 2 m, and the angle between the crack and the borehole is 90°. The width of the crack f in Figure 3 is changed, which is 0.04, 0.08, and 0.4 m respectively.
3) Model III: the crack is 0.04 m wide and 2 m long. The angle of the crack f in Figure 3 is changed. The angle between the crack and the borehole is 90°, 45° and 15° respectively. The dotted line f1 in Fig. 3corresponds to the crack angle of 45° and the dotted line f2 corresponds to the crack angle of 15°.
4) Model Ⅳ: the crack width is 0.04 m, and the angle between the crack and the borehole is 90°. The longitudinal length of the crack f in Figure 3 is changed, and the crack length is 1, 2 and 3 m respectively.
5) Model Ⅴ:on the basis of single crack analysis, multiple crack models are designed. The crack width is 0.04 m, the angle between the crack and the borehole is 90°, and the multiple cracks with different lengths are distributed in fishbone shape. As shown in Figure 4, the lengths of f1-f5 cracks are 2, 3, 4, 3, and 2 m respectively.
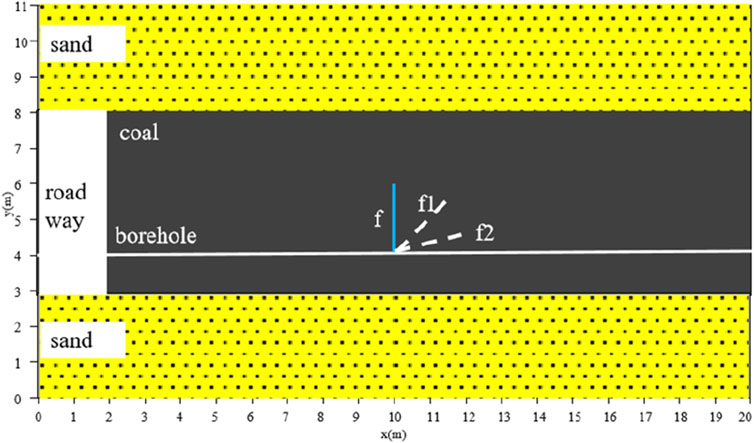
Figure 3. Single crack model (Model I-Model IV).
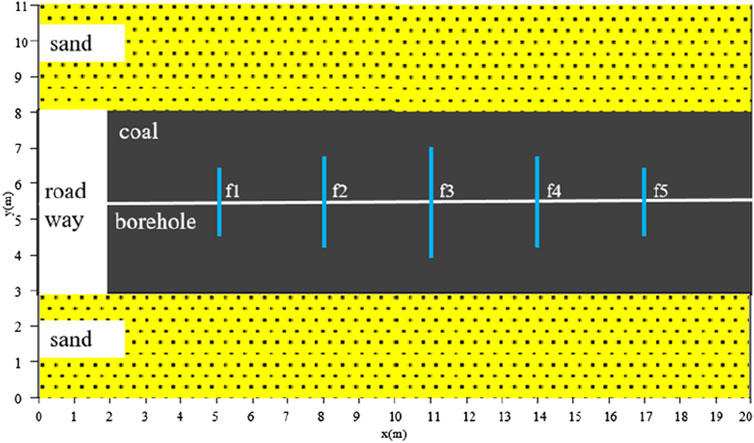
Figure 4. Fishbone distribution model (Model V).
Coal formation is different from oil formation. Due to mineral changes during deposition, overburden pressure, and mining disturbance, there are some cracks formed for other reasons not for hydraulic fracturing (Wang et al, 2015). We call this type crack as non-hydraulic fracturing crack. Two non-hydraulic fracturing crack models are designed:
1) Model I: Cracks with different shapes and depths developed in the roof. The lower end of crack nf1 is 5 m away from the borehole, and the maximum width of crack nf1 is 0.5 m. The lower end of crack nf2 is 3 m away from the borehole, and the maximum width of crack nf2 is 1 m. The crack model is shown in Figure 5.
2) Model II: Cracks penetrating the coal seam are developed in the roof. The cracks shape are irregular, and the maximum width of crack nf is 0.5 m. The schematic diagram of the model is shown in Figure 6.
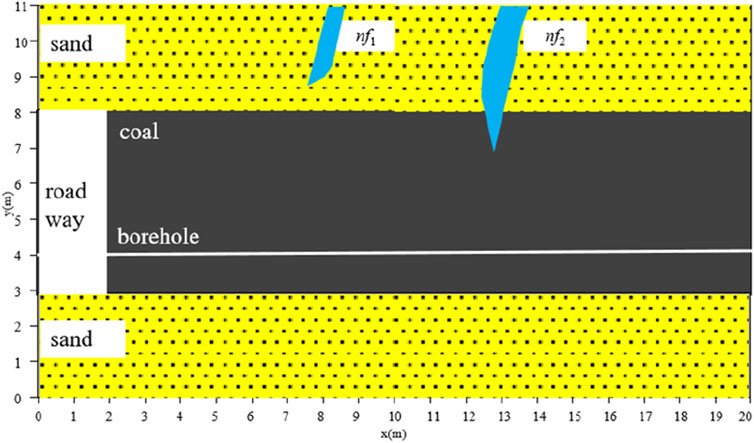
Figure 5. Non-hydraulic fracturing crack with different widths and depths models (Model VI).
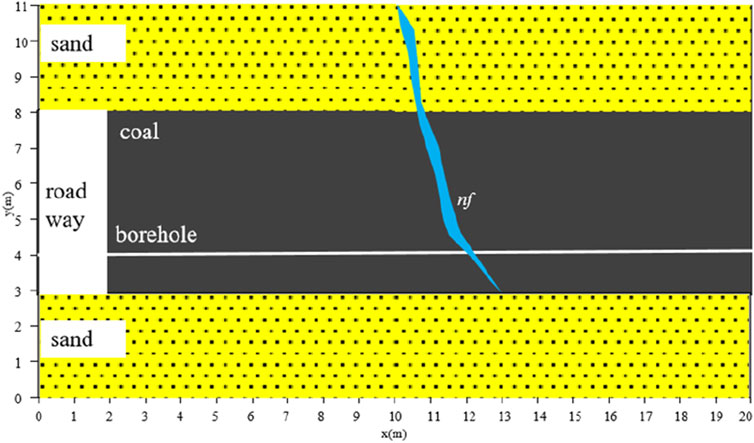
Figure 6. Non-hydraulic fracturing crack penetrating coal seam model (Model VII).
Before hydraulic fracturing in the coal seam, the background field is simulated and analyzed to facilitate the analysis of the BHR response characteristics of the cracks. The BHR central frequency is 200 MHz, the BHR response in the coal mine borehole along the coal seam is shown in Figure 7.
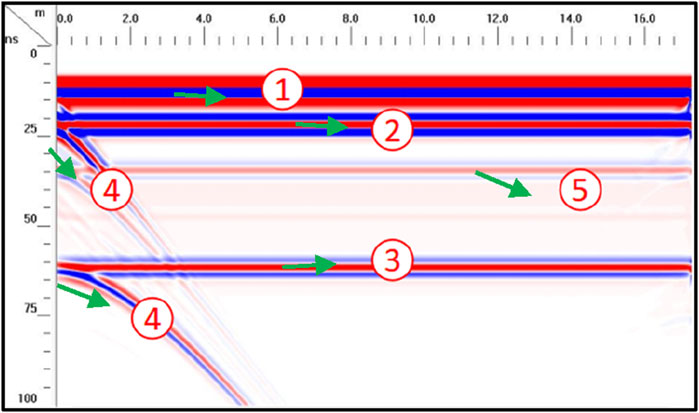
Figure 7. The BHR response profile in coal seam (1→direct wave; 2→the floor wave; 3→ multiple wave; 4→the road wave; 5→the roof wave).
In Figure 7, the abscissa represents the depth of the antenna in the borehole, and the ordinate represents the radar response time (the same in the figures below). The phase axis numbered in the figure represents the direct wave (short for “direct wave”), The phase axis numbered represents the floor reflected wave (short for “the floor wave”), the phase axis numbered represents the roof reflected wave (short for “the roof wave”), the phase axis numbered represents the roadway reflected wave (short for “the road wave”) and the phase axis numbered represents the multiple wave (short for “multiple wave”) respectively.
We simulated and analyzed the response with BHR center frequency of 100 MHz, 200 MHz and 400 MHz to detect crack with 0.04 m width, 2 m length and 90°crack angle. The simulation results are shown in Figures 8–10.
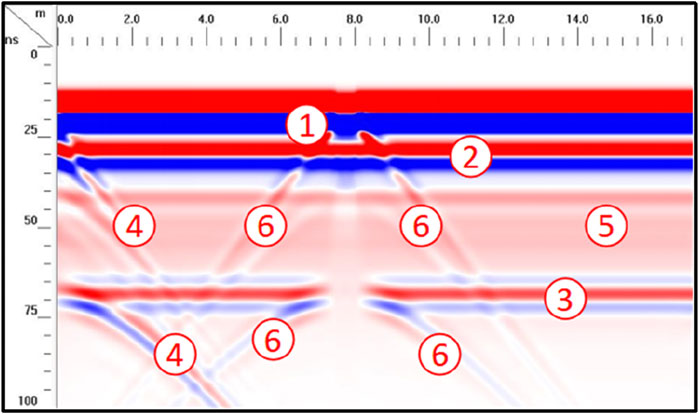
Figure 8. The BHR response profile of center frequency 100 MHz (1→direct wave; 2→the floor wave; 3→multiple wave; 4→the road wave; 5→the roof wave; 6→the crack wave).
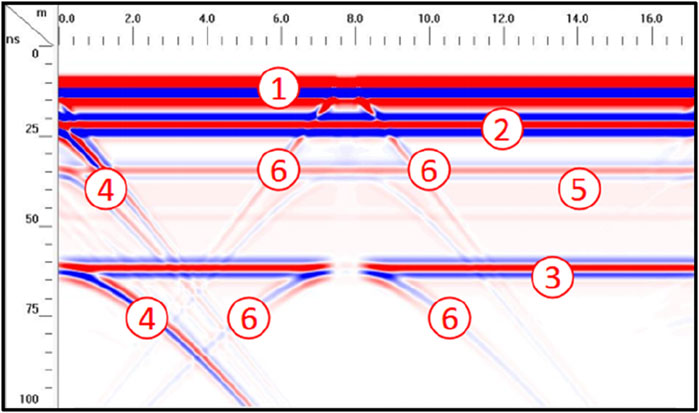
Figure 9. The BHR response profile of center frequency 200 MHz (1→direct wave; 2→the floor wave; 3→multiple wave; 4→the road wave; 5→the roof wave; 6→the crack wave).
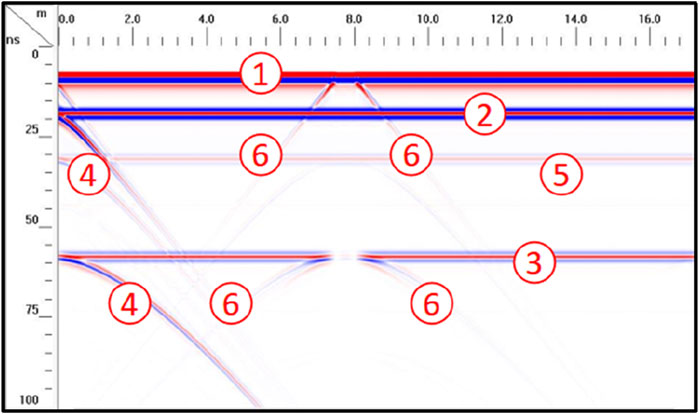
Figure 10. The BHR response profile of center frequency 400 MHz (1→direct wave; 2→the floor wave; 3→ multiple wave; 4→the road wave; 5→the roof wave; 6→the crack wave).
In Figures 8–10, the reference number ∼ phase axis have the same meaning as that in Figure 7. The reference number is the response phase axis of hydraulic fracturing crack (short for “the crack wave”). The upper event is caused by the reflection from the starting of the crack, and the lower event is caused by the reflection from the ending of the crack. On the BHR response time profiles at three frequencies, the phase axis characteristics of hydraulic fracturing crack are obvious, the crack reflection phase axis in 100 MHz BHR profile are not very clear compared with 200 MHz and 400 MHz. The details of 200 MHz BHR are the same clear as 400 MHz.But in the same time zone, the 400 MHz image color is relative light than the 200 MHz image, which means that the reflected wave energy in 400 MHz BHR profile is weaker than in 200 MHz BHR profile. Therefore, the BHR frequency is too high or too low, which is unfavorable to detection. It is recommended to use 200 MHz borehole radar to detect hydraulic fracturing cracks.
The cracks length are 2 m, the cracks angle are 90°. The cracks widths are 0.04 m, 0.08 and 0.4 m respectively. According to the previous studies, the 200 MHz BHR is selected. The simulation results are shown in Figures 11, 12 (the response of the model results with the crack width of 0.04 m is shown in Figure 9).
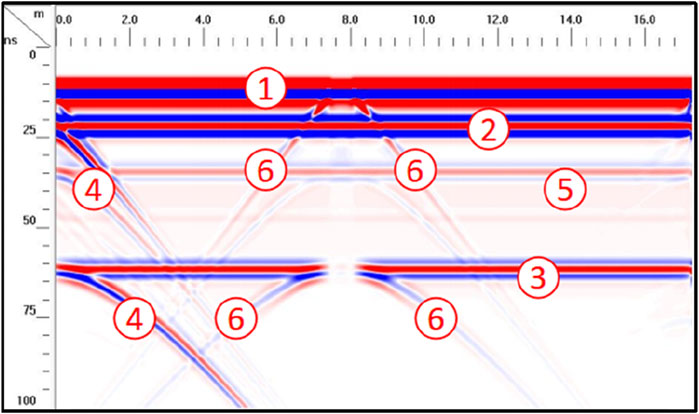
Figure 11. The BHR response profile for 0.08 m width crack (1→direct wave; 2→the floor wave; 3→multiple wave; 4→the road wave; 5→the roof wave; 6→the crack wave).
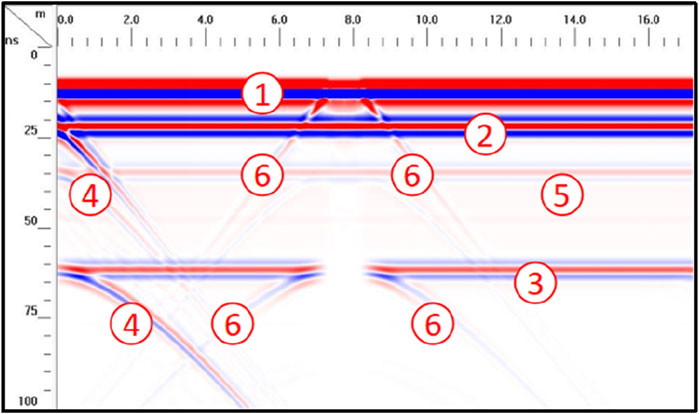
Figure 12. The BHR response profile for 0.4 m width crack (1→direct wave; 2→the floor wave; 3→multiple wave; 4→the road wave; 5→the roof wave; 6→the crack wave).
In Figures 11, Figures 12, the phase axis numbered ∼phase axis has the same meaning as that in Figure 8. The main difference in Figure 8\11\12 is that the direct wave phase axis and the interruption width of roof reflection phase axis are different. The width of crack has little influence on the transverse width of the crack phase axis. According to Guo’s research, the wider the crack, the stronger the amplitude (Guo S L et al, 2016). So we can use Guo’s research to calculate the crack width, the formula is:
Where y is the max amplitude intensity, x is the crack width.
The cracks angle are 90°. The cracks width are 0.04 m, the cracks length are 1, 2, 3 m respectively. According to the previous studies, the 200 MHz BHR is selected. The simulation results are shown in Figures 9, 13, 14 respectively

Figure 13. The BHR response profile for 1 m length crack (1→direct wave; 2→the floor wave; 3→multiple wave; 4→the road wave; 5→the roof wave; 6→the crack wave).
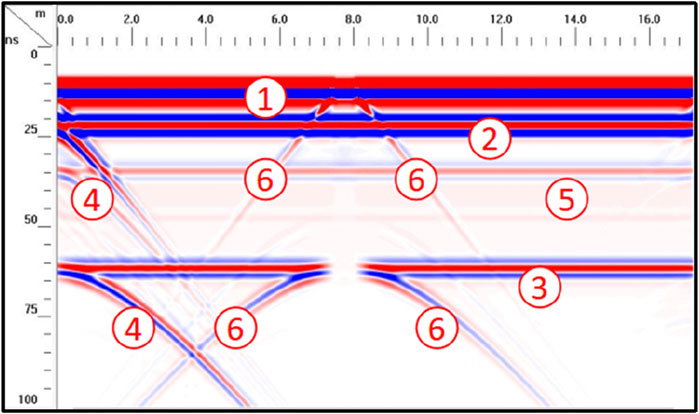
Figure 14. The BHR response profile for 3 m length crack (1→direct wave; 2→the floor wave; 3→multiple wave; 4→the road wave; 5→the roof wave; 6→the crack wave).
In Figures 13, 14, the phase axis numbered ∼phase axis have the same meaning as that in Figure 8. By comparing Figures 9, 13, 14, we can find that the difference of reflection phase axes of cracks is mainly in the difference of lateral length of the lower phase axis labeled. The larger the crack length, the longer the phase axis. In practical application, the crack length can be analyzed by judging the lateral length of the phase axis.
The cracks width are 0.04 m, the cracks length are 2 m, the cracks angle are 15°, 45° and 90°respectively. According to the previous studies, the 200 MHz BHR is selected. The simulation results are shown in Figures 9, 15, 16 respectively.
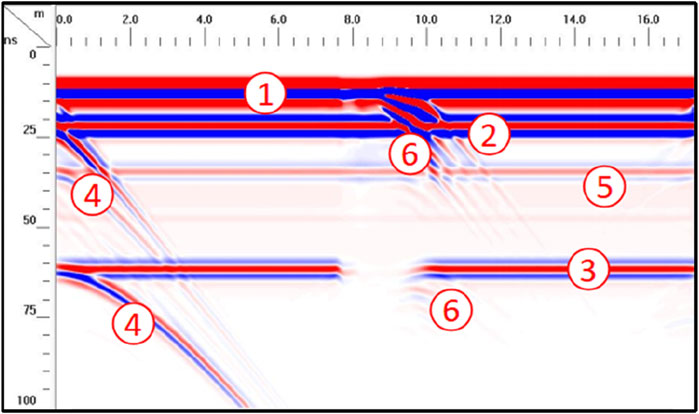
Figure 15. The BHR response profile for 15° angle crack (1→direct wave; 2→the floor wave; 3→multiple wave; 4→the road wave; 5→the roof wave; 6→the crack wave).
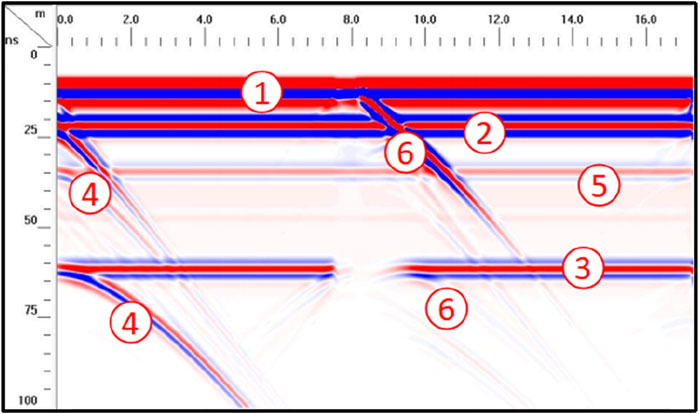
Figure 16. The BHR response profile for 45° angle crack (1→direct wave; 2→the floor wave; 3→multiple wave; 4→the road wave; 5→the roof wave; 6→the crack wave).
In Figures 15, 16, the phase axis numbered ∼phase axis has the same meaning as that in Figure 8. By comparing Figures 9, 15, 16, we can find that when the angle between the crack and the borehole is not 90°, the reflection event axis of the crack will not appear in the form of hyperbola. The larger the included angle of the crack, the larger the angle of the reflection event axis, until it appears in the form of symmetric hyperbola at 90°. In practical application, the crack angle can be analyzed by analyzing the angle between the crack phase axis with the direct phase axis.
The model is described in the model V, the simulated result is shown in Figure 17. In Figure 17, the phase axis numbered ∼phase axis has the same meaning as that in Figure 7 and the reference numbers ∼ correspond to the response of the cracks f1-f5 in Figure 4. According to Figure 17, when there are multiple fracturing cracks at the same time, multiple cracks can be distinguished on the BHR profile. Five cracks can be clearly identified. In practical application, the BHR can detect multiple hydraulic fracturing cracks at once. Compared to Figures 11–14, we cannot determine from Figure 17 whether the cracks are developing upwards, downwards, or through the borehole. Which means that the cracks direction can not be recognized.
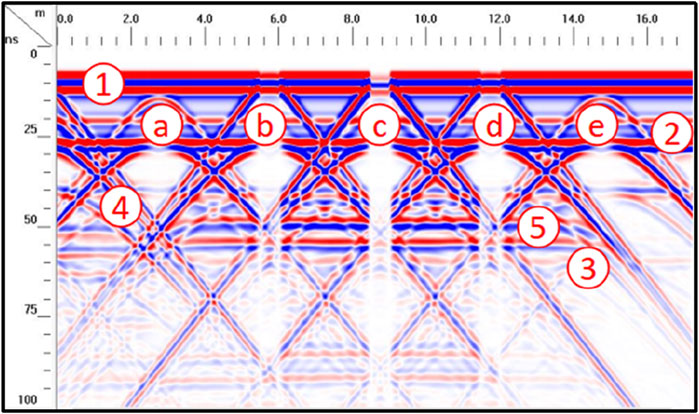
Figure 17. BHR response s of fish bone crack (1→direct wave; 2→the floor wave; 3→multiple wave; 4→the road wave; 5→the roof wave; a→the f1 crack wave; b→the f2 crack wave; c→the f3 crack wave; d→the f4 crack wave; e→the f5 crack wave).
Two primary cracks with different shapes and depths developed in the roof which are shown in Figure 4. According to the previous studies, we also chose 200 MHz BHR to detect the cracks. The simulation results are shown in Figure 18.
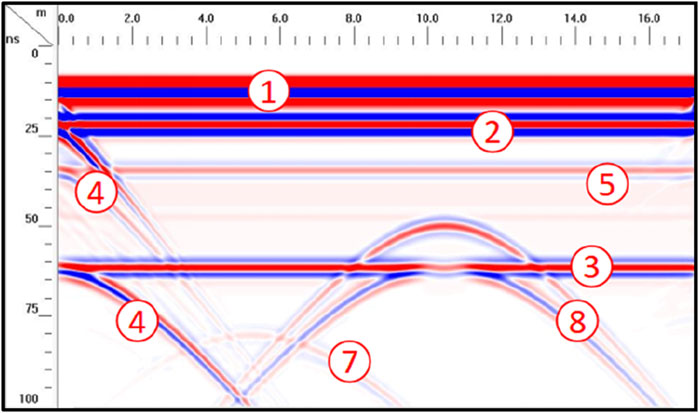
Figure 18. BHR response of two roof developed cracks (1→direct wave; 2→the floor wave; 3→multiple wave; 4→the road wave; 5→the roof wave; 7→the nf1 crack wave; 8→the nf2 crack wave).
In Figure 18, the phase axis numbered ∼phase axis has the same meaning as that in Figure 7. The phase axis numbered and correspond to the responses of cracks nf1 and nf2 in Figure 4 on BHR profile, respectively. According to Figure 18, the distance between the lower end points of nf1 and nf2, and the borehole is different, and the corresponding time between the phase axis numbers and the top end of the in-phase axis is different. Therefore, the distance between the crack and the borehole can be judged according to the position of the in-phase axis of the crack on BHR.
The crack developed in the roof and penetrating the coal seam is shown in Figure 5. The detection process is the same as before. The simulation results are shown in Figure 19.
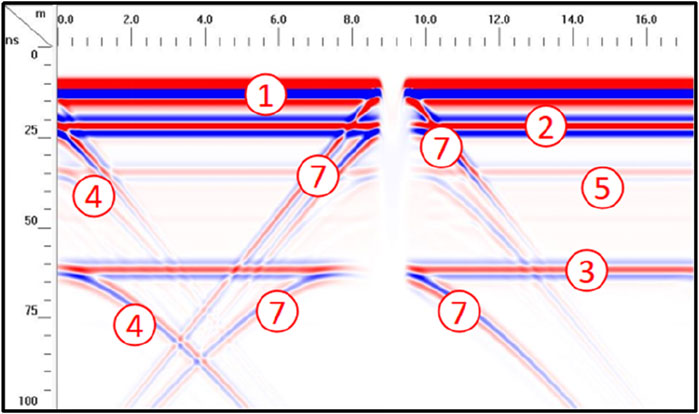
Figure 19. BHR response of borehole with cracks developed through the coal seam in the roof (1→direct wave; 2→the floor wave; 3→multiple wave; 4→the road wave; 5→the roof wave; 7→the nf crack wave).
In Figure 19, the phase axis numbered ∼phase axis has the same meaning as that in Figure 7. The phase axis numbered correspond to the response of crack nf in Figure 5 on BHR profile. Compared with the previous hydraulic fracturing cracks responses shown in Figure 9, the characteristics of this kind of crack on the BHR profile are not different from those of the previous hydraulic fracturing cracks. In the actual hydraulic fracturing effect detection, such cracks should also be paid attention for geophysical engineers, so we do not need to distinguish such non-hydraulic fracturing cracks from hydraulic fracturing cracks.
In actual production, we rarely have the opportunity to directly observe the development of cracks in the process of hydraulic fracturing, however we can leverage the construction of branch holes that occur during the drilling process in coal mines. By treating these branch holes as known hydraulic fracturing cracks, we can use Borehole Radar (BHR) for detection purposes. This approach allows us to assess the effectiveness of BHR in evaluating hydraulic fracturing outcomes.
Before heading of 2,203 working face of a capital construction coal mine in Shanxi Province, directional long boreholes and branch holes were used to detect the geological structures.
The drilling depth of the main hole was 468 m, and 7 m metal sleeve is placed away from the main hole opening. The borehole diameter is 120 mm, and the 1-1 branch hole is opened at the hole depth of 60 m. The depth of the branch hole is 12 m. The trajectory of the main hole (0–80 m) and the 1-1 branch hole and the formation conditions encountered is shown in Figure 20. The mud circulation drilling is adopted in the drilling process. Therefore, the branch hole detection is used to simulate the characteristics of the cracks detected by the BHR in practice. The BHR center frequency is 200 MHz, and the antenna is sent into the main hole by hand to measure the depth of 80 m, the instrument photo and parameters are shown in Figure 21. The site construction picture is shown in Figure 22. The original time-domain profile is shown in Figure 23, The data processing flow is as following:
1) Time zero correction, to eliminate the influence caused by the delay of the instrument itself;
2) AGC processing, to improve the interpretability of BHR images;
3) Bandpass filtering, to eliminate interference, the bandpass filtering frequency range is from 150 MHz to 400 MHz; The processed the time-domain profile is shown in Figure 24.
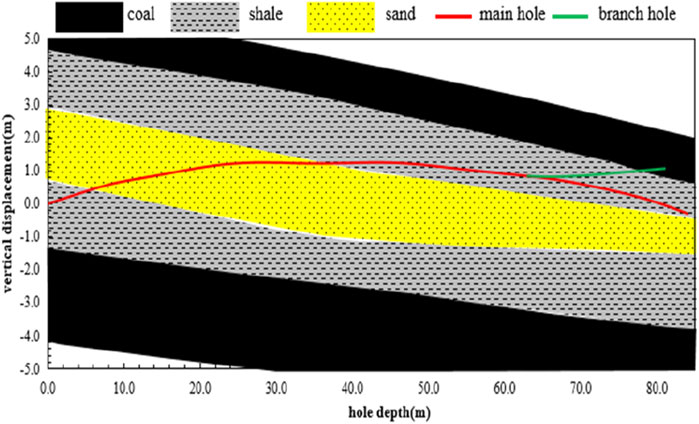
Figure 20. The distribution of holes.
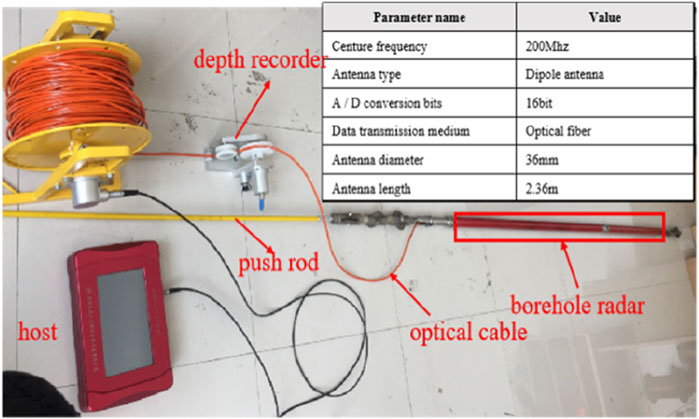
Figure 21. BHR instrument photo.
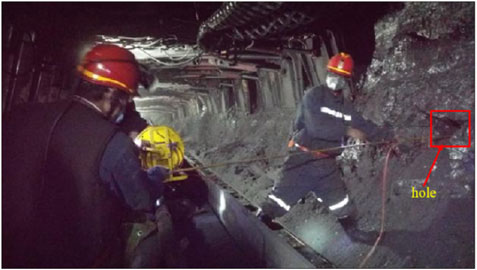
Figure 22. Site construction photos.
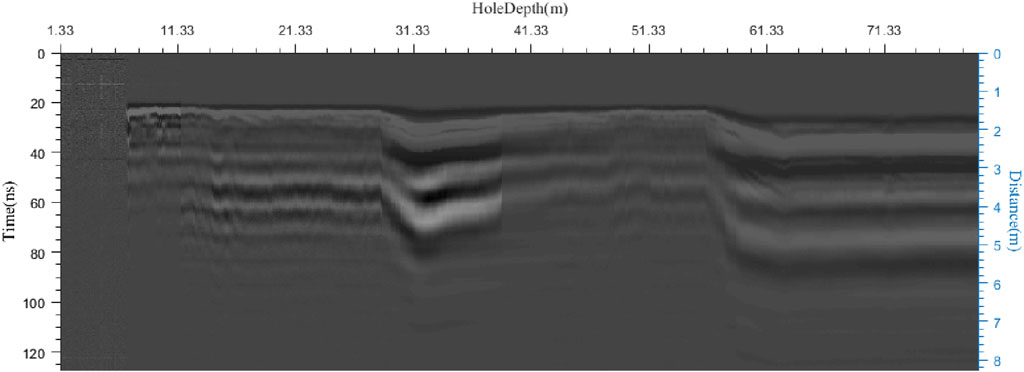
Figure 23. The original BHR time domain profile.
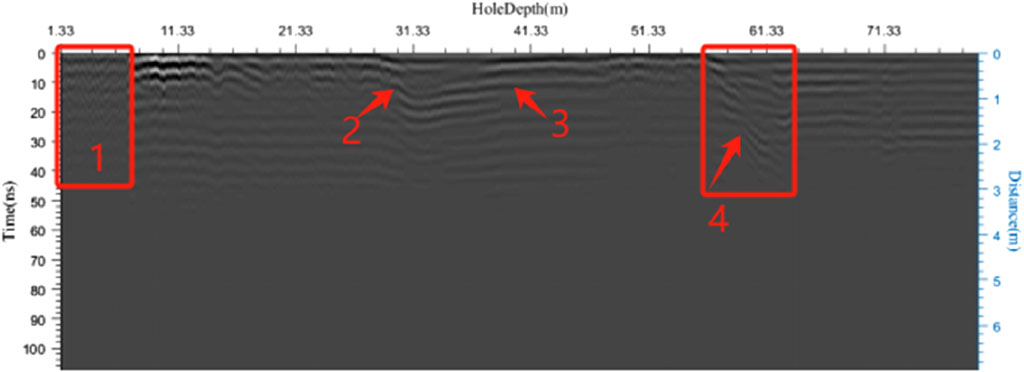
Figure 24. The processed BHR time domain profile (The abnormal area labeled one is the metal casing response; The abnormal area labeled two and three are the lithology change response; The abnormal area labeled four is the branch hole response).
In Figure 24, 1) The abnormal area labeled 1 (depth 1.33–7.33 m) is due to the presence of a metal casing as support at the orifice, which shields the signal of the drilling radar inside the metal casing. 2) there are structures at the depth 33 m (labeled 2) and layers at the depth of 40 m (labeled 3) on the BHR profile, which is not conducive to the analysis of the characteristics of branch holes. 3) The characteristics of branch holes at the depth of 60 m are obvious, which is consistent with Figures 14, 15. The length of branch holes cannot be computed on the BHR time-domain profile. Therefore, it is recommended to detect the original structure of the formation around the hole before hydraulic fracturing. After fracturing, crack detection shall be carried out to compare and analyze the distribution and characteristic of hydraulic fracturing cracks.
1) Single-hole reflection borehole radar (BHR) can be utilized to detect hydraulic fracturing cracks. It is recommended to use a BHR tool with a 200 MHz center frequency for detecting hydraulic fracturing cracks. When employing BHR to detect such cracks, it can ascertain the initial development position of the cracks, determine whether the hydraulic fracturing cracks are perpendicular to the borehole or at an angle other than 90°, and estimate the approximate length of the cracks’ development. When multiple cracks are present simultaneously, the response characteristics of each crack can be clearly distinguished on the BHR time-domain profile. For the original cracks within the formation, the BHR response characteristics differ significantly from those of hydraulic fracturing cracks, allowing for differentiation.
2) In practice, when BHR is employed to detect hydraulic fracturing cracks, the geological conditions are complex, with numerous influencing factors, leading to complex BHR response characteristics. It is advisable to first assess the original structure of the formation surrounding the borehole before hydraulic fracturing occurs, followed by BHR detection post-fracturing. Through comparison and analysis, the response associated with the cracks can be more clearly delineated.
3) For practical applications, single-hole reflection BHR is incapable of calculating the propagation length of hydraulic fracturing cracks. It is suggested that, in the future, cross-hole BHR or array borehole radar technology be explored to determine the length of crack propagation.
4) With omnidirectional drilling radar antennas, determining the direction of crack propagation is not possible. In the future, directional borehole radar antennas may be utilized to ascertain the direction of crack propagation.
5) This article presents a novel research direction for the detection of hydraulic fracturing cracks but does not address the response characteristics of borehole radar detection, such as mapping cracks, cross-cracks, fracture permeability, heterogeneity. Further in-depth research in these areas will be necessary in the future
The original contributions presented in the study are included in the article/Supplementary Material, further inquiries can be directed to the corresponding author.
JB: Writing–original draft, Writing–review and editing.
The author(s) declare that financial support was received for the research, authorship, and/or publication of this article. Thanks for the support by the National Key R and D plan (2018YFC0807804) and Key R&D Plan of Shaanxi Province (2023-YBGY-111).
Author JB was employed by the company China Coal Research Institute Xi’an Science and Industry Group.
The author declares that this study received funding from the Scientific and Technological Innovation projects of CCTEG Xi’an Research Institute (2023XAYJS06) and the General Project of Middling Coal Technology and Industry Group (2022-2-TD-MS005). The funders had the following involvement in the study: provided financial support and essential equipment that facilitated the data collection process for our research article, and participated actively in the study design, data collection and analysis, and decision-making process regarding the publication of the article.
All claims expressed in this article are solely those of the authors and do not necessarily represent those of their affiliated organizations, or those of the publisher, the editors and the reviewers. Any product that may be evaluated in this article, or claim that may be made by its manufacturer, is not guaranteed or endorsed by the publisher.
Duan, J. H., Tang, H. W., and Wang, Y. H. (2018). Detection technology of hydraulic fracturing in coalbed methane well based on microseismic and transient electromagnetic method. Coal Sci. Technol. 46 (6), 160–166. doi:10.13199/j.cnki.cst.2018.06.027
Erick, B. L. D., Pedro, J. V., da Silva, S. L. E. F., and Torres, H. (2022). Hydraulic fracturing assessment on seismic hazard by Tsallis statistics. Eur. Phys. J. B 95 (6), 92. doi:10.1140/epjb/s10051-022-00361-6
Fan, T. (2020). Coalbed methane hydraulic fracturing effectiveness test using minimal coil single bore-hole transient electromagnetic method. J. China Coal Soc., 1–16. doi:10.13225/j.cnki.jccs.2019.0827
Fan, T., Cheng, J. Y., Wang, B. L., Liu, L., Yao, W. H., Wang, J. K., et al. (2016). Experimental study on imaging method of TEM pseudo wave-field to detect the effect of under-ground coal-bed gas hydraulic fracturing. J. China Coal Soc. 41 (7), 1762–1768. doi:10.13225/j.cnki.jccs.2015.1490
Feng, Q., Wang, T., Yang, H., Huang, Z. J., and Li, X. N. (2018). Fracturing parameters optimization and evaluation of CBM crackd wells. Nat. Gas. Geosci. 29 (11), 1639–1646.
Hei, C., Luo, M. Z., and Zou, X. (2021). Evaluation methods of the hydraulic fracturing effect based on the energy of borehole scattered wave. J. Yangtze Univ. Nat. Sci. Ed. 18 (3), 14–20. doi:10.16772/j.cnki.1673-1409.2021.03.002
Jane, L., Jan, B., and Laura, F. (2016). Assessment of hydraulic fracturing in California. Abstr. Pap. Am. Chem. Soc. 251.
Jiang, T. T. (2015). “Study on the mechanism of hyraulic fracture Network and propagation,” in Coalbed methane reservoir (China University of Petroleum East China).
Jiang, T. T., Zhang, J. H., and Huang, G. (2018). Experimental study of fracture geometry during hydraulic fracturing in coal. Rock Soil Mech. 39 (10), 3677–3684. doi:10.16285/j.rsm.2017.0194
Kang, X. T. (2015). Research on hydraulic fracturing propagation rules in coal seam and gas extraction drilling optimization. Chongqing University.
Li, N., Fang, L., Sun, W., Zhang, X., and Chen, D. (2020). Evaluation of borehole hydraulic fracturing in coal seam using the microseismic monitoring method. Rock Mech. Rock Eng. 54 (2), 607–625. doi:10.1007/s00603-020-02297-8
Liu, H., Si, G., and Huang, H. W. (2013). Research on valuation methods and cost control measures of hydraulic fracturing in shale gas horizontal wells. Appl. Mech. Mater. 2301 (295-298), 3166–3170. doi:10.4028/scientific.net/amm.295-298.3166
Liu, S. X., Zeng, Z. F., and Xu, B. (2006). Subsurface water-filled cracks detection by borehole radar. Process Geophys. 2, 620–624.
Longinos, N. S., Abbas, H. A., Bolatov, A., Skrzypacz, P., and Hazlett, R. (2023). Application of image processing in evaluation of hydraulic fracturing with liquid nitrogen: a case study of coal samples from karaganda basin. Appl. Sci. 13 (13), 7861. doi:10.3390/app13137861
Mo, L. (2020). Application of optical fiber micro-seismic detection technology in fracturing effect evaluation. J. Jianghan Petroleum Univ. Staff Work. 33 (2), 1–3. doi:10.3969/j.issn.100-301x.2020.02.001
Peter Annan, A., Strangway, D. W., and Simmons, G. (1973). RADIO INTERFEROMETRY DEPTH SOUNDING: PART I—THEORETICAL DISCUSSION. Geophysics 38 (3), 557–580. doi:10.1190/1.1440360
Rossiter, J. R., Strangway, D. W., Annan, A. P., Watts, R. D., and Redman, J. D. (1975). Detection of thin layers by radio interferometry. Geophysics 40 (no2), 299–308. doi:10.1190/1.1440526
Shan, T., Sun, C. Y., Wang, Q., Xie, X. J., and Fan, Y. G. (2022). Evaluation method and application of fracturing effect based on dynamic permeability change of coal reservoir hydraulic fracturing. Coal Geol. Explor. 50 (5), 57–65. doi:10.12363/issn.1001-1986.21.09.0536
Song, C. P. (2015). Application of multiple-borehole hydraulic fracturing method to control crack propagation in underground coal mines. Chongqing University.
Wang, Z. L. (2015). Research on underground hydraulic fracturing technology in low permeability coal seam. China University of Mining and Technology.
Warren, C., Giannopoulos, A., Giannakis, I., et al. (2016). GprMax:Open source software to simulate electromagnetic wave propagation for ground penetrating radar. Comput. Phys. Commun. 209, 163–170. doi:10.1016/j.cpc.2016.08.020
Yuan, X. (2019). Forward modeling of hydraulic fracture in vertical Well by electromagnetic wave logging. Beijing, P.R.China: Beijing: China University of Petroleum Beijing.
Zeng, Z. F., Liu, S. X., Wang, Z. J., and Xue, J. (2010). Principle and application of ground penetrating radar. Science Press: Electronic industry press.
Zhang, M. L., Zhang, T. Y., and Fan, J. Y. (2019). Calculation and analysis of crack extension parameters based on PKN model. Sci. Technol. Eng. 19 (5), 116–123.
Zhao, R., Fao, T., Li, Y. T., Wang, Y. K., Ma, Y., Wang, B. C., et al. (2020). Application of borehole transient electromagnetic detection in the test of hydraulic fracturing effect. Coal Geol. Explor. 48 (04), 41–45.
Zhao, S. K., Zhang, G. H., Chai, H. T., Su, Z. G., Liu, Y. T., and Zhang, X. F. (2019). Mechanism of rock burst prevention for directional hydraulic fracturing in deep-hole roof and effect test with multi-parameter. J. Min. Saf. Eng. 36 (6), 1247–1255. doi:10.13545/j.cnki.jmse.2019.06.023
Keywords: hydraulic fracturing, borehole radar, crack detection, coal mine, near horizontal hole
Citation: Bici J (2024) Using borehole radar detecting hydraulic fracturing crack in near horizontal holes in coal mine. Front. Earth Sci. 12:1253315. doi: 10.3389/feart.2024.1253315
Received: 05 July 2023; Accepted: 20 May 2024;
Published: 21 June 2024.
Edited by:
Junfang Zhang, Commonwealth Scientific and Industrial Research Organisation (CSIRO), AustraliaReviewed by:
Lin Zhang, Hohai University, ChinaCopyright © 2024 Bici. This is an open-access article distributed under the terms of the Creative Commons Attribution License (CC BY). The use, distribution or reproduction in other forums is permitted, provided the original author(s) and the copyright owner(s) are credited and that the original publication in this journal is cited, in accordance with accepted academic practice. No use, distribution or reproduction is permitted which does not comply with these terms.
*Correspondence: Jiang Bici, amlhbmdiaWNpQDE2My5jb20=
Disclaimer: All claims expressed in this article are solely those of the authors and do not necessarily represent those of their affiliated organizations, or those of the publisher, the editors and the reviewers. Any product that may be evaluated in this article or claim that may be made by its manufacturer is not guaranteed or endorsed by the publisher.
Research integrity at Frontiers
Learn more about the work of our research integrity team to safeguard the quality of each article we publish.