 Guo-Jing Cui
 Jiang-Sheng Xie3
 Xiao-xu Tian
- 1School of Civil Engineering, Xi’an University of Architecture and Technology, Xi’an, China
- 2Shaanxi Provincial Key Laboratory of Geotechnical and Underground Space Engineering, Xi’an, China
- 3China Railway 20th Bureau Group Corporation Limited, Xi’an, China
- 4China Railway 20th Bureau Group First Engineering Co., Ltd., Suzhou, China
- 5Hanjiang-to-Weihe River Valley Water Diversion Project Construction Co., Ltd., Hanjiang, China
To ensure the normal passage of an ascending road during the construction of a pipe-jacking tunnel, trains generally run at low speeds during the construction phase and adopt normal speeds later. Using Jingjiu Road, Xi’an, China, as an engineering case, this study evaluated and predicted the dynamic response of a tunnel structure and soil mass when trains run at low to normal speeds. When the train speed was controlled in the range of 30–60 km/h, the soil deformation change rate around the shallow-buried pipe-jacking tunnel was 0.41%. The maximum tensile stress growth rate of the pipe-jacking tunnel structure was 0.037%, the maximum compressive stress growth rate was 0.128%, and the maximum increase in the stress of the pipe-jacking structure was 1.82%. Thus, the soil and structure of the pipe-jacking tunnel were in a safe-stress state. The results show that the influence of train speed on soil and structural stress is small and can be ignored.
1 Introduction
With rapid and large-scale construction of pipe-jacking tunnels in cities where important buildings or traffic lines exist, the engineering route will inevitably be orthogonal and oblique. (Degrande et al., 2006; Zhou et al., 2022; Liu et al., 2023). Ensuring the safe operation of established traffic lines is crucial in urban traffic. Owing to the long construction cycle times of the pipe-jacking tunnel projects, disturbance due to construction activities can be significant, and the repeated vibration load of trains can adversely impact the structure of the pipe-jacking tunnels. Trains usually travel at a low speed when passing through the construction section and regain their normal speed once they exit the construction section. Presently, urban, shallow, buried tunnel construction is still in its early stages in China. To ensure the stability of the upper environment, it is important to study the trains running over shallow, buried tube tunnels and the structural deformations after construction.
Many experts and researchers have studied the soil and structural deformation properties of pipe-jacking tunnels subjected to the influences of train speeds and dynamic loads (Li et al., 2019; Liu et al., 2020). Wenhua et al. (2007) used instruments such as a strong seismoscope and dynamic earth pressure box to perform field tests on the engineering section of the Lianyan Expressway. They analyzed the dynamic response characteristics of pavements and subgrades at different depths for different vehicle types and speed conditions. Based on a three-hole parallel tunnel project where an underpass of a railway trunk line was built, Lun and Yu (2008) studied the dynamic responses of trains running through parallel tunnels at different speeds using ANSYS finite element numerical simulations and determined the changes in the vault pressure as a function of the buried depth and the longitudinal tunnel. To calculate the dynamic responses of the strata of the Guangzhou–Shenzhen–Hong Kong high-speed railway tunnel subject to high-speed trains and analyze the influence of groundwater, Bao et al. (2011) established a three-dimensional numerical model using the FLAC3D software. Yufang (2013) considered a tunnel running through the Beijing–Shanghai high-speed railways as a research object and simulated the dynamic response law of the lining structure of the tunnel at different construction stages subject to the action of train vibration loads. Their results indicated that the tunnel was in the most unfavorable construction position when trains passed through. Xiangqiu et al. (2005) conducted field tests and frequency-response analyses on the dynamic response of the Zhuting tunnel structure of the Beijing–Guangzhou line when the train speed was approximately 80 km/h. They established an analysis model and digital expression of the train vibration load and obtained the vertical displacement, acceleration, and internal force–time history curves of the tunnel lining structure. Dewu and Feng (1997) measured the influence of velocity on the vibration energy and structural vibration acceleration of the Jinjiayan and Zhalanyingzi tunnels when the train speed was approximately 50 km/h. Wang et al. (2022) performed numerical simulations to study the dynamic response characteristics of the bottom part of tunnel structures in water-rich soft strata subjected to heavy-duty train loads. With pore-water pressure and vertical dynamic stress as the evaluation indices, the response rules of the excess pore-water pressure and soil dynamic stress at bedrock were analyzed when subject to 25,000, 27,000, and 30,000 kg trains. Zhu et al. (2020) used the Newmark dynamic time-history analysis of three-dimensional finite element and seed equivalent linear methods to simulate the vibration softening of the subgrade. They performed numerical simulations to evaluate the passage of trains over the railway above a pipe-jacking group and obtained response curves for variables, including the instantaneous vertical displacement of the subgrade and additional dynamic pipe-jacking stress. Their analysis showed that when the pipeline depth was 12 m, the train speed was 100 km/h, and when the train speed was 200 km/h, the maximum vertical dynamic displacement of the two subgrades increased by 1.3 mm. The adjunctive stress/compressive dynamic stress of the pipe-jacking was approximately 0.14 MPa, and the influence of the pipe-jacking group on railway operation was within the allowable range. Yunfeng et al. (2022) showed that when the running speed of a train changes, the dynamic response of each part of the tunnel-reinforcement zone-formation system changes. The finite element method was used to analyze the influence of train speed on the acceleration, dynamic stress, and dynamic displacement of each part of a structure-formation system. Huinan (2022) established a finite element model of the overall track-tunnel-soil system and analyzed the vertical vibration variation of subway trains at 50, 80, and 120 km/h speeds, primarily from the perspectives of time and frequency domains.
Most research on railway tunnels has mainly focused on the influence of train vibration and train speed in deep-buried tunnels (Lipeng, 2013; Song et al., 2019b; Fan et al., 2020; Wang et al., 2022). There are relatively limited studies on the dynamic response of the soil and structure of shallow-buried rectangular pipe-jacking tunnels at oblique intersections. Most of these studies rely on numerical simulations. There are few data cases for field monitoring. Using the engineering case of the Xi’an Jingjiu Road, an underpass of the Longhai Railway line, for our study, we adopted the method of monitoring field test dynamic characteristics and running numerical simulations to predict the dynamic response law and safety of the soil and structures around the tunnel when trains passed at different speeds at oblique intersections during the postconstruction operation, thereby providing a technical reference to ensure the normal operation of the project.
2 Engineering background
The oblique shallow-buried pipe tunnel project of the Xi’an Jingjiu Road, an underpass of the Longhai Railway line, is located at the west side overpass of the Xi ‘an East Railway Station under the railway. Reinforced concrete, an overpass tunnel, a box-interchange structure, a rectangular pipe, and an oblique railway line were used in the project. Additionally, a pipe tunnel with an orthogonal width of 50.5 m and oblique width of 56.45 m was divided into nine sections (1#–9#) from south to north. The fifth prefabricated pipe section was 50.5 m × 10.30 m in size and 1.5 m long. The engineering construction site is geologically complex and rich in groundwater. The bottom part of the structure was located in the saturated soft loess with poor geology (Figures 1, 2). This project had a large section, long top, and soft foundation, and it faced considerable construction challenges.
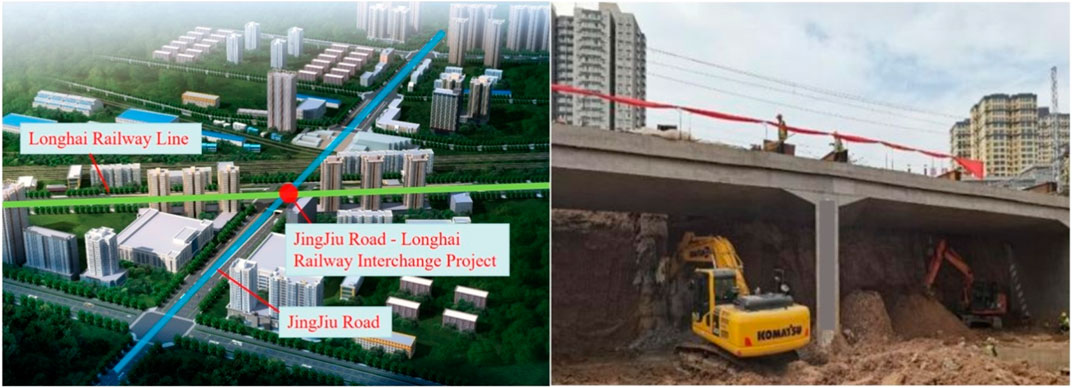
FIGURE 1. Schematic and photograph of the oblique interchange of the Xi’an Jingjiu Lu-Longhai railway project.
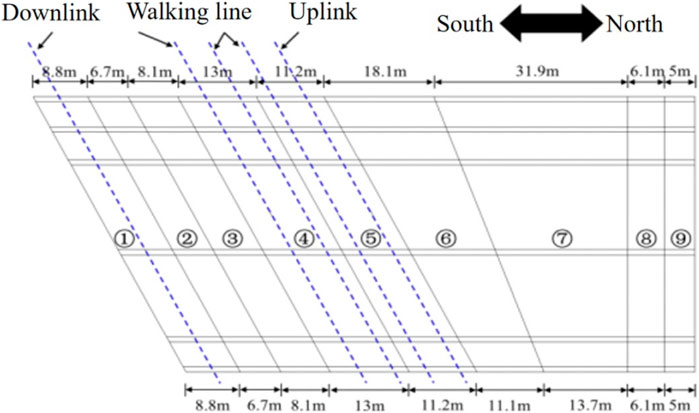
FIGURE 2. Plan of the 26.5° oblique interchange of the Xi’an Jingjiu Lu-Longhai Railway.
Based on the actual engineering geological data, the model was divided into six horizontal strata from top to bottom. These included mixed-fill soil, plain-fill soil, ①-loess, ②-loess, paleosol, and ③-loess. The physical and mechanical parameters of each soil layer are listed in Table 1.
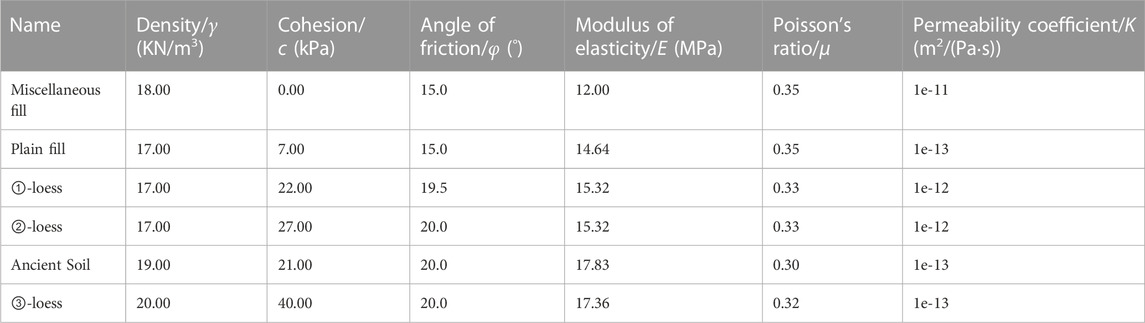
TABLE 1. Physical and mechanical parameters for each layer of the soil.
3 Dynamic response of the pipe-jacking tunnel when trains run at low speeds
3.1 Layout of monitoring points
Following the safety regulations issued by the Railway Corporation and China’s Railway Xi’an Bureau Group Co., Ltd. (Tieyun No. 146, 2006), trains pass through construction sections at low speeds to ensure the safety of ascending trains during the construction of a pipe-jacking tunnel. To ensure the normal operation of the upper traffic during pipe jacking construction, the construction project department has stipulated the train speed range to be 30–60 km/h. To study the dynamic response changes of the soil mass around the pipe-jacking tunnel and structure when trains pass through, a train operation site-monitoring scheme was developed based on the actual engineering situation. Seven monitoring sections (JC1–JC7) were set along the train running line, and six measurement points were arranged on the lower side of the steel pillow to monitor the dynamic acceleration and strain of the steel pillow. Figure 3 shows the arrangement of the monitoring points. Point 1 was located in the middle of the rail pillow between the two transverse beams near the lower side of another track, point 2 in the middle of the rail pillow between the two transverse beams, point 3 in the middle of the rail pillow away from the lower side of another track, and point 4 on the side of the rail pillow near the lower side of the other track. Point 5 was located at the lower side of the middle position of the rail pillow on the side of the transverse beam. Point 6 was located at the lower side of the rail pillow on the side of the transverse beam away from the other track (see Figure 4 for onsite monitoring). A vertical acceleration sensor was arranged at each monitoring point. Relevant research showed that the dynamic load of the train is transferred along the structure of the track, sleeper, roadbed, foundation, and tunnel, and it gradually attenuates layer by layer. At the same time, considering the actual project, it is assumed that the bottom of the train sleeper directly contacts the soil mass and that the monitoring equipment components simultaneously contact the soil mass during the field dynamic monitoring. Therefore, it is assumed that the dynamic response variation law of the sleeper at each test point is approximately equivalent to the deformation law of the soil mass around the pipe jacking tunnel.
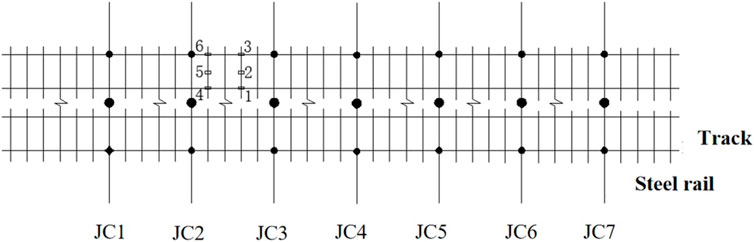
FIGURE 3. Schematic of the train-track monitoring point locations.
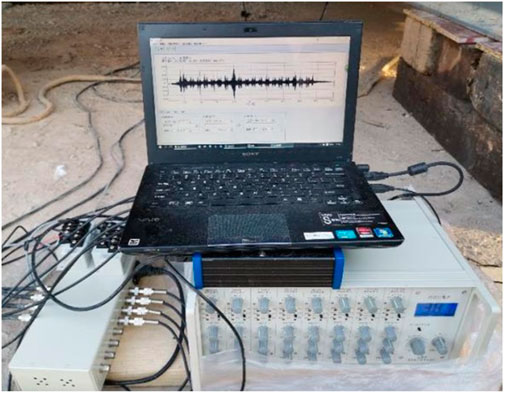
FIGURE 4. Field-measured data diagram of a passing train.
3.2 Analysis of field monitoring data
The peak vertical acceleration at each measurement point was monitored onsite when the train passed at a low speed of 45 km/h, and after the train had passed six times, the monitoring data were obtained. Figure 5 shows the vertical acceleration–time history curves for the six monitoring points when the train passed for the first time.
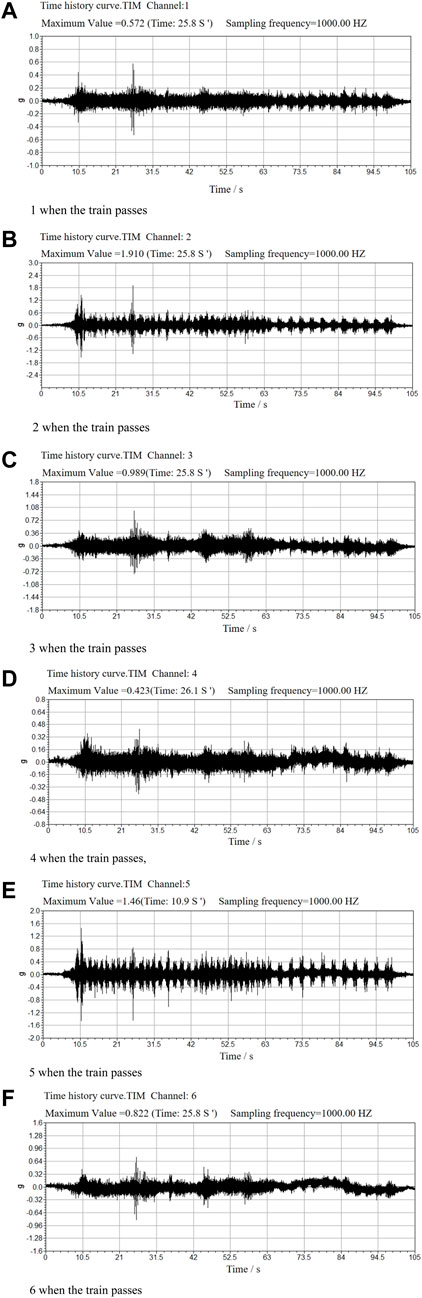
FIGURE 5. Acceleration–time history curves for all monitoring points. (A) 1 when the train passes, (B) 2 when the train passes, (C) 3 when the train passes, (D) 4 when the train passes, (E) 5 when the train passes, (F) 6 when the train passes.
Figure 6 shows the peak vertical acceleration of the six monitoring points located on the steel pillow when a train passed through it on six occasions at 45 km/h. The observations are as follows: (1) The acceleration–time history curves of each monitoring point fluctuated during the six passes; the peak acceleration values at monitoring points 2 and 5 were relatively large; across all monitoring points, the minimum acceleration was 0.423 m/s2; at 2.083 m/s2, the maximum acceleration was 4.9 times larger than the minimum. (2) Among the monitoring points on the same steel pillow, the vertical acceleration response of point 1 was slightly less than that of point 3, and the response of point 4 was slightly less than that of point 6. The acceleration at points 1 and 4 on the inside of the track is less than that at points 3 and 6 on the outside. The variation law of each monitoring point is assumed to be the soil deformation law. Additionally, we considered that the maximum acceleration of soil deformation was 2.083 m/s2 when the train passed at 45 km/h, indicating that the train influenced soil deformation.
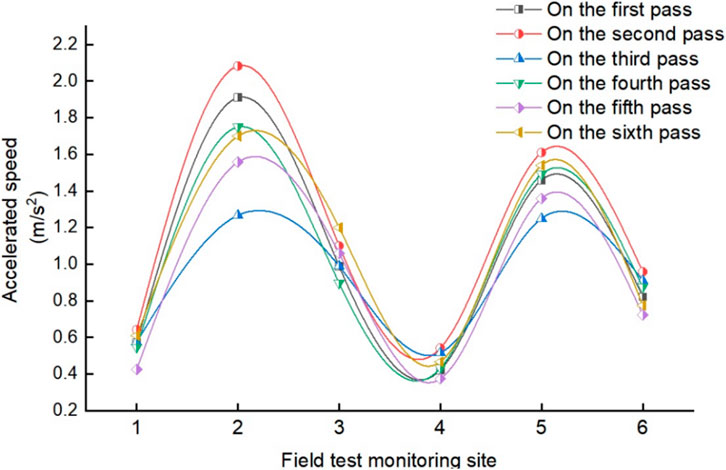
FIGURE 6. Variations in the peak vertical acceleration of soil deformation at all monitoring points.
4 Dynamic response of the pipe-jacking tunnel during operation
Based on the onsite monitoring of the shallow-buried pipe tunnel project of the Xi’an Jingjiu Road, we estimated the soil deformation law for the case of trains passing at low speeds. The intersection angle between the train track and the jacking pipe axis was 26.5°. To further predict the deformation law of the inclined shallow buried pipe tunnel under the condition of a train running at high speed, a dynamic response analysis was performed using the FLAC3D numerical modeling software. Because the train vibration response was classified as a microvibration, the amplitude of the dynamic response was significantly small. Therefore, a linear elastic finite element model can be used to study the influence of train vibration on buildings and soil mass. For rock and soil mass, the Mohr-Coulomb criterion was selected, and the isotropic elastic model was employed for concrete in pipe-jacking tunnels.
The purpose of this study is to reveal the soil and structural deformation law of the roof tunnel at oblique intersections. Based on an extensive literature review of related studies, we selected several physical quantities, such as the overall surface deformation, vertical deformation, structural stress deformation, and acceleration, to analyze and evaluate the dynamic response. Surface deformation refers to micro- and macro-deformation phenomena such as displacement, settlement, uplift, tilt, deflection, and crack of rock and soil mass (TACGHP 014, Technical Specification of Ground Deformation Monitoring for Geohazard, 2018; Huo et al., 2019). Among them, the overall surface and vertical deformations mainly involve displacement and settlement, which are used to represent the settlement deformation of soil when the train speed changes. The greater the deformation, the more evident the influence of the speed change. Structural stress is the internal force generated in pipe jacking when the pipe jacking structure is deformed while resisting the effect of external causes. The size of structural stress reflects the influence degree of the jacking structure under dynamic load. The greater the structural stress, the more evident the influence of dynamic load. Based on relevant regulations (TB 10002.3. Code for Design of Reinforced Concrete and Prestressed Concrete Structures of Railway Bridges and Culverts, 2005; GB 50010, Code for Design of Concrete Structures, 2010; GB 50868, 2013; Song et al., 2019a), when the train speed was <120 km/h, the height and horizontal displacement of the track, steel pillow, and beam had to be controlled within 8 mm. The tensile and compressive principal stresses of concrete structures following repeated train loads should be consistent with
4.1 Numerical model
To develop the numerical model, a pair of trains were set to run simultaneously at the same speed in opposite directions from the boundary of the model. The trains had an axle weight of 140 kN and a running speed of 45 km/h, the pipe was buried at a depth of 0.5 m below the ground, and the underground water level was recovered at the base of the structure under standard operating conditions of the dynamic model. In addition, dynamic calculation models of different train speeds were established (The operating conditions are shown in Table 2). In the numerical simulation, only the soil weight and train traffic load were considered, and the latter was equal to the simulation load. The influence of the ground overload, equipment load, and groundwater change was not considered in the simulation;, hence the surrounding rock parameters, tunnel structure parameters, and supporting parameters were unchanged.
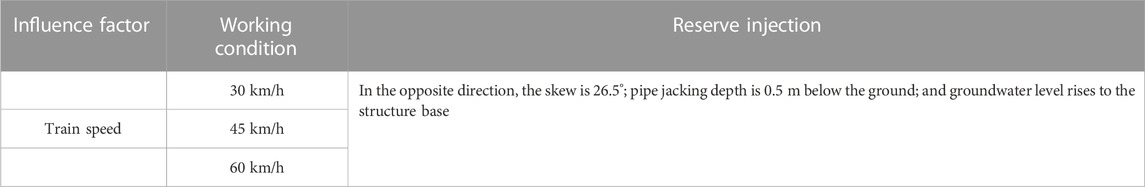
TABLE 2. Research conditions for train dynamic characteristics.
When FLAC3D was used to establish the soil mass and structural geometry model of the inclined shallow-buried and large-section pipe-jacking tunnel, based on Saint-Venant’s principle (Kai, 2019), owing to the asymmetry between the train lane and the pipe-jacking position, a three-dimensional full-section modeling was required. After many calculations, the results of an inversion analysis were considered. The length, width, and height of the model were determined to be 250, 150, and 30 m, respectively.
The normal displacements around and at the bottom of the model were constrained, and the free-boundary conditions were applied as static boundary conditions at the top of the model. The dynamic boundary conditions were free around the model and static on the top-lane surface. Combined with the three working conditions listed in Table 2, the division of model units of the standard model was dominated by 8-node hexahedrons and supplemented by 4-node tetrahedrons. The model was divided into 93,013 nodes and 145,652 units. The specific geometric model is shown in Figure 7.
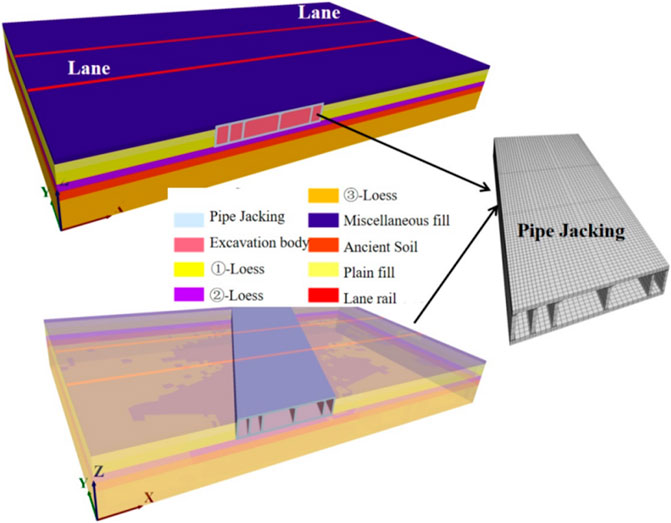
FIGURE 7. Standard model of the oblique shallow-buried pipe tunnel.
4.2 Train load simulations
For these simulations, the train speeds in the study area were provided by the Xi ‘an Railway Group Company; the uniform speeds were 30, 45, and 60 km/h. Referring to the relevant literature (BoLiang et al., 2006; Chang, 2017; Niu et al., 2020; Xiancong et al., 2022), this study adopted the track irregularity method by considering the train dynamic load to maintain vibrations at the top of the model for 5 s and expressing the train vibration load with a fitting function (Eq. 1) containing medium, low, and high-frequency excitation forces. Eq. 2 represents the modified wheelset force of the train on the line.
In Eq. 2,
At V = 30 km/h,
At V = 45 km/h,
At V = 60 km/h,
Based on the above equations, the extreme values of the vibration load at different speeds within 0–5 s were obtained (Table 3). Figure 8 shows the vertical vibration load
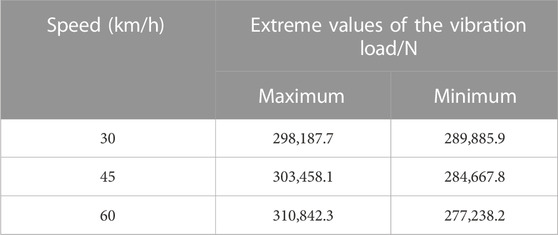
TABLE 3. Extreme values of the vibration load at different speeds.
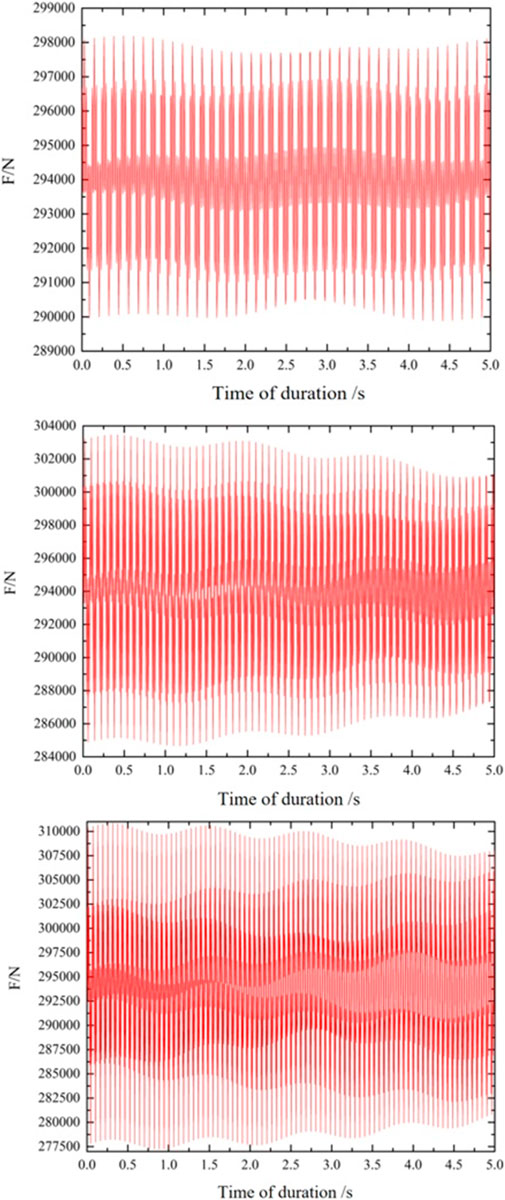
FIGURE 8. Vertical vibration load curves of trains as a function of the time interval at different speeds.
4.3 Analysis of the soil displacement response
Figures 9, 10 show the nephograms of the overall and surface vertical displacement of the pipe-jacking tunnel at different speeds. The vertical (downward) deformations of the surface of the model are 13.63, 13.81, and 13.87 mm at different train speeds (V = 30, 45, and 60 km/h, respectively) when the groundwater level rises to the structural basement. The surface deformation of the model gradually increases with train speed, reaching a maximum of 1.81%. Table 4 lists the overall peak vertical displacement of soil and the peak vertical displacement of the ground at different train speeds. The overall peak value of the vertical displacement when the train was running ranged from −12.00 to 0.674 mm, and that of the ground ranged from −11.90 to 0.67 mm. At higher train speeds, the maximum values of the overall and surface vertical displacements were unchanged, while the corresponding minimum values increased by 1.04% and 0.74%, respectively. Thus, train speed had minimal effect on soil deformation.
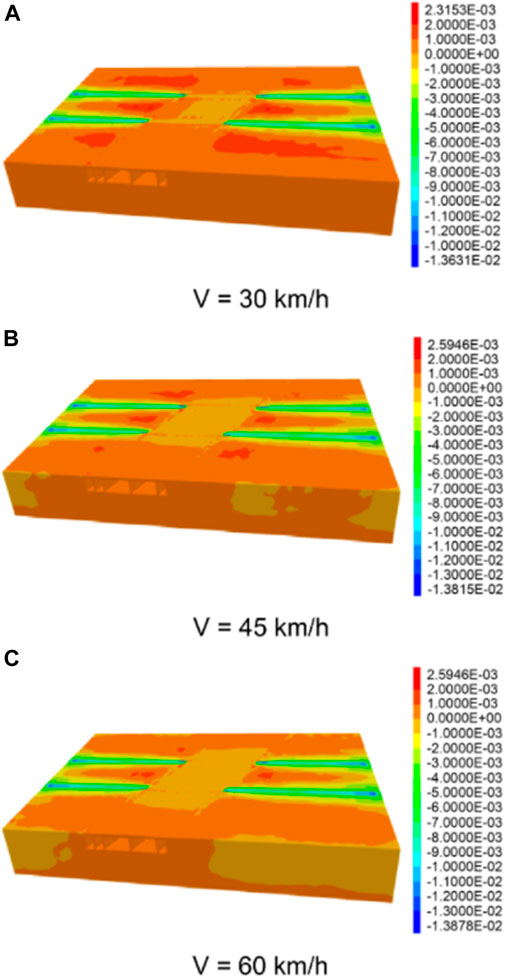
FIGURE 9. Model cloud map of the overall vertical deformation at different train speeds. (A) when V = 30 km/h; (B) when V = 45 km/h; (C) when V = 60 km/h.
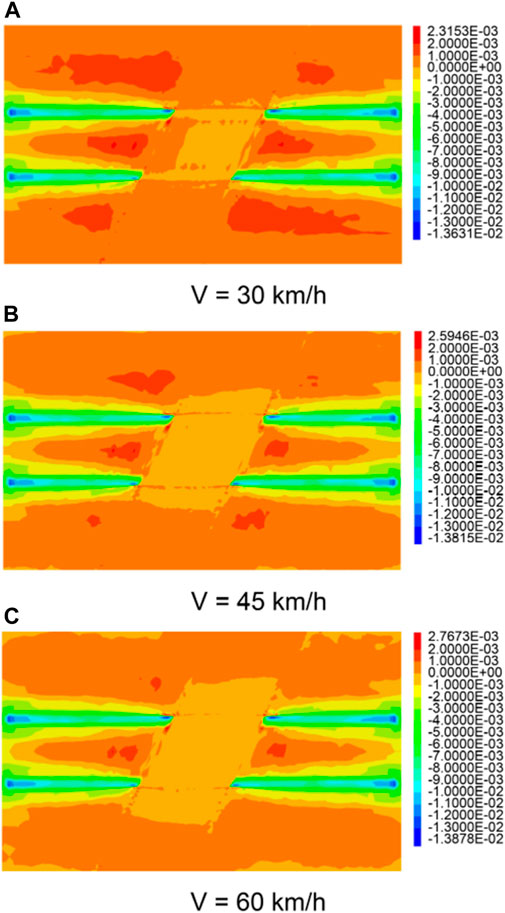
FIGURE 10. Model cloud map of the vertical surface deformation at different train speeds. (A) when V = 30 km/h; (B) when V = 45 km/h; (C) when V = 60 km/h.
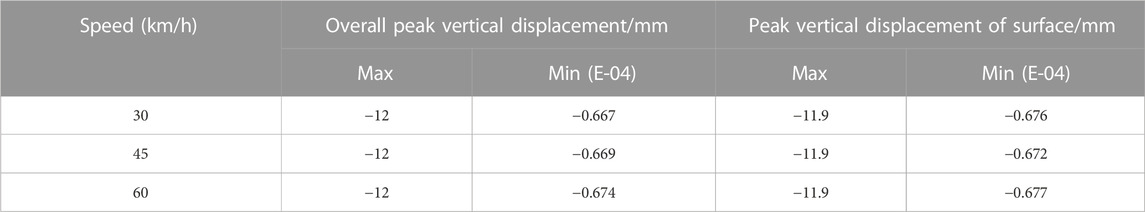
TABLE 4. Peak values of the vertical displacement of soil at different train speeds.
4.4 Stress response analysis of a pipe-jacking structure
Figures 11, 12 show the overall vertical deformation of the pipe-jacking tunnel structure at different train speeds and the vertical deformation cloud map of section y = 54.25 m. The figures show that as the train speed increased, the vertical deformation of the top-pipe structure fluctuated: -0.77, −0.78, and −0.78 mm, and the vertical deformation increased from −0.76 to −0.76 mm at a growth rate of 0.4%–0.54%.
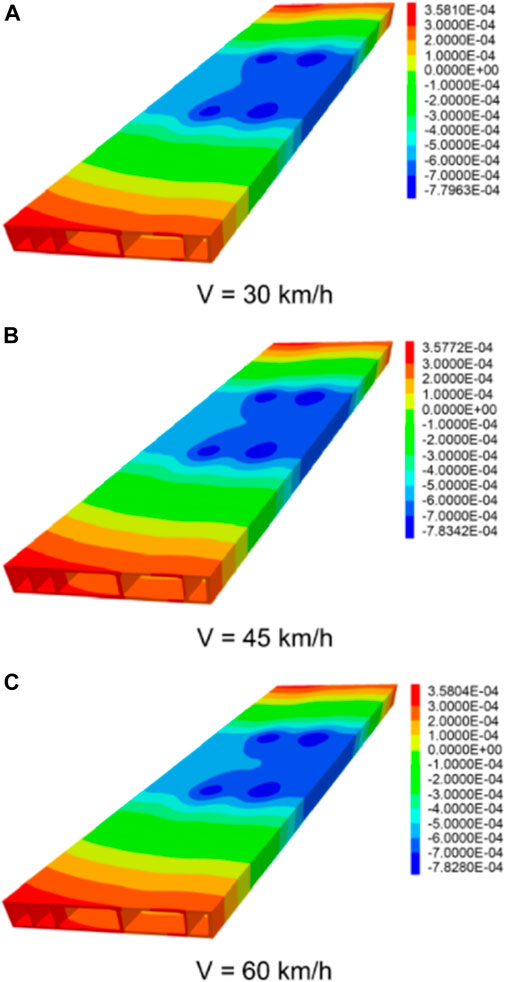
FIGURE 11. Nephogram showing the overall vertical deformation of the pipe-jacking tunnel structure at different train speeds. (A) when V = 30 km/h; (B) when V = 45 km/h; (C) when V = 60 km/h.
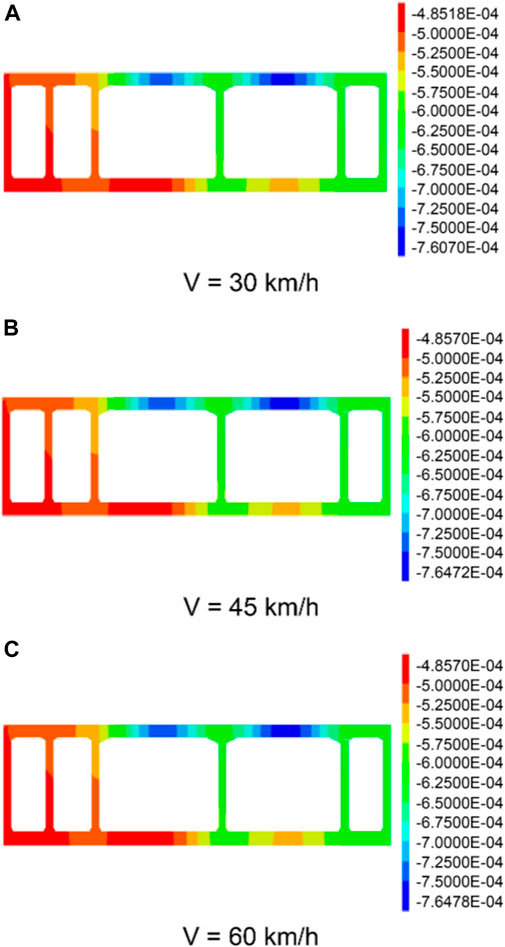
FIGURE 12. Cloud map showing the vertical deformation of the pipe-jacking section y = 54.25 m at different train speeds. (A) when V = 30 km/h; (B) when V = 45 km/h; (C) when V = 60 km/h.
Figure 13 shows the cloud map of stress distribution of the pipe-jacking section y = 54.25 m at different train speeds. The pipe-jacking stresses at the three train speeds manifest as tension and pressure principal stress, and they are concentrated primarily in the lower left and lower right corners of the left motor lane and the lower right corner of the right motor lane. The maximum tensile and compressive stresses were 1.06 and 2.18, 1.06 and −2.18, and 1.06 and −2.19 MPa at V = 30, 45, and 60 km/h, respectively. The maximum tensile and compressive stresses grew at a rate of 0.037% and 0.128%, respectively. Thus, train speed had minimal effect on the pipe-jacking stress and structure deformation.
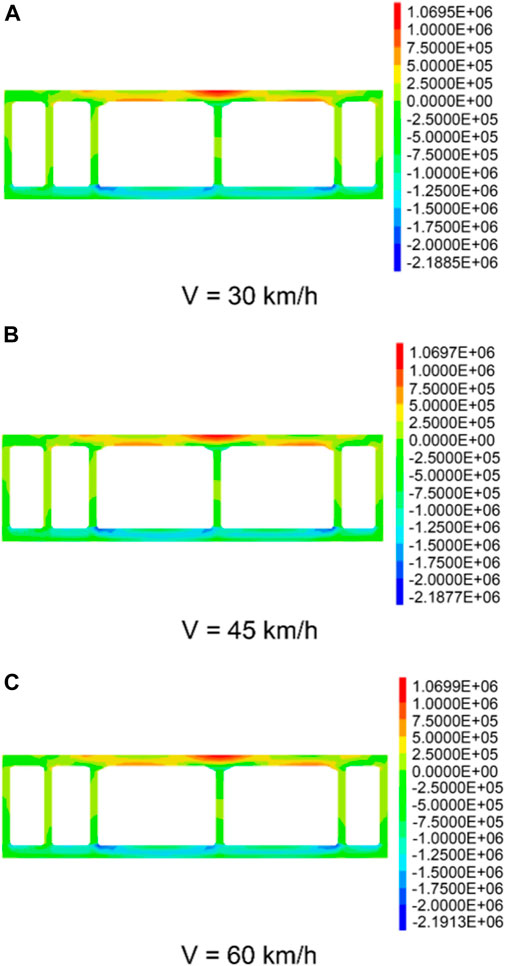
FIGURE 13. Stress (Pa) distribution cloud map of the pipe-jacking section y = 54.25 m at different train speeds. (A) when V = 30 km/h; (B) when V = 45 km/h; (C) when V = 60 km/h.
The deformation and stress of the pipe-jacking structure showed a minimal increase with train speed, indicating that the dynamic response of the pipe-jacking structure changes insignificantly in the range of 30–60 km/h.
5 Analysis of the influence law of train speed
To explore soil deformation under train speed variations, eight monitoring points (A–H) were set in the model to monitor the displacement and stress changes in soil mass and pipe jacking during train operations, as shown in Figure 14.
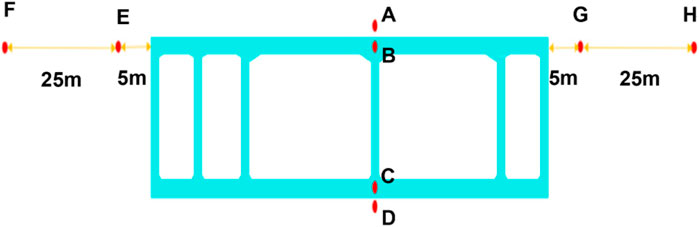
FIGURE 14. Schematic of monitoring sites.
5.1 Analysis of the influence law of train speed on the dynamic response of soil displacement
The peak deformations of soil and structure points above the pipe-jacking structure were recorded after applying train loads at different speeds. The results are summarized in Table 5.
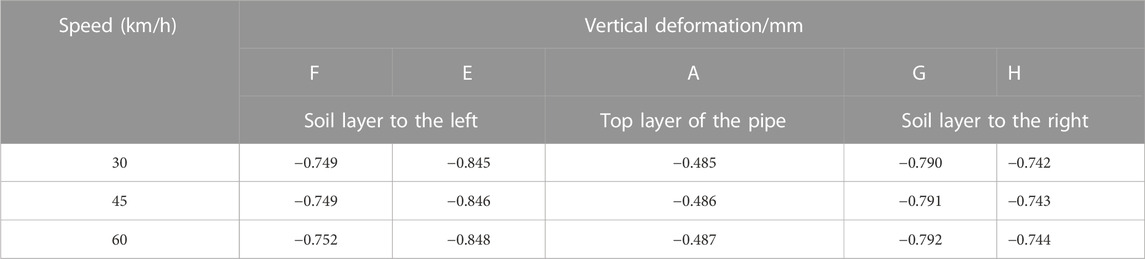
TABLE 5. Peak values of soil deformation above pipe jacking at different train speeds.
Figures 15, 16 show the vertical deformation of the soil and stress at monitoring point A, respectively, as a function of vibration time at different train speeds. Together with the study results presented in Table 5, we observe that the soil maintained a certain level of displacement settlement and stress, and the vertical deformation law is nearly identical at all three train speeds.
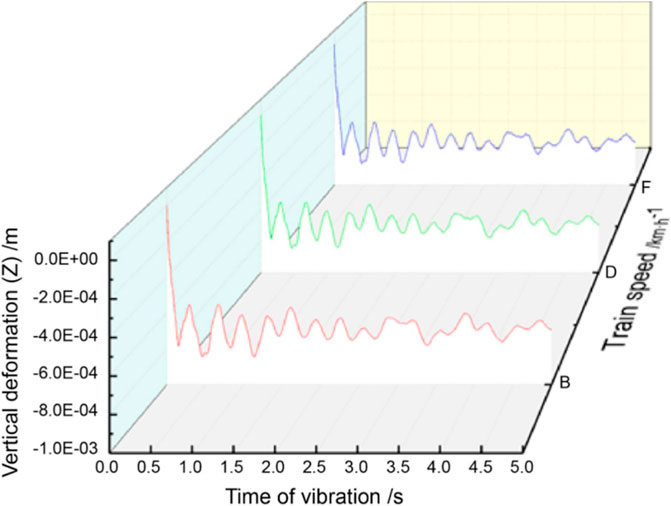
FIGURE 15. Vertical deformation law of soil in the top section of pipe jacking as a function of vibration time at different train speeds.
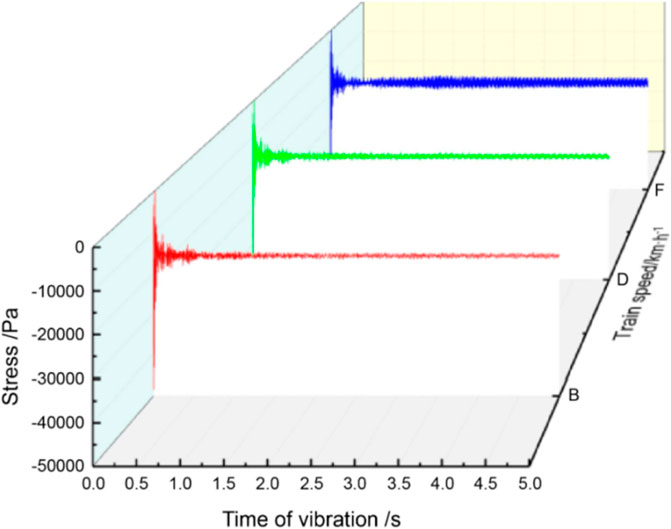
FIGURE 16. Stress at monitoring point A as a function of vibration time at different train speeds.
Figure 17 shows the variation law of each point at two monitoring sections: y = 54.75 and 95.25 m. The vertical displacement of soil at the axis of the top structure in the two monitoring sections is large. The vertical deformation gradually decreases on both sides and has a generally symmetrical distribution. Furthermore, from Table 5, the vertical deformation of the soil layer was the highest above the pipe-jacking axis at each point on the monitoring section, with a change rate of 0.41%. For example, at a train speed of 60 km/h, the peak vertical deformations were 7.92 and 7.44 mm at monitoring points G and H, respectively, and 8.48 and 7.52 mm at points E and F, respectively. Moreover, when the train speed was constant, the distance from the pipe-jacking structure increased. When the train moved horizontally, the vertical displacement of each monitoring point gradually decreased, indicating that the vibration wave generated by the slow-moving train attenuated during horizontal propagation. As the distance from the vibration source increased from 5 to 20 m, the peak values of the soil displacement and deformation decreased, and the maximum attenuation rate reached 93.9% within a distance of 20 m. Comprehensive analysis showed that soil deformation is marginally affected by train speeds in the range of 30–60 km/h.
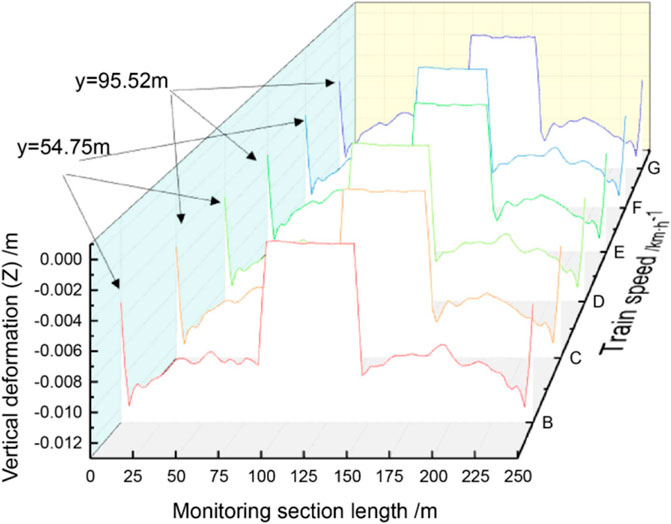
FIGURE 17. Vertical deformation curves at the top of the model.
5.2 Analysis of the influence law of train speed on the dynamic response of pipe jacking
Figure 18 shows the stress on the middle line of the upper part of the pipe-jacking structure (monitoring point B) and its variations as a function of the distance of the pipe-jacking structure. The stress of the entire model increases in tandem at the three train speeds. Thus, the stress at monitoring point B is minimally affected by changes in train speed.
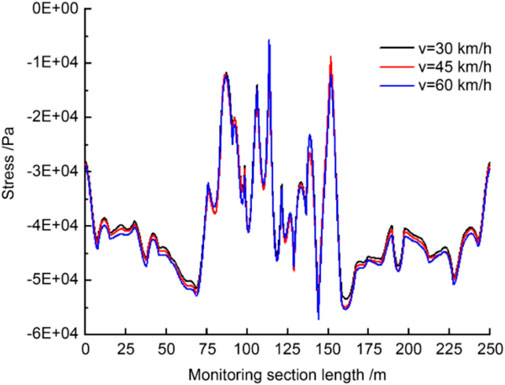
FIGURE 18. Stress variation law of model monitoring point B at different train speeds.
Figure 19 shows the stress at monitoring point B at different train speeds. The soil stress above the pipe-jacking structure fluctuates due to the vibrations induced by the moving train, the fluctuations being stronger at higher train speeds. The results of the analysis are as follows: (1) the changes in train speed have little effect on the stress–time history curve of the pipe-jacking structure, and (2) the peak stress increases with train speed; however, the increase is small.
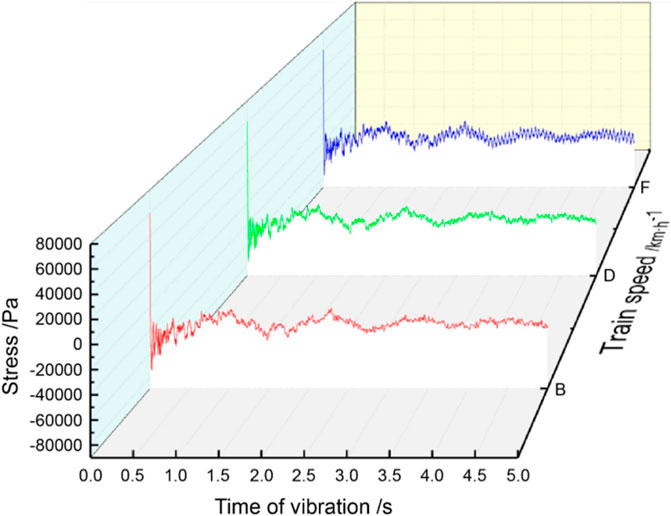
FIGURE 19. Stress at monitoring point B as a function of vibration time at different train speeds.
5.3 Numerical simulations of train long-term action and verification analysis of allowable values
5.3.1 Comparative analysis of the soil displacement response
As discussed in Section 3.2, the variation law of each monitoring point is approximately equivalent to the soil deformation law around the pipe-jacking tunnel, and the maximum soil deformation acceleration is 2.08 m/s2 when the speed of the train is 45 km/h.
Based on the numerical simulation results discussed in Section 5.1, the vertical deformation law of soil mass at the top of the pipe-jacking structure was obtained as a function of vibration time at different train speeds (Figure 16). We observed that the deformation of the soil mass varied with train speed. The acceleration curve of soil deformation at different train speeds was obtained using the quadratic derivation of the displacement change (Figure 20). The average value of vertical acceleration during 45 km/h operation was calculated to be 1.92 m/s2, which is close to the measured value of 2.083 m/s2 with a deviation of 8.49%. This confirms the effectiveness of numerical simulations and field-measured data analyses. Furthermore, the peak acceleration of the building was <10.2 m/s2, indicating that the soil deformation was within the allowable range (TB 10002.3. Code for Design of Reinforced Concrete and Prestressed Concrete Structures of Railway Bridges and Culverts, 2005).
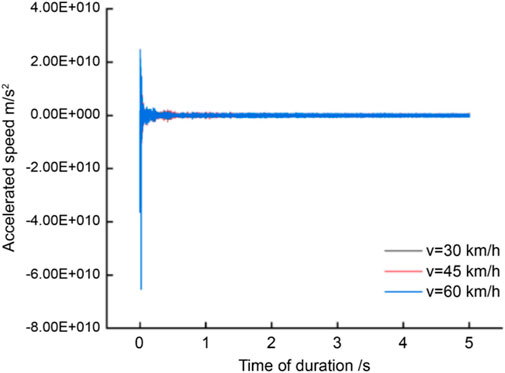
FIGURE 20. Temporal variations in the vertical acceleration of soil deformation at different speeds.
5.3.2 Comparative analysis of the structural response of the pipe-jacking tunnel
The pipe-jacking tunnel in Jingjiu Road underrunning the Longhai Railway line has a concrete strength of C50 and an impermeability grade of P8. As discussed in Section 4, the limiting values of tensile and compressive stresses of the pipe-jacking tunnel structure at repeated train loads were 2.17 and 18.425 MPa, respectively. In the analysis of the influence of train speed on dynamic response, the maximum tensile and compressive stresses of the pipe-jacking structure were 1.0699 and 2.1913 MPa, respectively, at 60 km/h speed. For train speeds in the range of 30–60 km/h, the structural stress of the pipe-jacking tunnel was within the design requirements, and the structure was in a safe-stress state.
6 Conclusion and discussion
In this study, we monitored the dynamic characteristics of a shallow-buried pipe tunnel at the Longhai Railway line through the Ninth Road in Xi ‘an, China, and performed numerical simulations of the field tests. The dynamic response of the soil and structure around the pipe-jacking tunnel were studied with trains passing at an oblique intersection of 26.5° through the top of the tunnel at different speeds. The study results are as follows.
(1) At different train speeds (30, 45, and 60 km/h), vertical deformation was observed in the soil above the tunnel. Deformation was larger at higher speeds; however, the increase was only 1.04% (less than 10%), indicating that train speed had minimal effect on soil deformation.
(2) For train speeds in the range of 30–60 km/h, the maximum deformation rate of the soil layer above the pipe-jacking axis was 0.41%, and the vertical displacement of soil gradually decreased along the horizontal direction away from the pipe-jacking structure. The maximum attenuation rate was 93.9% within a 20-m distance. The peak acceleration was less than the standard limit value, and soil deformation was within the allowable range.
(3) As the train speed increased from 30 to 60 km/h, the maximum tensile and compressive stresses increased at rates of 0.037% and 0.128%, respectively. The tensile stress was less than the limiting stress of the pipe-jacking structure, and therefore, the structure was in a safe-stress state. Furthermore, speed variations had a negligible effect on the stress of the pipe-jacking structure.
Data availability statement
The data supporting the findings of this study are available from the corresponding author upon request.
Author contributions
Conceptualization, G-JC; data curation, G-JC; formal analysis, G-JC; writing—original draft, J-SX; funding acquisition, Y-HS; project administration, XT; writing—review and editing, CM; supervision, XT; validation, CM. All authors contributed to the article and approved the submitted version.
Funding
The present work is subsidized and supported by the Science and Technology Innovation Team of Shaanxi Innovation Capability Support Plan (No. 2020TD005), the Science and Technology Development Program of Shaanxi Provincial Department of Housing and urban-rural construction (No. 2019-K39), and the Shaanxi Province Hanjiang-to weihe river valley water diversion Joint Fund (2021JLM-52). The authors gratefully acknowledge the financial support.
Acknowledgments
We would like to acknowledge Editage (https://www.editage.com/) for English language editing. The authors gratefully acknowledge the financial support.
Conflict of interest
Authors J-SX, YS, and CM were employed by China Railway 20th Bureau Group Corporation Limited, China Railway 20th Bureau Group First Engineering Co., Ltd., Hanjiang-to-Weihe River Valley Water Diversion Project Construction Co., Ltd.
The remaining authors declare that the research was conducted in the absence of any commercial or financial relationships that could be construed as a potential conflict of interest.
Publisher’s note
All claims expressed in this article are solely those of the authors and do not necessarily represent those of their affiliated organizations, or those of the publisher, the editors and the reviewers. Any product that may be evaluated in this article, or claim that may be made by its manufacturer, is not guaranteed or endorsed by the publisher.
References
Bao, D. L., Guangdi, W., Bo, G., and Bo, Z. (2011). Analysis of ground displacement response caused by high-speed train vibration. J. Railw. Constr. 4, 98–100.
CED (2013). Allowable vibration standard for construction engineering. Beijing: China Planning Press.
Chang, Y. (2017). Study on the influence law of freight train vibration on tunnel basement surrounding rock. Beijing: Beijing Jiaotong University.
Degrande, G., Clouteau, D., Othman, R., Arnst, M., Chebli, H., Klein, R., et al. (2006). A numerical model for ground-borne vibrations from underground railway traffic based on a periodic finite element-boundary element formulation. J. Sound. Vib. 293, 645–666. doi:10.1016/j.jsv.2005.12.023
Dewu, L., and Feng, G. (1997). Field test and analysis of train vibration in Jinjiayan tunnel. Lanzhou: Lanzhou Railway University, 7–11.
Fan, S., Song, Z., Zhang, Y., and Liu, N. (2020). Case study of the effect of rainfall infiltration on a tunnel underlying the roadbed slope with weak inter-layer. KSCE J. Civ. Eng. 24, 1607–1619. doi:10.1007/s12205-020-1165-0
Geohazard (2018). Technical specification of ground deformation monitoring for geohazard. Beijing: China Building Industry Press.
Huinan, L. (2022). Study on soil stability during shield excavation and operation of tunnel in rich water stratum. Jiangxi: East China Jiaotong University.
Huo, R., Zhou, P., Song, Z., Wang, J., Li, S., and Zhang, Y. (2019). Study on the settlement of large-span metro station’s baseplate caused by the tunnels newly built beneath it. Adv. Mech. Eng. 11 (2), 168781401882516–13. doi:10.1177/1687814018825161
Kai, L. (2019). Study on dynamic response of tunnel structure at early age under dynamic load of overhead railway. Sichuan: Southwest Jiaotong University.
Lei, Z. (2019). Rapid rail subway train load under the action of long-term settlement of soft soil foundation research. Tianjin: Tianjin University. doi:10.27356/d.cnki.gtjdu.2019.004752
Li, H., Yang, G., Song, Z., Niu, Z., and Hao, K. (2019). Research on calculation method of soil layer deformation caused by rectangular pipe jacking. Chin. J. Undergr. Space Eng. 15 (05), 1482–1489.
Liang, B., Luo, H., and Sun, C. X. (2006). Simulation study on vibration load of high-speed railway. J. China Railw. Soc. 28, 89–94.
Lipeng, K. (2013). Study on dynamic response characteristics and influence zone of cross tunnel under high-speed train load. Changsha: Central South University.
Liu, N., Li, N., Wang, S., Li, G., and Song, Z. (2023). A fully coupled thermo-hydro-mechanical model for fractured rock masses in cold regions. J. Cold Regions Sci. Technol. 205, 103707. doi:10.1016/j.coldregions.2022.103707
Liu, N., Li, N., Xu, C., Song, Z., and Yang, M. (2020). Mechanism of secondary lining cracking and its simulation for the dugongling tunnel. J. Rock Mech. Rock Eng. 53 (10), 4539–4558. doi:10.1007/s00603-020-02183-3
Lun, G., Yu, Z., and Wenge, Q. (2008). Three-dimensional numerical analysis of vibration of underpass tunnel caused by train dynamic load. J. Tunn. Technol. 4, 23–27.
Niu, Z., Cheng, Y., Zhang, Y., Song, Z., Yang, G., and Li, H. (2020). A new method for predicting ground settlement induced by pipe jacking construction. Math. Probl. Eng. 2020 (2), 1–11. doi:10.1155/2020/1681347
Railway Bridges and Culverts (2005). Code for design of reinforced concrete and prestressed concrete structures of railway Bridges and Culverts. Beijing: China: Railway Publishing House.
Song, Z., Cheng, Y., Yang, T., Huo, R., Wang, J., and Liu, X. (2019a). Experimental study on the effect of osmotic pressure on pore structure evolution of limestone. Rock Soil Mech 40, 4607. doi:10.16285/j.rsm.2018.1831
Song, Z., Tian, X., and Zhang, Y. (2019b). A new modified Peck formula for predicting the surface settlement based on stochastic medium theory. Adv. Civ. Eng. 2019, 1, 14. doi:10.1155/2019/7328190
The Constructor (2010). Code for design of concrete structures. Beijing: China Architecture and Building Press.
Wang, D., Luo, J., Wang, G., Li, F., and Su, J. (2022a). Dynamic response of the tunnel bottom structure considering groundwater influence under heavy-haul train loading. Structures 46, 1469–1479. doi:10.1016/j.istruc.2022.11.020
Wang, J., Zhou, P., Song, Z., Li, S., and Zhang, Q. (2022b). A new calculation method for tunneling-caused stratum settlement. KSCE J. Civ. Eng. 26 (6), 2624–2640. doi:10.1007/s12205-022-1258-z
Wenhua, Z., Baoning, H., and Yi, X. (2007). Test and analysis of pavement subgrade vibration of low embankment expressway under traffic load. J. Highw. Eng. 125, 113–117.
Xiancong, M., Xiedong, Z., Lin, W., Haojie, Z., and Zhifeng, L. (2022). Dynamic response analysis of sleeper and lining of double tunnel under the action of train. J. Tunn. Technol. 59, 99–106. doi:10.13807/j.cnki.mtt.2022.03.012
Xiangqiu, W., Linde, Y., and Wenhua, G. (2005). Vibration test and load simulation of high-speed train in railway tunnel. J. Vib. Shock. 03 (99–102). doi:10.13465/j.cnki.jvs.2005.03.029
Yufang, C. (2013). Study on the influence of tunnel underpass construction and train vibration on settlement of high railway foundationStudy on influence law of tunnel tunneling and train vibration on settlement of high railway foundation. Chengdu, China: Southwest Jiaotong University.
Yunfeng, W., Yang, C., and Yurui, L. (2022). Influence of subway train speed on vibration characteristics of stratum with reinforcement. J. Technol. Eng. 22, 9770–9796.
Zhou, P., Wang, J., Song, Z., Cao, Z., and Pei, Z. (2022). Construction method optimization for transfer section between cross passage and main tunnel of metro station. Front. Earth Sci. 10, 770888. doi:10.3389/feart.2022.770888
Keywords: train load, large section, oblique shallow buried, pipe jacking tunnel, dynamic response
Citation: Cui G-J, Xie J-S, Sun Y-h, Tian X-x and Meng C (2023) Dynamic response of large-section inclined shallow-buried pipe tunnel under train loads. Front. Earth Sci. 11:1227753. doi: 10.3389/feart.2023.1227753
Received: 23 May 2023; Accepted: 26 June 2023;
Published: 13 July 2023.
Edited by:
Liang Cui, Lakehead University, CanadaReviewed by:
Shuangfeng Guo, Nanjing Tech University, ChinaKun Fang, China University of Geosciences Wuhan, China
Copyright © 2023 Cui, Xie, Sun, Tian and Meng. This is an open-access article distributed under the terms of the Creative Commons Attribution License (CC BY). The use, distribution or reproduction in other forums is permitted, provided the original author(s) and the copyright owner(s) are credited and that the original publication in this journal is cited, in accordance with accepted academic practice. No use, distribution or reproduction is permitted which does not comply with these terms.
*Correspondence: Guo-Jing Cui, MTEyMzE0OTEwQHFxLmNvbQ==