 Qian Liu
- 1Key Laboratory of Marine Ecosystem Dynamics, Second Institute of Oceanography, Ministry of Natural Resources, Hangzhou, China
- 2State Key Laboratory of Satellite Ocean Environment Dynamics, Second Institute of Oceanography, Ministry of Natural Resources, Hangzhou, China
- 3Ocean College, Zhejiang University, Hangzhou, China
We used molecular biomarkers (brassicasterol, dinosterol and C37 alkenones) measured from the surface sediments of the Bering Sea, the Chukchi Sea and the western Arctic Ocean in years of 1999 and 2010 to represent the groups of phytoplankton (diatoms, dinoflagellates and coccolithophores) and reconstruct the phytoplankton composition structure and biomass. The distribution of concentrations of three biomarkers were compatible to previous studies on measured phytoplankton, which showed that the phytoplankton biomass was most abundant in the Chukchi Sea, followed by the Bering Sea and the western Arctic Ocean, and diatoms were the dominant group. It suggests that molecular biomarkers are the suitable indicators of phytoplankton composition, structure and abundance. A record of biomarkers in a sediment core (NB01) collected at the Bering Sea in 2010 presented that the biomass of three phytoplankton groups increased in past 107 years, and their variation patterns were consistent. The synchronous increase of concentrations of phytoplankton biomarkers and cholesterol, a proxy of zooplankton biomass, implied that the primary production increased intensely in the last hundreds of years, corresponding to the trend of sea-ice melting as a result of global warming. Moreover, our results suggested that the combined effect of the anormal interannual changes of the El Niño-Southern Oscillation (ENSO) and the Arctic Oscillations (AO) played a key role in regulating the interannual and decadal variations of phytoplankton biomass and community composition, giving us an insight into the impact of atmospheric circulation on phytoplankton production and carbon flux in the Arctic seas.
1 Introduction
The El Niño-Southern Oscillation (ENSO), with El Niño and La Niña as the warm and cool phases, respectively, is the strongest signal of the interannual climate variability of the tropical Pacific air-sea system (Trenberth, 1997; L’Heureux and Thompson, 2006; Nagura and Konda, 2007), altering the global atmospheric circulation patterns and weather regimes through atmospheric teleconnections (Budikova, 2009). The ENSO affects higher latitudes with several mechanisms, such as Rossby waves, shifts in the Walker circulation, jet stream changes, anomalous atmospheric circulation, heat fluxes and altered transient eddy activity (Yuan et al., 2018). It also influences sea ice in the Arctic with the linkage to several patterns of the atmospheric variability in the Northern Hemisphere (e.g., sea level pressure, SLP; Clancy et al., 2021). In general, the ENSO events induce abnormalities in sea surface temperature (SST), salinity and oxygen contents in the higher latitude by the process of the atmospheric remote response (Zhang et al., 2017; José et al., 2019; Zhi et al., 2020). These would change community structure and distribution of marine organisms by affecting their physiological activities and nutrient sources, and eventually lead to the changes in biological pump efficiency (Huang et al., 2011).
The Arctic Oscillation (AO) is an atmospheric circulation pattern over the mid-to-high latitudes in the Northern Hemisphere with a distinct periodical signal at seasonal scale (Thompson and Wallace, 2000). The positive phase is characterized by a higher SLP over the mid-latitude and the jet stream steers storms northward, while the negative phase has a higher SLP over the Arctic regions and the jet stream shifts toward the equator (Thompson and Wallace, 2000). The positive/negative anomalies of the AO significantly impact the extropical climate variability in the Northern Hemisphere (Thompson and Wallace, 2000; Chen et al., 2013). A large number of observations and model simulations have shown that variabilities of Arctic sea ice and atmospheric changes are influenced strongly by single activity (either ENSO via teleconnections or AO) or the interaction between the ENSO and the AO (Mysak et al., 1996; Rigor et al., 2002; Liu et al., 2004; Fan et al., 2012; Li et al., 2014; L’Heureux et al., 2017; Clancy et al., 2021); however, there have been few works investigating the synergistic effects of coupled ENSO-AO activities on the Arctic marine ecosystem.
Several studies have indicated that the Arctic climate system, which is one of the most sensitive systems in the world, has been experiencing more changes than have other regions in the context of global warming (Overland et al., 2019; Yamanouchi and Takata, 2020). Marine phytoplankton dynamics is sensitive to the climate change, and the rapid alteration of phytoplankton biomass and community structure reflects fast changes of the climate (Henson et al., 2021). Chlorophyll α (Chl α) of the Arctic Ocean increased significantly between 1998 and 2018 due to an expanded area of open water and nutrient input (Lewis et al., 2020). Phytoplankton biomass generally couples with primary productivity in the upper layer of the water column in the Arctic (Pabi et al., 2008; Lewis et al., 2020). Correspondingly, the annual phytoplankton net primary production (NPP) has significantly risen in response to increased biomass. Moreover, marine phytoplankton community structure, the base of the marine ecosystem, is important in controlling the efficiency of the carbon export (Boyd and Newton, 1995, Boyd and Newton, 1999). The climate change has significantly shifted the phytoplankton community composition globally. At the polar edges, an increase in species richness implies that expanding environmental niches leads to conditions favoring colonization of phytoplankton, which has been pushed from lower latitudes (Henson et al., 2021). The intrusion of the temperate group coccolithophores (e.g., Gephyrocapsa huxleyi) into the Arctic Ocean explains the decadal variation in water temperature due to the poleward intrusion of heat and nutrient through Atlantic and Pacific waters flow into the Arctic Ocean (Oziel et al., 2020).
The molecular biomarkers of phytoplankton, including brassicasterol, dinosterol and C37 alkenones, are major cell membrane contents of diatoms, dinoflagellates and coccolithophores, respectively, and have been used as the indices of phytoplankton groups for studying variations in their biomass and community structure (Withers, 1987; Schubert et al., 1998; Zhao et al., 2006; Bai et al., 2010; Ding et al., 2019). These biomarkers are relatively stable with slow degradation and a long geological record (Volkman, 1998; Volkman, 1986; Volkman, 2006; Brassell et al., 1986; Prahl and Wakeham, 1987). The summed amounts of brassicasterol, dinosterol and C37 alkenones can potentially reflect the primary production (Schubert et al., 1998; Seki et al., 2004). Since the sampling of marine phytoplankton is quite difficult owing to the uniqueness of the Arctic climate and location, less measured data are available for a long-term and wide-range survey on the biomass and the community structure of phytoplankton in the Arctic Ocean. The biomarker method has been successfully applied in the polar research (Schubert et al., 1996; Stein et al., 1999; Belicka et al., 2002; Bai et al., 2010; Yu et al., 2012; Zhao et al., 2014; Zhao et al., 2015). These biomarkers can be easily quantified, and used for reconstructing the primary productivity and evaluating the variation of biological community structure as a response to interannual and decadal climate changes (Barrett et al., 1995; Schubert, 1998; Seki et al., 2004; Hernandez et al., 2008; Li et al., 2012).
The study of the Chukchi Sea and the Bering Sea is particularly important to understand the role of the Pacific Ocean in global climate. The Chukchi Sea, located at the north of the Bering Sea, is the only channel for water transport from the Pacific Ocean into the Arctic Ocean (Zhao et al., 2003). It is an inverted triangular shelf and is connected with the East Siberian Sea to the west, Alaska to the east, the Pacific Ocean through the Bering Strait to the south, and the Chukchi slope to the north. The Canada Basin is beyond the Chukchi slope with a depth of more than 4,000 m (Overland and Roach, 1987). The Bering Sea, as one of the three highly-productive oceans in the world, is an important region for CO2 sinking (Sigler et al., 2010). The flow along the shelf-edge of the Bering Sea circulates counterclockwise, known as the Bering Sea Green Belt (Springer et al., 1996; Aranami et al., 2001). Markina and Khen (1990) pointed out that the volume of the phytoplankton trawl in this green belt was approximately 500–1,000 mg/m3, corresponding to 2–4 mg/m3 Chl α. The flow intensified at the western boundary of the Bering Sea, converging with the Anadyr Stream and subsequently flowing northward to the Arctic Ocean (Coachman et al., 1975). It becomes the primary source of nutrients to the Chukchi Sea and the western Arctic Ocean, significantly influencing the marine ecosystem of the western Arctic Ocean.
In this study, we identified and quantified concentrations of molecular biomarkers, including brassicasterol, dinosterol, C37 alkenones and cholesterol, as proxies of abundances of diatoms, dinoflagellates, coccolithophores and zooplankton, respectively, in samples collected from surface sediments in the years of 1999 and 2010 from the Bering Sea, the Chukchi Sea and the western Arctic Ocean, and a multicore collected in 2010 from the Bering Sea. Cholesterol is the major sterol in the zooplankton. Although cholesterol is also present in some algae (Zhang et al., 2019), it is well in line with the abundance of zooplankton in many studies (Higginson et al., 2004; Zhao et al., 2006; Wittenborn et al., 2020). We attempted to determine the relevance of interannual and decadal variability of the phytoplankton community to the ENSO and AO phases for further exploring their role and the combined effects of the warm (El Niño) and cold phases (La Niña) of the ENSO and the AO under the positive and negative phase conditions on regulating marine phytoplankton community structure in the Arctic Ocean. It would aid in understanding the synergistic effects of atmospheric oscillation and variations of the sea surface temperature on the Arctic ecosystem. The results of this study can be regarded as an indication of the ecological response to environmental changes in the Arctic Ocean in the context of global warming.
2 Materials and methods
2.1 Collection of surface sediment and multicore samples
Surface sediments (0–2 cm) were collected using a stainless-steel box sampler at 14 and 16 stations in the Bering Sea (57°38′-61°32′N, 175°33′-179°56′W), the Chukchi Sea and the western Arctic Ocean (67°0′-86°1′N, 152°5′-169°0′W) during the first Chinese Arctic Expedition in July and August 1999 (Figure 1A) and the fourth Chinese Arctic Expedition from July to September 2010 (Figure 1B), respectively. A sediment core (35 cm, sample ID#: NB01; 61°14′N, 175°4′W) was sampled with a multicore sampler in the Bering Sea in July 2010 (Figure 1B). The core was sealed tightly at two ends and stored at −20°C till analysis.
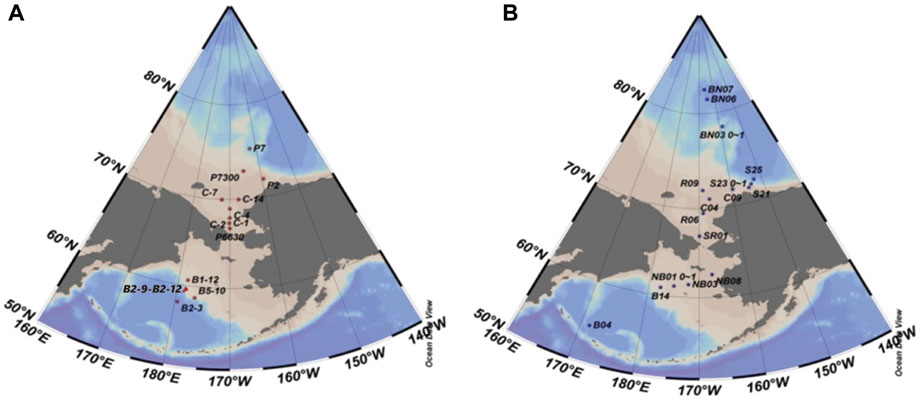
FIGURE 1. Locations of sampling stations in the Bering Sea, the Chukchi Sea and the western Arctic Ocean in 1999 (A) and 2010 (B).
2.2 Pretreatment and analysis of sediment samples
A suitable amount (5–10 g) of the sample was added with a solvent mixture of internal standards tetracosane-d50, n-19 alcohol (19-ol) and C46-GDGT, and extracted using an accelerated solvent extractor (ASE, Dionex ASE 350, Thermo Fisher) with two cycles. Subsequently, the extracted liquid was evaporated to a small volume and air-dried with N2. The dry extract was added with 6% KOH-methanol solution and ultra-sonicated for 10 min followed by an overnight drying at 25°C. On the second day, after ultrasonication for 10 min, the extract was added with 2 mL hexane and vortexed thoroughly, and then the supernatant was transferred into a glass bottle. This process was repeated four times. The combined extracts were blow-dried by N2 to a volume of 0.2 mL approximately and was fractionated by silica column (0.8 cm inside diameter, 5 mL). Apolar and polar fractions were separated by n-Hexane (10 mL) and dichloromethane: methanol (V: V=1:1), respectively. The apolar fractions were evaporated to a small amount and blow-dried with N2, and then used for measuring n-alkanes by gas chromatography (GC, Agilent 7890 GC system, United States) after adding quantitative isooctane. The polar fractions were mainly used for the analyses of sterols and alkenones. Before the GC analysis, 40 μL dichloromethane and 40 μL derivatization reagent, Bis (trimethyl)-trifluoroa-cetamide (BSTFA), were added to the polar extract, reacting for 1 h at 70°C. After air dry, we used GC with chromatography column (HP-1, column length 30 cm, inner diameter 0.32 mm, thickness of membrane 0.17 μm) for measuring sterols and alkenones: the sample inlet temperature was 300°C; the initial temperature was set at 80°C, which was maintained for 1 min and subsequently increased by 25°C min−1 up to 200°C, by 4°C min−1 up to 250°C, by 1.7°C min−1 up to 300°C, maintained for 8 min, and then increased by 5°C min−1 up to 310°C, maintained for 5 min. The biomarkers were identified by comparing their GC retention times with those of their standard reagents. The amounts of brassicasterol, dinosterol, C37 alkenones and cholesterol were quantified by comparing their peak areas with that of internal standard with known amounts. The biomarker concentrations were corrected to the amount of the extracted sediment.
2.3 Chronology and sedimentation rate
The sediment core was sampled every 1 cm. All samples were weighed (5–10 g), dried under 40°C and weighted again. The dried core samples were pulverized using an agate mortar and pestle. Five grams of each sample were taken into a beaker added with 209Po and then followed by digestion in concentrated HNO3 and HClO4, and acidified by 6 mol/L HCl sequentially. The samples were then repeatedly extracted in heated HCl (3 mol/L) and centrifuged. The suspension was taken in a clean container with the addition of ascorbic acid. Polonium was electroplated onto silver planchets overnight and then assayed for 210Pb by using a high-purity germanium detector (GWL-120-15N, EG and GORTEC, United States), a digital spectrometer, and a multichannel analysis system. The excess 210Pb (210Pbex) were measured by subtracting supported 210Pb (226Ra) from total 210Pb activity (210Pbtot). The 210Pb dating results and average sedimentation rate were calculated from the 210Pbex profile using a constant initial concentration (CIC) model (Appleby and Oldfield, 1978; Wang et al., 2016).
3 Results
3.1 Sedimentary record of interannual variability (1999 and 2010) of phytoplankton and zooplankton in the Arctic seas
The analyses of phytoplankton biomarkers in surface sediments collected at different stations of the study regions in 1999 showed that concentrations of brassicasterol, dinosterol and C37 alkenones ranged from 64.4 to 3,009 ng/g (mean ± S.D.: 1,514 ± 804.5 ng/g), 30.6–743.1 ng/g (454.9 ± 209.7 ng/g) and 22.6–52.3 ng/g (36.5 ± 9.98 ng/g), respectively (Figure 2A). Brassicasterol dominated at all stations (72.8% ± 10.1%), followed by dinosterol (26.3% ± 12.3%) and C37 alkenones (3.69% ± 4.92%; Table 1; Figure 2A). The total concentration of three biomarkers (the SUM) was significantly higher in the Chukchi Sea (2,584 ± 719.9 ng/g) than in the Bering Sea (1,611 ± 602.8 ng/g; Student’s t-test, p = 0.021), mostly caused by the larger amount of brassicasterol in the Chukchi Sea (2037 ± 718.6 ng/g; Student’s t-test, p = 0.014; Figure 2A). The concentrations of brassicasterol, dinosterol and C37 alkenones in samples collected in 2010 ranged from 25.0 to 1708 ng/g (730.5 ± 543.2 ng/g), 0–1105 ng/g (383.7 ± 315.7 ng/g) and 14.5–81.9 ng/g (37.6 ± 17.6 ng/g), respectively (Figure 3B). Similarly, brassicasterol was the major biomarker at most stations (58.4% ± 12.3%), followed by dinosterol (27.2% ± 15.8%) and C37 alkenones (13.2% ± 18.4%; Table 1; Figure 2B). The SUM was highest in the Chukchi Sea (1,564 ± 531.6 ng/g) and lowest in the western Arctic Ocean (77.8 ± 13.5 ng/g; one-way ANOVA, p = 0.021), predominantly caused by the discrepancy in the concentration of brassicasterol (one-way ANOVA, p = 0.029; Figure 3B). The concentration of cholesterol, an index of zooplankton biomass, was linearly related to the SUM in samples collected in 1999 (R2=0.69, p <0.0001, n = 16; Figure 2C) and in 2010 (R2=0.63, p <0.001, n = 14; Figure 2D). Considering all sampling stations, the concentrations of brassicasterol and the SUM were lower in 2010 than in 1999 (Student’s t-test, p <0.05; Figures 3A, D), while the concentrations of dinosterol and C37 alkenones were similar between two sampling years (p >0.05; Figures 3B, C). The variability of all biomarkers in the Chukchi Sea followed a similar trend to that in all regions, with larger pools of brassicasterol and the SUM in 1999 (Figures 3A, D).
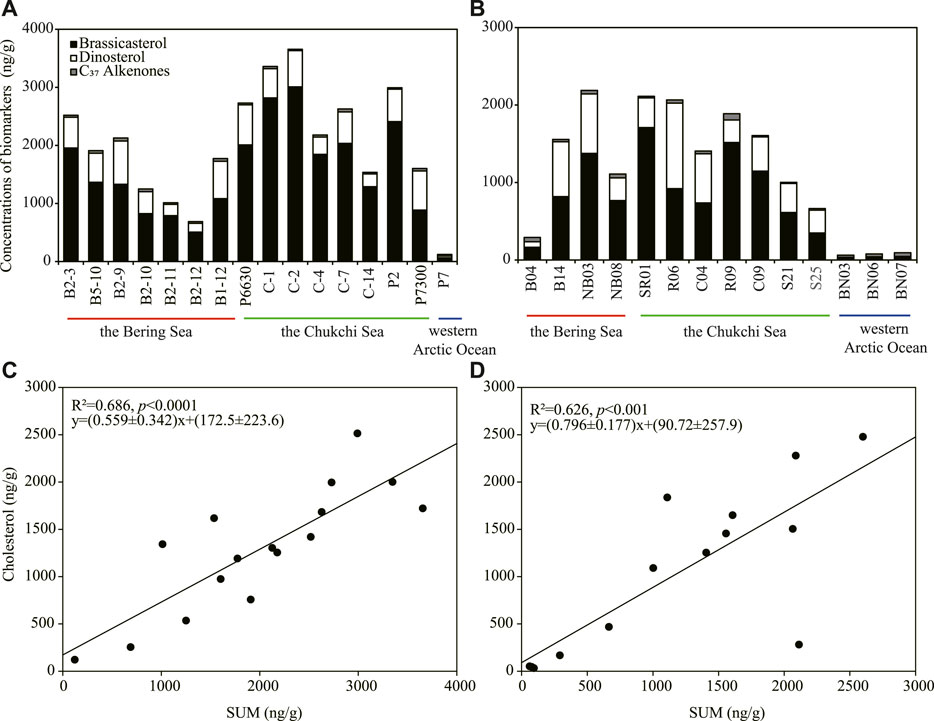
FIGURE 2. Concentrations (ng/g) of brassicasterol, dinosterol and C37 alkenones in surface sediment of the sampling stations and linear relationships between concentrations of cholesterol and the total phytoplankton biomarkers (SUM) in 1999 (A,C) and 2010 (B,D).
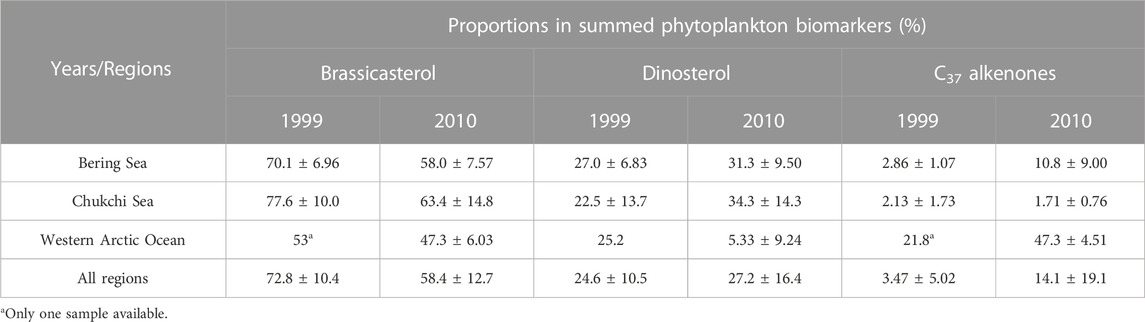
TABLE 1. Means and standard deviations of proportions of brassicasterol, dinosterol and C37 alkenones in summed concentrations of three molecular biomarkers in the Bering Sea, the Chukchi Sea and the western Arctic Ocean in years of 1999 and 2000.
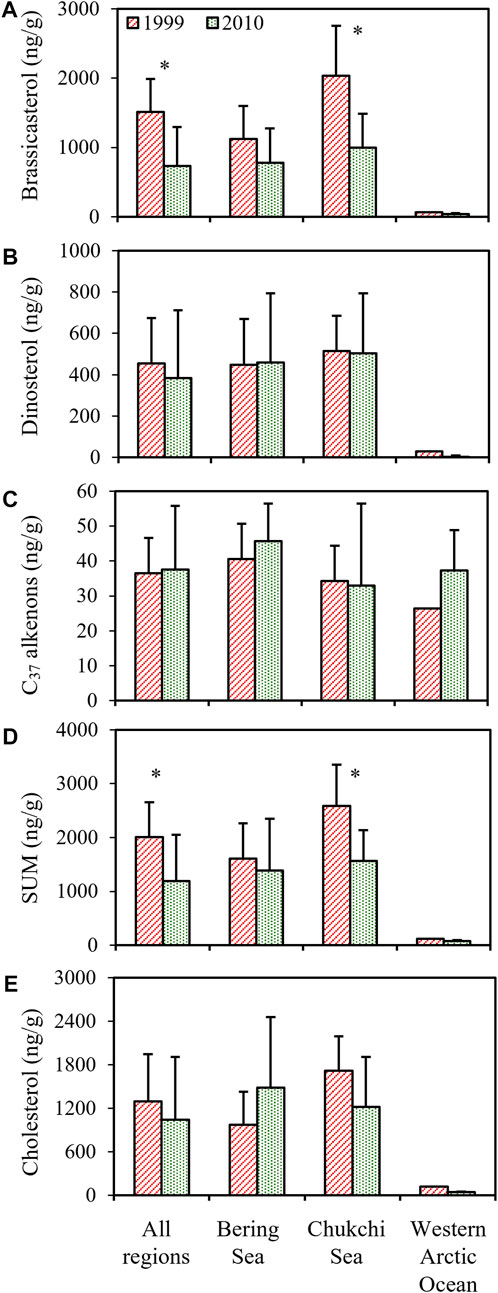
FIGURE 3. The interannual variability of concentrations (ng/g) of (A) brassicasterol, (B) dinosterol, (C) C37 alkenones, (D) the total biomarkers (SUM) and (E) cholesterol in the Bering Sea, the Chukchi Sea and the western Arctic Ocean. The p-values were calculated by Student’s t-test analysis. Error bars indicate standard deviations of concentrations at stations of each sampling region. There was no error bar for results from the western Arctic Ocean in 1999 due to one station sampling. The asterisks represent the significant difference (p <0.05) in means of biomarker concentrations between 1999 and 2010.
3.2 Decadal variation in phytoplankton community reconstructed from sediment core NB01 (1903–2010)
The profile of 210Pbex activity showed an exponential decrease from 1 to 20 cm (Figure 4). The anomaly of 210Pb at 0–1 cm could be caused by sediment mixing or bioturbation, or the loss of 222Rn. The surficial anomaly would cause the underestimation of sedimentation rate, and thus was not included in the calculation of the sedimentation rate. The sedimentation rate from steady-state best fit yielded from the 210Pbex profile was 0.27 cm/a, with linear correlation coefficient (R) 0.96 (n = 17). The age range was 107 a from 1903 to 2010 (Figure 4).
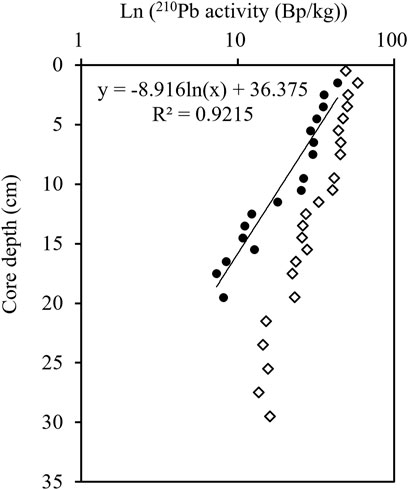
FIGURE 4. The vertical profile of 210Pb in the sediment column of the station NB01. Dot and diamond represent 210Pbex and 210Pbtot, respectively.
The concentrations of brassicasterol, dinosterol and C37 alkenones in the sediment core NB01 all showed a gradual increase over the past 107 years (Figure 5A). The concentrations of cholesterol followed a similar trend (Figure 5A), and were linearly related to that of the SUM (R2=0.92, p <0.001). The concentration of brassicasterol in the sediment core was highest (32.4–1,039 ng/g, median: 103.3 ng/g), followed by dinosterol (4.22–265.6 ng/g, 13.9 ng/g) and C37 alkenones (11.8–112.0 ng/g, 23.1 ng/g; Kruskal–Wallis One Way ANOVA, p<0.001; n = 23; Figure 5A). The fractions of brassicasterol and dinosterol in the SUM had an increase tendency, while that of C37 alkenones was in a contrary pattern over the past 107 years (Figure 5B). A large fluctuation of fractions of three biomarkers occurred between 1966 and the end of the last century (Figure 5B). The ratio of brassicasterol to dinosterol fluctuated violently in the past 107 years, but overall showed a decrease trend (Figure 5C).
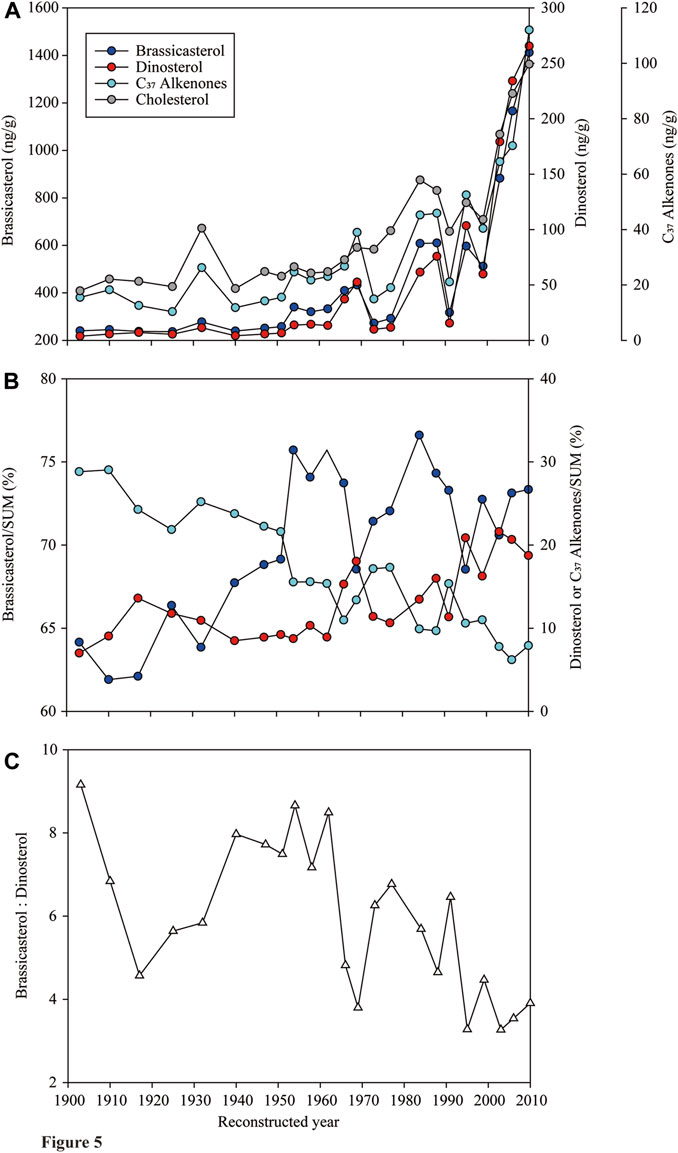
FIGURE 5. Changes of (A) concentrations of brassicasterol, dinosterol, C37 alkenones and cholesterol, (B) proportions of brassicasterol, dinosterol and C37 alkenones in the SUM, and (C) ratios of brassicasterol to dinosterol in the sediment core NB01 collected at the Bering Sea over the reconstructed 107 years from 1903–2010.
4 Discussion
4.1 Biomarkers as indicators of phytoplankton in the Bering Sea and the Arctic Ocean
Three biomarkers, brassicasterol, dinosterol and C37 alkenones, were considered as good indicators of open water phytoplankton groups of diatoms, dinoflagellates and coccolithophores, respectively (Schubert et al., 1998; Seki et al., 2004; Xiao et al., 2013). The dominance of brassicasterol in all samples (Figure 2; Table 1) was consistent with the majority of diatoms previously detected in the study region (Yang et al., 2002; Yang and Lin, 2006; Lin et al., 2013a, Lin et al., 2013b). The total concentrations of biomarkers (the SUM) were highest in the Chukchi Sea, in accordance with the phytoplankton cell numbers measured during the same cruises in 1999 or 2010 (Supplementary Table S1; Yang et al., 2002; Yang and Lin, 2006; Lin et al., 2013a; Lin et al., 2013b). Although we only quantified three types of phytoplankton biomarkers, the coupling between the SUM and cholesterol suggested that these three phytoplankton groups well represented the phytoplankton community in the study region (Figures 2C, D). However, the interannual variations of biomarker concentrations and cell densities of phytoplankton groups were contrary both in the Bering Sea and in the Chukchi Sea (Figure 3; Supplementary Table S1). The SUM of all regions in 1999 was significantly higher than that in 2010, mainly driven by brassicasterol (Figure 3), while the cell density of phytoplankton was larger in 2010 mostly due to the increased cell density in the Bering Sea (1999: 1,580 cells/L; 2010: 58,722 cells/L, Supplementary Table S1; Yang et al., 2002; Lin et al., 2013b). It was noted that the survey methods employed for phytoplankton quantification were different between 1999 and 2010 (net collection in 1999 vs. water collection in 2010; Yang et al., 2002; Lin et al., 2013b). Net collection usually misses small and single-celled diatoms, dinoflagellates, cryptophytes, and hyptophytes (Jiang et al., 2020). In the Bering Sea, the dominant phytoplankton measured in 1999 were mostly large pennate diatoms (>40 μm), including Denticular seminae, Nitzschia delicatissima, Thalassiothrix longissimi, Rhizosolenia styliformis (Yang et al., 2002); however, the composition of phytoplankton changed to small centric diatoms (<20 μm) in 2010, such as Thalassiosira nordenskioldi, Fragilariopsis oceanica, and Chaetoceros curvisetus (Lin et al., 2013b), suggesting that the measurement of phytoplankton in 1999 missed amounts of small diatoms. This could cause the inconsistency between the SUM and cell density of phytoplankton in two sampling years in the Bering Sea. In the Chukchi Sea, cell density of diatoms to that of total phytoplankton was over 90% in both sampling years (Supplementary Table S1), and the samples from 2 years did not vary much in diatom composition because they were both dominated by micro-phytoplankton (>20 μm; Yang et al., 2002; Lin et al., 2013b). The net collection may lose some cells but does not obviously affect the measurement of phytoplankton cell density there. Overall, due to inconsistent sampling methods applied in different sampling years, the quantification on phytoplankton composition and biomass might be inaccurate for estimating responses of phytoplankton community to climate changes. Again, phytoplankton biomarkers could be good proxy candidates for investigating phytoplankton abundances and compositions.
4.2 Interannual variation of biomarkers in the Bering Sea and Arctic seas, and the relationship with ENSO and AO
The rapid decreasing sea-ice cover from 1979 to 2019 has been reported in the Arctic Ocean (Hu et al., 2007; Ardyna and Arrigo, 2020). Although the concentration of Chl α and net primary production show an increasing trend from 1998 to 2010 and are intensely related to sea-ice retreat in the Arctic as a result of the climate change (Ardyna and Arrigo, 2020), the opposite variation of biomarker concentrations (Figure 3) between 1999 and 2010 indicates that environmental variability induced by the atmospheric and water circulation may be key factors driving the interannual variability of phytoplankton bloom and distribution in the Arctic seas (Budikova, 2009; Woodgate et al., 2012; Ardyna and Arrigo, 2020). There is a close teleconnection between the AO and the ENSO as a result of air-sea interaction (De Weaver and Nigam, 2000; Jia et al., 2009). The time series of the normalized Niño3.4 index and the AO index between 1950 and 2010 show obvious characteristics of annual and decadal variations (Figure 6A; Yang et al., 2006). In the ENSO cold/warm phase, the occurrence probability of a positive/negative phase of the AO is about 15% higher than in the negative/positive phase, and the ENSO cold phase is beneficial to the duration of AO positive abnormal events for about 2–4 weeks (Quadrelli and Wallace, 2001; Müller and Roeckner, 2006).
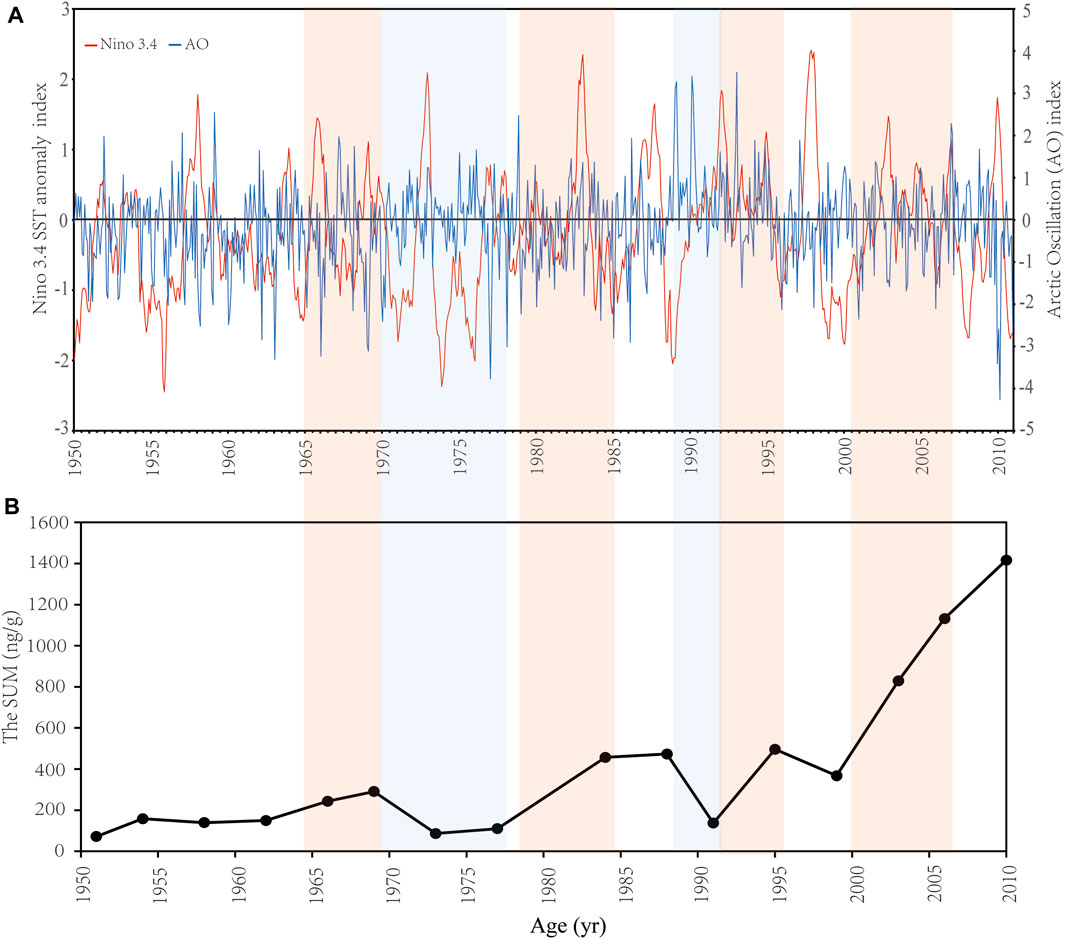
FIGURE 6. The variations of (A) the Niño 3.4 SST anomaly index (unit: °C) and the Arctic Oscillation (AO) index, and (B) the SUM (ng/g; total concentrations of brassicasterol, dinosterol and C37 alkenones) from 1950 to 2010. Data of the Nino 3.4 index and the AO index were downloaded from https://psl.noaa.gov/data/climateindices/list/. It is noted that the Niño 3.4 SST anomaly and AO indices are monthly data. The year is placed at the beginning of the year. Colored shading highlights periods with the relevance of the variation of the SUM and the ENSO.
A strong Central Pacific La Niña with a positive AO and a moderate Eastern Pacific La Niña (SSTA < −0.5°C) with a negative AO occurred in 1999 and 2010, respectively, according to the Nino3.4 and AO indices (Figure 6A). The strong La Niña in 1999 severely affected the climate in the Arctic Ocean according to the relatively low SST (Timmermans and Labe, 2021) and negative annual surface air temperature (SAT) anomalies (°C) (https://www.ncei.noaa.gov/access/monitoring/climate-at-a-glance/global/time-series); however, a positive AO corresponded to a high SLP over the mid-latitude (Clancy et al., 2021), and as AO index increased, the pressure difference between both sides of the Bering Strait was enhanced, promoting the flow of nutrients and heat in waters of the Bering Sea into the Chukchi Sea. It could boost the phytoplankton abundance and primary production. In contrary, from 2009 to 2010, a significantly negative AO phase (Figure 6A), the level of which had reached the lowest value since 1824, was accompanied by a typical La Niña of the eastern equatorial Pacific during the same period (July 2010 to May 2011). These two strong climate signals could significantly affect the atmospheric circulation and ocean temperature regionally and globally. The SST in the Chukchi Sea was higher than it was in the Bering Sea, at an average of 3.25°C and a highest temperature of 4°C in the shallow-water region (Supplementary Table S1), which might be caused by a deep Aleutian low driving warm and moist air into the Arctic as a result of robust link between the ENSO and AO negative phase (Clancy et al., 2021). The SST was low in the Bering Sea (Lin et al., 2013a, Lin et al., 2013b) compared to the Chukchi Sea due to the input of cold deep-sea water transferred from eastern Pacific Ocean. Combined with the impact of a high SLP over the Arctic, the movement of waters with nutrients to the Chukchi Sea from the Bering Sea was inhibited. Moreover, the increased SST in the Chukchi Sea could result in sea ice loss, indicated by a low salinity in the Chukchi Sea (30.2; Supplementary Table S1) due to the dilution of surface seawater with freshwater. The low salinity could also be enhanced by the increasing trend of the Pacific inflow to the Chukchi Sea with freshwater from 1990 to 2015 (Woodgate, 2018). The relatively high SST and lower salinity in the Chukchi Sea might cause the stratification, limiting the vertical influx of nutrients from the deep waters. It indicated that the significant changes in the phytoplankton community in the Chukchi Sea and the Bering Sea in 2010 were affected by the combined strong AO negative phase and La Niña during the same period (Zuo, 2011).
4.3 Decadal variability of the phytoplankton community and the relationship with ENSO and AO
4.3.1 Decadal variability of phytoplankton abundances
The concentrations of three phytoplankton biomarkers all have an increasing trend from 1903 to 2010, suggesting their similar and sensitive response to the rapid environmental changes (e.g., sea-ice retreat, temperature increase, nutrient enhancement). In particular, a distinctive increase of biomarker concentrations occurred in the core starting in the late 1970s and an accelerating rise started in the early 1990s after a sharp decline (Figure 5A), corresponding to the consistent decline and accelerating retreat of sea ice extent in the Arctic from the late 1970s and the early 1990s, respectively (Budikova, 2009). The sharp increase of concentrations of biomarkers after the year of 2000 coupled to a rapid decline of both sea ice extent and thickness in the entire Arctic (Stroeve et al., 2005; Ardyna and Arrigo, 2020; Lewis et al., 2020). C37 alkenones has been considered as a proxy of the primary productivity in a given oceanic location based on their well correlations with other proxies, such as δ13C of total organic carbon (Jasper, 1988). The sharp increase of C37 alkenones from the late 1990s (Figure 5A) may suggest an enhanced primary production in recent decades. Besides, due to the dominance of diatoms and dinoflagellates in the Arctic waters (Yang et al., 2002; Lin et al., 2013b; Ardyna and Arrigo, 2020), the SUM could also be used as an indicator of the primary production. The synchronized rising of the SUM and cholesterol (R2=0.92, p <0.001), a good indicator of the abundance of zooplankton which are considered as the major consumers of the primary production, also suggests an increase of the primary productivity. These evidences from the core analysis match with the changes of the primary productivity from 1998–2006 (Pabi et al., 2008) and an unprecedented jump of net primary production since 1998 (Lewis et al., 2020). The decadal variability of the primary production and the phytoplankton composition reconstructed from biomarkers in the core implies a rapid response of the Arctic ecosystem to the climate change.
The trend of the sedimentary record in the Bering Sea was related intensely to the decadal changes in the ENSO and atmospheric circulation (Figure 6). The attention must be given to the relationship between the ENSO and the atmospheric circulation at a decadal scale. Previous studies have shown that the characteristics of the ENSO are different annually. In particular, over the past 50 years, the interannual oscillation frequency and the amplitude of the ENSO have changed significantly (Mantua et al., 1997; Li, 2012; Figure 6A). Our decadal data showed that the increase of biomarker concentrations in the late 1960s, in the early 1980s and after the year of 2000 were all in periods with the dominance of the ENSO warm phase (El Niño) or low-amplitude of the ENSO cold phase (La Niña), while a decrease in the early 1970s and in the late 1980s were both in periods of the dominance of La Niña (Figure 6). Furthermore, the variation of atmospheric stress in the mid-high latitude might lead to the heat flux and re-distribution of seawater and sea-ice, and eventually the changes of the sea ice (Rigor and Wallace, 2004; Hu et al., 2007). The atmospheric circulation changed dramatically in the late 1970s with a decreasing trend of the negative AO index starting from 1978 and transition to a strongly positive phase during 1988–1995 (Figure 6A). Correspondingly, a sharp decline of the extent of sea-ice occurred in the Bering Sea in 1978 and decreased slowly till 1996 (Rigor and Wallace, 2004; Hu et al., 2007; Huang et al., 2014). The change of sea-ice cover could be caused by a combined effect of thermal and dynamic factors as a result of variations of SLP, wind field and surface air temperature (Hu et al., 2007). During this period, the Aleutian Low increased, and the position of the low-pressure core was shifted to the southeast of the Bering Sea. Meanwhile, the positive AO induced a cyclonic atmospheric oscillation at the north of the Aleutian Island of the Bering Sea. These changes caused an increase of the thermal flux from the Gulf of Alaska to the Bering Sea and the Arctic region (Hu et al., 2007). Temperature rise in the Bering Sea and the Arctic region is a strong impetus to the reduction of sea ice cover (Rigor and Wallace, 2004; Hu et al., 2007). In addition to the thermal factor, the distribution of wind field also enhanced the advection of seawater and sea-ice, inducing the variation of formation and accumulation of sea-ice in the Bering Sea and the Arctic region (Hu et al., 2007). The increase of biomarker concentrations during this period could be a result of combination of the ENSO and the AO. From 1997 to 2010, the sea-ice reduction was more rapid than the previous period (1978–1996; Hu et al., 2007; Huang et al., 2014). It could be the major cause of the sharp increase of biomarker concentrations. The sea-ice reduction in the Bering Sea could also be a result of the high frequency of El Niño. A high-amplitude of El Niño started from 1997 and lasted to the beginning of 1998 (Figure 6A). After a decline of the SUM in 1999 due to La Niña (Figure 6B), the sharp and consistent increase of that could be caused by the continued El Niño from 2002 to the end of 2006, while the slow increase from 2007 to 2010 was the consequence of a long-term La Niña (Figure 6).
4.3.2 Decadal variability of phytoplankton community composition and response to climate change
Phytoplankton groups respond differently to environmental changes (e.g., temperature, light, nutrients and CO2), resulting in an altered community composition (Chivers et al., 2017; Bach and Taucher, 2019). The long-term data on phytoplankton community composition and structure can greatly assist us to understand the response of different groups to the environmental stressors and enhance our knowledge to predict phytoplankton primary production and carbon fluxes in future. The decadal variation of biomarker concentrations suggested that diatoms were always the dominant group among three phytoplankton groups (>60%; Figure 5B). Proportions of both diatoms and dinoflagellates to the SUM increased, suggesting that the changes in the Arctic were more suitable to their growth, or release and sink of sea-ice algae (e.g., diatoms) to the seafloor as the ice melted (Ardyna and Arrigo, 2020). It also implied an increase of phytoplankton carbon fluxes to the seafloor with climate change.
A trend of decreasing ratio of brassicasterol to dinosterol from 1903 to 2010 indicated a faster increase of dinoflagellates compared to diatoms (Figure 5C). Moreover, although both proportions of diatoms and dinoflagellates to the SUM had a trend of increase, they decoupled (Figure 5B), suggesting the competition and succession of diatoms and dinoflagellates in responses to environmental variations. Temperature is a direct factor influencing dinoflagellates, which prefer to living in warm waters (Bi et al., 2021). They have a wider range of nutrient tolerance than diatoms, either live in oligotrophic or in nutrient-rich water with diatoms (Matthiessen et al., 2005). Dinoflagellates could outcompete diatoms under high nutrients and warming condition (Bi et al., 2021). It also shows that since the early 1990s, silicate concentration has decreased by 20% in inflowing Atlantic water due to natural multi-decadal changes in surface circulation and decreased depth of winter convection at lower latitudes (Aydrna and Arrigo, 2020). The availability of nitrate would drive large-scale shifts from diatoms-to flagellates-dominated systems in less productive and silicate-limiting area in the Arctic (Aydrna and Arrigo, 2020). Thus, as SST and nitrate supply are increasing and silicate is becoming limited, the Arctic waters, especially in summer, could be more suitable for the growth of dinoflagellates. The transports by surface currents also play a significant role in dinoflagellate biogeography; for example, the species, which have the boreal, tropical-boreal and Antarctic tropical-boreal types of distribution, are considered as allochthonous in the Arctic Ocean through the relatively warm Atlantic and Pacific waters (Hegseth and Sundfjord, 2008; Liu et al., 2021). Besides, the predation plays a central role in determining the succession of the phytoplankton community. Increased primary production (e.g., diatoms) may enhance the predation by ciliate and heterotrophic dinoflagellates (Liu et al., 2021), potentially causing a decreased ratio of diatoms: dinoflagellates.
Although the relative abundance of coccolithophore in phytoplankton groups decreased (Figure 5B), their biomass indicated by C37 alkenones still increased rapidly, especially after the year of 2000 (Figure 5A). Several recent studies have indicated that the coccolithophore population is expanding poleward as indicated by a temporally resolved compilation of field and satellite observations (Winter et al., 2014). While an increase in dissolved inorganic carbon concentration in the surface ocean is considered as a major contributing factor to the increase of coccolithophore, other effects of anthropogenic climate change, such as warmer SST or increased stratification and nutrient limitation favoring coccolithophores, could also be the underlying factors (Winter et al., 2014; Rivero-Calle et al., 2015).
5 Conclusion
The interannual variation in characteristics of the spatial distribution of the phytoplankton community structure and abundance was reconstructed by using the specific algal molecular biomarkers in surface sediments of the Arctic seas. The overall pattern was consistent with the measured phytoplankton cell density in previous studies, suggesting that the biomarkers were good proxies of arctic phytoplankton. The distribution patterns of phytoplankton were well related to the northern current enriched with nutrients crossing through the Bering Strait from the Bering Sea to the Chukchi Sea. The interannual comparison of the phytoplankton biomarker indicated that the variation was less affected by the increase of temperature and ice-melting, but mostly determined by the interannual climate variability in the Arctic region. The biomarker records of the sediment core in the Bering Sea showed that the biomass of three dominant phytoplankton groups, diatoms, dinoflagellates and coccolithophores, all had increase trends from the early 1950s. There was a sharp increase by the end of 1990s, which was in good agreement with sea ice change in the Arctic and ENSO warm/cold phases. Meanwhile, the phytoplankton community structure changed with increased relative abundances of diatoms and dinoflagellates but decreased coccolithophores, potentially being related to the decadal variability of SST, nutrient supply and predations. The decoupled variation of diatoms and dinoflagellates also implied that dinoflagellates were more competitive in future Arctic seas due to the warmer water, silicate limitation and increased nitrate inflow from ice-melting or riverine input.
Data availability statement
The original contributions presented in the study are included in the article/Supplementary Material, further inquiries can be directed to the corresponding author.
Author contributions
HZ and BL initiated the study and collected samples. BL and DY processed the samples. QL analyzed the data and wrote the manuscript. All authors contributed to the article and approved the submitted version.
Funding
This study was financially supported by the National Key Research and Development Program of China (No. 2022YFC3105303), the National Natural Science Foundation of China (41276199 and 42176038), Chinese Projects for Investigations and Assessments of the Arctic and Antarctic (CHINARE 2012–2016 for 03-04 and 04-03), Science Foundation of Donghai Laboratory (No. DH-2022KF0211), and the Project of State Key Laboratory of Satellite Ocean Environment Dynamics, Second Institute of Oceanography (No. SOEDZZ2204).
Acknowledgments
The authors would like to thank Professor Qingliang Yang and Professor Gengming Lin for providing the data on the identification of phytoplankton in the Arctic Ocean that were collected in 1999 and 2010. In addition, we thank the Chinese Arctic and Antarctic Administration, team members of CHINAREs, and the captains and crew of the R/V Xuelong for assistance in collecting samples.
Conflict of interest
The authors declare that the research was conducted in the absence of any commercial or financial relationships that could be construed as a potential conflict of interest.
Publisher’s note
All claims expressed in this article are solely those of the authors and do not necessarily represent those of their affiliated organizations, or those of the publisher, the editors and the reviewers. Any product that may be evaluated in this article, or claim that may be made by its manufacturer, is not guaranteed or endorsed by the publisher.
Supplementary material
The Supplementary Material for this article can be found online at: https://www.frontiersin.org/articles/10.3389/feart.2023.1204971/full#supplementary-material
References
Appleby, P. G., and Oldfield, F. (1978). The calculation of 210Pb dates assuming a constatn rate of supply of unsupported 210Pb to the sediment. Catena 5, 1–8. doi:10.1016/s0341-8162(78)80002-2
Aranami, K., Watanabe, S., Tsunogai, S., Hayashi, M., Furuya, K., and Nagata, T. (2001). Biogeochemical variation in dimethylsulfide, phytoplankton pigments and heterotrophic bacterial production in the subarctic North Pacific during summer. J. Oceanogr. 57 (3), 315–322. doi:10.1023/a:1012434613046
Ardyna, M., and Arrigo, K. R. (2020). Phytoplankton dynamics in a changing Arctic Ocean. Nat. Clim. Change 10, 892–903. doi:10.1038/s41558-020-0905-y
Bach, L. T., and Taucher, J. (2019). CO2 effects on diatoms: A synthesis of more than a decade of ocean acidification experiments with natural communities. Ocean Sci. 15, 1159–1175. doi:10.5194/os-15-1159-2019
Bai, Y., Chen, J., Li, H., Xing, L., Jin, H., and Zhao, M. (2010). The distribution of lipids biomarkers in the surface sediments of the Chukchi Sea and their implications. Acta Oceanol. Sin. 32 (2), 106–117.
Barrett, S. M., Volkman, J. K., Dunstan, G. A., and LeRoi, J. M. (1995). Sterols of 14 Species of marine diatoms (bacillariophyta). J. Phycol. 31 (3), 360–369. doi:10.1111/j.0022-3646.1995.00360.x
Belicka, L. L., Macdonald, R. W., and Harvey, H. R. (2002). Sources and transport of organic carbon to shelf, slope, and basin surface sediments of the Arctic Ocean. Deep Sea Res. Part I Oceanogr. Res. Pap. 49 (8), 1463–1483. doi:10.1016/s0967-0637(02)00031-6
Bi, R., Cao, Z., Ismar-Rebitz, S. M. H., Sommer, U., Zhang, H., Ding, Y., et al. (2021). Responses of marine diatom-dinoflagellate competition to multiple environmental drivers: Abundance, elemental, and biochemical aspects. Front. Microbiol. 12, 731786. doi:10.3389/fmicb.2021.731786
Boyd, P., and Newton, P. (1999). Does planktonic community structure determine downward particulate organic carbon flux in different oceanic provinces? Deep-Sea Res. I 46, 63–91. doi:10.1016/s0967-0637(98)00066-1
Boyd, P., and Newton, P. (1995). Evidence of the potential influence of planktonic community structure on the interannual variability of particulate organic carbon flux. Deep-Sea Res. I 42, 619–639. doi:10.1016/0967-0637(95)00017-z
Brassell, S. C., Eglinton, G., Marlowe, I. T., Pflaumann, U., and Sarnthein, M. (1986). Molecular stratigraphy: A new tool for climatic assessment. Nature 320, 129–133. doi:10.1038/320129a0
Budikova, D. (2009). Role of Arctic sea ice in global atmospheric circulation: A review. Glob. Planet. Change 68, 149–163. doi:10.1016/j.gloplacha.2009.04.001
Chen, W., Lan, X., Wang, L., and Ma, Y. (2013). The combined effects of the Enso and the Arctic Oscillation on the winter climate anomalies in East Asia. Chin. Sci. Bull. 58 (8), 1355–1362. doi:10.1007/s11434-012-5654-5
Chivers, W. J., Walne, A. W., and Hays, G. C. (2017). Mismatch between marine plankton range movements and the velocity of climate change. Nat. Commun. 8, 14434. doi:10.1038/ncomms14434
Clancy, R., Bitz, C., and Blanchard-Wrigglesworth, E. (2021). The influence of ENSO on Arctic sea ice in large ensembles and observations. J. Clim. 34, 1–50. doi:10.1175/jcli-d-20-0958.1
Coachman, L. K., Aagaard, K., and Tripp, R. B. (1975). Bering Strait: The regional physical oceanography. Seattle: University of Washington Press.
DeWeaver, E., and Nigam, S. (2000). Do stationary waves drive the zonal-mean jet anomalies of the northern winter? J. Clim. 13 (13), 2160–2176. doi:10.1175/1520-0442(2000)013<2160:dswdtz>2.0.co;2
Ding, Y., Bi, Y., Sachs, J., Chen, X., Zhang, H., Li, L., et al. (2019). Lipid biomarker production by marine phytoplankton under different nutrient and temperature regimes. Org. Geochem. 131, 34–49. doi:10.1016/j.orggeochem.2019.01.008
Fan, T., Huang, F., and Su, J. (2012). The seasonal march of dominate mode of the mid-high latitude atmosphere circulation in northern Hemisphere and the associated Arctic sea ice. Periodical Ocean Univ. China 42, 19–25. doi:10.1007/s11783-011-0280-z
Hegseth, E. N., and Sundford, A. (2008). Intrusion and blooming of Atlantic phytoplankton species in the high Arctic. J. Mar. Syst. 74, 108–119. doi:10.1016/j.jmarsys.2007.11.011
Henson, S. A., Cael, B. B., Allen, S. R., and Dutkiewicz, S. (2021). Future phytoplankton diversity in a changing climate. Nat. Commun. 12, 5372. doi:10.1038/s41467-021-25699-w
Hernandez, M. T., Mills, R. A., and Pancost, R. D. (2008). Algal biomarkers in surface waters around the Crozet plateau. Org. Geochem. 39, 1051–1057. doi:10.1016/j.orggeochem.2008.04.015
Higginson, M. J., and Altabet, M. A. (2004). Initial test of the silicic acid leakage hypothesis using sedimentary biomarkers. Geophys. Res. Lett. 31, L18303. doi:10.1029/2004gl020511
Hu, X., Su, J., Zhao, J., and Hiltebrand, G. (2007). Variation characteristics of the sea ice extent in Bering-Chukchi Seas. J. Glaciol. Geocryol. 29, 100020240. doi:10.3969/j.issn.1000-0240.2007.01.009
Huang, B., Hu, J., Liu, X., Wang, L., Zhang, C.-Y., and Zhou, L.-B. (2011). Review on phytoplankton community structure and its coupling with biological carbon pump under global climate changes. J. Xiamen Univ. Nat. Sci. 50, 402–410. doi:10.3724/SP.J.1077.2011.00311
Huang, F., Di, H., Hu, B., and Zhou, X. (2014). Decadal regime shift of Arctic sea ice and corresponding changes of extreme low temperature. Clim. Change Res. Lett. 3, 39–45. doi:10.12677/ccrl.2014.32007
Jasper, J. (1988). An organic geochemical approach to problems of glacial-interglacial climatic variability. Ph.D. diss. Woods Hole; Woods Hole Oceanographic Institute, 312. Available at: https://hdl.handle.net/1912/4626.
Jia, X., Lin, H., and Derome, J. (2009). The influence of tropical Pacific forcing on the Arctic Oscillation. Clim. Dyn. 32 (4), 495–509. doi:10.1007/s00382-008-0401-y
Jiang, Z., Liu, J., Zhu, X., Chen, Y., Chen, Q., and Chen, J. (2020). Quantitative comparison of phytoplankton community sampled using net and water collection methods in the southern Yellow Sea. Regional Stud. Mar. Sci. 35, 101250. doi:10.1016/j.rsma.2020.101250
José, Y. S., Stramma, L., Schmidtko, S., and Oschlies, A. (2019). ENSO-driven fluctuations in oxygen supply and vertical extent of oxygen-poor waters in the oxygen minimum zone of the Eastern Tropical South Pacific[J]. Biogeosciences Discuss. doi:10.5194/bg2019-155
Lewis, K. M., van Dijken, G. L., and Arrigo, K. R. (2020). Changes in phytoplankton concentration now drive increased Arctic Ocean primary production. Science 369, 198–202. doi:10.1126/science.aay8380
L’Heureux, M. L., and Thompson, D. W. J. (2006). Observed relationships between the El niño–southern oscillation and the extratropical zonal-mean circulation. J. Clim. 19 (2), 276–287. doi:10.1175/jcli3617.1
L’Heureux, M. L., Tippett, M. K., Kumar, A., Butler, A. H., Ciasto, L. M., Ding, Q., et al. (2017). Strong relations between ENSO and the arctic oscillation in th north American multimodel ensemble. Geophyical Res. Lett. 44, 11654–11662. doi:10.1002/2017GL074854
Li, F., Wang, H., and Liu, J. (2014). The strengthening relationship between Arctic Oscillation and ENSO after the mid-1990s. Int. J. Climatol. 34, 2515–2521. doi:10.1002/joc.3828
Li, Q. (2012). Dissertation for master degree. Qingdao: Institute of Oceanology of the Chinese Academy of Sciences.Impactof the decadal chang of ENSO on the Indian ocean basin warming since 1970s.
Li, Y., Zhao, M., Zhang, H., Xing, L., Yang, H.-M., Dai, M.-H., et al. (2012). Phytoplankton biomarkers in surface seawater from the northern South China Sea in summer 2009 and their potential as indicators of biomass/community structure. J. Trop. Oceanogr. 31, 96–103. doi:10.1007/s11783-011-0280-z
Lin, G., Wang, Y., and Yang, Q. (2013a). Species diversity of phytoplankton communities in the Western Arctic Ocean during summer 2010. Biodivers. Sci. 21, 527–536. doi:10.3724/SP.J.1003.2013.10092
Lin, G., Yang, Q., and Wang, Y. (2013b). Distribution pattern of microphytoplankton in the Bering Sea during the summer of 2010. Chin. J. Appl. Ecol. 24, 2643–2650.
Liu, J., Curry, J. A., and Hu, Y. (2004). Recent Arctic sea ice variability: Connections to the arctic oscillation and the ENSO. Geophys. Res. Lett. 31, L09211. doi:10.1029/2004gl019858
Liu, Q., Zhao, Q., McMinn, A., Yang, E. J., and Jiang, Y. (2021b). Planktonic microbial eukaryotes in polar surface waters: Recent advances in high-throughput sequencing. Mar. Life Sci. Technol. 3, 94–102. doi:10.1007/s42995-020-00062-y
Liu, Z., Risi, C., Codron, F., He, X., Poulsen, C. J., Wei, Z., et al. (2021a). Acceleration of Western Arctic sea ice loss linked to the Pacific North American pattern. Nat. Commun. 12, 1519. doi:10.1038/s41467-021-21830-z
Mantua, N. J., Hare, S. R., Zhang, Y., Wallace, J. M., and Francis, R. C. (1997). A Pacific interdecadal climate oscillation with impacts on salmon production. Bull. Am. Meteorological Soc. 78, 1069–1079. doi:10.1175/1520-0477(1997)078<1069:apicow>2.0.co;2
Markina, N., and Khen, G. (1990). The basic functional elements in pelagic communities of the Bering Sea. Izv. Tikho Okeanskogo Nauchno-Issledova Telskogo Insitituta Rybn. Khozyaistva Okeanogr. (TINRO) 111, 79ü93.
Matthiessen, J., De Vernal, A., Head, M., Okolodkov, Y., Zonneveld, K., and Harland, R. (2005). Modem organic-walled dinoflagellate cysts in arctic marine environments and their (paleo-) environmental significance. Palaontologische Z. 79, 3–51. doi:10.1007/bf03021752
Müller, W. A., and Roeckner, E. (2006). ENSO impact on midlatitude circulation patterns in future climate change projections. Geophys. Res. Lett. 33, L05711. doi:10.1029/2005gl025032
Mysak, L., Ingram, R., Wang, J., and van der Baaren, A. (1996). The anomalous sea-ice extent in Hudson Bay, Baffin Bay and the Labrador Sea during three simultaneous NAO and ENSO episodes. Atmosphere-Ocean 34, 313–343. doi:10.1080/07055900.1996.9649567
Nagura, M., and Konda, M. (2007). The seasonal development of an SST anomaly in the Indian ocean and its relationship to ENSO. J. Clim. 20, 38–52. doi:10.1175/jcli3986.1
Overland, J. E., Hanna, E., Hanssen-Bauer, I., Kim, S.-J., Walsh, J. E., Wang, M., et al. 2019. Surface air temperature. Arctic report card 2019, In: L. Richter-Menge, M. L. Druckenmiller, and M. Jeffries (Eds.) Available at: http://www.arctic.noaa.gov/Report-Card.
Overland, J. E., and Roach, A. (1987). Northward flow in the bering and Chukchi seas. J. Geophys. Res. Oceans 92, 7097–7105. doi:10.1029/jc092ic07p07097
Oziel, L., Baudena, A., Ardyna, M., Massicotte, P., Randelhoff, A., Sallée, J. B., et al. (2020). Faster Atlantic currents drive poleward expansion of temperate phytoplankton in the Arctic Ocean. Nat. Commun. 11, 1705. doi:10.1038/s41467-020-15485-5
Pabi, S., van Dijken, G. L., and Arrigo, K. R. (2008). Primary production in the Arctic Ocean, 1998-2006. J. Geophys. Res. 113, C08005. doi:10.1029/2007JC004578
Prahl, F. G., and Wakeham, S. G. (1987). Calibration of unsaturation patterns in long-chain ketone compositions for palaeotemperature assessment. Nature 330, 367–369. doi:10.1038/330367a0
Quadrelli, R., and Wallace, J. M. (2002). Dependence of the structure of the Northern Hemisphere annular mode on the polarity of ENSO. Geophys. Res. Lett. 29, 47-1–47-4. doi:10.1029/2002gl015807
Rigor, I. G., Wallace, J. M., and Colony, R. L. (2002). Response of sea ice to the arctic oscillation. J. Clim. 15, 2648–2663. doi:10.1175/1520-0442(2002)015<2648:rositt>2.0.co;2
Rigor, I. G., and Wallace, J. M. (2004). Variations in the age of Arctic sea-ice and summer sea-ice extent. Geophys. Res. Lett. 31, 111–142. doi:10.1029/2004gl019492
Rivero-Calle, S., Gnanadesikan, A., Del Castillo, C. E., Balch, W. M., and Guikema, S. D. (2015). Multidecadal increase in North Atlantic coccolithophores and the potential role of rising CO2. Science 350, 1533–1537. doi:10.1126/science.aaa8026
Schubert, C., and Stein, R. (1996). Deposition of organic carbon in Arctic Ocean sediments: Terrigenous supply vs marine productivity. Org. Geochem. 24 (4), 421–436. doi:10.1016/0146-6380(96)00042-3
Schubert, C., Villanueva, J., Calvert, S., Cowie, G. L., von Rad, U., Schulz, H., et al. (1998). Stable phytoplankton community structure in the Arabian Sea over the past 200,000 years. Nature 394, 563–566. doi:10.1038/29047
Seki, O., Ikehara, M., Kawamura, K., Nakatsuka, T., Ohnishi, K., Wakatsuchi, M., et al. (2004). Reconstruction of paleoproductivity in the Sea of Okhotsk over the last 30 kyr. Paleoceanography 19, PA1016. doi:10.1029/2002pa000808
Sigler, M. F., Harvey, H. R., Ashjian, C. J., Lomas, M. W., Napp, J. M., Stabeno, P. J., et al. (2010). How does climate change affect the Bering Sea ecosystem? Eos 91, 457–468. doi:10.1029/2010eo480001
Springer, A. M., McROY, C. P., and Flint, M. V. (1996). The Bering Sea green belt: Shelf-edge processes and ecosystem production. Fish. Oceanogr. 5, 205–223. doi:10.1111/j.1365-2419.1996.tb00118.x
Stein, R., Boucsein, B., and Fahl, K. (1999). Postglacial/Holocene Accumulation of Organic Carbon at the Laptev Sea Continental Margin (Arctic Ocean): Sources, pathways, and sinks. Ventura, Californien, USA: Gordon Conference.
Stroeve, J., Serreze, M., Fetterer, F., Arbetter, T., Meier, W., Maslanik, J., et al. (2005). Tracking the Arctic's shrinking ice cover: Another extreme September minimum in 2004. Geophys. Res. Lett. 32, L04501. doi:10.1029/2004gl021810
Thompson, D. W., and Wallace, J. M. (2001). Annular modes in the extratropical circulation. Part I: Month-to-Month variability. J. Clim. 13, 1000–1016. doi:10.1175/1520-0442(2000)013<1000:amitec>2.0.co;2
Timmermans, M. L., and Labe, Z. (2021). Sea surface temperature. Arctic report card 2021. Available at: http://www.arctic.noaa.gov/Report-Card-2021.
Trenberth, K. E. (1997). The definition of El Niño. Bull. Am. Meteorological Soc. 78 (12), 2771–2777. doi:10.1175/1520-0477(1997)078<2771:tdoeno>2.0.co;2
Volkman, J. K., Barrett, S. M., Blackburn, S. I., Mansour, M. P., Sikes, E. L., and Gelin, F. (1998). Microalgal biomarkers: A review of recent research developments. Org. Geochem. 29, 1163–1179. doi:10.1016/s0146-6380(98)00062-x
Volkman, J. K. (1986). A review of sterol markers for marine and terrigenous organic matter. Org. Geochem. 9, 83–99. doi:10.1016/0146-6380(86)90089-6
Volkman, J. K. (2006). Lipid markers for marine organic matter. Handb. Environ. Chem. 2, 27–70. doi:10.1007/698_2_002
Wang, F., Yang, B., Tian, L., Li, J., Shang, Z., Chen, Y., et al. (2016). The choice of CIC and CRS models of 210Pbexc dating for tidal flat area. Earth Sci. 41 (6). doi:10.3799/dqkx.2016.081
Winter, A., Henderiks, J., Beaufort, L., Rickaby, R. E. M., and Brown, C. W. (2014). Poleward expansion of the coccolithophore Emiliania huxleyi. J. Plankton Res. 6 (2), 316–325. doi:10.1093/plankt/fbt110
Withers, N. (1987). “Dinoflagellate sterols,” in The biology of dinoflagellates. Biol. Mongr. Editor F. J. R. Taylor (Malden, Mass: Blackwell), 21, 316–359.
Wittenborn, A. K., Schmale, O., and Thiel, V. (2020). Zooplankton impact on lipid biomarkers in water column vs. surface sediments of the stratified Eastern Gotland Basin (Central Baltic Sea). PLOS ONE 15 (6), e0234110. doi:10.1371/journal.pone.0234110
Woodgate, R. A., Weingartner, T. J., and Lindsay, R. (2012). Observed increases in Bering Strait oceanic fluxes from the Pacific to the Arctic from 2001 to 2011 and their impacts on the Arctic Ocean water column. Geophys. Res. Lett. 39, L24603. doi:10.1029/2012gl054092
Woodgate, R. A. (2018). Increases in the Pacific inflow to the Arctic from 1990 to 2015, and insights into seasonal trends and driving mechanisms from year-round Bering Strait mooring data. Prog. Oceanogr. 160, 124–154. doi:10.1016/j.pocean.2017.12.007
Xiao, X., Fahl, K., and Stein, R. (2013). Biomarker distributions in surface sediments from the kara and laptev seas (Arctic Ocean): Indicators for organic-carbon sources and seasea-ice coverage. Quat. Sci. Rev. 79, 40–52. doi:10.1016/j.quascirev.2012.11.028
Yamanouchi, T., and Takata, K. (2020). Rapid change of the Arctic climate system and its global influences-overview of GRENE Arctic climate change research project (2011-2016). Polar Sci. 25, 100548. doi:10.1016/j.polar.2020.100548
Yang, Q., and Lin, G. (2006). A multivariate analysis of netphytoplankton assemablages in the Chukchi sea and Bering Sea. J. Plant Ecol. 30 (5), 763–770. doi:10.3321/j.issn:1005-264X.2006.05.006
Yang, Q., Lin, G., Lin, M., Lin, J., and Dai, Y. (2002). Species composition and distribution of phytoplankton in Chukchi Sea and Bering Sea. Chin. J. Polar Res. 14 (2), 410–421.
Yu, P., Zhang, H., Hu, C., and Lu, B. (2012). Using biomarkers in sediments as indicators to rebuild the phytoplankton community in Prydz Bay, Antarctica. Chin. J. Polar Res. 24 (2), 143–150. doi:10.3724/sp.j.1084.2012.00143
Yuan, X., Kaplan, M. R., and Cane, M. A. (2018). The interconnected global climate system—a review of tropical–polar teleconnections. J. Clim. 31, 5765–5792. doi:10.1175/jcli-d-16-0637.1
Zhang, R., Min, Q., and Su, J. (2017). Impact of El Niño on atmospheric circulations over east asia and rainfall in China: Role of the anomalous Western north pacific anticyclone. Sci. China Earth Sci. 60, 1124–1132. doi:10.1007/s11430-016-9026-x
Zhang, Y., Su, Y., Liu, Z., Du, Y., Yu, J., and Jin, M. (2019). Fatty acid and alcohol compositions in lacustrine sediments as indicators of environment and ecosystem of lakes in Eastern China. Ecol. Indic. 97, 290–300. doi:10.1016/j.ecolind.2018.10.029
Zhao, J., Han, Z., and Pan, J. (2014). Spatial and temporal Variation of phytoplankton indicated by multi-proxies in Prydz Bay, Antarctica. Res. Environ. Sci. 6, 004. doi:10.1007/s11802-014-2231-3
Zhao, J., Zhu, D., and Shi, J. (2003). Seasonal variations in sea ice and ite main driving factors in the Chukchi Sea. Adv. Mar. Sci. 21 (2), 123–131. doi:10.1007/s11769-003-0089-1
Zhao, M., Mercer, J. L., Eglinton, G., Higginson, M. J., and Huang, C. Y. (2006). Comparative molecular biomarker assessment of phytoplankton paleoproductivity for the last 160kyr off Cap Blanc, NW Africa. Org. Geochem. 37 (1), 72–97. doi:10.1016/j.orggeochem.2005.08.022
Zhao, Q., Chen, R., Zhang, H., Yu, P., and Lu, B. (2015). Variability of organic matter sources and phytoplankton community structure during the 19th century under global warming background in the Chukchi Sea. Nat. Environ. Pollut. Technol. 14 (3), 739–747.
Zhi, H., Zhang, R. H., Lin, P., Yu, P., Zhou, G., and Shi, S. (2020). Interannual salinity variability associated with the central Pacific and eastern Pacific El Niños in the tropical Pacific. J. Geophys. Res. Oceans 125, e2020JC016090. doi:10.1029/2020jc016090
Keywords: biomarker, phytoplankton community, ENSO, Arctic Oscillation, the Bering Sea, the Arctic Ocean, the Chukchi Sea
Citation: Liu Q, Yang D, Zhang H and Lu B (2023) Interannual and decadal variabilities of phytoplankton community in the Bering Sea and the Arctic Ocean: a case study of relationship with ENSO and Arctic Oscillation abnormity. Front. Earth Sci. 11:1204971. doi: 10.3389/feart.2023.1204971
Received: 13 April 2023; Accepted: 17 July 2023;
Published: 28 July 2023.
Edited by:
Yanhong Zheng, Northwest University, ChinaReviewed by:
Huan Yang, China University of Geoscience, ChinaYongdong Zhang, South China Normal University, China
Copyright © 2023 Liu, Yang, Zhang and Lu. This is an open-access article distributed under the terms of the Creative Commons Attribution License (CC BY). The use, distribution or reproduction in other forums is permitted, provided the original author(s) and the copyright owner(s) are credited and that the original publication in this journal is cited, in accordance with accepted academic practice. No use, distribution or reproduction is permitted which does not comply with these terms.
*Correspondence: Haisheng Zhang, emhhbmdzb2FAMTYzLmNvbQ==