 Deying Wang
 Jizhi Wang
 Wenxing Jia
 Yaqiang Wang
94% of researchers rate our articles as excellent or good
Learn more about the work of our research integrity team to safeguard the quality of each article we publish.
Find out more
ORIGINAL RESEARCH article
Front. Environ. Sci., 02 August 2023
Sec. Atmosphere and Climate
Volume 11 - 2023 | https://doi.org/10.3389/fenvs.2023.1232121
This article is part of the Research TopicClimate-Environment Interactions under Global WarmingView all 25 articles
This study focused on weather and environmental numerical prediction and public demand. It expanded the concept and technology growth points in new fields in terms of new tasks for major prediction services for “large-scale public events.” This is required for more advanced prediction and to improve the resolution, fineness, and accuracy of the prediction. This study explored the prediction theory and technical application of transient atmospheric aerosol pollution within an accuracy of an hour. The novelty of this study is as follows: ①Based on high-quality big data covering the Northern Hemisphere with high temporal resolution with an accuracy of 1 h, a quantitative theory of the “natural weather cycle” spectral analysis algorithm was developed. This study presented a quantitative forecast model that nests the “spectral analysis of atmospheric wave-like disturbance” in the westerly belt with the “transient characteristics” of micro-scale aerosols (PM2.5 concentration) in Beijing and North China. ②According to the nested model of this study, the wave-like oscillation (H′) of 500 hPa was positively correlated with the PLAM index and PM2.5 mass concentration during nested multi-“natural weather cycles.” The significance level exceeded 0.001. This study demonstrated the prediction abilities of early quantitative fine prediction theory and implementation in the context of air quality. The forecast service on 1 October 2022, for the opening of the CCP 20th National Congress (16 October), and during the conference was successfully presented in real time. The results of this study on hourly resolution high-precision air quality forecasting service showed that rolling forecasts can be continuously released both 1 month and 7–10 days in advance, and the nesting effect can constantly be updated. Forecasts were found to be consistent with reality. ③The nested mode method for atmospheric spectrum analysis and micro-scale aerosol (PM2.5) distribution provides quantitative analysis and a decision-making basis for business-oriented operations to address technical difficulties.
1. Theory and method of “natural weather cycle” spectral analysis algorithm.
2. Nested mode method for spectrum analysis and micro-scale aerosol (PM2.5) distribution.
3. Forecasts given were consistent with reality for National Day and CCP 20th Congress 2022.
In recent years, with the development and prosperity of human economic and cultural activities, meteorological forecasting centers and the public are faced with the new task of providing forecasting services further in advance to increase forecast abilities for large-scale public activities. In this context, a more refined resolution is required for the prediction of changes in adverse meteorological conditions, with levels of accuracy to the nearest hour.
However, current climate predictions and long-term projections do not involve transient weather change information with high spatial and temporal resolution because the daily or hourly weather changes need to be considered as distractions that need to be filtered usually (Ackerman et al., 2004; Ren and Lei, 2022). Therefore, the development of “modern ultra-early weather forecasting” is a new trend. The goal of this is to provide instantaneous adverse weather precursor signals and unpredictable chains of influence for “special large-scale public activities” (Zhang et al., 2019).
Luo et al. (2019) pointed out that surface solar radiation (SSR) can affect climate, the hydrological cycle, plant photosynthesis, and solar power. Because of the correlation between PM2.5 and SSR, it is an effective and direct method to estimate PM2.5 by the value of SSR. In this study, special attention is paid to the correlation of PM2.5 to the parameters linking air quality to meteorological elements (PLAM) parameter in air quality prediction in weather impacts. In this study, the nested model closely links the interaction between aerosol micro-scale processes that affect air quality and large-scale processes with periods 5–7 D. PLAM parameterized meteorological condition factors include pollution boundary layer height (MLH), micro-scale atmospheric condensation rate (fc), and super-saturation (S). It has the following impact on AQ: first, the micro-scale atmospheric condensation process can produce feedback contribution to large-scale motion when MLH continuously and frequently decreases, stimulating frequent pulse rising jumps in super-saturation S in the bottom layer of the atmosphere. In return, the latent heat released during the condensation microphysical process heats the low-altitude ambient atmosphere, which decreases the MLH, thus forming the feedback process to increase super-saturation and subsequently aggravating haze-fog. This is the primary cause of large-scale, persistent formation of heavy pollution in the atmosphere (Wang et al., 2021).
Therefore, the difference between the nested model and the numerical prediction model is that PLAM parameters are reasonably referenced in the nested mode, and the ability of large-scale and micro-scale transient processes to interact is reasonably applied, which is conducive to improving the prediction effect.
Examples of these events at the global scale include large-scale public events such as Olympic events, including the successful hosting of the 2008 Beijing Summer Olympics in China. A long cover article on the results of the Beijing Olympics in China was introduced in the U.S. Weather Bulletin (Zhang et al., 2009). The multi-factorial characteristics of atmospheric aerosol pollution and quantification of the impact of adverse meteorological conditions at different stages of the Olympic Games were shown (Yang et al., 2009; Zhang et al., 2009; Li et al., 2011).
The large-scale public events of the Beijing 2022 Winter Olympics, including the research on environmental meteorological protection during large-scale events, have resulted in progress in environmental meteorological protection research. This has become a key focus and international frontier research field in terms of atmospheric forecasting scientific research in recent years (Wang DY. et al., 2022).
It has been examined why vegetation cover has improved in recent years, including forestation, and why sandstorms have “returned” to ravage most of China. The poor vegetation conditions in some regions of Mongolia are one of the main reasons, but the uncertainty of analysis needs to be further studied (Yi et al., 2016). Various micro-scale transient weather changes that are difficult to predict are closely related to large-scale fluctuations that nurture and affect such processes. However, to date, insufficient theoretical and methodological research has been conducted on this association. Zhao Tianliang, Zhang Xiaoye, and others have highlighted that since the 1960s, the main activity season for East Asian dust systems has been spring. Mongolia’s Gobi, northwest China, and northern China are the source areas for SDS (sandstorm system) in Asia. From this source zone, aerosols are emitted into the atmosphere, with an average of 51% of sediments returning to and being deposited near Asian sources. A total of 21% is deposited in non-source areas of the Asian subcontinent. More than 70% of the total amount of SDS aerosols are moving along the vicinity of the 40° north latitude. This is consistent with the “survival” trajectory of the mid-latitude extratropical cyclone system in the westerly wind belt. This suggests that aerosol systems often move, create, and die with the substantial impact of atmospheric wave-like disturbances in the East Asian atmospheric circulation (Zhao et al., 2003). For more advanced forecasts, such as monthly forecasts, this method can give an hourly resolution and a more detailed evolution of air pollution. Based on this prediction service, diagnosis and analysis of the overall context of air pressure fluctuations in the East Asian atmospheric circulation can be conducted. Spectral analysis of air pressure fluctuations in atmospheric circulation is a key indicator for tracking and predicting the activity trajectory of aerosol systems and their detailed evolution.
Allen highlighted that wave spectral analysis of air pressure fluctuations based on weather processes is important for capturing microphysical change information nested in long-term weather processes. The spectral analysis of weather processes has shown that relatively low-frequency air pressure fluctuations are the most important influencing factors driving near-ground airflow. More than 60% of the total power of the airflow spectrum occurs in low-frequency oscillations of approximately less than 100 days (Allen et al., 1997). The series of studies on the “Weather Process Cycle’s analysis” has shown that natural weather cycles of 5–7 days occur frequently in the atmosphere (Tverski, 1954; Zhang, 1959).
The development of big data/high-resolution data technology provides new conditions and opportunities for the conceptual update of the “natural weather cycle” and quantitative method research on spectral analysis of “grafting” atmospheric fluctuations. The “natural weather cycle” essentially means that the “weather phenomena in nature usually show a cyclical change.” The “natural weather cycle” is also a science to express “the periodic change of climate.” This can provide new connotations and new growth prospects for technological development (Conner and Higginbotham, 2013). This study has implemented research based on wave spectral analysis and the prediction principle of atmospheric fluctuation in the Northern Hemisphere. This was conducted using hourly resolution automatic weather station (AWS) data, ground and high-altitude observation data discussion, and NCEP reanalysis data. This study examined the analysis and prediction of air quality during the National Day period and the 20th National Congress on 16 October 2022 from a large-scale global perspective. Based on the impact of the cyclical evolution of atmospheric fluctuations in the Northern Hemisphere on the transient characteristics of air quality, an early predictive analysis method of high-resolution (hourly) air quality during major festivals and conferences was established.
This study used hourly resolution AWS data, ground and high-altitude observation data from the National Information Center (CMA) of the China Meteorological Administration, atmospheric composition observations (http://www.zhb.gov.cn/hjzl/) from the Ministry of Ecology and Environment, and NCEP grid point reanalysis data. From the global perspective, this study aimed to examine wave spectral analysis of atmospheric fluctuations and the nested process analysis and prediction of micro-scale disturbances. This study mainly discusses the air quality forecasting services during October in Beijing, China. Visibility and fog-haze are the main objects of concern, and the construction of nested models at different scales prioritizes the change in PM2.5 concentration. The contribution of other aerosol elements, such as the composite effects of PM2.5 concentration and O3, were partially reflected by the PLAM index fusion in the model (Wang DY. et al., 2022; Wang JZ. et al., 2022). The parameters and calculation methods used in this study are in the following sections.
Considering the analysis of large-scale disturbances, the deviation of each grid point on each latitude circle in the Northern Hemisphere relative to the mean value of its zonal circle is
The spectral analysis formula of large-scale disturbance (wave) motion of atmospheric motion in the Northern Hemisphere is (Wang and Ji, 1981)
where λ is the longitude, Ф is the dimension, k is the number of waves of wave motion, and N is the number of values taken by longitude intervals. In order to describe the fluctuation situation of the actual atmosphere, in theory, the superposition of the first 12 waves (K = 1–12) can be calculated among many atmospheric fluctuations (→∞). The contribution of perturbations with wave numbers greater than 12 is already small and negligible. Namely,
Thus, the parameters for obtaining a description of the wave state based on actual atmospheric observations are
Thus, Eq. 4 describes the amplitudes of each wavenumber (k) and their phases (expressed in longitude λ) at different times and in different latitude circles.
The expression of the condensation function (condensation rate) (Zhang et al., 2005; Zhang et al., 2021) is:
where
According to the definition of PLAM (Zhang et al., 2009; Wang et al., 2012; Zhang et al., 2021),
where the parameter (ws) is the saturation mixing ratio and θs is the humidity equivalent potential temperature. The super-saturation degree is a physical quantity that expresses the degree of super-saturation in percentage (Wallace and Hobbs, 2008); it is expressed as
where e and es are the vapor pressure and saturation vapor pressure, respectively. The condensation rate fc describes some essential characteristics of microphysical processes of aerosols associated with condensation, atmospheric saturation, clouds, and haze (Browning, 1973; Harrold, 1973; Shen et al., 2016; Wang et al., 2017). The reason supersaturated signals are hidden signals that are difficult to capture is that they often occur in the atmosphere, disappear instantaneously, and need to be captured at a high resolution (at least hourly). Additionally, to calculate S, a virtual temperature correction {Td = Td’ [1 + 0.378*(E/P)]} needs to be introduced (Holmboe et al., 1952). For the un-saturation vapor pressure, e = E (Td) in Eq. 7, where Td is the dew point temperature of the atmosphere.
It has been recognized that the atmospheric boundary layer height is important for diagnosing atmospheric pollution near the ground layer. However, boundary layer information is one of the “hidden signals” that is often difficult to capture. At this atmospheric layer height, the height of the pollution mixing layer (H_PML), one of the defined heights, a precursor signal of air pollution will appear (Wang et al., 2017; Zhang et al., 2021; Liu et al., 2022):
where es is the saturation water vapor pressure. That is the method of capturing and calculating the precursor signal of atmospheric pollution mixing layer height.
For early and monthly forecasts with resolution up to the hour, the first step is to know the changes in hourly air quality resolution related to fluctuations in atmospheric circulation in the westerly belt of East Asia. How can this association be captured? This is the key to nesting important methods. For obtaining hourly resolution, more detailed predictions, diagnosis, and analysis of the context of atmospheric pressure fluctuations in East Asian atmospheric circulation is an important method to track and predict the activity trajectory and aerosol systems in detail. This involves spectral analysis of atmospheric pressure fluctuations in atmospheric circulation.
In this section, we examined wave spectral analysis in the westerly belt of the Northern Hemisphere as described on the latitude circle. In the first step, Figure 1 shows the fluctuation propagation of fluctuations in 3, 4, and 5, respectively. The amplitude and influence of the wavenumber above 6 are small.
1) Figure 1A shows a fluctuation in the wavenumber of 3. As shown in Figure 1A, 0°E−130°E is the cycle of the first wave, 130°E−120°W is the cycle of the second wave, and 120°W–0° is the cycle of the third wave. This suggests that when there is a wavenumber of 3, that is, three waves, in the Northern Hemisphere, the ridges of its high pressure are at 0°, 130°E, and 130°W, respectively. The corresponding air pressure trough positions are 70°E, 180°W, and 60°W, respectively.
2) Figure 1B shows a fluctuation in the wavenumber of 4. As shown in Figure 1B, 0°E−100°E is the cycle of the first wave, 100°E−180°W is the cycle of the second wave, and 180°W–90° is the cycle of the third wave. 90°W–0 is the fourth wave period. This suggests that when there is a wavenumber of four fluctuations, that is, four waves, in the Northern Hemisphere, the ridges of its high pressure are at 0°, 100°E, 180°W, and 90°W, respectively. The corresponding air pressure troughs are located at 55°E, 145°E, 145°W, and 45°W, respectively.
3) For the fluctuation in the wavenumber of 5 in the Northern Hemisphere, the ridges of its high pressure are at 0°, 80°E, 150°E, 140°W, and 70°W, respectively. The corresponding air pressure troughs are located at 50°E, 120°E, 180°W, 110°W, and 40°W, respectively.
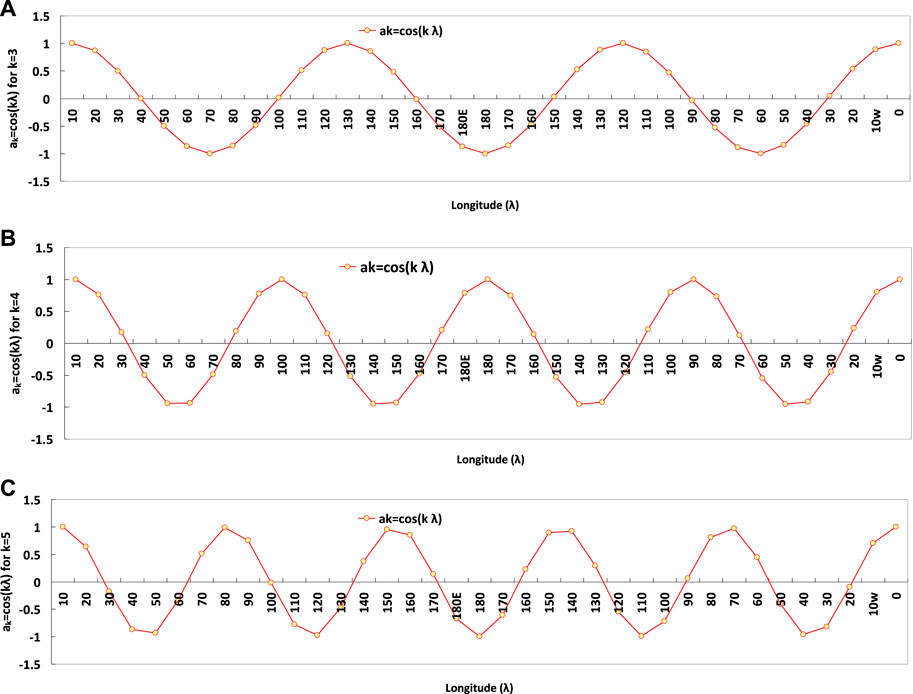
FIGURE 1. Fluctuation propagation characteristics of fluctuations for wavenumber 3 (A), 4 (B), and 5 (C), respectively, in the Northern Hemisphere calculated by Eq. 3.
Therefore, wave spectral analysis of large-scale circulation in the Northern Hemisphere is helpful to obtain the movement of large-scale disturbances such as cyclone activity in the early stages and can provide the quantitative forecast location of disturbances.
In most numerical weather prediction models, the prediction-specific classification has been finalized. For example, long-term numerical weather predictions do not include hourly forecasts. Short-term or “ultra-short-term hourly forecasts” are usually not provided in advance (year/month). However, today, the goals and needs of weather forecasting are constantly updated and need to be further improved. Among them, “specific large-scale public events” forecast the expansion of service demand. For example, the Olympics in France, the World University Games in Chengdu in China, etc., are about to be held. Weather forecasts for “specific large public events” are available as early as possible, months to years in advance, and daily hourly weather forecasts for the Olympic Games are urgently needed. As a result, new research areas such as 1) studying the demand and necessity of forecasting services for “specific large-scale public events,” 2) establishing new quantitative methods for predicting precursor signals, and 3) establishing target tasks and implementation methods for “ultra-early” fine prediction have become new focuses.
Taking the meteorological situation of the Beijing Winter Olympics as an example, the recent research results of Wang Deying and others show that the use of the aura signal method has successfully predicted air quality changes in Beijing, and the forecast is consistent with the observation (Wang DY. et al., 2022). The novelty of the results obtained by the precursor signal prediction method is as follows: 1) when the height (H) of the pollution boundary layer decreases continuously, that is, the normal pattern of height change in the mixed layer (increasing during the day and decreasing at night) is broken for 3–5 days (see Figure 2), low-visibility haze weather conditions are formed one after another. 2) The signal of change in wet equivalent temperature (δΘe) for seven consecutive days, which is equivalent to the natural weather cycle of the 7-day period, is stable and unchangeable. 3) This leads to rapid changes in PLAM (parameters of air pollution and meteorological conditions) and an increase in super-saturation (S) with a threshold of 6%–7% (Wang DY. et al., 2022).
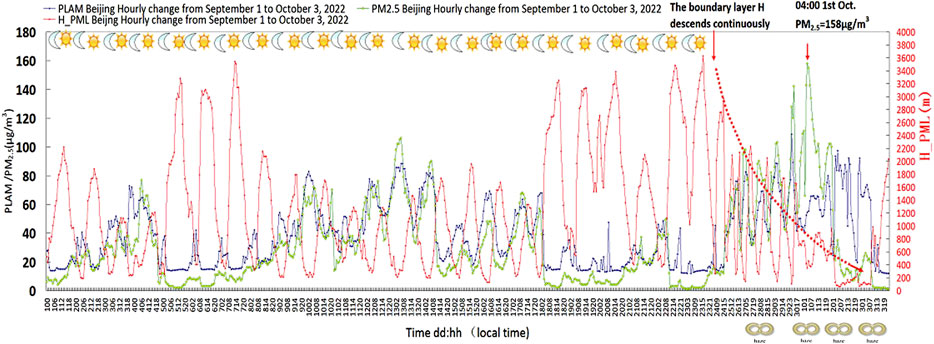
FIGURE 2. Beijing PLAM index and pollution boundary layer height (H) from 1 September to 3 October 2022 and the hourly variation of PM2.5 from 1 September to 3 October 2022.
Figure 2 shows the Beijing PLAM index and pollution boundary layer height (H) from September 1 to 3 October 2022, calculated from Eq. 6 and Eq. 8, respectively, as well as the hourly variation of PM2.5 from September 1 to 3 October 2022. Figure 2 shows the following:
1) The hourly resolutions of weather elements and air quality show that the Beijing meteorological condition index PLAM, pollution boundary layer height H, and PM2.5 from September 1 to 3 October 2022 have significant micro-scale change characteristics. The traditional forecasting methods for conventional daily average distribution or fixed-point observation cannot meet the needs of increasing economic and social development. This is especially the case for the demand for refined services for the prediction of important large-scale public events.
2) There is a significant diurnal variation in the height (H_PML) of the pollution boundary layer represented in Figure 2. This is shown in the diurnal variation expressed by the symbols “
 ” and “
 ” of the Sun and the Moon, respectively, in the figure. There also were significant micro-scale changes in aerosol particulate pollution (PM2.5) concentrations.
3) When a significant continuous decrease in H_PML occurs, appearing as a “precursor signal of adverse weather” falling more than 3,000 m for 7 consecutive days from September 23 to September 30, H_PML from 4,000 to 1,000 m, more than 400 m/d, genus is relatively rare. From September 30 to October 3, haze occurred continuously, as shown by the weather symbol at the bottom right in Figure 2.
To meet the need for earlier granular service forecasts for important large-scale public events, a fine prediction model of atmospheric fluctuation spectrum analysis prediction and high-resolution (hourly) air quality fine prediction “grafted” nested process was established. This was conducted for the “natural weather cycle” of the 7-day process, at 500 hPa, with the characteristic description of wavenumber 4 (amplitude and azimuth).
In this study, the large-scale “natural weather cycle” and micro-scale (hourly resolution) process nesting of atmospheric fluctuations were used to conduct the experimental study of fine air quality prediction during the National Day and CCP 20 conferences in September–October 2022.
Generally, there is a “north ridge–south trough (low trough)” disturbance in the westerly wind belt. This is a strong westerly wind belt with a wind speed of 20 m/s from the Tianshan Mountain Range to the western part of the Hexi corridor in China, which has a “north ridge–south trough” disturbance. When the westerly wind belt has completed an adjustment process from the zonal circulation to the meridional circulation, strong sand and dust aerosol weather occurs in the frontal zone of such westerly belt circulations (Zhao et al., 2003; Gao et al., 2005).
The study showed that the natural weather cycle of 5–7 days usually has some fundamental forecast properties. To confirm the quasi-length of the natural weather cycle in the same season, after confirming the length of the cycle using existing historical data, the degree of successive cycle length can be defined by the number of days in the current cycle. Cyclical trend periods are characterized by continuity. This represents the 1–2 days of the cycle as a trend period, during which the main properties of weather processes, the distribution of symbols of the barometric system, and the direction of movement remain unchanged (Tverski, 1954; Zhang, 1959).
Using high-resolution hourly data, a total of 14 days of spectral analysis tests were conducted from 25 September 2022 to 8 October 2022. Seven days of the “natural weather cycle” were taken to nest 500 hPa of the “natural weather cycle.” Figure 3 shows the propagation of fluctuations when wavenumber k = 4 in the Northern Hemisphere and the propagation of fluctuations in the PM2.5-related PLAM index in North China. Figure 3 is the same as Figure 1B; the orange line shows the propagation of fluctuations when the wavenumber k = 4 in the northern hemisphere, and the blue line in the figure shows the fluctuation propagation of the PLAM index in the Beijing area.
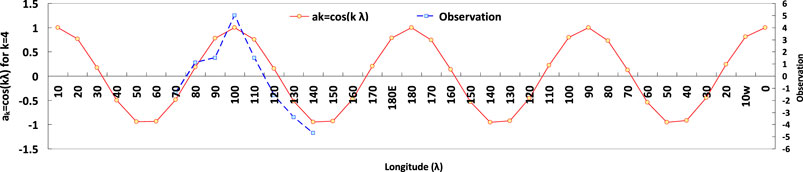
FIGURE 3. Fluctuation propagation characteristics of fluctuations in the Northern Hemisphere and the fluctuation propagation characteristics of fluctuations for observations of PLAM index associated with PM2.5.
Figure 4 shows the 72 h numerical weather forecast of 500 hPa in the Northern Hemisphere released by the Meteorological Center of China Meteorological Administration at 00:00 on 28 September 2022. It can be seen from Figures 1, 3, and 4.
1) Figures 1A–C show the slot and ridge (“λ”) position images depicted by wavenumbers 3, 4, and 5, respectively. Comparing Figure 1B and Figure 3, the calculated and plotted fluctuation (amplitude and azimuth) of wavenumber 4 of 500 hPa of East Asia (70–140°E) in the 7-day “natural weather cycle” is consistent with the micro-scale hourly resolution change of PM2.5. This has provided a quantitative basis for the further generation of hourly high-resolution air quality forecasts.
2) Around the Northern Hemisphere, there is a kind of westerly wind belt airflow through northern China, and the wind speed is greater than 20 m/s, as shown in green in Figure 4.
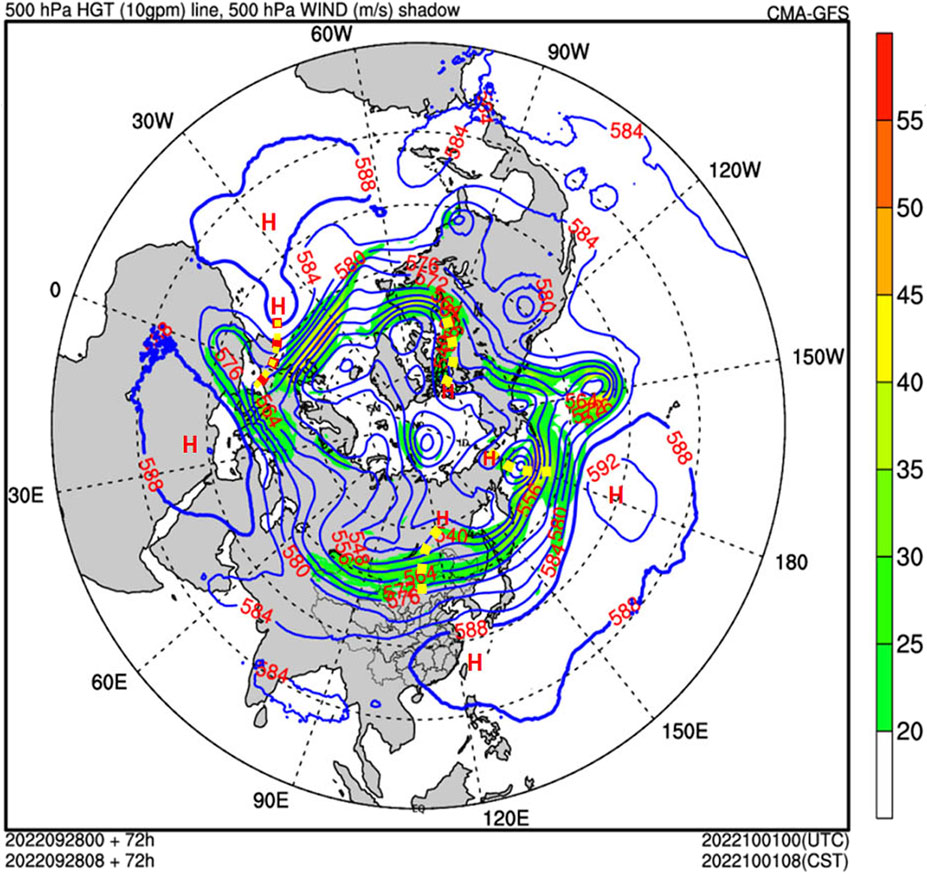
FIGURE 4. 72-h numerical weather forecast of 500 hPa in the Northern Hemisphere, the start time for which was at 00:00 on 28 September 2022, by the Meteorological Center of China Meteorological Administration.
Figure 4 shows that there are four waves in the westerly belt flow at wind speeds of 20–40 m/s in the Northern Hemisphere. This is consistent with the results shown in Figure 3, as indicated by the yellow dotted line. This shows that the nested results of atmospheric wave spectrum analysis with micro-scale aerosol (PM2.5) distribution in Figure 3 can provide a quantitative basis for forecasters to remove the technical difficulties of qualitative analysis. It is difficult to determine the instantaneous variability in air quality by relying on traditional weather maps in the subjective vision.
3) In the westerly wind belt with airflow greater than 20 m/s in the Northern Hemisphere, the westerly wind belt shows pronounced alternative fluctuation characteristics. Among them, the westerly wind belt has a high amplitude value in the north and a low amplitude value in the south. This is the “north ridge–south trough” fluctuation. This is consistent with the disturbance wave of the westerly wind belt that describes the southward penetration of cold air and the north-upward intersection of warm and humid air. It is conducive to humidification of particulate matter, accelerates pollution mixing, and is conducive to the development of polluted weather (Zhao et al., 2003; Gao et al., 2005). As a result of this study, it had been predicted that on 1–2 October 2022, the air quality forecast for National Day will be severe haze weather, which was consistent with the actual situation.
Nesting the “natural weather cycle” process and the micro-scale hourly resolution air quality weather distribution can not only facilitate the prediction of late October 2022 (October 16–20) in advance but also improve the fineness of the predicted micro-scale process. The quantitative nesting of the classic “natural weather cycles” and micro-scale processes studied in previous studies is the key to the new technical approach.
In this study, high-resolution hourly data were used to quantify the nesting of spectral analysis for each latitude circle for 14 days from 25 September 2022 to 8 October 2022. In any latitude circle in the Northern Hemisphere, the values of the four latitude circles of 80°, 50°, 40°, and 20° N are taken to describe the situations of polar, mid-latitude, westerly wind belt, and low latitude, respectively, and find the average potential height (H) of each latitudinal circle 500 hPa and the deviation on each grid (H’).
Figure 5A shows the simultaneous comparison between the hourly changes in the PLAM index in Beijing’s meteorological conditions from October 2 to 8, 2022, during the 7-day “natural weather cycle” process of the 500 hPa and in the same latitude circle (40°N). Among them, in the “natural weather cycle” of 40° north latitude, the hourly distribution of cosine oscillation (H′) at a potential height of 500 hPa {it is represented by αk = f [cos (λ)] in the figure} and the hourly distribution of the Beijing PLAM index are calculated by Eqs 4, 6, respectively.
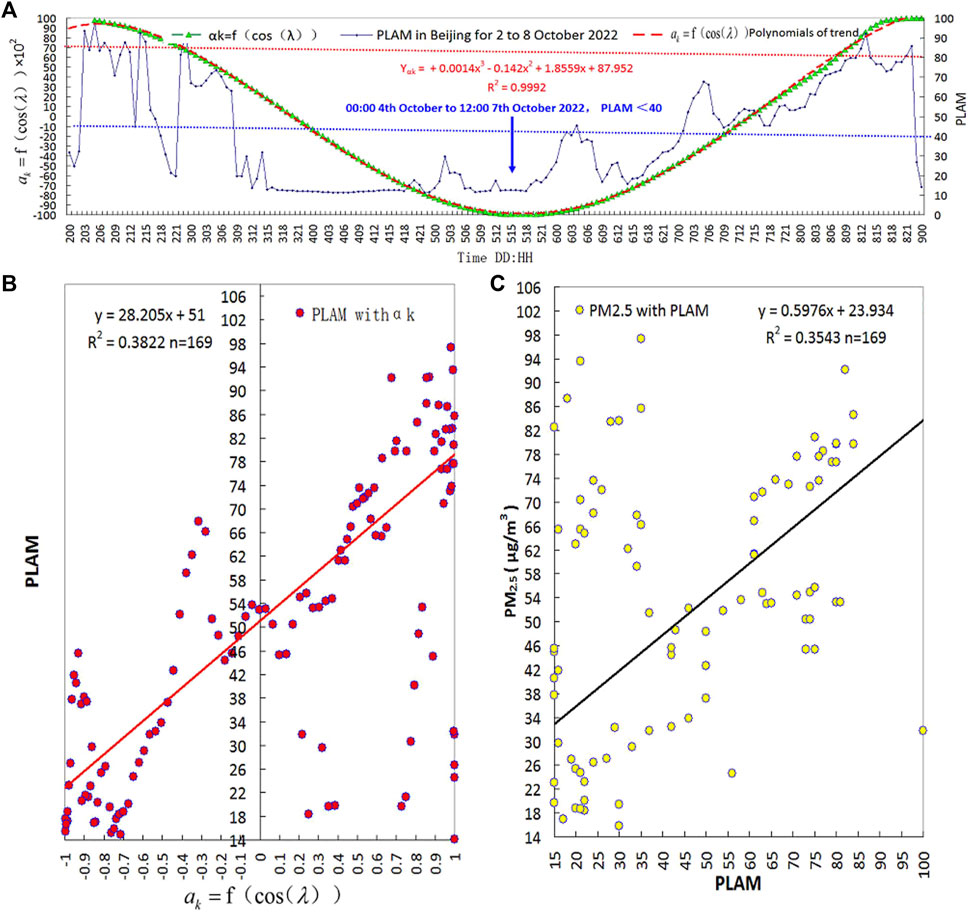
FIGURE 5. (A) Simultaneous comparison between the hourly change of the PLAM index (meteorological conditions) in Beijing from October 2 to 8, 2022, and the 7-day “natural weather cycle” process of the 500 hPa and in 40°N. (B,C) Correlation analyses between oscillation (H′) of a potential height of 500 hPa and PLAM index (B) as well as the PLAM index and PM2.5 concentration (C) during the “natural weather cycle,” respectively.
Using hourly resolution data, Figures 5B, C calculate the correlation between oscillation (H′) of potential height of 500 hPa and PLAM index (Figure 5B), as well as the PLAM index and PM2.5 concentration (Figure 5C), during the “natural weather cycle,” respectively. Figure 5 shows the following:
1) As shown in Figure 5A, the 7-day “natural weather cycle” process can describe the perturbation of the potential height of 500 hPa. The micro-scale disturbance of PM2.5 is consistent with the large-scale periodic disturbance change in the Northern Hemisphere. The PLAM index accompanying the pollution-related meteorological conditions appears within a 7-day period of the disturbance process. From October 4 to October 7, the hourly resolution of pollution meteorological conditions of PLAM was consistently maintained to a minimum value of less than 40, as shown by the blue dotted line and arrow in Figure 5A.
2) The cosine oscillation (H′) of the 500 hPa height field disturbance was represented by αk = f [cos (λ)] in the figure, as shown by its hourly distribution value and the polynomial curve of its trend line. The two are highly compatible and are represented by the green dot connection and the red dotted line in Figure 4A, respectively. This provides a quantitative basis for the hourly distribution prediction of the Beijing PLAM index and its nesting within the “natural weather cycle” process.
Therefore, further calculations from high-resolution observations confirm the practicality of the “natural weather cycle” principle. It is predicted that during the successive natural weather cycles starting on the eighth day of the future, air quality can be affected by highly favorable weather conditions between 13 and 16 October 2022 during the first 1–2 days of the cycle. Excellent air quality was predicted.
3) As shown in Figures 5B, C, the potential height oscillation (H’) of 500 hPa is positively correlated with the PLAM index (Figure 5B), as well as the PLAM index and PM2.5 concentration (Figure 5C) during the “natural weather cycle”; the correlation confirmation coefficient (R2) was 0.38 and 0.35, respectively. The correlation significance level exceeded 0.001. This shows the practicality of the consistent changes between large-scale periodic disturbance changes and micro-scale meteorological conditions changes in air pollution in the Northern Hemisphere, as confirmed by this study, helps to achieve early, quantitative, and granular prediction of air quality.
As shown in Figure 5, in the hourly high-resolution diagnostic mode, in the “natural weather cycle” from October 2 to 8, 2022, the disturbance low-pressure trough reached its lowest value at 15:00 on the fifth, as shown by the dotted line and blue arrow. Figure 6 shows the evolution of low-phase (λ) values with a pressure “trough” at 500 hPa during fluctuations of atmospheric wavenumber 4 in six “natural weather cycles” from September 10 to 15 October 2022. Figure 6 shows the following:
1) The evolution of the phase (λ) during the fluctuation of atmospheric wavenumber 4 in the “natural weather cycle” can quantify the movement of the weather system that matches the change in concentration of polluted aerosols. It quantifies the movement change of the low-value pressure system in the mid-latitude westerly wind belt. This facilitates the quantification in advance of micro-scale changes in the movement of weather systems that cause favorable or unfavorable aerosol pollution weather.
2) Figure 6 shows that the low-value barometric system shifted eastward during three consecutive “natural weather cycles” from September 25 to 15 October 2022. Among them, on October 1, Beijing was in front of the low-value pressure “trough” (115°E). It was in the warm and humid area in front of the disturbance system (cyclone). Polluted weather occurred in the Beijing area. PM2.5 reached 158. On October 8, Beijing was located behind the low-value air pressure “trough” (130°E). On October 8, the study provided real-time forecasts 8 days in advance. On October 16, Beijing’s air quality was forecast to be high. From October 16 to 20, Beijing’s air quality continued to be relatively high. From October 16 to 19, the forecast of the meteorological conditions index was 42, 21, 20, and 20, respectively. The air quality trend was forecast to be high in Beijing on October 16 and after October 16. It was further confirmed by this study that the practicality of the consistent changes between large-scale periodic disturbance changes and micro-scale meteorological conditions changes in air pollution in the Northern Hemisphere helps to achieve early, quantitative, granular prediction of air quality.
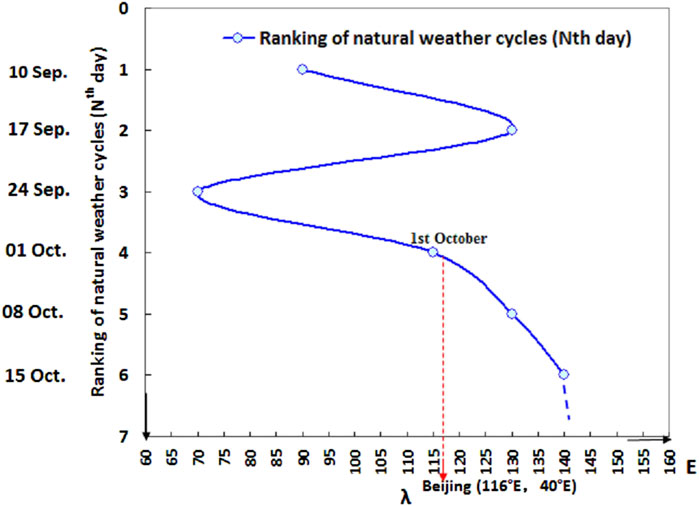
FIGURE 6. Evolution of the low-value phase (λ) (500 hPa pressure “trough”) for the fluctuations in atmospheric wavenumber 4 during the period of six “natural weather cycles” from 10 September to 15 October 2022.
In the “natural weather cycle” study, the uncertainty caused by the more qualitative analysis used in previous studies is the key to limiting the optimization of the method. For example, the forecast time is estimated to be 1–2 days, and the predicted element changes are expressed only in “positive and negative signs” (Zhang, 1959). The quantitative indicators of precursor signals considered in this study include 1) changing the law of diurnal variation (rising during the day and decreasing at night) and the height of the mixed layer decreasing continuously and falling by more than 100 m for three consecutive days, 2) the hourly resolution change of the PLAM index of polluted meteorological conditions accelerating, and 3) the super-saturation (S) change threshold reaching 6%–7%. These microphysical processes that affect air quality are often nested and constrained by large-scale weather processes. This helps to achieve the goal of making high-resolution hourly detailed air quality predictions in advance by capturing early (days or weeks) precursor signals nested in large-scale weather processes (Wang DY. et al., 2022).
Figure 7 shows the hourly “natural weather cycle” in Beijing from 2 to 31 October 2022 and the nesting effect of micro-scale (hourly) precursor signals in it. Table 1 shows the nested characteristics of the “natural weather cycle” and its micro-scale hourly precursor signals. This is shown in Figure 7 and Table 1.
1) As shown in Figure 2 of Section 4.1.2, the sun symbol ( ) represents the day, and the moon symbol (
 ) represents the night. There were significant diurnal changes in the Beijing PLAM index and pollution boundary layer height H from 1 September to 3 October 2022. These were calculated using Eqs 6, 8, respectively. During the day, and especially around noon, the boundary layer height H rises, and at night, the boundary layer height H decreases. The changes in PLAM value were opposite to the diurnal trend of boundary layer height H.
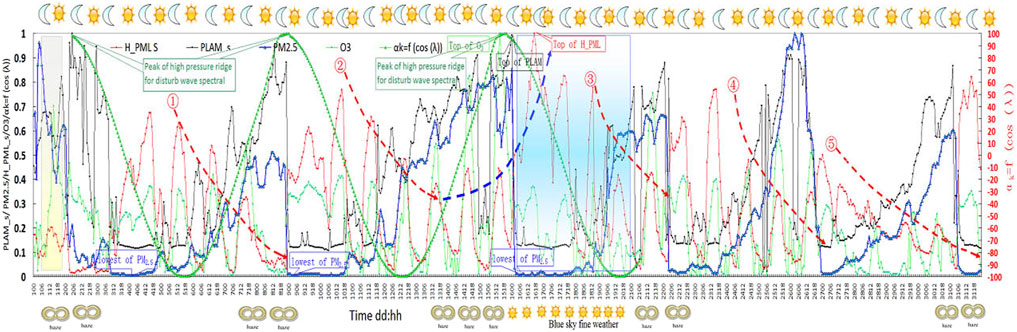
FIGURE 7. Nesting effect between the hourly “natural weather cycle” and microscale (hourly) precursor signal in Beijing from 2 to 31 October 2022.
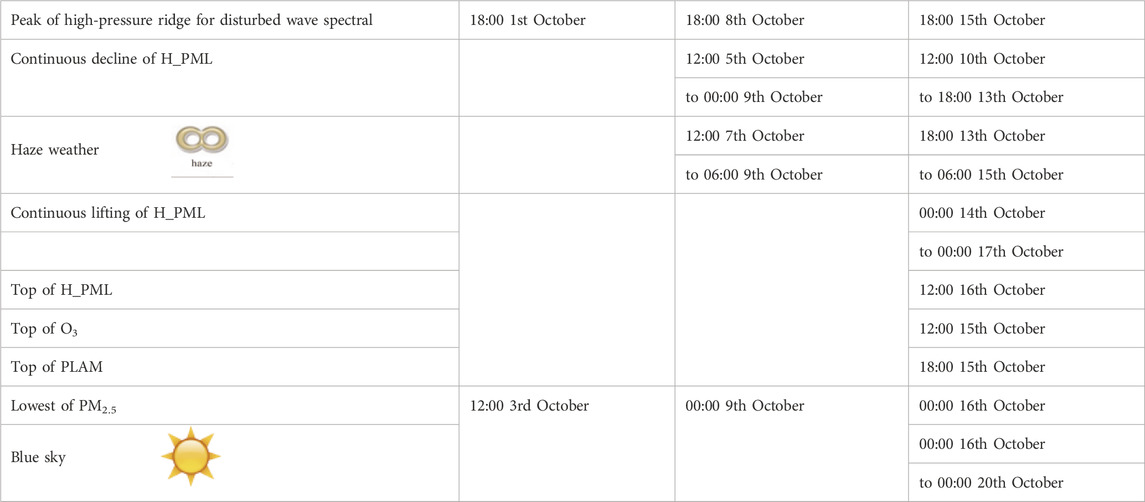
TABLE 1. Nested features of “natural weather cycles” and their micro-scale (hourly) precursor signals.
However, Figure 7 shows that the usual pattern of diurnal variation given in Figure 2 does not occur. Figure 7 shows the hourly change of the relevant features in October 2022. There were continuous five-decrease processes in boundary layer height (H) observed over several days, as shown by the red dotted dash lines in Figure 7. One process shows that the boundary layer height H also had a significant continuous rise. The peak of H appeared from 12:00 on the 13th to 00:00 on the 17th, and this is shown by the blue dotted dashed arrow in Figure 7. The significant continuous rise in H on this boundary layer height is one of the key precursor signals for the air quality forecast on 16 October 2022, the date of the opening ceremony. This is nested within the “natural weather cycle” signal, which becomes the pre-signal of the “transition weather change” (October 13–15) 96 h in advance. This strategic nesting of features at different scales is a key technique for accurate and fine prediction for observing large-scale trends in advance and describing more subtle changes consistent with their nesting. Table 1 shows nested features of “natural weather cycles” and their micro-scale hourly precursor signals.
2) For this research objective, the concept of the “natural weather cycle,” which has been quantified by the changes in αk = f [cos(λ)], is used to diagnose large-scale atmospheric cosine disturbances during and before meetings. As shown in Figure 7, 2 to 9, 9 to 16, and 16 to 23 October, 2022 were confirmed to be “natural weather cycles.” Each “natural weather cycle” lasted 7 days.
3) During the respective “natural weather cycles,” the peak of the barometric pressure disturbance ridge occurred at 18:00 on October 1, 18:00 on October 8, and 18:00 on October 15, respectively. The barometric pressure disturbance wave corresponded to the high-pressure ridge, which corresponded to the time period through Beijing. The lowest PM2.5 value occurred from 12:00 on October 3 to 18:00 on October 4, from 00:00 on October 9 to 18:00 on October 10, and from 00:00 on October 16 to 18:00 on October 17. The high level of air quality in Beijing was consistent, which coincided with the forecast period for high air quality in Beijing, including October 16 (Figure 7; Table 1).
4) Corresponding to the time periods in the natural weather cycle, a continuous decrease in H_PML was observed from 12:00 on October 5 to 00:00 on October 9 and from 12:00 on October 10 to 18:00 on October 13. Then, haze weather appeared after 48–72 h (see Figure 7; Table 1). This showed that as precursor signals, the quantitative indicators, including the early reduction of the height (H_PML) of the mixed layer, change of the PLAM index of pollution meteorological conditions, and change of hourly resolution of O3 concentration, all have fine consistent nesting effects with large-scale “natural weather cycles” (Figure 7; Table 1). This makes an important contribution to the early refinement and quantitative micro-scale fine prediction of air quality considering periodic changes. This indicates that the detailed distribution of air quality at hourly resolution has fine consistent nesting with large-scale “natural weather cycles” and, therefore, has provided high-precision predictability.
Using hourly data from October 2 to 8, the forecast of the PLAM index for the opening day of the 20th National Congress (October 16) was initiated using the nested method of the 7-day “natural weather cycle” given in this study. The forecast map of the hourly daily PLAM index changed from 16 to 19 days, and the forecast value of the PLAM index changed from 16 to 19 days, which were 42, 21, 20, and 20, respectively. The original forecast figure is shown in Figure 7A.
For comparative testing, live observation data extending to 00:00 on October 19 are shown in Figure 8B. As shown in Figures 8A, B, the live scenario of Beijing’s hourly PLAM, the nested prediction of pressure fluctuations {expressed in αk = f [cos (λ)]} in the natural cycle is consistent with the real situation. This shows that the nested method of large-scale “natural weather cycle” and hourly high-resolution accurate forecasting provides meaningful development prospects for making detailed forecasts in advance.
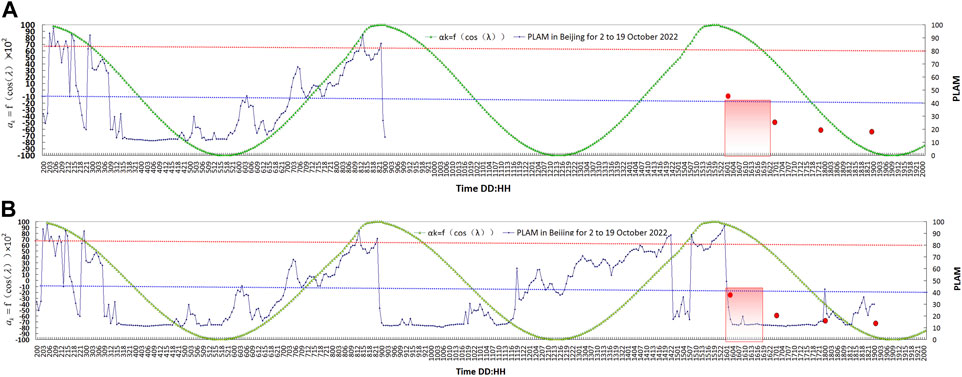
FIGURE 8. (A) Using the “natural weather cycle” nested method, the forecast of the PLAM index for the opening day of the 20th National Congress (October 16) launched on 8 October 2022 and the PLAM index forecast during the conference. (B) PLAM index forecast of the 20th National Congress opening ceremony and the conference (October 16–19) is compared with the actual situation. PLAM as high as 80 (red line) and low value of 40 (blue line) are marked in the figure, which is the indicating thresholds for air pollution and good air quality, respectively.
Figure 9A shows a live sea level weather map of China and the surrounding areas released by the Central Meteorological Office of the China Meteorological Administration at 00:00 on 1 October 2022. Figure 9B shows a live sea level weather map of China and the surrounding areas at 00:00 on 16 October 2022. Figure 9C shows the correlation between the hourly forecast for PLAM and PM2.5 in this study.
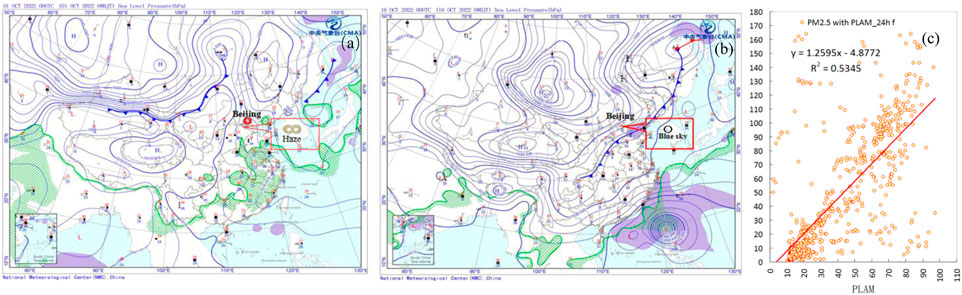
FIGURE 9. (A) Live sea level weather map of China and surrounding areas released by the Central Meteorological Office of the China Meteorological Administration at 00:00 on 1 October 2022. (B) Live sea level weather map of China and surrounding areas at 00:00 on 16 October 2022. (C) Correlation between the hourly forecast of PLAM and PM2.5 in this study.
The ultra-early prediction service of “large-scale public activities” should not only extend the timeliness of forecasting but also refine the forecast, which has entered the focus of science and interdisciplinary research on “predictability” of modern weather forecasting. Based on this theoretical concept, this study introduces new technologies and methods to meet the demand for weather forecast services in Beijing (including hourly resolution) in October 2022. Eq. 5 gives the PLAM index (
As shown in Figure 9, the forecast for severe haze pollution on October 1 (National Day) and the results for October 16 and October 16 to 19, including hourly PLAM forecasts for PM2.5, are consistent with the actual situation. Hourly fine forecasts were submitted 7–10 days in advance.
Figure 10 also shows that the consistency between prediction and actual observations of the nested method of micro-scale aerosol change and atmospheric disturbance wave-spectrum analysis is confirmed.
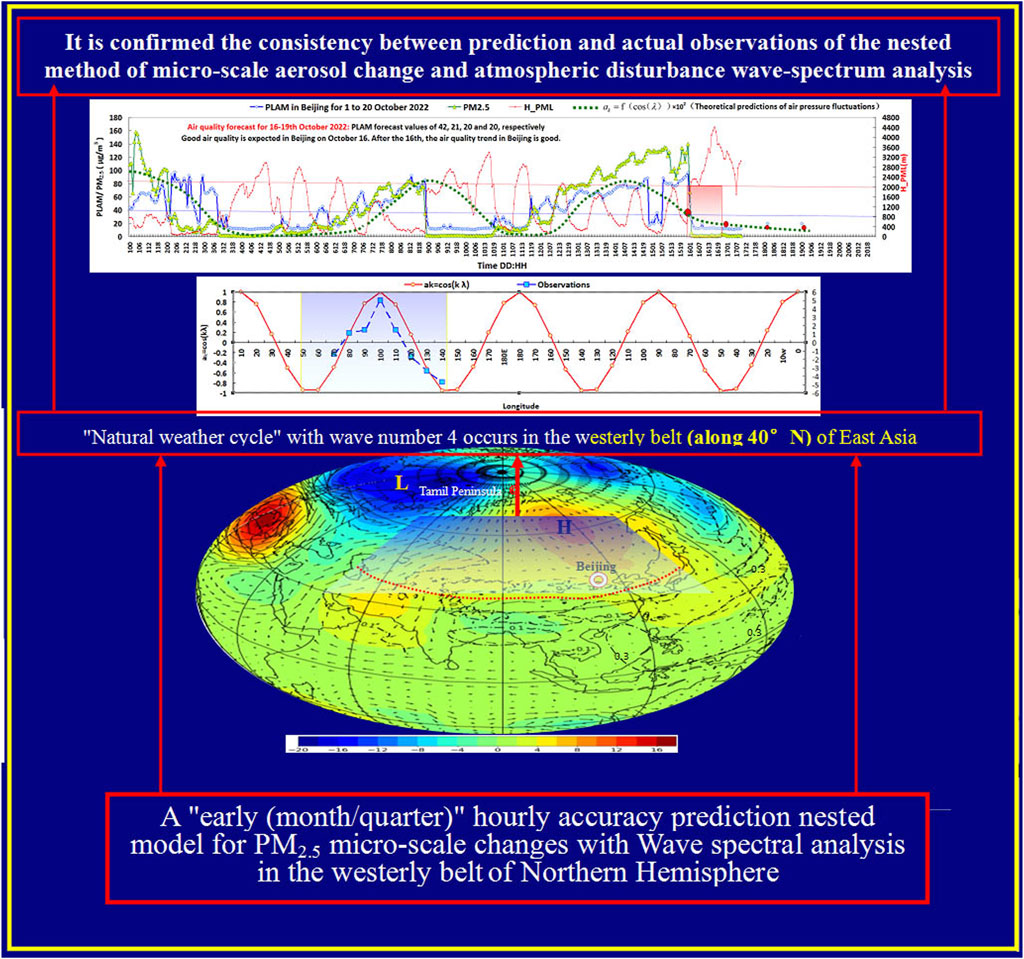
FIGURE 10. Conceptual pattern of the nested prediction model for PM2.5 micro-scale changes with wave spectral analysis in the westerly belt of Northern Hemisphere.
As shown in Figure 10, the results were as follows:
1) Based on high-quality big data, which includes the Northern Hemisphere, high temporal resolution data research accurate to the hour, and the development and establishment of a quantitative theoretical model of the “natural weather cycle,” spectral analysis algorithms are given. The diagnostic characteristics of spectral analysis of the “natural weather cycle” in the Northern Hemisphere are consistent with the observed reality. During the determined “natural weather cycle,” through wave spectral analysis, the amplitude and phase changes under different wavenumber conditions at different latitudes in the Northern Hemisphere could be quantitatively described. The activity of large-scale fluctuations in each latitude circle of the westerly belt in the Northern Hemisphere and the corresponding micro-scale with an hourly resolution of aerosol pollution could be obtained.
2) The diagnosis of atmospheric fluctuation was expanded in the westerly belt, and the transient characteristics of micro-scale aerosols (PM2.5 concentration) in Beijing and North China were grafted to the nested analysis and the diagnosis model of the “atmospheric fluctuation spectrum” in the westerly belt. Research has confirmed the usefulness of the “natural weather cycle” principle. It provides theoretical and practical application prospects for making hourly resolution monthly and quarterly forecasts in advance and establishing high-precision rolling predictions of air quality in 8–10 days.
3) The nested model of this study has shown that the wave oscillation (H′) of 500 hPa is positively correlated with the PLAM index and PM2.5 mass concentration during the nested multi-“natural weather cycle.” The relevant significance level exceeded 0.001. This study highlighted the prediction abilities of early quantitative fine prediction theory and practice of air quality. The forecast service on 1 October 2022, for the opening of the CCP 20th National Congress (16 October), and during the conference was successfully presented in real time. These results on hourly resolution high-precision air quality forecasting service show that rolling forecasts are continuously released 1 month in advance and 7–10 days in advance, and the nesting effect is constantly updated. The forecasts were consistent with reality.
4) The nested mode method of atmospheric spectrum analysis and micro-scale aerosol (PM2.5) distribution provides quantitative analysis and decision-making basis for business-oriented operations to remove technical difficulties. In the same way as sometimes relying on traditional weather map analysis, it is difficult to determine the instantaneous variability of air quality based on subjective vision.
The original contributions presented in the study are included in the article/Supplementary Material; further inquiries can be directed to the corresponding author.
DW, XZ, and JW designed the research and led the overall scientific questions. DW, YY, WJ, and JZ carried out data processing and analysis. WJ, YW, and YY assisted in program and software designing. DW and JW wrote the first draft of the manuscript, which was revised by XZ, YW, and YY. All authors contributed to the article and approved the submitted version.
This study was supported jointly by the NSFC Major Project (42090030).
The authors declare that the research was conducted in the absence of any commercial or financial relationships that could be construed as a potential conflict of interest.
All claims expressed in this article are solely those of the authors and do not necessarily represent those of their affiliated organizations, or those of the publisher, the editors, and the reviewers. Any product that may be evaluated in this article, or claim that may be made by its manufacturer, is not guaranteed or endorsed by the publisher.
Ackerman, A. S., Kirkpatrick, M. P., Stevens, D. E., and Toon, O. B. (2004). The Impact of humidity above stratiform clouds on indirect aerosol climate forcing. Nature 21, 1014–1017. doi:10.1038/nature03174
Allen, L., Robinson, R. G., and Sextro, W. J. F. (1997). Soil-gas entry into an experimental basement driven by atmospheric pressure fluctuations. Meas. Spectr. analysis, model Comp. 31, 1477–1485.
Browning, K. A., Hardman, M. E., Harrold, T. W., and Pardoe, C. W. (1973). The structure of rainbands within a mid-latitude depression. Quart. J. Roy. Meteor. Soc. 99, 215–231. doi:10.1002/qj.49709942002
Conner, L. H., and Higginbotham, H. (2013). “Natural cycles” in lay understandings of climate change. Environ. Change 23, 1852–1861. doi:10.1016/j.gloenvcha.2013.07.002
Gao, S. T., Zhou, Y. S., Lei, T., and Sun, J. H. (2005). Analyses on warm and humid weather in summer in Beijing and its dynamical identification. Sci. China 48, 128–137. doi:10.1360/05yd0387
Harrold, T. W. (1973). Mechanisms influencing the distribution of precipitation within baroclinic disturbances. Quart. J. Roy. Meteor.Soc. 99, 232–251. doi:10.1002/qj.49709942003
Holmboe, J., Forsythe, G. E., and Gustin, W. (1952). Dynamic Meteorology. London, UK: Third printing, 363.
Li, Y., Wang, W., Wang, J. Z., Zhang, X. L., Wang, L. L., and Yang, Y. (2011). Impact of air pollution control measures and weather conditions on asthma during the 2008 Summer Olympic Games in Beijing. Int. J. Biometeorology 55, 547–554. doi:10.1007/s00484-010-0373-6
Liu, L. K., Zhang, X. Y., Wang, J. Z., Yang, Y. Q., Jia, W. X., Zhong, J. T., et al. (2022). Changes in the height of the pollution boundary layer and their meteorological effects on the distribution of surface ozone concentrations. Front. Environ. Sci. 10, 1094404. doi:10.3389/fenvs.2022.1094404
Luo, H., Han, Y., Lu, C., Yang, J., and Wu, Y. (2019). Characteristics of surface solar radiation under different air pollution conditions over Nanjing, China: Observation and Simulation. Adv. Atmos. Sci. 36, 1047–1059. doi:10.1007/s00376-019-9010-4
Ren, D. X., and Lei, J. H. (2022). A long-range forecasting model for the thermosphere based on the intelligent optimized particle filtering. Sci. Chna, Earth Sci. 65, 75–86. doi:10.1007/s11430-021-9847-9
Shen, X. J., Sj, Y., Zhang, X. Y., Zhang, Y. M., Zhang, L., and Fan, R. X. (2016). Key features of new particle formation events at background sites in China and their influence on cloud condensation nuclei. Front. Environ. Sci. Eng. 10(5), 5. doi:10.1007/s11783-016-0833-2
Wang, D. Y., Wang, J. Z., Yang, Y. Q., Liu, L. K., and Zhong, J. T. (2022a). Study on the precursor signal capturing of unfavorable weather: Months/Years in advance to ultra-early forecast for hourly transient weather changes during the Beijing Winter Olympics. Adv. Meteorology 2022, 1–18. doi:10.1155/2022/1409229
Wang, D. Y., Wang, J. Z., Yang, Y. Q., Liu, L. K., Zhong, J. T., and Wang, Y. Q. (2021). Formation mechanism of heavy haze-fog associated with the interactions between different scales of atmospheric processes in China. Atmos. Pollut. Res. 12, 1–12. doi:10.1016/j.apr.2021.101085
Wang, J. Z., Gong, S., Zhang, X. Y., Yang, Y. Q., Hou, Q., Zhou, C. H., et al. (2012). A parameterized method for air-quality diagnosis and its applications. Adv. Meteorol. 2012, 1–10. doi:10.1155/2012/238589
Wang, J. Z., and Ji, L. D. (1981). The relationship between the oscillation of Ultra-long waves of the Northern Hemisphere and the outbreak of cold air. Sci. Atmos. Sin. 5, 424–432.
Wang, J. Z., Yang, Y. Q., Jiang, X. F., Wang, D. Y., Zhong, J. T., and Wang, Y. Q. (2022b). Observational study of the PM2.5 and O3 superposition-composite pollution event during spring 2020 in Beijing associated with the water vapor conveyor belt in the northern hemisphere. Atmos. Environ. 2022b 272, 118966. doi:10.1016/j.atmosenv.2022.118966
Wang, J. Z., Yang, Y. Q., Zhang, X. Y., Liu, H., Che, H. Z., Shen, X. J., et al. (2017). On the influence of atmospheric super-saturation layer on China's heavy haze-fog events. Atmos. Environ. 171, 261–271. doi:10.1016/j.atmosenv.2017.10.034
Yang, Y. Q., Wang, J. Z., Hou, Q., and Wang, Y. Q. (2009). A plam index for Beijing stabilized weather forecast in summer over Beijing. J. Appl. Meteorological Sci. (in Chinese) 20, 643–649.
Yi, Z. J., Zhao, C. H., Gu, J. Y., Yang, Q. G., Li, Y., and Peng, K. (2016). Why can soil maintain its endless eco-cycle? The relationship between the mechanical properties and ecological of soil. Science China Physics, Mechanics and Astronomy 59, 1–10. doi:10.1007/s11433-016-0217-2
Zhang, G. Z., Bian, L. G., Wang, J. Z., and Yang, Y. Q. (2005). The boundary layer chracteristics in the heavy fog formation process over Beijing adjacent areas. Sci. in China 48, 88–101. doi:10.1360/05yd0029
Zhang, J. J. (1959). The development of the long-term weather forecasting method of the Murtanovsky School. Acta Meteorological Sinica 30, 376–387.
Zhang, T., Che, H. Z., Gong, Z. Q., Wang, Y. Q., Wang, J. Z., and Yanqi, Y. Q. (2021). The dominant mechanism of the explosive rise of PM2.5 after significant pollution emissions reduction in Beijing from 2017 to the COVID-19 pandemic in 2020. Atmospheric Pollution Research 12, 272–281. doi:10.1016/j.apr.2020.11.008
Zhang, X. Y., Wang, Y. Q., Lin, W. L., Zhang, Y. M., Zhang, X. C., Gong, S., et al. (2009). Changes of atmospheric composition and optical properties over Beijing 2008 Olympic Monitoring Campaign. Bull. Am. Meteorol. Soc 90, 1633–1652. doi:10.1175/2009bams2804.1
Zhang, X. Y., Xu, X. D., and Ding, Y. H. (2019). Effects of changes in meteorological conditions from 2013 to 2017 on the decline of PM2.5 concentration in key areas of China. SCIENCE CHINA Earth Sciences, 1674–7240.
Keywords: wave spectrum analysis, natural weather cycle, nested model of air quality forecast, aerosol (PM2.5), precursor signals
Citation: Wang D, Wang J, Yang Y, Jia W, Zhong J, Wang Y and Zhang X (2023) Predicting air quality using a quantitative forecasting model of PM2.5 micro-scale variation nested with wave spectrum analysis. Front. Environ. Sci. 11:1232121. doi: 10.3389/fenvs.2023.1232121
Received: 31 May 2023; Accepted: 06 July 2023;
Published: 02 August 2023.
Edited by:
Zhiyuan Hu, Sun Yat-Sen University, ChinaReviewed by:
Qianrong Ma, Yangzhou University, ChinaCopyright © 2023 Wang, Wang, Yang, Jia, Zhong, Wang and Zhang. This is an open-access article distributed under the terms of the Creative Commons Attribution License (CC BY). The use, distribution or reproduction in other forums is permitted, provided the original author(s) and the copyright owner(s) are credited and that the original publication in this journal is cited, in accordance with accepted academic practice. No use, distribution or reproduction is permitted which does not comply with these terms.
*Correspondence: Jizhi Wang, anp3YW5nQGNtYS5nb3YuY24=
Disclaimer: All claims expressed in this article are solely those of the authors and do not necessarily represent those of their affiliated organizations, or those of the publisher, the editors and the reviewers. Any product that may be evaluated in this article or claim that may be made by its manufacturer is not guaranteed or endorsed by the publisher.
Research integrity at Frontiers
Learn more about the work of our research integrity team to safeguard the quality of each article we publish.