 Huadeng Wu
 Ying Zhou
 Yongmei Qian5
94% of researchers rate our articles as excellent or good
Learn more about the work of our research integrity team to safeguard the quality of each article we publish.
Find out more
ORIGINAL RESEARCH article
Front. Earth Sci., 13 January 2023
Sec. Structural Geology and Tectonics
Volume 11 - 2023 | https://doi.org/10.3389/feart.2023.1091785
This article is part of the Research TopicMeasuring, Modeling and Predicting the Seismic Site EffectView all 20 articles
In an effort to investigate the attenuation characteristics and site effects in eastern Guangdong, 659 strong-motion recordings received by 27 stations were selected for spectral analysis to separate path attenuation, site effects and source spectra. The path attenuation curves are generally close to the simplest form of distance decay described by R−0.5, and decays the slowest at a frequency of 4 Hz. We decomposed the path attenuation into a combination of geometric spreading and inelastic attenuation. The geometric spreading R−0.15 exhibits a slower distance decay at local distances, indicating that the seismic energy close to the epicenter is not easily dissipated. The quality factors were regressed as Qs(f) = 114.81f.922 in the frequency range .9–20 Hz, lower than those reported for the whole Guangdong region, indicating stronger anelastic attenuation in eastern Guangdong. The site responses in eastern Guangdong show a strong correlation with geological and geotechnical characterization. The stations located in the central mountains have higher predominant frequencies (>10 Hz) accompanied by smaller site amplifications. Larger site amplification is in the southeast coastal area (i.e., Shantou area), where the surface is covered with a thicker layer of soft soil and the predominant frequency of site is relatively low (∼2 Hz). The far-field earthquake will cause greater vibration and damage to this area.
The coastal area of South China is located in the twisted zone between the southeast margin of the Asian continental plate and the Pacific plate, with frequent seismic activities (Zhang et al., 2013; Shu et al., 2019). Guangdong Province lies in the middle of the seismic zone along the southeast coast, with higher terrain in the north. The altitudes of the mountains to the north of Nanling are more than 1,000 m, slope toward the continental shelf of the South China Sea to 100 m below sea level. The crustal thickness is thick in the north and thin in the south. The depth of Moho discontinuity in the northern Nanling mountains is about 35 km, the depth of that in the southern coast is about 33 km. The continental shelf is a crustal thinning zone of the continental margin, and the depth of the Moho surface is less than 20 km (Zhang et al., 2021). Since 1900, there were 13 large-scale events with magnitude larger than 6 occurred in Guangdong province, causing heavy economic losses and social security impact (Liu et al., 2003; He, 2020).
The eastern Guangdong refers to the region from the east of the Lianhuashan fault zone to the seaside, where sedimentary rocks, intermediate-acid volcanic rocks and granites of Mesozoic Jurassic are widely distributed (Wang J. et al., 2021; Yue et al., 2022). The coastal area of eastern Guangdong is closer to the Pacific seismic zone, and the possibility of strong earthquakes is higher than that of the Pearl River Delta and western Guangdong (Zhang, 2014; Xu et al., 2019; Li et al., 2021). Moreover, the geological tectonic fault zones in Guangdong Province tend to show east-west, northeast-southwest strike (Figure 1), and the region above the fault zone has a greater probability of earthquakes (Jia et al., 2020). The eastern Guangdong is the most seismically active region in Guangdong Province, and has experienced two major earthquakes, the 1067 Chaozhou M63/4 earthquake and the 1918 Nanao M7.3 earthquake (Xie 1992; Zhang et al., 2008).
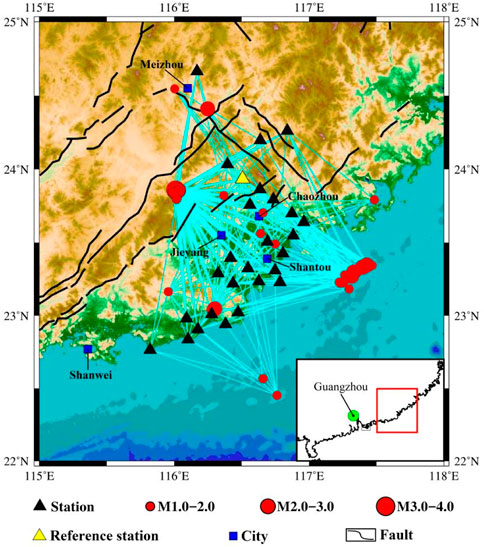
FIGURE 1. The locations of earthquakes (red circles) and stations (triangles) used in this study. The yellow triangle indicates the location of reference station FSLHX. The black discontinuous solid lines represent the faults. The cyan lines denote the propagation path from events to stations. The small scale map in the southeast shows the location and scope of the study area.
As an efficient and comprehensive method of ground motion spectrum analysis, the generalized inversion technique (GIT) has been applied and improved for more than 30 years. The earliest method used a linear model (Andrews, 1986), which defined the propagation path as a linear attenuation function inversely proportional to the hypocentral distance and assumed that the attenuation term was purely parametric. Iwata and Irikura (1988) put forward the concept of quality factor, in which the attenuation was defined as two parts: the geometric spreading model related to distance and the inelastic attenuation model related to frequency, which was later called the parametric method and widely used in regional seismic characteristics research, such as the Longmenshan region (Ren et al., 2013), the Kanto Basin in Japan (Kawase and Matsuo, 2004; Tsuda, 2010; Nakano et al., 2015), the northern Italy (Pacor et al., 2016), the Uttarakhand Himalayan in India (Sharma et al., 2014), Christchurch and Wellington in New Zealand (Ren YF. et al., 2018). In fact, the material in the Earth is heterogeneous and anisotropic, and when there is a gradient in the velocity structure of the crust, the distance-dependent attenuation of seismic wave is more complex than the prespecified geometric spreading. Therefore, the solved quality factor may be abnormally large or negative in some frequency bands, which does not conform to the objective situation (Oth et al., 2008). Castro (1990) proposed a non-parametric spectral analysis method with an independent attenuation model, which uses discrete variables related to distance to represent the attenuation characteristics of seismic waves of different frequencies in the medium to obtain reliable attenuation. Bindi et al (2004) used this method to study the distance correlation and frequency correlation of the attenuation curve of Umbria-March earthquake sequence. Oth et al. (2008) improved the method to obtain multiple sets of data set results at the same time. Picozzi et al. (2017) then used genetic algorithms and neural networks on this basis to obtain more accurate source parameters. Then the method is widely used in the study of regional seismic characteristics (Ahmadzadeh et al., 2017; Jeong et al., 2020).
The strong-motion observation shows that the site conditions have great influence on the ground motion. With the deepening of research on strong-motion recordings and seismic safety assessment of engineering sites for major infrastructure, site research based on strong-motion data has become more comprehensive, such as terrain effects (Ren Y. F. et al, 2018; Fu et al., 2019), basin amplification (Wang et al., 2021b; Wang et al., 2022), site parameter estimation of (Zhang et al., 2022), site non-linear evaluation index (Ji et al., 2020), etc. In our study, the generalized inversion method is used to analyze the site effect. There are 111 seismic stations operating in the Guangdong Seismographic Network. The average distance between stations is about 54 km, which is widely distributed throughout the province for seismic data analysis and processing. In addition, Guangdong province also operates 78 earthquake early warning stations, 74 of which are established in eastern Guangdong, to monitor the characteristics of seismic waves and achieve early warning (Lin et al., 2020). Over the years, these stations have collected a lot of valuable recordings and attracted many scholars to study the characteristics of ground motion. However, previous studies were mostly focused on the whole Guangdong province (Huang et al., 2003; Xiong et al., 2020), or mainly on the Xinfengjiang reservoir area (Ye et al., 2016; Wang S. et al., 2018), and there were few studies on the ground motion characteristics in the eastern Guangdong, such as attenuation characteristics and site response. In this study, the spectral analysis was applied to the strong-motion recordings of a series of small earthquakes recorded at 27 stations in eastern Guangdong (distributed in Figure 1). The attenuation characteristics in the region, including geometric spreading and anelastic attenuation, were first systematically investigated. The site conditions and parameters of 27 stations were estimated from the borehole data and the inverted site responses, and were further used to study the site characteristics of eastern Guangdong. This study provides reference for the siting of engineering and the seismic ground motion parameter zonation, and is of great significance for disaster prevention and mitigation in eastern Guangdong.
More than 900 strong-motion recordings were employed in this study, which are recorded from 27 strong-motion stations located in the eastern region of Guangdong Province (115°∼118° E, 22°∼25° N), China. These recordings are obtained from a series of small-scale events that occurred between January 2020 and January 2022, all but one (with a magnitude of M 3.7) of which had magnitudes below M 3.0. In spectral analysis, the S-wave of the entire waveform was applied. However, due to the small scale of the events, it is easy to make mistakes in the identification of S-wave, so we limited the maximum hypocentral distance to 120 km to minimize the interference caused by surface waves in the S wave (Ren YF. et al., 2018; Zhou et al., 2022a).
We initially manually eliminated recordings that were not available, such as incomplete recordings in three channels, apparent bad track in the channels, and the absence of P-wave or noise components in the recordings. After manual processing, baseline correction was performed on the remaining recordings. The high-cut corner frequency (fhc) was uniformly set to 25 Hz, while the low-cut corner frequency (flc) was determined according to the signal-to-noise ratio (SNR) results of each recording. The calculation of SNR requires the extraction of the S-wave window and the Pre-P wave noise window of the same length as S-wave window. The arrivals of the P- and S-wave were identified as the abruptly increased point in the Husid plot (Husid, 1967), and the end of the S-wave was calculated by the energy method proposed by Pacor et al. (2016), which is related to the distance between the source and site. The end of the Pre-P wave noise window was set to 1.0 s before the P-wave onset. The SNR and flc of the recordings are shown in Figure 2. Figure 2A shows the SNR results of more than 900 recordings considered in this study, and more intuitively the SNR results of each recording in frequency domain are shown in Figure 2B. On the whole, the SNR results increased with the increase of frequency, but decreased when the frequency reached 20 Hz, indicating that the SNR results were more stable in the middle frequency band (∼2–15 Hz). It should be noted that the SNR results are warped at low frequency, probably due to the large amount of noise component contained in the waveform. Figure 2C indicates a distribution of flc determined according to the SNR result, there are 88 recordings with flc of .1 Hz, and the rest are evenly distributed between .25 and 4 Hz.
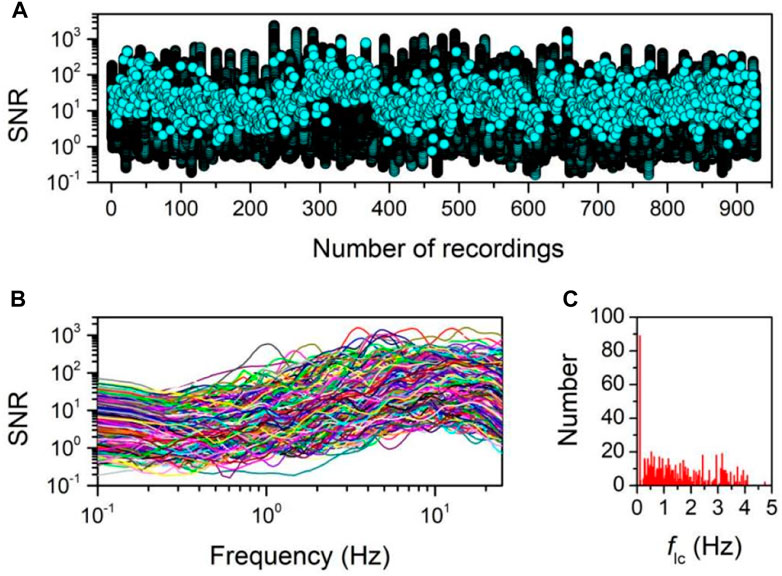
FIGURE 2. (A) The SNRs of the recordings considered in this study. (B) SNRs of each recording in frequency domain. (C) Histogram distribution of flc determined according to SNR.
The results of flc are used to perform a fourth-order Butterworth band-pass acausal filter in frequency domain (Zhou et al., 2022a). A cosine taper of 10% S-wave length was added to both ends of the extracted S-wave to eliminate truncation errors (Wang H. W. et al., 2018; Zhou et al., 2022b). The Fourier amplitude spectrum (FAS) of S-wave was calculated and smoothed by using the window function of Konno and Ohamachi with parameter b = 20. Using SNR as a measure of data quality (Wang et al., 2019; Wang et al., 2021b), our inversion uses a threshold of SNR = 3 (Oth et al., 2011; Jeong et al., 2020). When the frequency points with SNR <3 account for more than 15% of the total frequency points (i.e., the SNR passing rate of the recording is less than 85%), the recording was considered to be of poor quality and would be abandoned in the inversion. Figure 3A shows the available frequency band determined according to the filter and SNR. The flc and fhc of the illustrated recording in Figure 3A are 1.02 and 25 Hz, and the spectra are usable (gray shaded areas) at a frequency range from 1.25fhc to flc/1.25 (Abrahamson et al., 1997). The number of usable spectra at each frequency point are shown in Figure 3B. When the frequency is lower than 1 Hz, the number of usable spectra is less than half of the corresponding total number. To ensure the stability of the inversion results, each selected event should be recorded by at least four stations, and each station should collect at least four recordings.
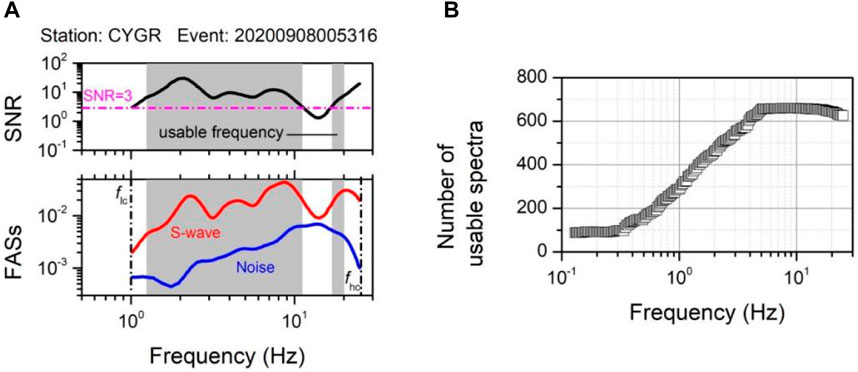
FIGURE 3. (A) The Fourier amplitude spectra for the exacted S-wave (red solid line) and the noise (blue solid line), and the corresponding SNR (dark solid line). The gray shaded areas indicated the usable frequency for inversion. (B) The number of usable spectra at each frequency.
In total, 659 strong-motion recordings from 67 events recorded at 27 strong-motion stations were assembled in the data set used for the inversion. The locations of earthquake epicenters and strong-motion stations considered in this study are shown in Figure 1. Figure 4 shows the magnitude and PGA distributed with distance of the recordings used for inversion. It was found that the PGAs were small, all of which were less than 10 gal, and tended to decrease with the increase of hypocentral distance. Twenty-four recordings were collected from event with magnitude of M 3.7, and the rest were obtained from events with M < 3. Although the scale of the events were small, resulting in the hypocentral distance of most recordings being within 100 km, it was sufficient to contribute a comprehensive coverage of the propagation path in the study area.
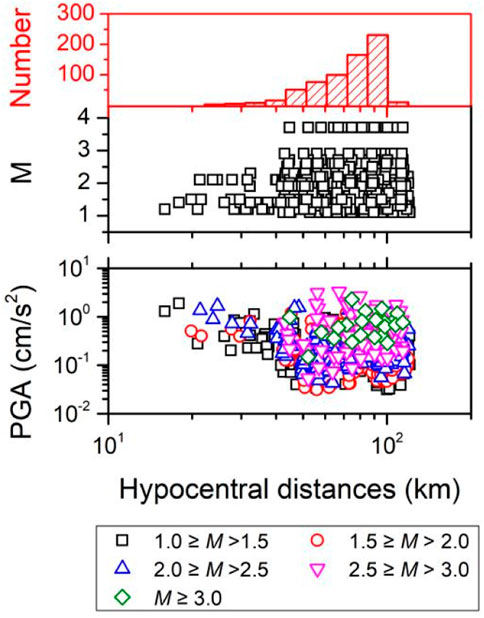
FIGURE 4. Distribution of magnitude and PGA vs. Hypocentral distances of recordings used for inversion. The red histogram is the cumulative distribution of Hypocentral distances.
In the frequency domain, we separated the S−wave of the observed spectral amplitude into source spectra, path attenuation, and site effect by using a one−step non−parametric generalized inversion technique (GIT) which was first proposed by Andrews (1986) and improved by Oth et al. (2011) in 2011. The propagation mechanism of seismic waves can be considered as the convolution of the above three contributions in the time domain and can be converted to the product in the frequency domain. After performing the natural logarithm operation, it can be transferred into a linear superposition in Eq. 1.
Where i represents the number of events and j represents the number of stations, in this study, i = 1,2…67, j = 1,2…27. O(f,Mi,Rij) represents the acceleration Fourier spectrum with frequency f obtained at the j-th station resulting from the i-th earthquake with magnitude Mi. Rij is the hypocentral distance, S(f, Mi) accounts for the source acceleration spectrum of the i-th event, and G(f) is the site response of the j-th station. A(f,rij) is the attenuation term, which is a ground motion function estimated by distance, and is used to represent the attenuation characteristics of seismic waves at different frequencies in the propagation medium, including geometrical spreading, anelastic and scattering attenuation and all other factors leading to path attenuation. It is generally accepted that the amplitude of seismic waves is negatively correlated with the distance. Meanwhile, for the inelastic property of shallow crust, A(f,rij) should satisfies the following two assumptions: 1) A(f,rij) does not have any parametric functional form, and it is only constrained to be a smooth function of distance; 2) There is no path attenuation within the reference distance R0 (the reference distance is the minimum hypocentral distance of the considered recordings, which is 15.97 km in this study), that is, r = R0, the constraint of A(f,rij) is 1.0, independent of frequency. We adopt two weight coefficients, ω1 and ω2, to realize the assumptions of A(f,rij), which are expressed in the matrix as follow:
where, RBin is the minimum operation distance bin. In order to reflect the complex propagation characteristics, RBin should better as small as possible, while at the same time, it is necessary to ensure that there are enough available records in each bin. According to the distance distribution of records, RBin is taken as 3 km, and the hypocentral distances of the usable spectra at a frequency were divided into ND bins. ω1 specifies the attenuation of A(f,rij) from the reference distance and ω2 constrain the smoothing characteristics of A(f,rij). After a lot of trial calculations, ω1 and ω2 are set as 20 and 500, respectively.
Equation 2 can be solved by using the singular value decomposition (SVD) method (Lawson and Hanson, 1974). However, there is an unconstrained degree of freedom in I × J matrix. It can be removed by specifying at least one reference site (Bindi et al., 2017; Ren YF. et al., 2018; Zhou et al., 2022b; Fu et al., 2022) or event (Fletcher & Boatwright, 1991; Moya & Irikura, 2003; Wang H. W. et al., 2018). In order to eliminate the trade-off between source and site terms, the FSLHX station was selected as the reference site, which is located on the hillside near Yongshun bridgehead, Xianfeng village. As shown in Figure 5, the FSLHX station is located on a hillside with dangerous terrain, surrounded by trees and weeds, and bare rock can be seen on the surface without covering the soil layer, which indicates that FSLHX is an accurate bedrock observation station. Next, we focus on the Horizontal-to-vertical (H/V) spectral ratios of 50 records received from the FSLHX station, see Figure 6, where the dark solid line represents the mean of the H/V spectral ratios, and the cyan shaded area is the mean plus or minus one standard deviation. The mean of H/V spectral ratio curve is flat and small in amplitude when the frequency is less than 10 Hz, demonstrating the excellent quality of bedrock stations; Until the frequency is greater than ∼17 Hz, the slope of the curve becomes steep, showing obvious high-frequency amplification, which may be related to the orographic effect caused by the establishment of the FSLHX station on the hillside.
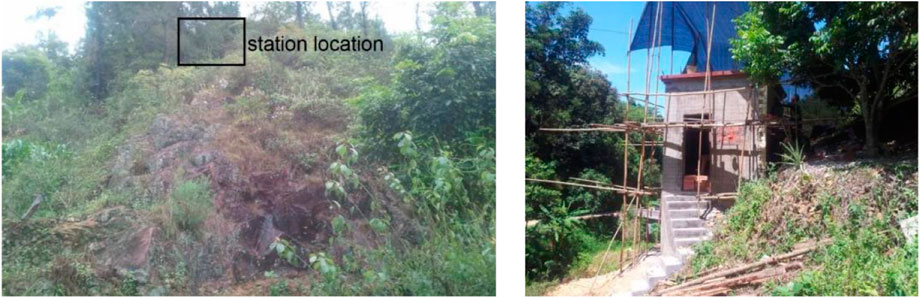
FIGURE 5. Site conditions and working environment of FSLHX station.
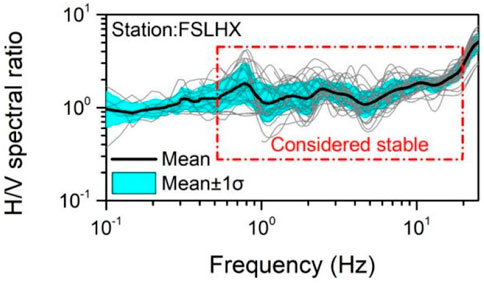
FIGURE 6. Horizontal-to-vertical (H/V) spectral ratios of the observed recordings at FSLHX station. The dark solid line and the cyan shaded area represent the mean and the range of mean plus or minus one standard deviation.
We obtained the path attenuation in the frequency range of .5–20 Hz in eastern Guangdong. The minimum hypocentral distance is 15.97 km (reference distance R0), and the maximum is 120 km. Taking 3 km as the minimum operation distance bin, it is divided into 36 bins from the minimum distance to the maximum distance. We calculated the path attenuation in each bin of different frequency, and the results are shown in Figure 7A. The points in these bins show a continuous decreasing trend with the increase of hypocentral distance. We divided frequencies from .5 to 20 Hz into six internals in log-average coordinates, .5–1.0 Hz, 1.0–2.0 Hz, 2.0–4.0 Hz, 4.0–8.0 Hz, 8.0–12 Hz, and 12–20 Hz. Among them, 4 Hz seems to be a turning point. When the frequency is lower than 4 Hz, the path attenuation becomes weaker with the increase of frequency, and when the frequency is higher than 4 Hz, the path attenuation becomes stronger with the increase of frequency. They are overall close to the simplest distance decay from described by R−0.5, lower at some frequencies but higher at some frequencies.
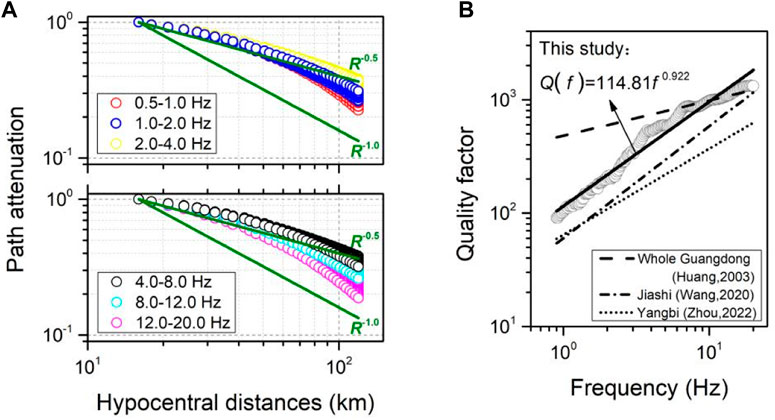
FIGURE 7. (A) .5–20 Hz path attenuation in eastern Guangdong. (B) .9–20.0 Hz frequency-dependent quality factor Q. Solid line represents the least squares regression curve, which is 114.81f.922. The dashed line, dash-dotted line and dotted line indicate the quality factors of whole Guangdong province, Jiashi and Yangbi, respectively.
As one of the important factors characterizing path attenuation, the quality factor Q(f) value was obtained with dependent frequency. The path attenuation can be described in terms of anelastic attenuation and geometric spreading, which can be expressed as,
Where βs is the assumed mean shear wave velocity of 3.55 km/s, n is the geometrical spreading exponent, which is obtained along with Q(f) by applying the least-square method to solve Eq. 3. We obtained n = .15, representing the weak geometrical spreading. The frequency dependent quality factor is expressed as a power exponential form of Q = Q0fη. We obtained the regression coefficients Q0 = 114.81 and η = .922 in the frequency range of .9–20 Hz, as shown in Figure 7B.
China is a country with high seismic hazard. In recent years, many moderate to large-scale earthquakes have occurred, attracting a large number of scholars to study the attenuation characteristics of seismic regions. Wang H. W. et al (2021) studied the intraregional attenuation characteristics of the Jiashi region in Xinjiang Province, and obtained the Q is 60.066f.988. They found that the attenuation of near-field ground motion propagation in the Jiashi region was slower, but the attenuation in the far-field was faster due to the strong inelastic attenuation. Huang et al (2003) studied the path attenuation of the whole Guangdong province. They assumed a three-stage attenuation model of geometric spreading and obtained a quality factor of 481.5f.31. Zhou et al (2022a) investigated the foreshock-mainshock-aftershock sequence of the Yangbi M 6.4 earthquake in 2021. The obtained Q was 64.27f.76, which was significantly lower than that of the whole Yunnan region, indicating the stronger anelastic attenuation in the Yangbi region than the whole Yunnan region. It is found that the Q values in Jiashi and Yangbi regions were small, indicating the ground motion in the region decayed faster, especially in the far field. The relatively large Q values in eastern Guangdong indicated that the ground motion attenuation is slow and the capacity to dissipation seismic energy is weak, which also reflects the high regional seismic hazard.
The site classification in our study was carried out in accordance with the relevant codes of the national standard of the People’s Republic of China, “Code for Seismic Design of Buildings” (GB50011-2010, 2010). According to the equivalent shear wave velocity (Vse) of soil and the thickness of overburden, sites can be classified according to Table 1.
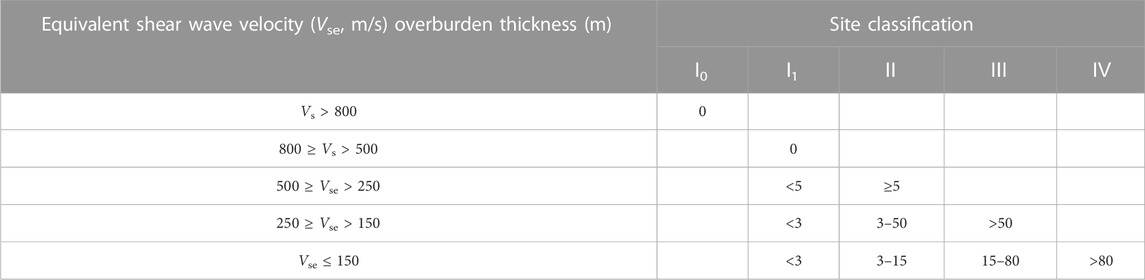
TABLE 1. The criteria for site classification.
According to the definition of site classification in the national standard GB50011-2010, 27 stations employed in our study are classified into five categories, including 1 Class-Ⅰ0 site (uncovered rock), 4 Class-Ⅰ1 sites (soft rock or hard soil), 18 Class-Ⅱ sites (moderately hard soil), 2 Class-Ⅲ sites (deep or soft soil) and 2 Class-Ⅳ sites (very soft soil).
The equivalent shear wave velocity (Vse) is the average shear wave velocity in soil layer, which is defined by the principle that the propagation time of shear wave is constant from the surface to the calculated depth. It is obtained according to the condition that the time of seismic wave passing through the multi-layer soil layer within the calculated depth is equal to the time required to pass through a single soil layer. With the exception of the bedrock station FSLHX, the other 26 stations have detailed single-hole shear wave velocity reports, from which we calculated the Vse for the site. The specific Vse of each station can be found in Table 2. The small Vse of soil appears in the Chaoshan Basin near the coast of Nanao, which is a Quaternary neogenesis sedimentary basin. The south and southwest coasts of Chaoshan Basin are mountainous and hilly areas, with a larger Vse. Relatively soft sites such as Class-Ⅲ (CNCD and CADF) and Class-Ⅳ (CHFX and CHXN) stations are mainly located along the coast and have a large thickness of overburden. The overlay thickness of the station CADF is 55 m, and that of the other three stations is all above 100 m.
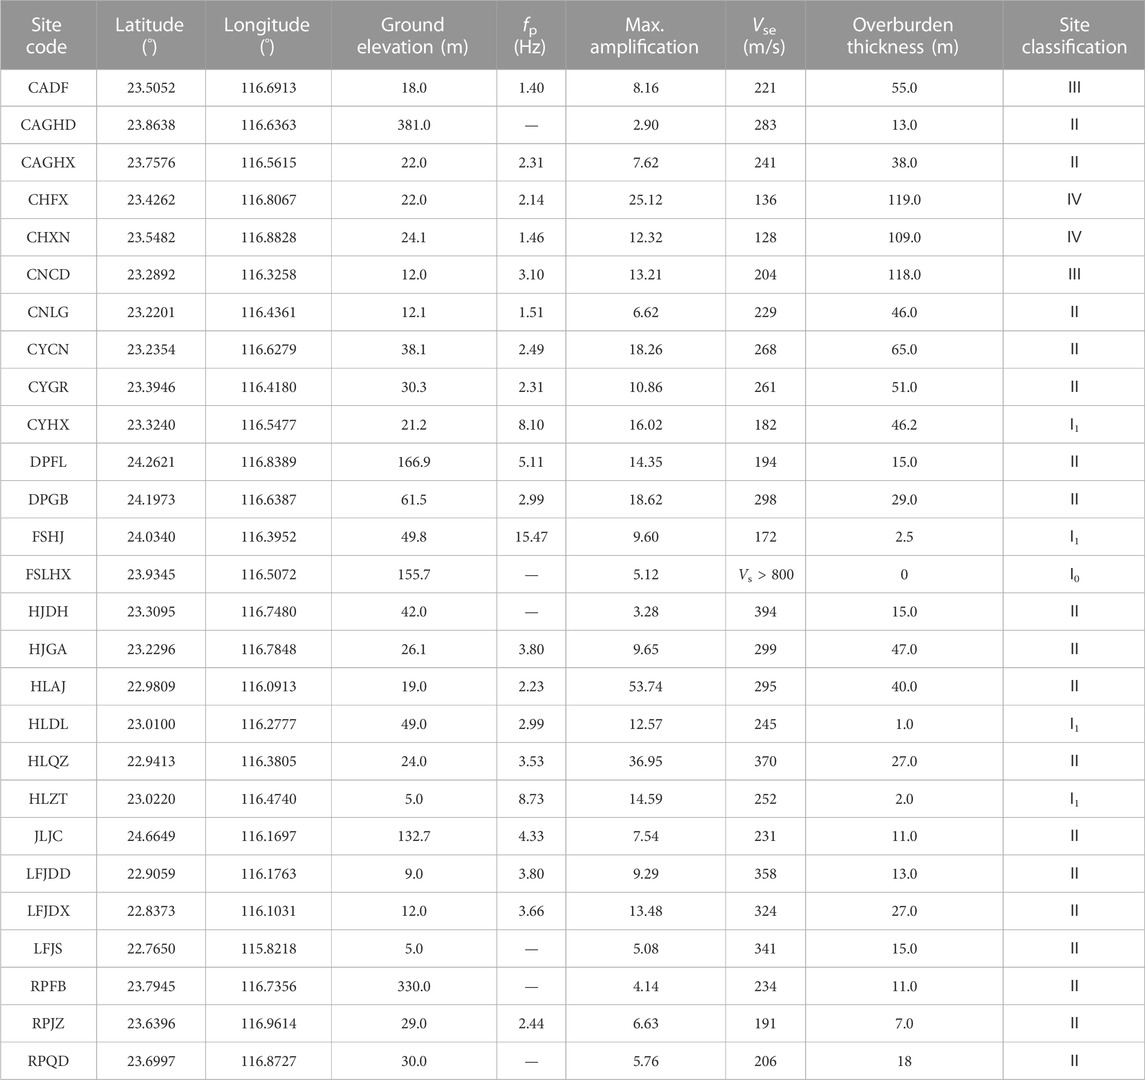
TABLE 2. Site conditions and calculated parameters at 27 stations.
We examined three sets of horizontal acceleration recordings recorded at stations FSHJ, FSLHX, and CAGHX, respectively (see Figure 8A), from the earthquake that occurred on 20 January 2020 (No. 20200120041711). This earthquake was the largest event in our study, with a magnitude of M 3.7 and an epicenter of 23.68°N and 116.01°E. The selection of these three recordings is mainly because the three stations have the same direction towards the event, and their hypocentral distances are relatively similar, which are 44, 52, and 58 km, respectively, to facilitate the elimination of path effect for comparative analysis. Among them, the station FSLHX is located on uncovered rock with a ground elevation of 156 m (see elevation distribution in Figure 10), and the two horizontal PGAs are .15 and .14 cm/s2, respectively. The station FSHJ is located on the northwest slope of station FSLHX, with a ground elevation of about 50 m. The station FSHJ is closest to event 20200120041711 among the three stations, so it has a relatively large horizontal PGAs of .97 and .96 cm/s2. The station CAGHX is located in a valley terrain with a ground elevation of 22 m The two horizontal PGAs are .49 and .35 cm/s2, which are between station FSLHX and station FSHJ.
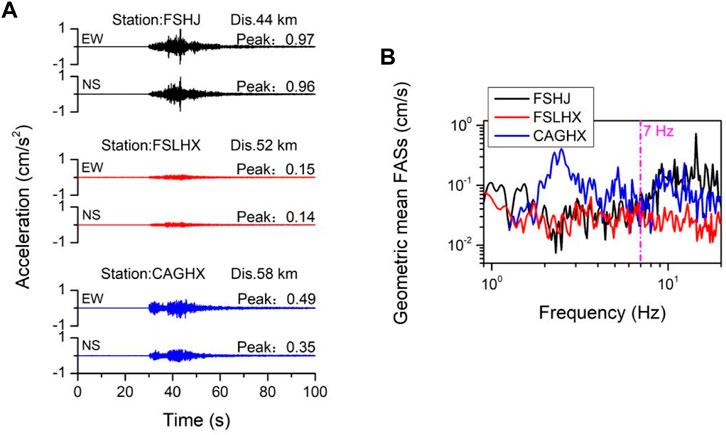
FIGURE 8. (A) Horizontal accelerations recorded by station FSHJ, FSLHX and CAGHX. (B) .9–20 Hz geometric mean Fourier amplitude spectrum of two horizontal components obtained by station FSHJ, FSLHX and CAGHX.
The .9–20 Hz geometric mean Fourier amplitude spectra of two horizontal components of three recordings are shown in Figure 8B. We found that the FAS of station FSLHX is flat and small at the whole frequency, indicating that the values obtained at each frequency of this bedrock station are relatively stable. What is interesting is that the amplitudes of stations FSHJ and CAGHX, which have the same large horizontal component, are quite different in the frequency domain. The FAS of station FSHJ is consistent with that of FSLHX when the frequency is lower than 7 Hz, and the amplitude of FAS began to increase when the frequency above 7 Hz, with a significant peak. The peak value of the FAS of station CAGHX appears between 2 and 3 Hz, and the amplitude decreases with the increase of frequency, especially in the high-frequency. This may be due to the strong attenuation of high-frequency motions caused by near-surface layer beneath station CAGHX (Guo et al., 2022). When the frequency is higher than 7 Hz, the amplitude is obviously smaller than that of FSHJ station, but still larger than that of FSLHX station.
This phenomenon is more intuitively reflected in the site response obtained by inversion of the three stations. Figure 9 shows the site responses of 27 stations employed in this study. The site response curve of station FSLHX is small and has no obvious peak value, which is consistent with the average value obtained from HVSR. The site response curve of station FSHJ has an obvious peak at 15.47 Hz, whose maximum site response is 9.60. It is generally believed that the site response of Class-Ⅰ1 site is small at low frequencies, and the predominant frequency (fp) often occurs at middle to high frequencies. The larger spike values of station FSHJ at such high frequencies may be due to the topographic effects of the location. Therefore, we investigated the geographical location and elevation distribution of the stations, and the results are shown in Figure 10. The curves in the figure represent elevation contour lines, and the numbers on each line indicate the height in meter.
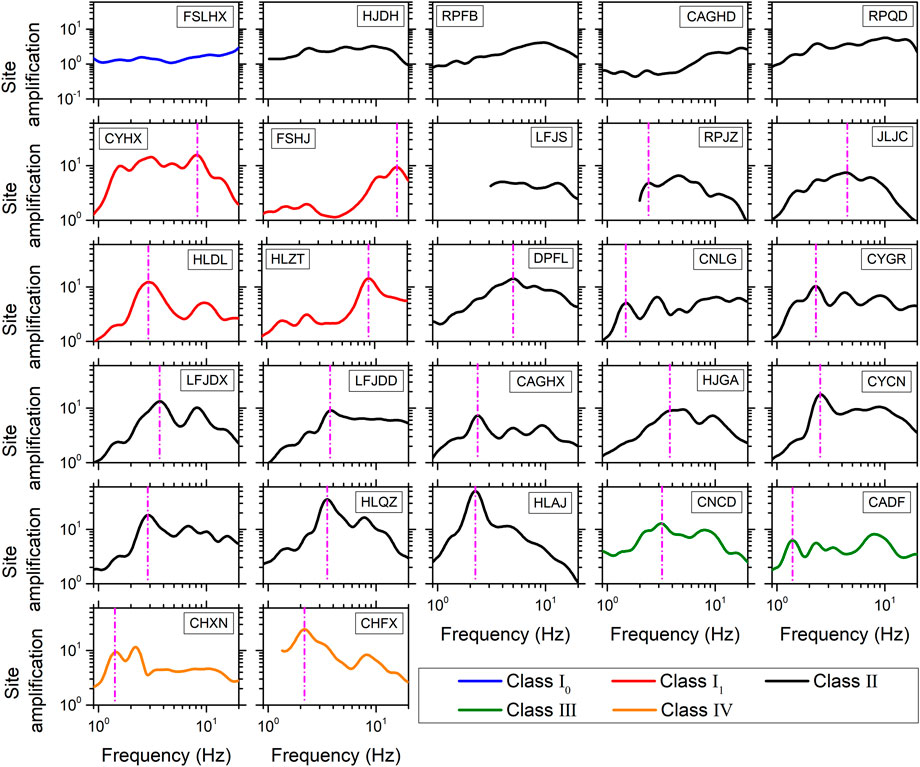
FIGURE 9. Inverted site responses of 27 stations employed in this study.
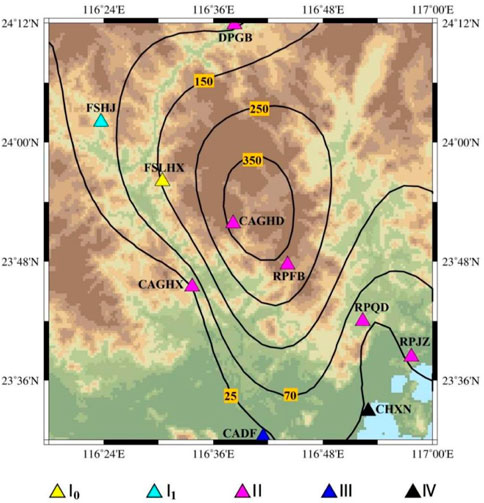
FIGURE 10. Geological conditions and elevation distribution of the stations. Yellow, cyan, pink, blue and black triangles represent sites classified as Class-Ⅰ0, Class-Ⅰ1, Class-Ⅱ, Class-Ⅲ, and Class-Ⅳ, respectively. The solid black lines indicate the elevation contour lines.
The geological conditions of the station FSHJ are mainly volcanic rocks and sub-volcanic rocks, whose texture is relatively soft in rocks. The rocks are covered with 2.5 m of soft soil and moderate soft soil. Moreover, the station is located in the foothills, exactly in the concave valley terrain, resulting in significant amplification at high frequencies. The station CAGHX is located on the edge of the mountain and hills, where the rock is covered from top to bottom with 13 m of moderate soft soil, 25 m of moderate hard soil and 13.5 m of hard soil. The site response of station CAGHX is more in line with the case of moderate soft soil, and there is obviously amplified at medium and low frequencies, that is, the maximum site response is 7.62 at 2.31 Hz.
Figure 11A shows the distribution of the predominant frequencies and site classification of 21 stations that can identify the predominant frequency. On the whole, the predominant frequencies tended to move to lower frequencies when the site classification ranging from Ⅰ to Ⅳ. In the case of site classification, Class-Ⅰ contains two subcategories, Ⅰ0 and Ⅰ1. The site response of station FSLHX of class Ⅰ0 was relatively flat, and the predominant frequency could not be clearly identified. However, the site response of station FSLHX tended to increase slowly with the increase of frequency, and the corresponding frequency of the maximum site response was already greater than 20 Hz, which was the highest among all stations. There are 18 Class-II stations, among which the predominant frequencies of 5 stations (CAGHD, HJDH, LFJS, RPFB, and RPQD) can not be identified. The site responses of these 5 stations are flat, and there are no obvious frequency correlation in amplification. Their overburden thickness range from 10 to 20 m, and the surface layer is mainly covered by hard soil and moderate hard soil. The predominant frequencies of the remaining 13 stations are basically less than 5 Hz, and the overburden thickness of most of them is greater than 25 m, the surface layer is covered with moderate soft soil and moderate hard soil. The predominant frequencies of Class-III and Class-IV stations are small (almost less than 3 Hz), but the amplification of Class-IV stations is significantly larger than that of Class-III stations. The predominant frequency distribution of stations are shown in Figure 11B. The frequency band range is indicated by different chroma bands. It should be noted that the distribution of predominant frequencies does not include the results of five stations that cannot identify the predominant frequencies. The higher predominant frequency is concentrated in the location of Class-I stations. The distribution of the site amplification in geographic coordinates is shown in Figure 11C. The larger amplification was seen mainly in the two Class-IV stations located on the east coast, which, conversely, had the lower predominant frequency. In general, the soil around Shantou is relatively soft, resulting in strong site amplification during earthquakes, especially the long-period (low-frequency) ground motion, which will cause greater damage to the area.
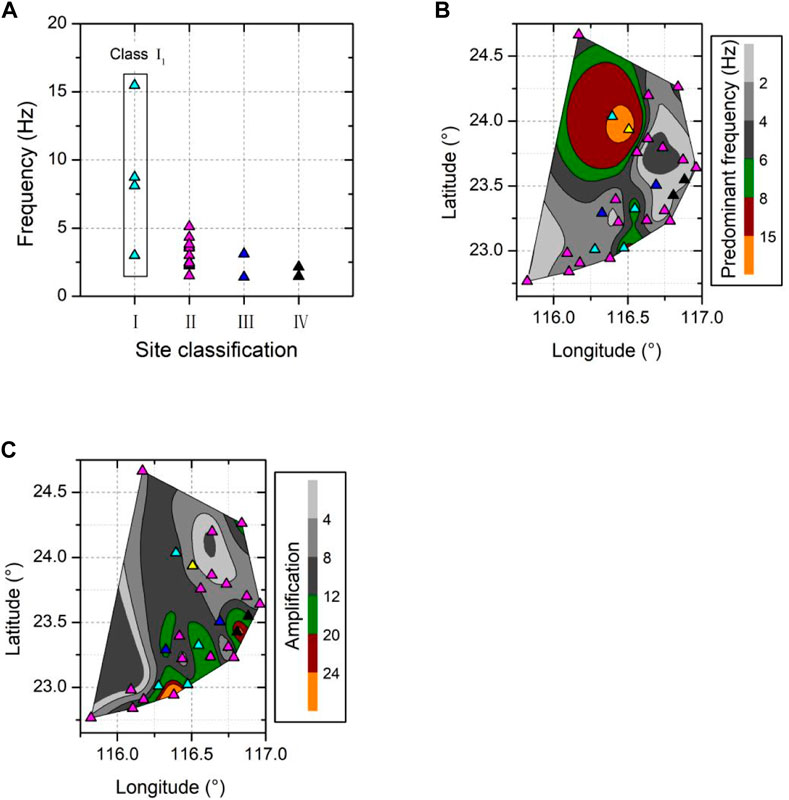
FIGURE 11. (A) Distribution of site classification vs. predominant frequency. (B) Predominant frequency distribution of stations. (C) Geographical distribution of site amplification.
The eastern Guangdong is the most seismically active region in Guangdong Province, which is distributed with geological tectonic fault zones that tend to strike east-west, northeast-southwest. A dense network of strong-motion stations has been set up in eastern Guangdong, providing sufficient information for seismic data analysis and processing. In this study, the one-step non-parametric generalized inversion technique was applied to 659 strong-motion recordings of 67 small events recorded by 27 stations in eastern Guangdong. The observation spectrum was separated simultaneously into source spectrum, path attenuation and site terms.
The inverted path attenuation curves are generally close to the simplest distance decay form described by R−.5. In frequency, the path attenuation also show some frequency dependence, i.e. the attenuation curve decays more slowly at higher frequencies when the frequency is below 4 Hz, while the opposite is true when the frequency is above 4 Hz. We further consider the geometric spreading and inelastic attenuation to briefly describe the complex path attenuation. In the frequency range of .9–20 Hz, the non-linear least squares regression receive a geometric spreading R−.15 and a quality factor Qs(f) = 114.81f.922. The Q value in eastern Guangdong are larger than those in the Yangbi and Jiashi regions, showing a weaker ability to dissipate seismic energy, indicating a higher seismic hazard in eastern Guangdong.
Site conditions and parameters for 27 stations were estimated from the borehole data and inverted site response, and were further used to investigate site characteristics, i.e., predominant frequency, amplification, equivalent shear wave velocity and site classification. Site responses in eastern Guangdong exhibited strong correlation with the geological and geotechnical characterization. The stations located in mountainous area have higher fundamental frequencies and smaller amplifications during earthquakes. The stations located along the coast, especially in Shantou area, have stronger amplifications and lower fundamental frequencies, indicating that the area will suffer greater damage in far-field earthquakes.
The original contributions presented in the study are included in the article/supplementary material, further inquiries can be directed to the corresponding author.
Conceptualization, YZ and HW; methodology, YZ, YQ, and FY; software, HW, YZ, GY, and GW; formal analysis, YZ, HW, and YZ; investigation, YZ, HW, and YQ; resources, HW, FY, and YZ; data curation, YZ, HW, and GY. All authors have read and agreed to the published version of the manuscript.
This work was supported by the Science for Earthquake Resilience of China Earthquake Administration (No. XH21023), the Science and Technology Planning Project of Guangdong Province (No. 2021B1111610008), and the Science and Technology Research Project of Jilin Provincial Department of Education (No. JJKH20230340KJ).
We would also like to thank three senior engineers, Wei Lin, Shukun Wu, and Zhujin Su, for their support in the data acquisition.
The authors declare that the research was conducted in the absence of any commercial or financial relationships that could be construed as a potential conflict of interest.
All claims expressed in this article are solely those of the authors and do not necessarily represent those of their affiliated organizations, or those of the publisher, the editors and the reviewers. Any product that may be evaluated in this article, or claim that may be made by its manufacturer, is not guaranteed or endorsed by the publisher.
Abrahamson, A. N., and Silva, W. J. (1997). Empirical response spectral attenuation relations for shallow crustal earthquakes. Seismol. Res. Lett. 68, 94–127. doi:10.1785/gssrl.68.1.941997
Ahmadzadeh, S., Parolai, S., Doloei, J., and Oth, A. (2017). Attenuation characteristics, source parameters and site effects from inversion of S waves of the March 31, 2006 Silakhor aftershocks. Ann. Geophys. 60 (6). doi:10.4401/ag-7520
Andrews, D. J. (1986). Objective determination of source parameters and similarity of earthquakes of different size. Geophys. Monogr. Ser. 37, 259–267.
Bindi, D., Castro, R., Franceschina, G., Luzi, L., and Pacor, F. (2004). The 1997–1998 umbria-marche sequence (central Italy): Source, path, and site effects estimated from strong motion data recorded in the epicentral area. J. Geophys. Res. 109 (B04312). doi:10.1029/2003jb002857
Bindi, D., Spallarossa, D., and Pacor, F. (2017). Between-event and between-station variability observed in the fourier and response spectra domains: Comparison with seismological models. Geophys. J. Int. 210 (2), 1092–1104. doi:10.1093/gji/ggx217
Castro, R. R., Anderson, J. G., and Singh, S. K. (1990). Site response, attenuation and source spectra of S waves along the Guerrero, Mexico, subduction zone. Bull. Seismol. Soc. Am. 80 (6), 1481–1503.
Fletcher, J. B., and Boatwright, J. (1991). Source parameters of Loma Prieta aftershocks and wave propagation characteristics along the San Francisco peninsula from a joint inversion of digital seismograms. Bull. Seismol. Soc. Am. 81, 1783–1812.
Fu, L., Chen, S., Li, J., Zhang, L., Xie, J., and Li, X. (2022). Regional spectral characteristics derived using the generalized inversion technique and applications to stochastic simulation of the 2021 Mw 6.1 Yangbi earthquake. Bull. Seismol. Soc. Am., 1–23.XX
Fu, L., Li, X., Wang, F., and Chen, S. (2019). A study of site response and regional attenuation in the longmen Shan region, eastern Tibetan plateau, sw China, from seismic recordings using the generalized inversion method. J. Asian Earth ences 181 (1), 103887. doi:10.1016/j.jseaes.2019.103887SEP.
Gb50011-2010, (2010). Code for seismic design of buildings: GB50011-2010. Beijing, China: China Architecture & Building Press.
Guo, Z., Guan, M., and Chapman, M. C. (2022). Amplification and attenuation due to geologic conditions in the sichuan basin, central China. Seismol. Res. Lett, 1–15.XX.
He, P. (2020). Study of assessment method based on coupling factor of casualty in earthquake disasters in Guangdong area. Int. J. Comput. Syst. Sci. Eng. 2020 (3), 35.
Huang, Y. L., Zheng, S. H., Liu, J., Zhao, X. Q., and Kang, Y. (2003). Attenuation of ground motion and site response in Guangdong region. Chin. J. Geophys. 46 (1), 54–61.(in Chinese)
Husid, P. (1967). Gravity effects on the earthquake response of yielding structures. Pasadena, California: Report of Earthquake Engineering Research LaboratoryCalifornia Institute of Technology.
Iwata, T., and Irikura, K. (1988). Source parameters of the 1983 Japan sea earthquake sequence. J. Phys. Earth 36 (4), 155–184. doi:10.4294/jpe1952.36.155
Jeong, S. J., Stump, B. W., and Deshon, H. R. (2020). Spectral characteristics of ground motion from induced earthquakes in the fort worth basin, Texas, using the generalized inversion technique. Bull. Seismol. Soc. Am. 110 (5), 2058–2076. doi:10.1785/0120200097
Ji, K., Wen, R. Z., Ren, Y. F., and Dhakal, Yadab P. (2020). Nonlinear seismic site response classification using K-means clustering algorithm: Case study of the September 6, 2018 Mw6.6 Hokkaido Iburi-Tobu earthquake, Japan. Soil Dyn. Earthq. Eng. 128.paper ID: 105907
Jia, L. H., Mao, J. W., Liu, P., and Yu, M. (2020). Crust-mantle interaction during subduction zone processes: Insight from late Mesozoic I-type granites in eastern Guangdong, SE China. J. Asian Earth Sci. 192, 104284. doi:10.1016/j.jseaes.2020.104284
Kawase, H., and Matsuo, H. (2004). “Amplification characteristics of K-NET, KiK-net, and JMA Shindokei network sites based on the spectral inversion technique,” in 13th World Conference on Earthquake Engineering, Vancouver, Canada, August 2004.[J]1-6 Paper Number 454
Li, Y. H., Guo, L. T., and Yan, Y. X. (2021). Earthquake hazard evaluation of Huizhou fault and its adjacent area. Seismol. geomagnetic observation Res. 42 (1), 49–60.(in Chinese)
Lin, Q. X., Liang, M., Yang, X., and Jiang, X. J. (2020). The estimation of horizontal location ability for Guangdong Seismic Network. South china J. Seismol. 40 (4), 49–55.(in Chinese)
Liu, T. P., Yang, X. D., and Wang, Y. F. (2003). Seismicity features and seismic risk analysis in the near future in Guangdong and its neighboring region. South China J. Seismol. 23 (3), 35–40.(in Chinese)
Moya, A., and Irikura, K. (2003). Estimation of site effects and Q factor using a reference event. Bull. Seismol. Soc. Am. 93 (4), 1730–1745. doi:10.1785/0120020220
Nakano, K., Kawase, H., and Matsushima, S. (2015). Statistical properties of strong ground motions from the generalized spectral inversion of data observed by K-NET, KiK-net, and the JMA shindokei network in Japan. Bull. Seismol. Soc. Am. 105 (5), 2662–2680. doi:10.1785/0120140349
Oth, A., Bindi, D., Parolai, S., and Wenzel, F. (2008). S-Wave attenuation characteristics beneath the vrancea region in Romania: New insights from the inversion of ground-motion spectra. Bull. Seismol. Soc. Am. 98 (5), 2482–2497. doi:10.1785/0120080106
Oth, A., Parolai, S., and Bindi, D. (2011). Spectral analysis of k-net and kik-net data in Japan, part i: Database compilation and peculiarities. Bull. Seismol. Soc. Am. 101 (2), 652–666. doi:10.1785/0120100134
Pacor, F., Spallarossa, D., Oth, A., Luzi, L., Puglia, R., Cantore, L., et al. (2016). Spectral models for ground motion prediction in the L'aquila region (central Italy): Evidence for stress-drop dependence on magnitude and depth. Geophys. J. Int. 204, 697–718. doi:10.1093/gji/ggv448
Picozzi, M., Oth, A., Parola, S., Bindi, D., De, L., Amoroso, O., et al. (2017). Accurate estimation of seismic source parameters of induced seismicity by a combined approach of generalized inversion and genetic algorithm: Application to the geysers geothermal area, California. J. Geophys. Res. 2017
Ren, Y. F., Zhou, Y., Wang, H. W., Wen, R. Z., et al. (2018a). Source characteristics, site effects, and path attenuation from spectral analysis of strong-motion recordings in the 2016 kaikōura earthquake sequence. Bull. Seismol. Soc. Am. 108 (3B), 1757–1773. doi:10.1785/0120170290
Ren, Y. F., Wang, H. W., Xu, P. B., Dhakal, Yadab P., Wen, R. Z., Ma, Q., et al. (2018b). Strong-motion observations of the 2017 Ms7.0 jiuzhaigou earthquake: Comparison with the 2013 Ms7.0 lushan earthquake. Seismol. Res. Lett. 89 (4), 1354–1365. doi:10.1785/0220170238
Ren, Y. F., Wen, R. Z., Yamanaka, H., and Kashima, T. (2013). Site effects by generalized inversion technique using strong motion recordings of the 2008 Wenchuan earthquake. Earthq. Eng. Eng. Vib. 12, 165–184. doi:10.1007/s11803-013-0160-6
Sharma, J., Chopra, S., and Roy, K. S. (2014). Estimation of source parameters, quality factor (QS), and site characteristics using accelerograms: Uttarakhand himalaya region. Bull. Seismol. Soc. Am. 104 (1), 360–380. doi:10.1785/0120120304
Shu, L. S., Wang, J. Q., and Yao, J. L. (2019). Tectonic evolution of the eastern Jiangnan region, South China: New findings and implications on the assembly of the Rodinia supercontinent. Precambrian Res. 322, 42–65. doi:10.1016/j.precamres.2018.12.007
Tsuda, K. (2010). Inversion analysis of site responses in the kanto basin using data from a dense strong motion seismograph array. Bull. Seismol. Soc. Am. 100 (3), 1276–1287. doi:10.1785/0120090153
Wang, H. W., Ren, Y. F., Wen, R. Z., and Xu, P. B. (2019). Breakdown of earthquake self-similar scaling and source rupture directivity in the 2016–2017 central Italy seismic sequence. J. Geophys. Res. Solid Earth 124, 3898–3917. doi:10.1029/2018JB016543
Wang, H. W., Ren, Y. F., and Wen, R. Z. (2018a). Source parameters, path attenuation and site effects from strong-motion recordings of the Wenchuan aftershocks (2008–2013) using a non-parametric generalized inversion technique,path attenuation and site effects from strong-motion recordings of the Wenchuan aftershocks (2008-2013) using a non-parametric generalized inversion technique. Geophys. J. Int. 212, 872–890. doi:10.1093/gji/ggx447
Wang, H. W., Li, C. G., Wen, R. Z., and Ren, Y. F. (2022). Integrating effects of source-dependent factors on sediment-depth scaling of additional site amplification to ground-motion prediction equation. Bull. Seismol. Soc. Am. 112 (1), 400–418. doi:10.1785/0120210134
Wang, H. W., and Wen, R. Z. (2021b). Attenuation and basin amplification revealed by the dense ground motions of the 12 July 2020 MS 5.1 Tangshan, China, earthquake. Seismol. Res. Lett. 94 (2), 2109–2121. doi:10.1785/0220200400
Wang, H. W., Wen, R. Z., and Ren, Y. F. (2021a). Seismic ground motion simulation considering regional characteristics: A case study of the Jiashi Ms6.4 earthquake in 2020. Seismol. Geol. 43 (2), 430–446.(in Chinese)
Wang, J., Wang, L. M., Gong, F. Y., FanYing, G., Yan, W., ChengMing, W., et al. (2021c). Temperature and pressure conditions of dynamic metamorphism with its constraints on polymetallic mineralization of tungsten, tin and copper in Lianhuashan fault zone in eastern Guangdong Province. Acta Petrol. Sin. 37 (6), 1921–1932. doi:10.18654/1000-0569/2021.06.17(in Chinese)
Wang, S., Sun, X. L., Qin, J. L., et al. (2018b). Fine faults structure of Xinfengjiang water reservoir area from high-frequency ambient noise tomography. Chin. J. Geophys. 61 (2), 593–603.(in Chinese)
Xie, Y. S. (1992). Histortical seismicity of the offshore Fujian-Guangdong region. Acta Seismol. Sin. 5 (3), 635–646. doi:10.1007/bf02650557
Xiong, C., Ye, X. W., and Zhang, Y. X. (2020). Site response of Guangdong seismic stations and its influence on determination of earthquake magnitude. South China J. Seismol. 40 (4), 18–28.(in Chinese)
Xu, Q. J., Liu, S. F., Wang, Z. F., and Zhang, B. (2019). Provenance of the east Guangdong basin and yong’an Basin in southeast China: Response to the mesozoic tectonic regime transformation. J. Asian Earth Sci. 185, 104024. doi:10.1016/j.jseaes.2019.104024
Ye, X. W., Huang, Y. M., and Liu, J. P. (2016). 3D P-wave velocity structure and active tectonics in the Xinfengjiang area of Guangdong. Earthq. Res. China 32 (3), 465–476.(in Chinese)
Yue, X. H., Liu, L., Zhang, Z. G., et al. (2022). Petrogenesis of the jurassic representative volcanic rocks in eastern Guangdong: Response to the early stage of the paleo-pacific subduction. Geol. J. China Univ. 28 (2), 199–210.(in Chinese)
Zhang, G. W., Guo, A. L., Wang, Y. J., Li, S., Dong, Y., Liu, S., et al. (2013). Tectonics of South China continent and its implications. Sci. China Earth Sci. 56, 1804–1828. doi:10.1007/s11430-013-4679-1(in Chinese)
Zhang, L. X. (2014). Seismic risk analysis in Guangzhou and its neighboring area. Chin. J. Eng. Geophys. 11 (4), 568–574.(in Chinese)
Zhang, Y. Q., Shi, D. N., Lü, Q. T., Xu, Y., Xu, Z., Yan, J., et al. (2021). The crustal thickness and composition in the eastern South China Block constrained by receiver functions: Implications for the geological setting and metallogenesis. Ore Geol. Rev. 130, 103988. doi:10.1016/j.oregeorev.2021.103988
Zhang, Y. T., Ren, Y. F., Wen, R. Z., et al. (2022). A method of site parameter estimation based on decision tree theory considering terrain features. Chin. J. Geophys. 65 (2), 698–710.(in Chinese)
Zhang, Z. Z., Pan, H., Wang, J., et al. (2008). Research on historical earthquakes in the eastern Guangdong. Earthq. Res. China 24 (3), 278–287.(in Chinese)
Zhou, Y., Miao, T. M., Yang, J., Wang, X., Wang, H., and Zheng, W. (2022b). Seismic wave attenuation characteristics from the ground motion spectral analysis around the Kanto Basin. Buildings 12 (318), 318. doi:10.3390/buildings12030318
Keywords: earthquake ground motions, spectral analysis, path attenuation, site response, eastern Guangdong
Citation: Wu H, Zhou Y, Qian Y, Yang F, Yu G, Wu G and Zhang Y (2023) Seismic-wave path attenuation and local site responses in eastern Guangdong province revealed by the ground-motion spectral analyses. Front. Earth Sci. 11:1091785. doi: 10.3389/feart.2023.1091785
Received: 07 November 2022; Accepted: 02 January 2023;
Published: 13 January 2023.
Edited by:
Yefei Ren, Institute of Engineering Mechanics, China Earthquake Administration, ChinaReviewed by:
Zhen Guo, Jiangnan University, ChinaCopyright © 2023 Wu, Zhou, Qian, Yang, Yu, Wu and Zhang. This is an open-access article distributed under the terms of the Creative Commons Attribution License (CC BY). The use, distribution or reproduction in other forums is permitted, provided the original author(s) and the copyright owner(s) are credited and that the original publication in this journal is cited, in accordance with accepted academic practice. No use, distribution or reproduction is permitted which does not comply with these terms.
*Correspondence: Ying Zhou, am9leTA1Mnp5QDE2My5jb20=
†ORCID: Ying Zhou, orcid.org/0000-0001-5812-5795
Disclaimer: All claims expressed in this article are solely those of the authors and do not necessarily represent those of their affiliated organizations, or those of the publisher, the editors and the reviewers. Any product that may be evaluated in this article or claim that may be made by its manufacturer is not guaranteed or endorsed by the publisher.
Research integrity at Frontiers
Learn more about the work of our research integrity team to safeguard the quality of each article we publish.