 Xiao Li1,2
- 1Plateau Atmosphere and Environment Key Laboratory of Sichuan Province, College of Atmospheric Science, Chengdu University of Information Technology, Chengdu, China
- 2Key Laboratory of Meteorological Disaster, Ministry of Education (KLME)/Joint International Research Laboratory of Climate and Environment Change (ILCEC)/Collaborative Innovation Center on Forecast and Evaluation of Meteorological Disasters (CIC-FEMD), Nanjing University of Information Science and Technology, Nanjing, China
- 3Hubei Key Laboratory for Heavy Rain Monitoring and Warning Research, Institute of Heavy Rain, Wuhan, China
- 4Department of Atmospheric and Oceanic Sciences, Fudan University, Shanghai, China
Irrigation activities have been recognized as one of the most potentially sustainable land management practices to tackle climate change. In this study, we investigated the impacts of present-day irrigation activities on regional temperature extremes changes in China using the state-of-the-art regional climate model RegCM-4.8.2, through two sets of long-term numerical experiments (i.e., with and without irrigation). The key findings are as follows. Firstly, by comparing the observations, RegCM4 has a good ability to reproduce both the spatial distribution and the volume of irrigation for provincial irrigation activities in China. In this context, by comparing the results of numerical experiments, we found that irrigation led to significant reductions (slightly changes) in the extreme indices associated with the warm (cold) tails of the maximum and minimum temperatures distributions, e.g., hot days, tropical nights (cold nights, frost days), particularly in the regions with intense irrigation (e.g., the North China Plain). Furthermore, these extreme indices were dominated by irrigation-induced shifts in mean temperatures, but the impacts of changes in temperature variability on extreme hot events were also non-negligible for the strongly irrigated regions. In addition, through attributing irrigation-induced changes in mean state temperatures, we revealed that the irrigation-induced repartitioning of the surface turbulent heat fluxes (i.e., sensible and latent heat) dominated the variations of temperatures and the associated extremes. However, region-specific land-atmosphere coupling features also led to differences in the irrigation-induced responses of surface energy components. We highlight the possible effects and mechanisms of irrigation on multiple types of extreme temperature indices, particularly the extreme hot events, which provide scientific clues for mitigating and adapting regional climate change.
1 Introduction
Human activities have unequivocally caused climate change in every region across the globe (IPCC, 2021). According to the Special Report on Climate Change and Land (SRCCL) from the Intergovernmental Panel on Climate Change (IPCC) sixth assessment cycle, more than 70% of the global ice-free land surface, particularly most of the highly productive land area, has been directly exploited by humans (IPCC, 2019). Such intensive anthropogenic land use has led to extensive alteration of natural ecosystems - known as land use and cover change (LUCC). On the one hand, LUCC could influence local-regional-global climate through biogeophysical and biogeochemical mechanisms (e.g., Mahmood et al., 2014; Ward et al., 2014; Bright, 2015; Li et al., 2017; Winckler et al., 2017; Li et al., 2018; Xu et al., 2022). On the other hand, over-exploitation of land resources would also negatively affect ecosystems (e.g., land degradation) and the services they provide (e.g., Arneth et al., 2019). Hence, in a context of finite Earth’s land area, the sustainable use of land resources (i.e., sustainable land management, SLM) is a crucial pathway to addressing complex land use-derived issues (e.g., United Nations General Assembly, 2015).
A variety of SLM approaches are available to mitigate climate change, including forest management (e.g., extending rotation cycles), cropland management (e.g., irrigation), grazing land management (e.g., deep rooting grasses), etc (Smith et al., 2014). Conducting SLM to counter the negative effects of intensive land use activities is only one side of the coin; it is also necessary to consider whether these actions will in turn have impacts on climate change through land-atmosphere interactions. A growing number of studies have focused on the climate effects of the potential land management changes (LMC; Davin et al., 2014; Erb et al., 2017; Hirsch et al., 2017; Thiery et al., 2017; Seneviratne et al., 2018). These studies have largely come to the similar conclusion that several types of LMC (e.g., irrigation) can cause impacts on climate comparable to LUCC (e.g., Luyssaert et al., 2014; Singh et al., 2018; Chen and Dirmeyer, 2020; De Hertog et al., 2022). Of these LMC practices, irrigation is probably the one that could have the greatest impact on climate due to its direct influence on surface hydrology through water withdrawals (e.g., Sacks et al., 2009; Thiery et al., 2017; Chen and Dirmeyer, 2019; Mishra et al., 2020; Thiery et al., 2020; Gormley-Gallagher et al., 2022). Irrigation activities are mainly concentrated in regions with a high density of cropland, such as China, India and North America. Previous observational and modeling studies have shown that irrigation could exert significant influences on multiscale local-regional-global climate, mainly by affecting the repartition of surface turbulent heat fluxes, soil moisture and the coupling strength of land-atmosphere interactions (e.g., Guimberteau et al., 2012; Alter et al., 2015; de Vrese et al., 2016; Lu et al., 2017; Nocco et al., 2019; Yang et al., 2020). For example, Alter et al. (2015) highlighted that irrigation caused inhibitions (enhancements) to local (remote) precipitation over East Africa, which was probably due to its influence on surface thermal conditions and hence changes in atmospheric circulation. Guimberteau et al. (2012) modeled the impact of irrigation on climate and demonstrated that irrigation could significantly delay the onset of the Indian summer monsoon by 6 days with a corresponding decrease in precipitation during May-July. Sacks et al. (2009) modeled the global climate effects of irrigation and found that irrigation had a negligible effect on the global mean near-surface temperature, but at regional scales its effects were comparable to the magnitude of the LUCC forcing. Furthermore, the Land Use Model Comparison Project (LUMIP), a sub-project of the Coupled Model Comparison Project Phase 6 (CMIP6), also included irrigation as one of the important forcing factors for multi-model comparisons and simulations (Lawrence et al., 2016). However, compared to the coarse-resolution global-scale numerical simulations, it is more informative to explore the irrigation effects on regional climate using finer regional weather and climate models since irrigation activity is primarily a regional-scale forcing. And yet, there are many other aspects of irrigation impacts and mechanisms on regional climate that are largely uncertain (e.g., de Vrese and Hagemann, 2018).
China is one of the largest agricultural countries in the world. According to the National Bureau of Statistics of China, the irrigated area of cropland in China was ∼69,600 thousand hectares at the end of 2021. Focusing on irrigation effects in China, in addition to irrigation activities affecting the mean climate state such as temperature and precipitation, their impacts on extreme weather and climate events, especially heat wave events, have received much attention in recent years (e.g., Kang and Eltahir, 2018; Wu et al., 2021). For instance, Kang and Eltahir (2018) highlighted that while irrigation activities could cool the surface, the concurrent increase in air moisture made the risk of deadly heat waves associated with wet-bulb temperatures significantly higher, especially under the high-emission scenario (i.e., RCP 8.5). Yet, for such a massive volume of irrigation activities in China, its impact on climate, especially on climate extremes, as well as the related mechanisms were often explained in terms of mean-state shifts alone (e.g., Chen and Dirmeyer, 2019). According to the IPCC special report, changes in extreme temperatures can be linked not only to the temperature mean-state shifts, but also to changes in the shape of probability distributions (i.e., changes in temperature higher order moments, e.g., variance; IPCC, 2012). However, whether the effects of irrigation on temperature extremes are dominated by the mean-state shifts or changes in higher moments of temperature, as well as what the relevant mechanisms are, remain largely unclear and require detailed explorations for further understandings. Meanwhile, a realistic irrigation scheme in the model is also critical to improve the confidence in simulating the effects of irrigation on climate extremes. In contrast to some previous regional modeling studies that used idealized forced saturation soil (e.g., Kang and Eltahir, 2018), selecting a more realistic representation of irrigation in the model is also necessary. Based on these considerations, this paper used state-of-the-art regional climate model with the realistic irrigation scheme to explore the impacts and mechanisms of present-day irrigation on temperature extremes in China, focusing on two main aspects: 1) How significant is the impact of irrigation on multiple types (e.g., absolute changes, persistent features changes, and thresholds-related changes) of temperature extremes 2) What are the main causes (i.e., is the mean-state shift or temperature variability change dominant?) and physical mechanisms underlying the irrigation effects on temperature extremes?
2 Methodology
2.1 Model and experimental design
2.1.1 Regional climate model
We use version 4.8.2 of the Regional Climate Model (RegCM) developed by the International Centre for Theoretical Physics (ICTP), one of the world’s most popular limited area models for studying regional climate change (Giorgi et al., 2012). First developed by Dickinson et al. (1989) and Giorgi and Bates (1989), the RegCM model has been evolved over decades and the state-of-the-art RegCM4 has been widely used in refined regional climate simulations in the world. For East Asia in particular, the RegCM4 model has been broadly used for climate predictions (e.g., Gu et al., 2012), projections (e.g., Xie et al., 2021) and studying land cover changes effects (e.g., Chen et al., 2015; Li et al., 2022), aerosol impacts (e.g., Sun et al., 2012), etc., due to its good ability to reproduce regional weather and climate (e.g., Ji and Kang, 2015).
Studying the effects of irrigation on climate requires a detailed description and consideration of irrigation in the land surface parameterization of the regional model. Previous numerical simulation studies have generally taken two approaches to conduct irrigation activities. One is the idealized maximum irrigation scenario, which directly sets soil moisture to field capacity and saturated conditions (e.g., Kueppers and Snyder, 2012). The other is an observed or realistic irrigation scenario, i.e., applying observed irrigation amounts into the model (e.g., Sacks et al., 2009; Zeng et al., 2017b), or irrigating using soil moisture deficits as irrigation intensity based on the daily meteorological conditions (Ozdogan et al., 2010; Yang et al., 2016; Wu et al., 2018; Liu et al., 2021). Clearly, it is more appropriate and informative to select a more realistic irrigation approach in the model to assess the realistic impacts of irrigation on extreme events than the former (i.e., the idealized maximum irrigation approach). For this reason, the Community Land Model version 4.5 (CLM4.5) was chosen as the land surface component of RegCM4 (Oleson et al., 2013). The CLM4.5 model is the land surface component of the National Center for Atmospheric Research (NCAR) Community Earth System Model (CESM) and is one of the most advanced land surface models. In the CLM4.5 model, there are two main considerations when addressing irrigation: on the one hand, when irrigation is enabled, the default plant function types (PFT) of cropland is refined into eight extra rainfed and irrigated crops, and irrigation is valid only for the soil beneath irrigated crops; on the other hand, for the intensity of irrigation, the CLM4.5 irrigation algorithm can determine the amount of irrigation per day based on the soil moisture deficits that takes into account the current atmospheric conditions. The separation of rainfed and irrigated crop are based on a dataset of areas equipped for irrigation (AEI; Portmann et al., 2010). The soil moisture deficits (wdeficit) are calculated as follows:
Where wtarget,i is the target soil moisture content in each soil layer i, wo,i is the minimum soil moisture content that results in no water stress in soil layer i, wsat,i is the soil moisture content at saturation in soil layer i and wliq,i is the current soil water content of layer i. Ultimately, the amount of irrigation water withdraw is then equal to wdeficit. The advantage of this algorithm for processing irrigation is that it can determine whether and how much to irrigate depending on atmospheric conditions, i.e., it considers the irrigation-atmosphere interactions. The full descriptions of the irrigation scheme can be found on the technique notes of CLM4.5 (Chapter 20.3; Oleson et al., 2013) and will not be detailed here. Thus, by coupling CLM4.5 with RegCM4, the advantages of CLM4.5 in terms of fine-scale descriptions of land surface processes can be fully integrated, making it possible to study the effects of irrigation on climate extremes using the high-resolution regional climate model.
2.1.2 Experimental design
The RegCM4 is configured at a 25 km resolution and the simulated domain is set with reference to the East Asia domain of the Coordinated Regional Downscaling Experiment (CORDEX) Phase II. The domain center of the simulations is located at (35°N, 116°E) with a total of 280 (north-south) × 428 (east-west) grid points, described by the rotated Mercator projection. The simulated domain and the AEI over China can be found on Figure 1A. The atmospheric boundary conditions were selected from the European Center for Medium-Range Weather Forecasts (ECMWF) interim 6-hourly atmospheric reanalysis (Dee et al., 2011) and the ocean boundary conditions were selected from the Hadley Centre HadISST monthly sea surface temperature data. We selected MM5 hydrostatic dynamic core with a 23 level-σ coordinate (top at 50 hPa) as the dynamical configuration. The parameterization schemes were chosen as follows: convective parameterization scheme - MIT-Emanuel (Emanuel and Živković-Rothman, 1999), planetary boundary layer scheme - Modified Holtslag (Holtslag et al., 1990), explicit moisture scheme - SUBEX (Pal et al., 2000), radiation scheme - Modified CCM3 (Kiehl et al., 1996), ocean flux scheme - Zeng et al. (1998) and land surface scheme - CLM4.5 (Oleson et al., 2013). The above parameterization schemes have been chosen because they have been proven in numerous studies to be the “best” combination of parameterization schemes for modeling the East Asian climate (e.g., Han et al., 2015; Gao et al., 2016). Based on the above configurations, two sets of experiments were conducted: one with irrigation activated (IRR) and the other without irrigation (CTL). Note that in the IRR experiments, only irrigation activity within China was turned on, irrigation activity in other areas within the simulated boundary outside China (e.g., India) remained closed (i.e., the same as CTL).
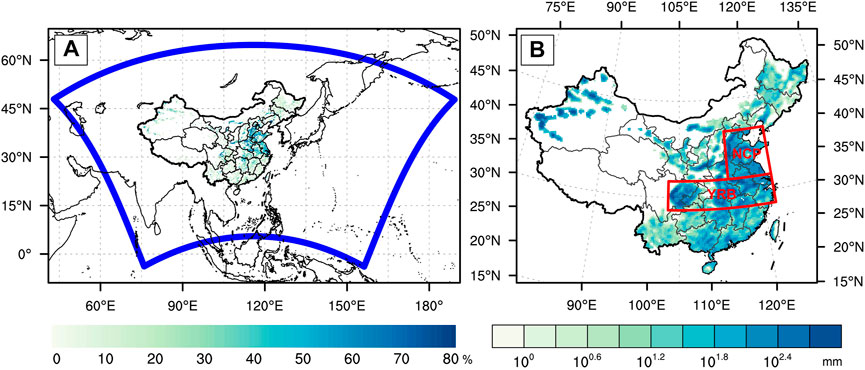
FIGURE 1. The simulation domain of the RegCM and the inputdata of areas equipped for irrigation over China, units: % (A) and the simulated ensemble mean of annual total irrigation amounts over China, units: mm (B). Note that the thick blue lines in (A) are the boundaries of the domain, the red boxes in (B) represent areas of interest with intense irrigation activities. “NCP” for the North China Plain (32.5–40 °N, 114–122 °E) and “YRB” for the Yangtze River Basin (28–32.5 °N, 103–122 °E).
In order to turn on irrigation in RegCM4, the fully interactive crop management model (CROP) with carbon-nitrogen (CN) interactions in CLM4.5 required to be activated. As the biogeochemical cycle also turned on with CN, we first need to generate the initial conditions of the land surface biochemical equilibrium state for the RegCM4. We therefore performed an offline cold start of CLM4.5 with CROP and CN on, following the procedure in the CLM4.5 User’s Guide regarding spinning up the CLM4.5 biogeochemistry, details can be found on https://www2.cesm.ucar.edu/models/cesm1.2/clm/models/lnd/clm/doc/UsersGuide/x12544.html. We integrated the CLM4.5 spinup simulation for a total of 1,200 years, including 1,000 years of accelerated decomposition spinup and 200 years of normal spinup, which driven by CRUNCEP data cycled in a loop, at a resolution of 0.5° × 0.5° (Viovy, 2018). Finally, we used the “interpinic” tool of CLM4.5 to interpolate the restart file of the last year of the CLM4.5 spinup to the RegCM4 resolution as the equilibrium state initial condition of the land surface for driving the RegCM4. To further minimize the uncertainty arising from errors in the interpolation of the initial fields generated by the offline CLM4.5 to the RegCM4 resolution, we also carried out an additional 4 years of spinup when conducting irrigation experiments (i.e., IRR and CTL). Specifically, both IRR and CTL were integrated from 1 January 1980 to 31 December 2013. The years 1980–1983 were the RegCM4 spinup phase and were not involved in the subsequent analyses. In addition, for the IRR experiment, three additional ensemble simulations (noted as IRR1, IRR2 and IRR3, respectively) with random perturbations (i.e., add or remove up to 1/10,000th of the boundary conditions) in the atmospheric boundary conditions (i.e., perturb atmospheric temperature, relative humidity and specific humidity, respectively) were carried out with reference to O’Brien et al. (2011). All results shown in the subsequent sections are ensemble averages of the four IRR realizations compared to the CTL experiment; Figure 1B shows the simulation results for the ensemble-averaged climate-state total irrigation amounts (TIAs). It is clear that irrigation in China is concentrated in three regions, namely the North China Plain (NCP), the Yangtze River Basin (YRB) as well as the western part of Xinjiang province, with the annual TIAs varying from 102∼103 mm (Figure 1B). Note that while the western irrigated regions (i.e., Xinjiang province) have comparable irrigation intensity compared to the eastern ones (i.e., NCP and YRB), the extent of western irrigation activities is sporadic, implying that irrigation effects in the west may reflect more of a local response. Therefore, in the following sections, we will mainly focus on the NCP and YRB regions as examples for more detailed analyses.
2.2 Validation of the simulated irrigation
The ability of the model to accurately simulate TIAs is an important basis for the confidence of modeling results for temperature extremes changes. Although CLM4.5 provides a more realistic treatment of irrigation, it is also necessary to validate that whether the TIAs simulated by the model match the observed magnitudes. Hence, we first compare the TIAs simulated by RegCM4 versus the observations. Note that the most reliable irrigation data for China is only available at the provincial scale. We obtained the TIAs from 1997 to 2013 by multiplying the total irrigated area from the China Statistical Yearbook (http://www.stats.gov.cn/tjsj/ndsj/) and the water use per mu of irrigated farmland (i.e., irrigation water use intensity) from the China Water Resources Bulletin (http://www.mwr.gov.cn/sj/tjgb/szygb/). A comparison between observed and simulated multiyear average TIAs is shown in Figure 2. Overall, the RegCM4 model well reproduces the observed spatial distribution of provincial TIAs (Figures 2A,B). In terms of TIAs at the provincial level, the observed annual TIAs are widely distributed across the eastern China, with magnitudes mainly in the range of 101–102 mm. For western China, irrigation is mostly concentrated in Xinjiang province, where annual TIAs can reach 102–102.5 mm. The simulated annual TIAs generally reproduce the observed distribution reasonably well, with widespread (concentrated) irrigation activities in eastern (western) China. Specifically, the modeled TIAs are slightly overestimated (underestimated) in Sichuan and Henan provinces (northeastern China), and generally match the observed magnitudes in the other provinces (Figure 2B). Moreover, we also calculated the regression of simulated TIAs versus observed TIAs for the provinces of China, as shown in Figure 2C. For the 31 Chinese provinces, the provincial-level comparisons generally show relatively high correlations (
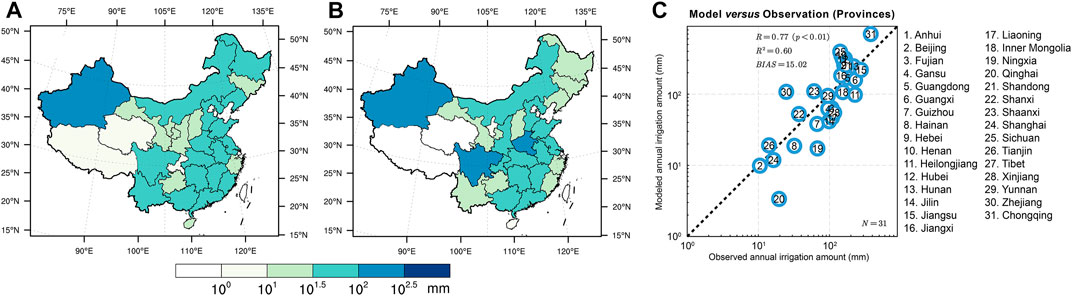
FIGURE 2. Comparison of observed and modeled multi-year average annual irrigation amount (units: mm) at the provincial scale: (A) observed values; (B) modeled values; (C) scatter plot of observed versus modeled irrigation. Note that the R, R2, BIAS and N in (C) represent the correlation, R-Squared, absolute error and the number of data involved, respectively. The numbers in the hollow points in (C) represent the different provinces (see the list on the right side of (c)).
2.3 Temperature extremes indices
In order to fully quantify the impact of irrigation on temperature extremes, multiple types (e.g., intensity and duration) of extreme indices need to be selected. Following the recommendations of the World Meteorological Organization, 15 extreme temperature indices were selected from the CCl/WCRP/JCOMM Joint Expert Group on Climate Change Detection and Indices (ETCCDI), as shown in Table 1. These extreme temperature indices cover the characteristics of extreme temperatures in absolute values, thresholds, persistent events and percentiles, which is the most widely used set of extreme indices in the study of extreme climate change (e.g.; Zhang et al., 2011; Donat et al., 2013; Dunn et al., 2020). The definitions of these indices can be found on http://etccdi.pacificclimate.org/list_27_indices.shtml or Table 1.
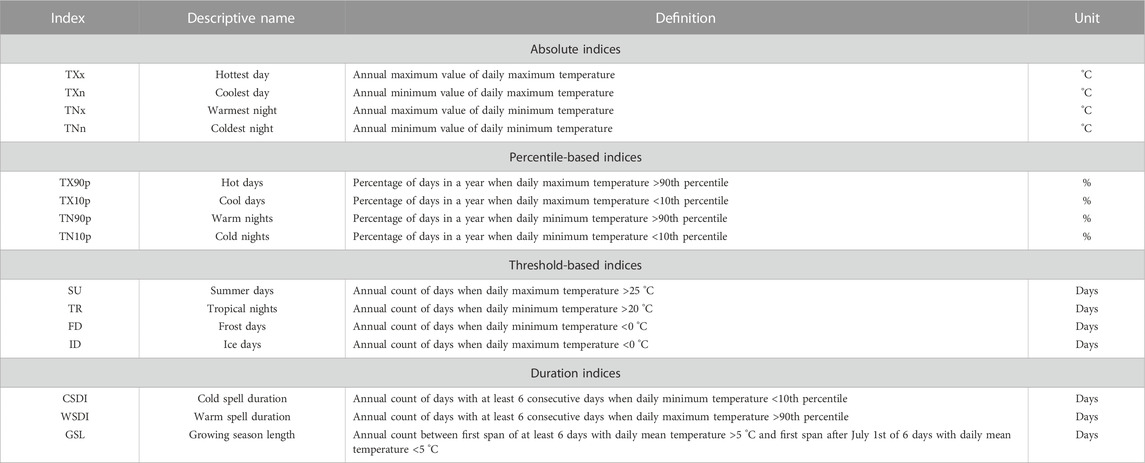
TABLE 1. Definitions of 15 ETCCDI temperature extremes.
2.4 The decomposed temperature metric
The surface energy budget (SEB)-based decomposed temperature metric (DTM) was introduced to investigate the mechanisms by which irrigation affects temperature extremes. The DTM has been widely used in attributing land surface processes-induced changes in temperatures (e.g., Juang et al., 2007; Luyssaert et al., 2014; Chen and Dirmeyer, 2016; Li et al., 2017). This method begins with the surface energy balance equation:
where SRnet, LRdown, LRup, SH, LH and G denote net shortwave radiation, downward longwave radiation, upward longwave radiation, sensible heat flux, latent heat flux and ground heat flux into the soil, respectively. The SRnet can be further divided into upward (SRup) and downward shortwave radiation (SRdown), respectively (i.e.,
Trs is the surface radiative temperature, σ is the Stefan Boltzmann constant (i.e.,
2.5 Other methods
In addition to the above methods, some regular statistical methods (e.g., probability density functions and linear regression) are not repeated here. We chose the modified Student’s t-test (Zwiers and von Storch, 1995) to determine whether the differences between IRR and CTL experiments were statistically significant (at the 90% confidence level). For the ensemble mean results, we first determine whether the difference between each paired simulation (e.g., IRR1 versus CTL) is significant (at the 90% confidence level). Then, we define the robustness of the ensemble mean results in terms of inter-sample consistency as follows. For the ensemble mean results at any grid point, we define the consistency as “significant” when all four realizations are statistically significant at the 90% confidence level and the responses have the same sign. We define consistency as “strong” (“moderate”) when three (two) of the four realizations are statistically significant at the 90% confidence level and the responses have the same sign. We define consistency as “weak” (“insignificant”) when only one (none) of the four realizations are statistically significant at the 90% confidence level. In addition, we introduced the two legged land-atmosphere coupling metrics (i.e., terrestrial leg—the coupling between soil moisture and latent heat and atmospheric leg—the coupling between sensible heat and planetary boundary layer height) to measure the coupling strength, details can be found in Dirmeyer (2011).
3 Results
3.1 Irrigation-induced changes in mean temperatures
Before exploring the effect of irrigation on the extreme temperature indices, we first examine the response of mean maximum and minimum temperatures to irrigation, which are closely related to changes in extreme temperature events, as shown in Figure 3. In terms of land surface temperatures, irrigation causes significant decreases in the annual mean maximum land surface temperature (Tsmax) mostly over the NCP, the YRB and parts of Xinjiang province, ranging from −0.6°C to more than −1.2°C (Figure 3A). For the minimum land surface temperature (Tsmin), irrigation also causes a significant reduction in annual mean Tsmin, but the magnitude is much weaker (approximately −0.2 to −0.6°C) in comparison to the cooling of Tsmax (Figure 3B). Moreover, comparing Tsmax and Tsmin we can observe that their responses have more distinct regional features, in addition to their different magnitudes of coolings. For example, irrigation-induced Tsmax cools more strongly in the NCP than in the YRB, but the opposite is true for Tsmin (i.e., the response of Tsmin is stronger in the YRB than in the NCP; Figure 3A versus Figure 3B). This implies that the effect of irrigation on temperatures are likely to be region-specific. For air temperatures, irrigation generally has much smaller effects on them than on the land surface temperatures (Figures 3C, D). In detail, both maximum and minimum air temperatures show cooling responses to irrigation of no more than −0.6°C, with significant cooling detected only in parts of the YRB (Figures 3C, D). Additionally, unlike the irrigation-induced distinct responses of Tsmax and Tsmin, the coolings of maximum and minimum air temperatures (refer to Tmax and Tmin, respectively) to the irrigation exhibited almost identical (Figures 3A, B versus Figures 3C, D). Overall, irrigation causes the surface temperature variables to be cooled and the areas of significant coolings closely correspond to those of intense irrigations (Figure 1B), suggesting that the effects of irrigation on temperatures are mainly exhibited by the local cooling responses.
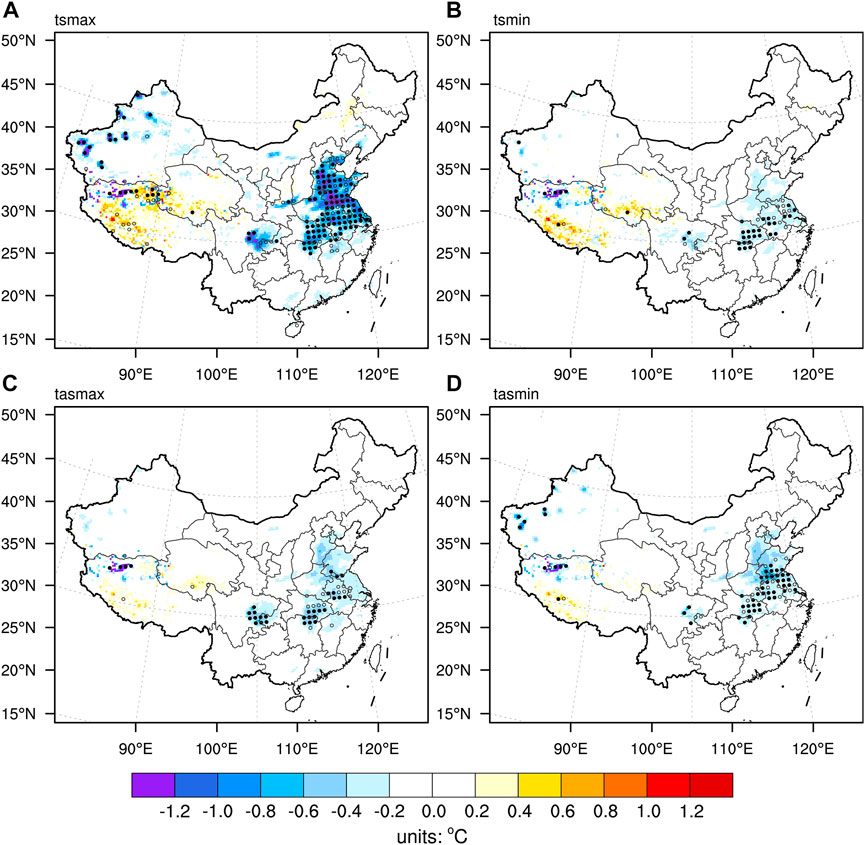
FIGURE 3. Irrigation-induced changes in annual mean surface temperature variables (units: °C): (A) maximum land surface temperature (Tsmax), (B) minimum land surface temperature (Tsmin), (C) maximum 2 m air temperature (Tmax) and (D) minimum 2 m air temperature (Tmin). Note that the solid (hollow) black dots in the figures indicate a greater than “strong” (“moderate”) degree of consistency among the results of the ensemble members (i.e., statistically significant changes at the 90% confidence level are observed for 3 (2) out of four simulation pairs).
3.2 Irrigation-induced changes in absolute indices
With the above brief impression of the mean temperatures changes, we start to investigate the changes in the extreme temperature indices caused by irrigation. Firstly, we show the changes in the annual maximum (minimum) values of the multiyear average daily maximum (minimum) temperature (short for TXx, TXn, TNx and TNn, respectively) due to irrigation, as shown in Figure 4. It is clear that the irrigation-induced changes in TXx resemble very closely to those of the mean maximum temperatures (i.e., Tsmax and Tmax; Figures 4A versus 3A, C). In detail, irrigation also causes strong and significant coolings in the NCP and YRB regions (−0.9 ∼ −1.8°C), which are much stronger than the coolings in both Tsmax (no more than −1.2°C) and Tmax (no more than −0.6°C; Figure 4A). The changes of TNx induced by irrigation are similar to that of TXx, but the coolings are weaker (−0.6 ∼ −1.2°C; Figure 4C), which also matches the above-mentioned changes in mean minimum temperatures (Figures 3C, D). In addition, for TXn and TNn, irrigation causes very little changes nationally, both in the magnitudes (no more than ±0.6 °C) and the significances (Figures 4B, D). It is also worth noting that there are much stronger coolings in maximum values (i.e., TXx and TNx) than in minimum values (i.e., TXn and TNn) of temperatures. This also implies that irrigation not only affected changes in the temperatures mean state, but may also have caused obvious changes in the higher order moments of temperatures (e.g., variance). Similar findings regarding the non-negligible role of changes in high order moments of temperatures have also been highlighted in other studies (e.g., Li et al., 2017; Li et al., 2018).
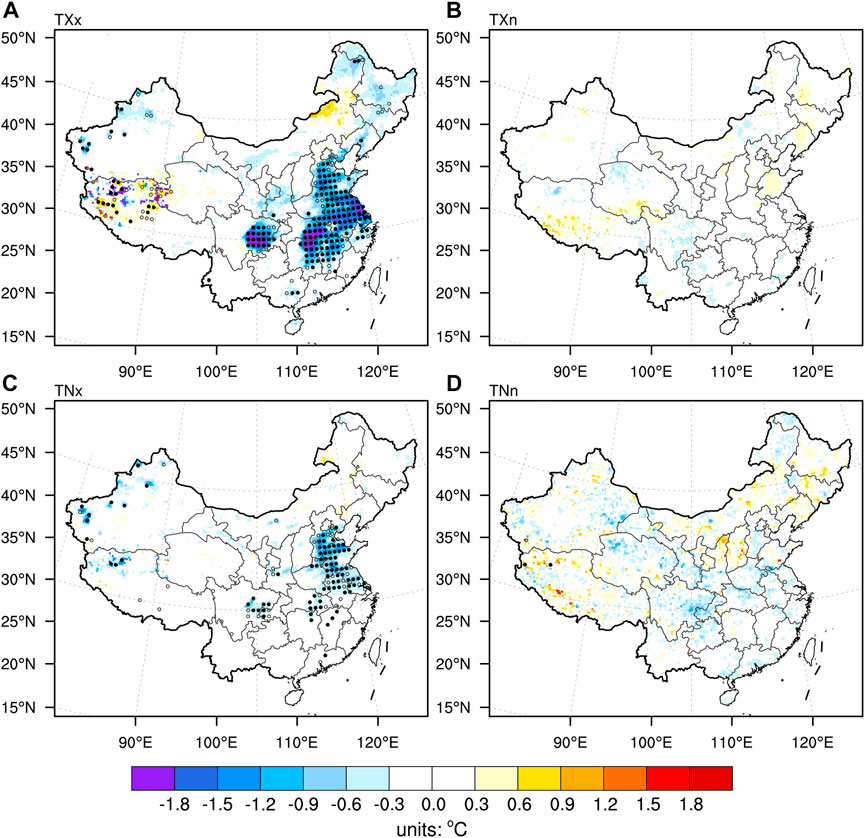
FIGURE 4. Irrigation-induced changes in multiyear mean absolute indices (units: °C): (A) annual maximum value of daily maximum temperature (TXx), (B) annual minimum value of daily maximum temperature (TXn), (C) annual maximum value of daily minimum temperature (TNx) and (D) annual minimum value of daily minimum temperature (TNn). The meanings of solid and hollow dots are the same as Figure 3.
3.3 Irrigation-induced changes in percentile-based indices
Figure 5 shows the irrigation-induced changes in percentile-based extreme temperature indices (i.e., hot days, cool days, warm nights and cold nights; show for TX90p, TX10p, TN90p and TN10p, respectively). Obviously, dominated by the changes in mean maximum and minimum temperatures, the four percentile-based extreme indices in response to irrigation also show similar patterns as the above-mentioned absolute indices changes (Figures 5 versus Figure 4). Specifically, for extreme warm events, changes in hot days (i.e., TX90p) and warm nights (i.e., TN90p) are very consistent with the corresponding mean temperatures changes, namely significant reductions in warm events ranging from −2.4% to −4.8% for the NCP, YRB and parts of Xinjiang province (Figures 5A, C). For extreme cold events, cool days (i.e., TX10p) and cold nights (i.e., TN10p) respond differently to irrigation. In detail, TX10p overall exhibits almost no changes to irrigation nationally, with slight and insignificant changes over parts of the Tibet, which probably due to the internal noise of the model (Figure 5B). The TN10p, on the other hand, shows a moderate increase (∼1.6%–3.2%) over the NCP region, but with a weak significance. Theoretically, if irrigation only causes a shift of the mean temperature, the changes in extreme cold and warm events should be exactly opposite (i.e., increases (decreases) in cold events corresponds to decreases (increases) in warm events). Therefore, it can be inferred from the above results that for the maximum temperature-related extremes the indices (e.g., TXx, TXn, TX90p and TX10p) were probably influenced by both mean state and variability changes, while the minimum temperature-related extremes (i.e., TNx, TNn, TN90p and TN10p) show more of a mean temperature-dominated feature.
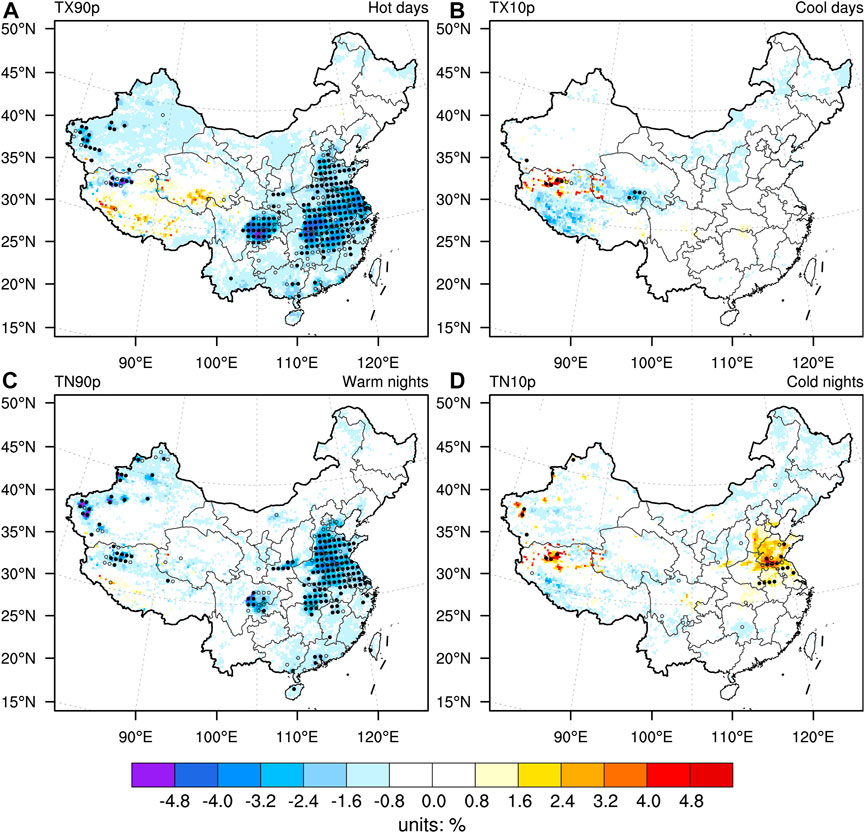
FIGURE 5. Same as Figure 4, but for percentile-based indices (units: %): (A) hot days (TX90p), (B) cool days (TX10p), (C) warm nights (TN90p) and (D) cold nights (TN10p). The meanings of solid and hollow dots are the same as Figure 3.
3.4 Irrigation-induced changes in other extreme temperature indices
In addition to changes in absolute indices and percentile-based indices of temperature extremes, we also investigate irrigation-induced changes in threshold-based indices (Figure S1) and duration indices (Figure S2). As expected, the threshold-based extreme temperature indices and the duration indices also show variations primarily corresponding to shifts in the mean-state maximum and minimum temperatures over the irrigated areas (Figures S1-S2 versus Figure 3). These can be briefly summarized in three points: 1) During the daytime, irrigation caused robust coolings (reductions) of surface temperatures (the warm tail-related extreme indices; e.g., TXx and TX90p) at the local-to-regional scale; 2) During the nighttime, the effects of irrigation on surface temperatures and the associated changes in extreme indices were relatively weak; 3) Synthetically, the variations in maximum and minimum temperatures and their associated extreme indices were largely influenced by the mean state shifts, but the irrigation-induced changes in the temperature variability (i.e., moments of temperature other than mean changes) may be equally important to temperature extremes for some regions (e.g., NCP and YRB).
To further confirm the role of irrigation-induced changes in temperature variability over the NCP and YRB regions, we calculated the probability density function (PDF) of the regional average land surface temperatures (i.e., Tsmax and Tsmin) in each simulation, as shown in Figure 6. Note that the we used daily temperatures anomalies to calculate PDFs in each experiment, which means the climatological annual cycle (based on the CTL experiment) was removed. Overall, the PDFs of Tsmax for both NCP and YRB regions indeed show not only robust left shifts of the distribution positions, but also the concurrent narrows of the distribution shapes (Figures 6A, B). This implies significant coolings of the mean state of Tsmax (i.e., −0.890°C for NCP and −0.572°C for YRB) and considerable reductions in its variability (e.g., the standard deviations of Tsmax reduce −0.424 and −0.232°C for NCP and YRB, respectively). The results of PDFs of Tsmax are fully consistent with the previous results (i.e., Figures 3–5, Supplementary Figures S1, S2). Consequently, we can clearly observe that for both the YRB and NCP regions, the cold tail of Tsmax remains almost unchanged, but the warm tail undergoes a more robust cooling than the mean state cooling. For the PDFs of Tsmin, there are distinct responses detected for both NCP and YRB compared to Tsmax (Figures 6C, D versus 6A, B). Specifically, we can only observe very slight leftward shifts and narrowings in the PDFs of Tsmin for the two regions, which also corresponds to their spatially weak performances (i.e., −0.232°C mean state cooling for NCP and −0.243°C for YRB). In summary, the modeled irrigation primarily resulted in coolings in the mean state of Tsmax and Tsmin as well as the changes of the related temperature extremes indices. However, specifically for Tsmax, the modeled irrigation also had non-negligible effects on the asymmetric responses of the cold and warm tails of the temperature PDFs in the NCP and YRB regions.
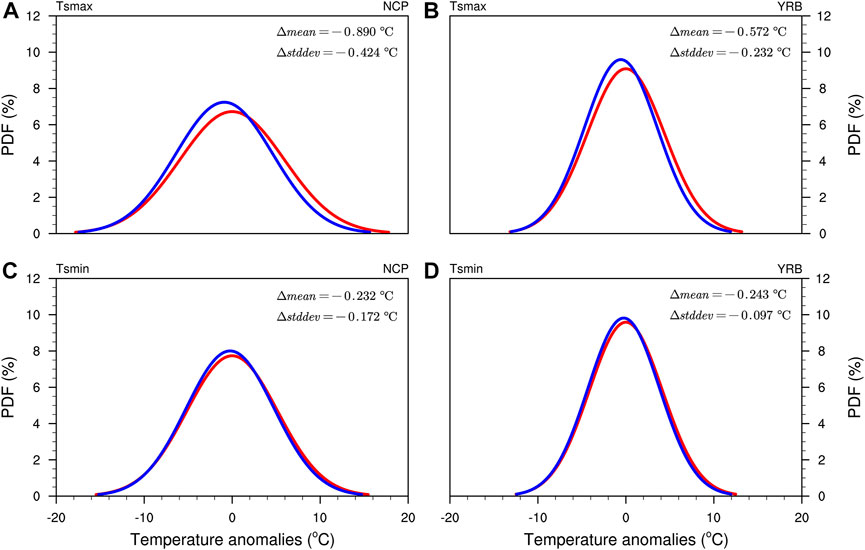
FIGURE 6. The Gaussian fitted probability density function (PDF) of land surface temperatures for CTL (red) and IRR (blue) experiments: (A) Tsmax in NCP; (B) Tsmax in YRB; (C) Tsmin in NCP and (D) Tsmin in YRB. Note that the Δmean and Δstddev denote the irrigation-induced changes in the mean state and standard deviation of temperatures.
3.5 Possible mechanisms of irrigation-induced extreme temperatures changes
From the previous modeling results, we found that irrigation caused robust reductions of the warm tail-related extreme indices (e.g., TXx and TX90p), which mainly related to the mean Tsmax and Tsmin coolings. Why did irrigation cause such changes in temperatures and associated extreme indices? We next attempt to interpret the changes in extreme indices by diagnosing the mechanisms of changes in mean Tsmax and Tsmin. Previous studies have demonstrated that irrigation, as a climate-efficient form of land management, could have significant impacts on regional climate by modulating the surface energy budget and the land-atmosphere interactions (e.g., Douglas et al., 2009; Qian et al., 2013). We therefore introduced the widely used decomposed temperature metric (DTM) to explore and quantify the biogeophysical mechanisms of irrigation on Tsmax/Tsmin and associated extreme indices. Figures 7, 8 show the contributions of changes in each irrigation-induced SEB component to the variation of mean Tsmax and Tsmin. Note that we select the values of the SEB components at 06 (18) UTC for the inputs of Eq. 3 to match the time at which Tsmax (Tsmin) generally occurs. We start with the DTM diagnostic results for Tsmax.
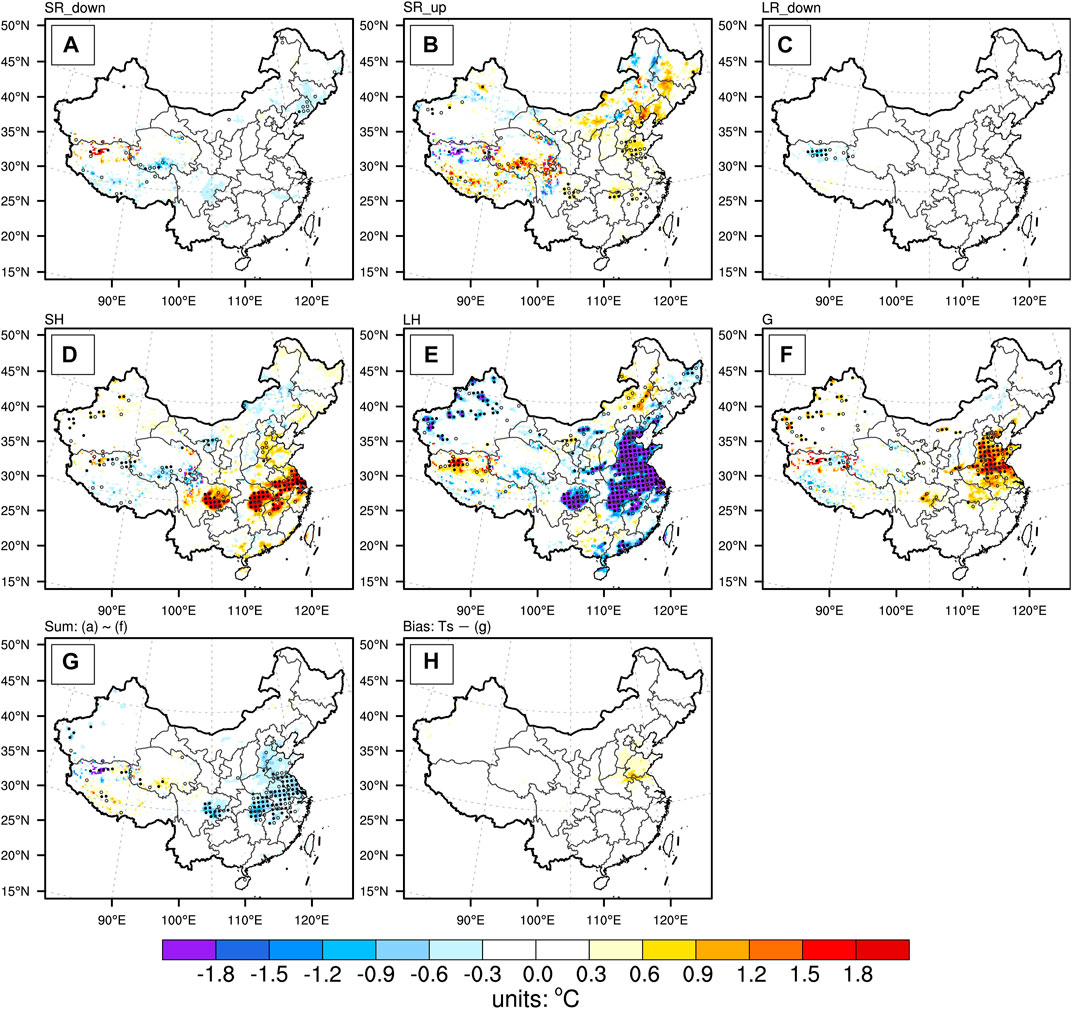
FIGURE 7. Ensemble mean results of the irrigation-induced multiyear mean changes in daytime (06 UTC) surface temperature due to changes in the surface energy budget components: (A) downward shortwave radiation, (B) upward shortwave radiation, (C) downward longwave radiation, (D) sensible heat flux, (E) latent heat flux, (F) ground heat flux, (G) sum of (A–F) and (H) errors of the decomposed temperature metric (i.e., simulated land surface temperature minus (G)), units: °C. The meanings of solid and hollow dots are the same as Figure 3.
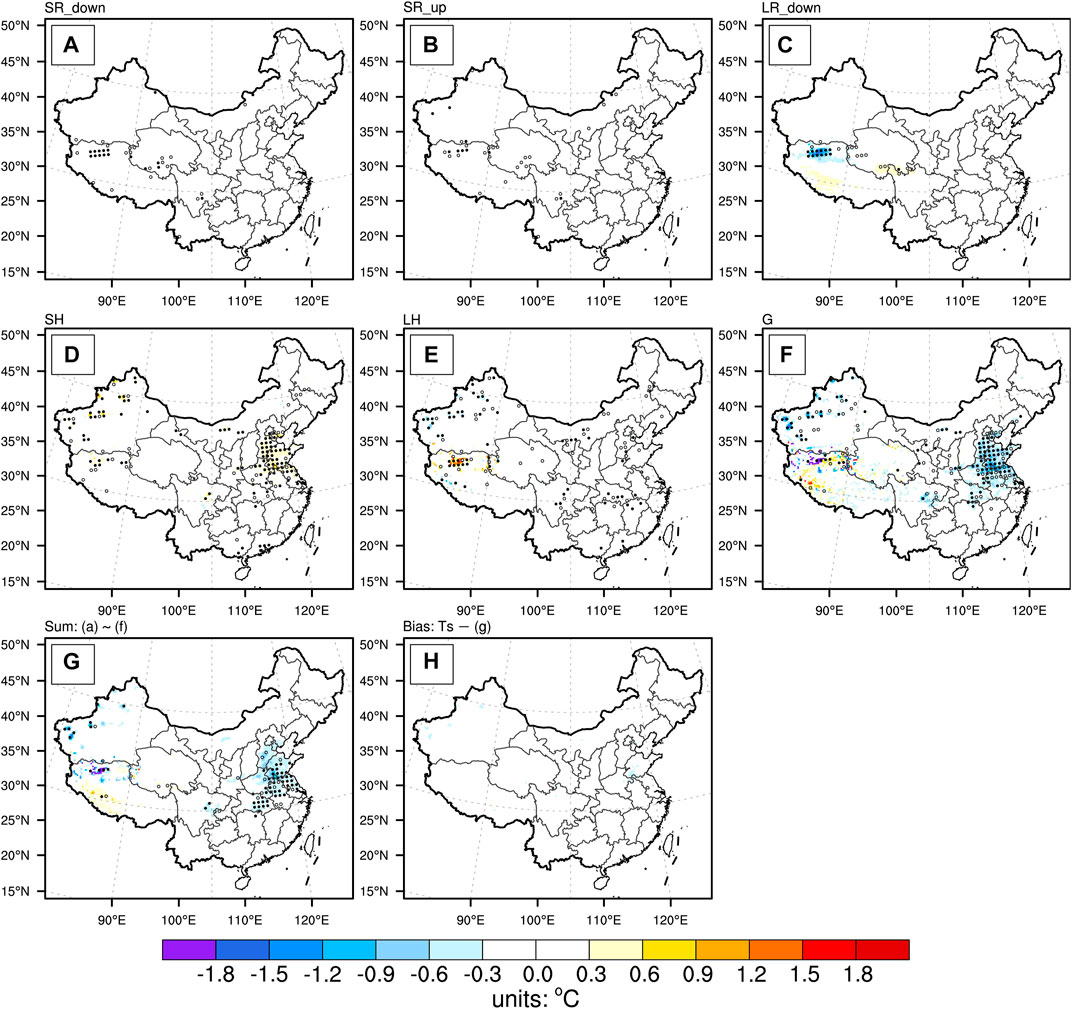
FIGURE 8. Ensemble mean results of the irrigation-induced multiyear mean changes in nighttime (18 UTC) surface temperature due to changes in the surface energy budget components: (A) downward shortwave radiation, (B) upward shortwave radiation, (C) downward longwave radiation, (D) sensible heat flux, (E) latent heat flux, (F) ground heat flux, (G) sum of (A–F) and (H) errors of the decomposed temperature metric [i.e., simulated land surface temperature minus (G)], units: °C. The meanings of solid and hollow dots are the same as Figure 3.
Firstly, we focus on the contributions of changes in the radiation components (i.e., SRdown, SRup and LRdown) due to irrigation to the Tsmax (i.e., Figures 7A–C). It is clear that irrigation generally caused no significant changes in the three radiation components (i.e., SRdown, SRup and LRdown). In particular, irrigation induces very weak changes in the SRdown and LRdown, which in turn leads to little change in temperature (within ±0.3°C). The SRdown and LRdown changes due to irrigation generally correlate with changes in cloudiness, which also suggests that the effect of irrigation on cloudiness may not be robust at the annual mean scale in our modeling results. In addition, we can observe that SRup are reduced in a few parts of both the NCP and YRB, which would further increase the net solar radiation received at the surface (Figure 7B). The net increase in shortwave radiation may be due to a slight decrease in surface albedo, which is caused by irrigation-induced wet soils being darker than dry soils. As a result, moderate (∼0.6°C) but less significant warmings induced by SRup are detected over few parts of the YRB and NCP (Figure 7B). The effect of irrigation on the non-radiative components (i.e., SH, LH and G) is much stronger than the variation in the radiative components, which results in a significant repartition of non-radiative heat fluxes (Figures 7D–F). In general, the responses of all three non-radiative components (i.e., SH, LH and G) to irrigation are strong and significant over the irrigated areas (e.g., NCP and YRB), but significant regional differences in their patterns are also detected. Specifically, irrigation mainly leads to robust reductions (increases) in sensible and ground heat fluxes (latent heat flux) locally in the irrigated areas, which in turn leads to evident warmings (coolings) of more than 1.8°C (−1.8°C) of the land surface. However, focusing on the main irrigated areas, a comparison of the NCP and YRB reveals a clear difference in irrigation-induced non-radiative heat repartition between these two regions. More specifically, as irrigation tends to increase surface moisture, turbulent heat fluxes show a greater partitioning towards LH in both YRB and NCP regions. What’s different is that, in the YRB region, the warming caused by the significant reduction in SH partly counterbalances the cooling effect of the significant increase in LH, and the turbulent repartition caused by irrigation is mainly reflected in a combined variation of the two. In contrast, for the NCP region, the irrigation-induced increases in LH are not accompanied by corresponding decreases in SH, but ultimately manifests as increases in the ground heat flux into the soil (i.e., downward) to balance the changes in the other SEB components. Consequently, this leads to significant G-induced warmings that partially offsets the coolings of LH (Figures 7E, F). Combining the changes in the radiative and non-radiative components, the accumulated results ultimately show an irrigation-induced LH-dominated locally significant cooling effect (Figure 7G). In addition, we calculated the bias of the SEB-based land surface temperature changes (i.e., Figure 7G) from the simulated daytime land surface temperature changes (i.e., Figure 3A), as shown in Figure 7H. It is clear that the bias of the SEB method is very small, showing a warm bias of around 0.3 °C only in parts of the NCP, and around 0 in all other regions (Figure 7H). This indicates that SEB can well decompose the variation in irrigation-induced Tsmax.
At night, the effect of irrigation on the SEB components is much weaker than during the day, which is probably related to the fact that CLM4.5 describes the moment when irrigation activity takes place as being in the morning (Oleson et al., 2013). Specifically, irrigation barely changes the nighttime radiation components (i.e., SRdown, SRup and LRdown) and thus the magnitudes of its effect on nighttime surface temperature through radiative effects are generally zero (Figures 8A–C). For the changes of the non-radiative components, the change in LH is almost zero probably because there is no irrigation activity at night (Figure 8E). However, for the NCP region, the anomalous G stored in the soil during the day could probably be released into the air at night with the diurnal cycle. This may lead to a significant enhancement of nighttime G-induced air warming accompanied by surface cooling (Figure 8F). In addition, the enhanced diurnal cycle of G caused by irrigation may simultaneously weaken the ground-air temperature difference (Supplementary Figures S3) at night, thus tending to reduce the nighttime sensible heat, which may also cause surface warmings (Figure 8D). In contrast, for the YRB region, all non-radiative heat fluxes respond weakly to irrigation and therefore the change in Tsmin is slight (Figures 8D–F). From these results we can conclude that the weak cooling at night induced by irrigation is probably caused by the persistence of daytime G anomalies through the diurnal cycle into the night. The regional differences of SEB responses at night are also closely related to the specific irrigation-induced repartitioning effects during the day. In addition, the role of G in the diurnal cycle of temperatures as well as the corresponding temperature extremes changes has been highlighted in other studies of land surface processes (e.g., Li et al., 2017).
4 Discussions
In the previous section we modeled the effects and possible mechanisms of present-day irrigation on a wide range of extreme indices. We found significant decreases (almost no change) in the extreme indices associated with the warm (cold) tail of the probability density function of temperatures, e.g., TXx, TX90p (TNn, TX10p). In addition to the above results, there are several caveats and uncertainties that need to be specifically stated.
4.1 Possible causes of the region-specific differences in SEB responses
Why did these two areas (i.e., NCP and YRB) have similar irrigation intensities (Figures 1, 2) and temperatures responses (Figure 3), but responded so differently regarding SEB components? We can interpret this in terms of region-specific land-atmosphere coupling features. According to Budyko’s classical hydrological framework, we can distinguish the geographically dependent evapotranspiration regimes by the soil moisture-limited or energy-limited regimes (e.g., Seneviratne et al., 2010). The different regimes and their transition zones are all subject to very different land-atmosphere interactions. For instance, Koster et al. (2004) and Seneviratne et al. (2006) highlighted the critical role of soil moisture on evapotranspiration variability in the wet-dry transitional zone than in the too wet or too dry climate regimes. Take the YRB (i.e., a humid region) for example, soil moisture is generally at a high level because of more adequate precipitation. While irrigation activities over YRB, although adding additional water to the soil, would probably result in a much lower rate of soil moisture variations than those caused by precipitation. It is also suggested that moist terrestrial surface is not sensitive to the changes in soil moisture. Thus, the repartition effect caused by irrigation in the YRB region reflects both increases in LH and decreases in SH. Conversely, for the NCP region, which is a wet-dry transition zone in terms of climatological states, it exhibits a soil moisture-limited regime. As a result, changes in evapotranspiration in the NCP region are very sensitive to soil moisture. What this causes is that the irrigation-induced reparation effect of turbulent heat in the NCP region is absolutely dominated by strong increases in LH alone. The above-mentioned possible mechanisms are probably the main reason why similar irrigation activities produced different SEB responses in the two regions. To confirm the above speculations, we have also calculated the land-atmosphere coupling strength (LACS) in the CTL experiment using the “two legged” coupling metric, as shown in Figure 9. As we suspected, the LACS (shown in both terrestrial and atmospheric legs) in the NCP region are indeed significantly stronger than in the YRB region. This suggests that region-specific land-atmosphere coupling features can modulate the effects of irrigation, which in turn leads to different responses in SEB components and temperatures. In addition, although the differences in the repartition effects of LH and SH between the two regions (i.e., NCP and YRB) were substantial, it was G that ultimately served as the counterbalance to the combined effects of the two turbulent heat fluxes (i.e., SH and LH). Due to the counterbalance of G, there is ultimately little difference between NCP and YRB regarding temperature responses. In conclusion, we can infer from our results that the different responses of the SEB in the YRB and NCP regions are probably due to different climatic states (i.e., land-atmosphere coupling) in specific regions.
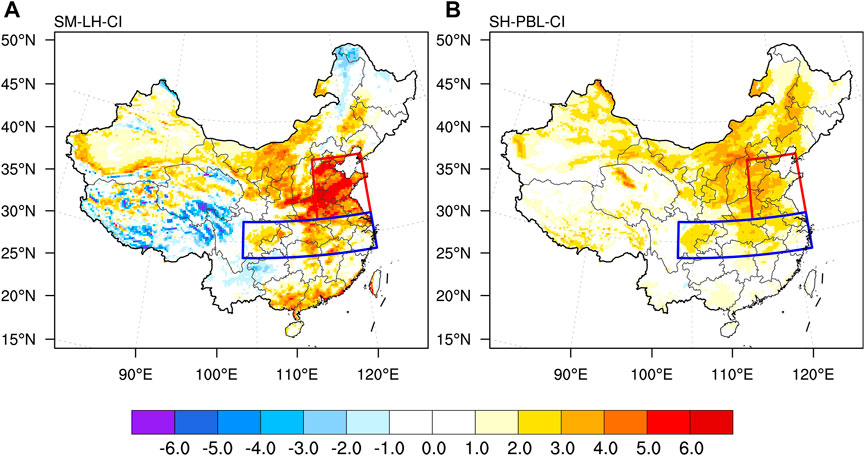
FIGURE 9. The climatology features of land-atmosphere coupling strength in the CTL experiment calculated using the “two legged” land-atmosphere coupling metric: (A) terrestrial coupling indices (i.e., the coupling between soil moisture and latent heat), units: W m−2 and (B) atmospheric coupling indices (i.e., the coupling between sensible heat and planetary boundary layer height), units: 101 W m−2. Note that the red and blue boxes in the figure represent NCP (32.5–40 °N, 114–122 °E) and YRB (28–32.5 °N, 103–122 °E) regions, respectively.
4.2 Uncertainties
We have modeled present-day irrigation activities affecting temperature extremes via numerical simulations, which means that all of our results for irrigation impacts are entirely dependent on the ability of the model itself to describe weather, climate and their complex interactions. Although the outstanding modeling capabilities of the RegCM4 have been demonstrated from the previous validation results (i.e., Section 2.2) and previous studies (e.g., Ji and Kang, 2015), some uncertainties remain.
First, these uncertainties arise mainly from the data driving the model, the single-model simulations and the combination of the selected physical processes of the model. Each of the above points could affect not only the irrigation itself, but also key physical processes (e.g., land-atmosphere coupling strength) that may be directly or indirectly related to climate and extremes changes. (e.g., Bonan et al., 2011; Du et al., 2016; Jach et al., 2022). For instance, the default AEI data (i.e., Portmann et al., 2010) reflected monthly irrigated and rainfed crop areas around the year 2000, which was relatively out-of-date and would introduce uncertainties when assessing the present-day irrigation effects. In future studies, it is necessary to use more accurate and up-to-date data to conduct multi-model ensemble simulations with various combinations of initial and boundary conditions, parameterization schemes in order to better assess irrigation-induced climate extremes changes.
Second, the simulated irrigation activity is entirely dependent on the CLM4.5 parameterization scheme - the irrigation it describes may differ significantly from the actual irrigation activity. Overall, the representations of irrigation activities have several shortcomings in the model. The first is the source of the water withdraw for irrigation, which can come from either the surface or the underground. However, the irrigation parameterization scheme of RegCM4-CLM4.5 did not account for groundwater and surface water-groundwater interactions. It has been highlighted that irrigation activities based on different water sources have completely opposite effects on the regional hydrological changes caused by climate change (e.g., Leng et al., 2015). Therefore, irrigation water sources may be critical for regional climate extremes changes and need to be considered in future studies. The second consideration is the method of irrigation. In CLM 4.5, irrigation was done through surface irrigation only, with water withdrawal applied directly to the land surface (bypassing canopy interception). With the development of technology, in addition to the common method of surface irrigation, there are sprinkler irrigation, drip irrigation and compound irrigation systems. Each type of irrigation has considerable differences in the treatments of eco-hydrology processes, which could in turn potentially lead to distinct impacts on regional climate, water and food supplies (e.g., Wang et al., 2020; Fu et al., 2022). As a result, this may introduce uncertainties into the corresponding simulated changes in temperature extremes, which should also be involved in the future modeling studies. In addition to the above, the timing of irrigation, the control of irrigation amounts and the interaction between irrigation and vegetation are also of great importance for the regional climate change (e.g., Lobell et al., 2009; Sacks et al., 2009; Wu et al., 2018). These are key processes that are not (or fixed) in the simulations, but should be refined and represented.
In addition, we have only investigated the effect of irrigation on annual-scale temperature extremes based on the modeling results, which only reflects a small aspect of the irrigation effects on extreme weather and climate events. In fact, the impacts of irrigation on extreme events are much broader and more complex. Other studies have highlighted that the irrigation could also significantly affect precipitation extremes, compound temperature-humidity extremes and compound hydrological extremes (e.g., Kang and Eltahir, 2018; de Vrese and Stacke, 2020; Ambika and Mishra, 2021). And the human socio-ecological-economic consequences of changes in these compound extreme events are often catastrophic and therefore should require more attentions. Moreover, Zeng et al. (2017a) revealed that irrigation had distinct influences on turbulent and carbon fluxes over the northwestern China. Hence, the irrigation-induced changes seasonal-scale or monthly-scale climate extremes should be further investigated. In conclusion, in addition to the current study, further attention needs to be paid to the impact and mechanisms of irrigation on a broader range of extreme events (e.g., compound extreme events) and regions (e.g., Xinjiang province).
5 Conclusion
In this study, the modeling effects and mechanisms of present-day irrigation activities on temperature extremes in China are investigated using the state-of-the-art regional climate model (i.e., RegCM4-CLM4.5) coupled with a dynamic and realistic irrigation parameterization scheme. By analyzing two groups of comparative experiments, namely with and without irrigation, regarding changes in multiple extreme temperature indices, we obtained the following conclusions:
The RegCM4 coupled CLM4.5 model could reproduce the annual mean TIAs well. By comparing the provincial-scale observations, RegCM4 could generally simulate the primary regions and magnitudes of irrigation activities in China. That is, irrigation in China mainly occurred in the NCP, YRB and parts of Xinjiang province, and the annual averaged TIAs are ranging from 102 to 103 mm.
By comparing the results of comparative experiments with and without irrigation, it was found that the irrigation activities in China could significantly reduce the extreme temperature indices associated with the PDFs warm tails of the maximum and minimum temperatures (e.g., TXx, TN90p, TR and WSDI) in the NCP and YRB regions. However, for the cold tails, the extreme temperature indices associated with the cold tails of the maximum temperature (e.g., TX10p) remained largely unchanged, while the cold-tail extreme indices associated with the minimum temperature (e.g., TNn) were relatively similar to the changes in their warm-tail indices. Further investigations revealed that the responses of extreme indices associated with maximum and minimum temperatures to irrigation were largely dominated by mean-state changes, but the changes in temperature variability (e.g., variance) were also non-negligible in areas of intense irrigation activities (i.e., NCP and YRB).
The decomposition of the mean changes in daytime temperature (i.e., Tsmax) showed that irrigation caused a significant decrease (cooling) in the relevant extreme temperature indices mainly through the repartitioning of turbulent heat fluxes (i.e., SH and LH). However, there were also specific regional differences in the repartitioning of SH and LH, which either showed an absolute dominance of LH enhancement due to irrigation-induced moisture increases (e.g., in the NCP region) or comparable redistribution of SH and LH (e.g., in the YRB region). Ultimately, the changes (i.e., repartitioning of SH and LH) were counterbalanced in the form of G, making coolings similar in both regions. At night, the G stored in the soil during the day continued to influence nighttime surface and air temperature changes as the diurnal cycle progresses, but the magnitudes of the changes of surface energy components, temperatures and extreme indices were all slight. In addition, region-specific differences may be dominated by different land-atmosphere coupling processes (i.e., the water-limited regime or the energy-limited regime) dominating.
Overall, irrigation activities, as one of the most important SLM approaches, also require the use of multi-regional/earth system models and experiments to increase confidence in relevant assessments and mechanisms, and provide more informed scientific clues for policymakers.
Data availability statement
The ERA-interim and HadISST data used for running the model can be obtained from https://apps.ecmwf.int/datasets/data/interim-fulldaily/levtype=pl/ and https://www.metoffice.gov.uk/hadobs/hadisst/data/download.html, respectively. The source code of the latest release of RegCM can be obtained from https://github.com/ICTP/RegCM/. The raw data supporting the conclusions of this article will be made available by the authors, without undue reservation.
Author contributions
All authors contributed to the study conception and design. Material preparation, data collection and analysis were performed by XoL, XP, and JZ. The first draft of the manuscript was written by XoL and XgL. WH, HM, XoL and XgL wrote sections of the manuscript. All authors contributed to manuscript revision, read and approved the submitted version.
Funding
This study was jointly supported by the National Natural Science Foundation of China (41905080, 41905065 and 42075022), the Scientific Research Foundation of CUIT (KYTZ202124, KYTZ202123, KYQN202201), the Joint Open Project of KLME and CIC-FEMD, NUIST (KLME202002, KLME20220001) and the National Natural Science Foundation of Jiangsu Province (BK20200096).
Acknowledgments
We acknowledge all the innovation platforms at Chengdu University of Information Technology for providing the necessary research conditions for this study. We also acknowledge the Climpact software (see www.climpact-sci.org) for calculating climate indices used in this study.
Conflict of interest
The authors declare that the research was conducted in the absence of any commercial or financial relationships that could be construed as a potential conflict of interest.
Publisher’s note
All claims expressed in this article are solely those of the authors and do not necessarily represent those of their affiliated organizations, or those of the publisher, the editors and the reviewers. Any product that may be evaluated in this article, or claim that may be made by its manufacturer, is not guaranteed or endorsed by the publisher.
Supplementary material
The Supplementary Material for this article can be found online at: https://www.frontiersin.org/articles/10.3389/feart.2023.1084892/full#supplementary-material
References
Alter, R. E., Im, E.-S., and Eltahir, E. A. B. (2015). Rainfall consistently enhanced around the Gezira Scheme in East Africa due to irrigation. Nat. Geosci. 8, 763–767. doi:10.1038/ngeo2514
Ambika, A. K., and Mishra, V. (2021). Modulation of compound extremes of low soil moisture and high vapor pressure deficit by irrigation in India. J. Geophys. Res. Atmos. 126, e2021JD034529. doi:10.1029/2021JD034529
Arneth, A., Denton, F., Agus, F., Elbehri, A., Erb, K., Osman Elasha, B., et al. (2019). “Framing and context,” in Climate change and land: An IPCC special report on climate change, desertification, land degradation, sustainable land management, food security, and greenhouse gas fluxes in terrestrial ecosystems. Editors P. R. Shukla, J. Skea, E. Calvo Buendia, V. Masson-Delmotte, H.-O. Pörtner, D. C. Robertset al. In press. Available at: https://www.ipcc.ch/site/assets/uploads/sites/4/2019/12/04_Chapter-1.pdf (Accessed Oct 17, 2022).
Bonan, G. B., Lawrence, P. J., Oleson, K. W., Levis, S., Jung, M., Reichstein, M., et al. (2011). Improving canopy processes in the Community Land Model version 4 (CLM4) using global flux fields empirically inferred from FLUXNET data. J. Geophys. Res. Biogeosciences 116, G02014. doi:10.1029/2010JG001593
Bright, R. M. (2015). Metrics for biogeophysical climate forcings from land use and land cover changes and their inclusion in life cycle assessment: A critical review. Environ. Sci. Technol. 49, 3291–3303. doi:10.1021/es505465t
Chen, H., Li, X., and Hua, W. (2015). Numerical simulation of the impact of land use/land cover change over China on regional climates during the last 20 years. Chin. J. Atmos. Sci. 39, 357–369. (in Chinese). doi:10.3878/j.issn.1006-9895.1404.14114
Chen, L., and Dirmeyer, P. A. (2016). Adapting observationally based metrics of biogeophysical feedbacks from land cover/land use change to climate modeling. Environ. Res. Lett. 11, 034002. doi:10.1088/1748-9326/11/3/034002
Chen, L., and Dirmeyer, P. A. (2020). Distinct impacts of land use and land management on summer temperatures. Front. Earth Sci. 8, 245. doi:10.3389/feart.2020.00245
Chen, L., and Dirmeyer, P. A. (2019). Global observed and modelled impacts of irrigation on surface temperature. Int. J. Climatol. 39, 2587–2600. doi:10.1002/joc.5973
Davin, E. L., Seneviratne, S. I., Ciais, P., Olioso, A., and Wang, T. (2014). Preferential cooling of hot extremes from cropland albedo management. Proc. Natl. Acad. Sci. 111, 9757–9761. doi:10.1073/pnas.1317323111
De Hertog, S. J., Havermann, F., Vanderkelen, I., Guo, S., Luo, F., Manola, I., et al. (2022). The biogeophysical effects of idealized land cover and land management changes in Earth system models. Earth Syst. Dyn. 13, 1305–1350. doi:10.5194/esd-13-1305-2022
De Vrese, P., Hagemann, S., and Claussen, M. (2016). Asian irrigation, African rain: Remote impacts of irrigation. Geophys. Res. Lett. 43, 3737–3745. doi:10.1002/2016GL068146
De Vrese, P., and Hagemann, S. (2018). Uncertainties in modelling the climate impact of irrigation. Clim. Dyn. 51, 2023–2038. doi:10.1007/s00382-017-3996-z
De Vrese, P., and Stacke, T. (2020). Irrigation and hydrometeorological extremes. Clim. Dyn. 55, 1521–1537. doi:10.1007/s00382-020-05337-9
Dee, D. P., Uppala, S. M., Simmons, A. J., Berrisford, P., Poli, P., Kobayashi, S., et al. (2011). The ERA-interim reanalysis: Configuration and performance of the data assimilation system. Q. J. R. Meteorological Soc. 137, 553–597. doi:10.1002/qj.828
Dickinson, R. E., Errico, R. M., Giorgi, F., and Bates, G. T. (1989). A regional climate model for the Western United States. Clim. Change 15, 383–422. doi:10.1007/BF00240465
Dirmeyer, P. A. (2011). The terrestrial segment of soil moisture–climate coupling. Geophys. Res. Lett. 38, L16702. doi:10.1029/2011GL048268
Donat, M. G., Alexander, L. V., Yang, H., Durre, I., Vose, R., Dunn, R. J. H., et al. (2013). Updated analyses of temperature and precipitation extreme indices since the beginning of the twentieth century: The HadEX2 dataset. J. Geophys. Res. Atmos. 118, 2098–2118. doi:10.1002/jgrd.50150
Douglas, E. M., Beltrán-Przekurat, A., Niyogi, D., Pielke, R. A., and Vörösmarty, C. J. (2009). The impact of agricultural intensification and irrigation on land–atmosphere interactions and Indian monsoon precipitation — a mesoscale modeling perspective. Glob. Planet. Change 67, 117–128. doi:10.1016/j.gloplacha.2008.12.007
Du, E., Vittorio, A. D., and Collins, W. D. (2016). Evaluation of hydrologic components of community land Model 4 and bias identification. Int. J. Appl. Earth Observation Geoinformation 48, 5–16. doi:10.1016/j.jag.2015.03.013
Dunn, R. J. H., Alexander, L. V., Donat, M. G., Zhang, X., Bador, M., Herold, N., et al. (2020). Development of an updated global land in situ-based data set of temperature and precipitation extremes: HadEX3. J. Geophys. Res. Atmos. 125, e2019JD032263. doi:10.1029/2019JD032263
Emanuel, K. A., and Živković-Rothman, M. (1999). Development and evaluation of a convection scheme for use in climate models. J. Atmos. Sci. 56, 1766–1782. doi:10.1175/1520-0469(1999)056<1766:DAEOAC>2.0.CO;2
Erb, K.-H., Luyssaert, S., Meyfroidt, P., Pongratz, J., Don, A., Kloster, S., et al. (2017). Land management: Data availability and process understanding for global change studies. Glob. Change Biol. 23, 512–533. doi:10.1111/gcb.13443
IPCC (2012). “Summary for policymakers,” in Managing the risks of extreme events and disasters to advance climate change adaptation. Editors C. B. Field, V. Barros, T. F. Stocker, D. Qin, D. J. Dokken, K. L. Ebiet al. (Cambridge, UK, and New York, NY, USA: Cambridge University Press), 1–19. A Special Report of Working Groups I and II of the Intergovernmental Panel on Climate Change.
Fu, J., Kang, S., Zhang, L., Li, X., Gentine, P., and Niu, J. (2022). Amplified warming induced by large-scale application of water-saving techniques. Environ. Res. Lett. 17, 034018. doi:10.1088/1748-9326/ac4b52
Gao, X., Shi, Y., and Giorgi, F. (2016). Comparison of convective parameterizations in RegCM4 experiments over China with CLM as the land surface model. Atmos. Ocean. Sci. Lett. 9, 246–254. doi:10.1080/16742834.2016.1172938
Giorgi, F., and Bates, G. T. (1989). The climatological skill of a regional model over complex terrain. Mon. Weather Rev. 117, 2325–2347. doi:10.1175/1520-0493(1989)117<2325:TCSOAR>2.0.CO;2
Giorgi, F., Coppola, E., Solmon, F., Mariotti, L., Sylla, M. B., Bi, X., et al. (2012). RegCM4: Model description and preliminary tests over multiple CORDEX domains. Clim. Res. 52, 7–29. doi:10.3354/cr01018
Gormley-Gallagher, A. M., Sterl, S., Hirsch, A. L., Seneviratne, S. I., Davin, E. L., and Thiery, W. (2022). Agricultural management effects on mean and extreme temperature trends. Earth Syst. Dyn. 13, 419–438. doi:10.5194/esd-13-419-2022
Gu, H., Wang, G., Yu, Z., and Mei, R. (2012). Assessing future climate changes and extreme indicators in east and south Asia using the RegCM4 regional climate model. Clim. Change 114, 301–317. doi:10.1007/s10584-012-0411-y
Guimberteau, M., Laval, K., Perrier, A., and Polcher, J. (2012). Global effect of irrigation and its impact on the onset of the Indian summer monsoon. Clim. Dyn. 39, 1329–1348. doi:10.1007/s00382-011-1252-5
Han, Z., Gao, X., Shi, Y., Wu, J., Wang, M., and Giorgi, F. (2015). Development of Chinese high resolution land cover data for the RegCM4/CLM and its impact on regional climate simulation. J. Glaciol. Geocryol. (in Chinese) 37, 857–866. doi:10.7522/j.issn.1000-0240.2015.0095
Hirsch, A. L., Wilhelm, M., Davin, E. L., Thiery, W., and Seneviratne, S. I. (2017). Can climate-effective land management reduce regional warming? Journal of Geophysical Research Atmospheres 122, 2269–2288. doi:10.1002/2016JD026125
Holtslag, A. a. M., De Bruijn, E. I. F., and Pan, H. L. (1990). A high resolution air mass transformation model for short-range weather forecasting. Monthly Weather Review 118, 1561–1575. doi:10.1175/1520-0493(1990)118<1561:AHRAMT>2.0.CO;2
Jach, L., Schwitalla, T., Branch, O., Warrach-Sagi, K., and Wulfmeyer, V. (2022). Sensitivity of land–atmosphere coupling strength to changing atmospheric temperature and moisture over Europe. Earth System Dynamics 13, 109–132. doi:10.5194/esd-13-109-2022
Ji, Z., and Kang, S. (2015). Evaluation of extreme climate events using a regional climate model for China. International Journal of Climatology 35, 888–902. doi:10.1002/joc.4024
Juang, J.-Y., Katul, G., Siqueira, M., Stoy, P., and Novick, K. (2007). Separating the effects of albedo from eco-physiological changes on surface temperature along a successional chronosequence in the southeastern United States. Geophysical Research Letters 34, L21408. doi:10.1029/2007GL031296
Kang, S., and Eltahir, E. A. B. (2018). North China Plain threatened by deadly heatwaves due to climate change and irrigation. Nature Communications 9, 2894. doi:10.1038/s41467-018-05252-y
Kiehl, J. T., Hack, J. J., Bonan, G. B., Boville, B. A., Briegleb, B. P., Williamson, D. L., et al. (1996). Description of the NCAR community climate model (CCM3). Technical note. Boulder, CO: NCAR.
Koster, R. D., Dirmeyer, P. A., Guo, Z., Bonan, G., Chan, E., Cox, P., et al. (2004). Regions of strong coupling between soil moisture and precipitation. Science 305, 1138–1140. doi:10.1126/science.1100217
Kueppers, L. M., and Snyder, M. A. (2012). Influence of irrigated agriculture on diurnal surface energy and water fluxes, surface climate, and atmospheric circulation in California. Climate Dynamics 38, 1017–1029. doi:10.1007/s00382-011-1123-0
Lawrence, D. M., Hurtt, G. C., Arneth, A., Brovkin, V., Calvin, K. V., Jones, A. D., et al. (2016). The land use model intercomparison project (LUMIP) contribution to CMIP6: Rationale and experimental design. Geoscientific Model Development 9, 2973–2998. doi:10.5194/gmd-9-2973-2016
Li, X., Chen, H., Liao, H., Hua, W., Sun, S., Ma, H., et al. (2017). Potential effects of land cover change on temperature extremes over eurasia: Current versus historical experiments. International Journal of Climatology 37, 59–74. doi:10.1002/joc.4976
Li, X., Chen, H., Wei, J., Hua, W., Sun, S., Ma, H., et al. (2018). Inconsistent responses of hot extremes to historical land use and cover change among the selected CMIP5 models. Journal of Geophysical Research Atmospheres 123, 3497–3512. doi:10.1002/2017JD028161
Li, X., Li, X., Ma, H., Hua, W., Chen, H., Wen, X., et al. (2022). Reforestation in Southern China enhances the convective afternoon rainfall during the post-flood season. Front. Environ. Sci. 10, 942974. doi:10.3389/fenvs.2022.942974
Liu, J., Jin, J., and Niu, G.-Y. (2021). Effects of irrigation on seasonal and annual temperature and precipitation over China simulated by the WRF model. Journal of Geophysical Research Atmospheres 126, e2020JD034222. doi:10.1029/2020JD034222
Lobell, D., Bala, G., Mirin, A., Phillips, T., Maxwell, R., and Rotman, D. (2009). Regional differences in the influence of irrigation on climate. Journal of Climate 22, 2248–2255. doi:10.1175/2008JCLI2703.1
Lu, Y., Harding, K., and Kueppers, L. (2017). Irrigation effects on land–atmosphere coupling strength in the United States. Journal of Climate 30, 3671–3685. doi:10.1175/JCLI-D-15-0706.1
Luyssaert, S., Jammet, M., Stoy, P. C., Estel, S., Pongratz, J., Ceschia, E., et al. (2014). Land management and land-cover change have impacts of similar magnitude on surface temperature. Nature Climate Change 4, 389–393. doi:10.1038/nclimate2196
Mahmood, R., Pielke Sr, R. A., Hubbard, K. G., Niyogi, D., Dirmeyer, P. A., Mcalpine, C., et al. (2014). Land cover changes and their biogeophysical effects on climate. International Journal of Climatology 34, 929–953. doi:10.1002/joc.3736
IPCC (2021). “Summary for policymakers,” in Climate change 2021: The physical science basis. Contribution of working group I to the sixth assessment report of the intergovernmental Panel on climate change. Editors V. MassonDelmotte, P. Zhai, A. Pirani, S. L. Connors, C. Péan, S. Bergeret al. (Cambridge, United Kingdom and New York, NY, USA: Cambridge University Press), 3–32. doi:10.1017/9781009157896.001
Mishra, V., Ambika, A. K., Asoka, A., Aadhar, S., Buzan, J., Kumar, R., et al. (2020). Moist heat stress extremes in India enhanced by irrigation. Nature Geoscience 13, 722–728. doi:10.1038/s41561-020-00650-8
Nocco, M. A., Smail, R. A., and Kucharik, C. J. (2019). Observation of irrigation-induced climate change in the Midwest United States. Global Change Biology 25, 3472–3484. doi:10.1111/gcb.14725
O’brien, T. A., Sloan, L. C., and Snyder, M. A. (2011). Can ensembles of regional climate model simulations improve results from sensitivity studies? Climate Dynamics 37, 1111–1118. doi:10.1007/s00382-010-0900-5
Oleson, K., Lawrence, D., Bonan, G., Drewniak, B., Huang, M., Koven, C., et al. (2013). Technical description of version 4.5 of the community land model (CLM). Boulder, CO: NCAR.
Ozdogan, M., Rodell, M., Beaudoing, H. K., and Toll, D. L. (2010). Simulating the effects of irrigation over the United States in a land surface model based on satellite-derived agricultural data. Journal of Hydrometeorology 11, 171–184. doi:10.1175/2009JHM1116.1
Pal, J. S., Small, E. E., and Eltahir, E. A. B. (2000). Simulation of regional-scale water and energy budgets: Representation of subgrid cloud and precipitation processes within RegCM. Journal of Geophysical Research Atmospheres 105, 29579–29594. doi:10.1029/2000JD900415
Portmann, F. T., Siebert, S., and Döll, P. (2010). MIRCA2000—global monthly irrigated and rainfed crop areas around the year 2000: A new high-resolution data set for agricultural and hydrological modeling. Global Biogeochemical Cycles 24, GB1011. doi:10.1029/2008GB003435
Qian, Y., Huang, M., Yang, B., and Berg, L. K. (2013). A modeling study of irrigation effects on surface fluxes and land–air–cloud interactions in the Southern Great Plains. Journal of Hydrometeorology 14, 700–721. doi:10.1175/JHM-D-12-0134.1
Sacks, W. J., Cook, B. I., Buenning, N., Levis, S., and Helkowski, J. H. (2009). Effects of global irrigation on the near-surface climate. Climate Dynamics 33, 159–175. doi:10.1007/s00382-008-0445-z
Seneviratne, S. I., Corti, T., Davin, E. L., Hirschi, M., Jaeger, E. B., Lehner, I., et al. (2010). Investigating soil moisture–climate interactions in a changing climate: A review. Earth-Science Reviews 99, 125–161. doi:10.1016/j.earscirev.2010.02.004
Seneviratne, S. I., Lüthi, D., Litschi, M., and Schär, C. (2006). Land–atmosphere coupling and climate change in Europe. Nature 443, 205–209. doi:10.1038/nature05095
Seneviratne, S. I., Phipps, S. J., Pitman, A. J., Hirsch, A. L., Davin, E. L., Donat, M. G., et al. (2018). Land radiative management as contributor to regional-scale climate adaptation and mitigation. Nature Geoscience 11, 88–96. doi:10.1038/s41561-017-0057-5
IPCC (2019). “Summary for policymakers,” in Climate change and land: An IPCC special report on climate change, desertification, land degradation, sustainable land management, food security, and greenhouse gas fluxes in terrestrial ecosystems. Editors P. R. Shukla, J. Skea, E. Calvo Buendia, V. Masson-Delmotte, H. O. Pörtner, D. C. Robertset al. In press. Available at: https://www.ipcc.ch/site/assets/uploads/sites/4/2020/02/SPM_Updated-Jan20.pdf (Accessed Oct 17, 2022).
Singh, D., Mcdermid, S. P., Cook, B. I., Puma, M. J., Nazarenko, L., and Kelley, M. (2018). Distinct influences of land cover and land management on seasonal climate. Journal of Geophysical Research Atmospheres 123 (12), 12017–12039. doi:10.1029/2018JD028874
Smith, P., Bustamante, M., Ahammad, H., Clark, H., Dong, H., Elsiddig, E. A., et al. (2014). “Agriculture, forestry and other land use (AFOLU),” in Climate change 2014: Mitigation of climate change. Contribution of working group III to the fifth assessment report of the intergovernmental Panel on climate change. Editors O. Edenhofer, R. Pichs-Madruga, Y. Sokona, E. Farahani, S. Kadner, K. Seybothet al. (Cambridge, United Kingdom and New York, NY, USA: Cambridge University Press). doi:10.1017/CBO9781107415416.017
Sun, H., Pan, Z., and Liu, X. (2012). Numerical simulation of spatial-temporal distribution of dust aerosol and its direct radiative effects on East Asian climate. Journal of Geophysical Research Atmospheres 117, D13206. doi:10.1029/2011JD017219
Thiery, W., Davin, E. L., Lawrence, D. M., Hirsch, A. L., Hauser, M., and Seneviratne, S. I. (2017). Present-day irrigation mitigates heat extremes. Journal of Geophysical Research Atmospheres 122, 1403–1422. doi:10.1002/2016JD025740
Thiery, W., Visser, A. J., Fischer, E. M., Hauser, M., Hirsch, A. L., Lawrence, D. M., et al. (2020). Warming of hot extremes alleviated by expanding irrigation. Nature Communications 11, 290. doi:10.1038/s41467-019-14075-4
United Nations General Assembly (2015). Transforming our world: the 2030 agenda for sustainable development. New York, NY, USA: United Nations. Available at: https://sdgs.un.org/sites/default/files/publications/21252030%20Agenda%20for%20Sustainable%20Development%20web.pdf (Accessed Oct 17, 2022).
Viovy, N. (2018). CRUNCEP version 7 - atmospheric forcing data for the community land model. Boulder, CO: Research Data Archive at the National Center for Atmospheric Research, Computational and Information Systems Laboratory. 10.5065/PZ8F-F017 (Accessed Oct 17, 2022).
Wang, Y., Li, S., Qin, S., Guo, H., Yang, D., and Lam, H.-M. (2020). How can drip irrigation save water and reduce evapotranspiration compared to border irrigation in arid regions in northwest China. Agricultural Water Management 239, 106256. doi:10.1016/j.agwat.2020.106256
Ward, D. S., Mahowald, N. M., and Kloster, S. (2014). Potential climate forcing of land use and land cover change. Atmospheric Chemistry and Physics 14, 12701–12724. doi:10.5194/acp-14-12701-2014
Winckler, J., Reick, C. H., and Pongratz, J. (2017). Robust identification of local biogeophysical effects of land-cover change in a global climate model. Journal of Climate 30, 1159–1176. doi:10.1175/JCLI-D-16-0067.1
Wu, L., Feng, J., and Miao, W. (2018). Simulating the impacts of irrigation and dynamic vegetation over the North China Plain on regional climate. Journal of Geophysical Research Atmospheres 123, 8017–8034. doi:10.1029/2017JD027784
Wu, X., Wang, L., Yao, R., Luo, M., and Li, X. (2021). Identifying the dominant driving factors of heat waves in the North China Plain. Atmospheric Research 252, 105458. doi:10.1016/j.atmosres.2021.105458
Xie, W., Zhou, B., Han, Z., and Xu, Y. (2021). Projected changes in heat waves over China: Ensemble result from RegCM4 downscaling simulations. International Journal of Climatology 41, 3865–3880. doi:10.1002/joc.7047
Xu, R., Li, Y., Teuling, A. J., Zhao, L., Spracklen, D. V., Garcia-Carreras, L., et al. (2022). Contrasting impacts of forests on cloud cover based on satellite observations. Nature Communications 13, 670. doi:10.1038/s41467-022-28161-7
Yang, B., Zhang, Y., Qian, Y., Tang, J., and Liu, D. (2016). Climatic effects of irrigation over the Huang-Huai-Hai Plain in China simulated by the weather research and forecasting model. Journal of Geophysical Research Atmospheres 121, 2246–2264. doi:10.1002/2015JD023736
Yang, Q., Huang, X., and Tang, Q. (2020). Irrigation cooling effect on land surface temperature across China based on satellite observations. Science of The Total Environment 705, 135984. doi:10.1016/j.scitotenv.2019.135984
Zeng, X., Zhao, M., and Dickinson, R. E. (1998). Intercomparison of bulk aerodynamic algorithms for the computation of sea surface fluxes using TOGA COARE and TAO Data. Journal of Climate 11, 2628–2644. doi:10.1175/1520-0442(1998)011<2628:IOBAAF>2.0.CO;2
Zeng, Y., Xie, Z., and Liu, S. (2017a). Seasonal effects of irrigation on land–atmosphere latent heat, sensible heat, and carbon fluxes in semiarid basin. Earth System Dynamics 8, 113–127. doi:10.5194/esd-8-113-2017
Zeng, Y., Xie, Z., and Zou, J. (2017b). Hydrologic and climatic responses to global anthropogenic groundwater extraction. Journal of Climate 30, 71–90. doi:10.1175/JCLI-D-16-0209.1
Zhang, X., Alexander, L., Hegerl, G. C., Jones, P., Tank, A. K., Peterson, T. C., et al. (2011). Indices for monitoring changes in extremes based on daily temperature and precipitation data. WIREs Climate Change 2, 851–870. doi:10.1002/wcc.147
Keywords: irrigation, RegCM, numerical modeling, temperature extremes, China
Citation: Li X, Li X, Hua W, Ma H, Zhou J and Pang X (2023) Modeling the effects of present-day irrigation on temperature extremes over China. Front. Earth Sci. 11:1084892. doi: 10.3389/feart.2023.1084892
Received: 31 October 2022; Accepted: 09 January 2023;
Published: 24 January 2023.
Edited by:
Yan Li, Beijing Normal University, ChinaReviewed by:
Liang Chen, University of Nebraska-Lincoln, United StatesYing Xu, National Climate Center, China
Copyright © 2023 Li, Li, Hua, Ma, Zhou and Pang. This is an open-access article distributed under the terms of the Creative Commons Attribution License (CC BY). The use, distribution or reproduction in other forums is permitted, provided the original author(s) and the copyright owner(s) are credited and that the original publication in this journal is cited, in accordance with accepted academic practice. No use, distribution or reproduction is permitted which does not comply with these terms.
*Correspondence: Xing Li, lx_cuit@163.com