 Xing Li1,2*
 Xiao Li1,3
 Hedi Ma4
 Wenjian Hua3
 Haishan Chen3Xiaohang Wen1Wanxin Zhang1Yiwen Lu2Xueqi Pang5
 Xuanwen Zhang5
- 1Plateau Atmosphere and Environment Key Laboratory of Sichuan Province, College of Atmospheric Science, Chengdu University of Information Technology, Chengdu, China
- 2Shanghai Ecological Forecasting and Remote Sensing Center, Shanghai Meteorological Service, Shanghai, China
- 3Key Laboratory of Meteorological Disaster, Ministry of Education (KLME)/Joint International Research Laboratory of Climate and Environment Change (ILCEC)/Collaborative Innovation Center on Forecast and Evaluation of Meteorological Disasters (CIC-FEMD), Nanjing University of Information Science and Technology, Nanjing, China
- 4Hubei Key Laboratory for Heavy Rain Monitoring and Warning Research, Institute of Heavy Rain, China Meteorological Administration, Wuhan, China
- 5Department of Atmospheric and Oceanic Sciences, Fudan University, Shanghai, China
Dynamic and continuous land use and cover change (LUCC) is one of the external forcing factors affecting regional climate in China. Based on the annual dynamic global land cover dataset derived from the Global Land Surface Satellite (GLASS-GLC), this paper modelled and investigated the effects of annual transient LUCC on precipitation over China using the regional climate model RegCM4.8.2. Analysis of the GLASS-GLC data revealed that considerable conversions of cropland to forest, grassland to cropland and bare ground to grassland had occurred during the last 3 decades (1984–2013) in southern, northeastern and northwestern China respectively. By comparing the differences between the two sets of experiments under the fixed LUCC and dynamic LUCC scenarios, the results showed that reforestation in southern China during the past 3 decades significantly enhanced local convective afternoon rainfall (CAR; ∼2 mm/day) during the post-flood season (POF; July-August-September). This reforestation effect on CAR also increased with the intensity of LUCC. However, the realistic LUCC effects were weak and negligible for other periods, regions and large-scale precipitation. Furthermore, we have identified two possible reasons that favored the occurrence of POFCAR, namely that the moisture and instability conditions required to trigger convections were both enhanced by reforestation. This was evidenced by increases (decreases) in convective available potential energy (lifting condensation level), increases in atmospheric water vapor content and declining tendencies of equivalent potential temperature with height. Overall, this study highlights the importance of reforestation impacts on the diurnal variations of the precipitation.
Introduction
Land use and cover change (LUCC) is one of the anthropogenic external forcing factors that affect global and regional climate (IPCC, 2013; IPCC, 2021). According to the latest Intergovernmental Panel on Climate Change (IPCC) Special Report on Climate Change and Land (SRCCL), 71% of the global ice-free land has been used by humans over the historical period, and 24% of the land has also undergone land cover conversion (Arneth et al., 2019). Such intense LUCC can exert influences on local, regional and even global scale weather and climate through two pathways, namely biogeophysical (e.g., Bright, 2015; Chen and Dirmeyer, 2016; Li et al., 2017; Winckler et al., 2017; Hirsch et al., 2018; Li et al., 2018) and biogeochemical (e.g., Claussen et al., 2001; Cherubini et al., 2012; Ciais et al., 2013; Ward et al., 2014) mechanisms. On the one hand, LUCC can modulate the local energy-water balance by changing albedo, evapotranspiration, and roughness, causing changes in weather and climate (e.g., Bonan, 2008; Davin and de Noblet-Ducoudré, 2010; Devaraju et al., 2018). On the other hand, LUCC can also alter the biogeochemical cycle by changing the biomass and the associated atmospheric composition, further affecting climate change and the provision of ecosystem services (Pielke, 2005; Reyers et al., 2009; Devaraju et al., 2015). However, the impact of LUCC on climate is subject to considerable uncertainties and challenges (e.g., Pitman et al., 2009; Pitman et al., 2011; Houghton et al., 2012; Li et al., 2018; Ge et al., 2019), and the IPCC gives only medium confidence in the net global effects of LUCC (IPCC, 2021).
A large number of observational and numerical modeling studies have highlighted the much more significant impacts of LUCC on local and regional climates than the global mean (e.g., Lohila et al., 2010; Lee et al., 2011; Pielke Sr et al., 2011; Hua and Chen, 2013; Mahmood et al., 2014; Lawrence and Vandecar, 2015). However, due to the long-time scales of LUCC and the insufficient accumulation of observations, the regional LUCC effects have been assessed mainly through the global land-use model-based reconstructed LUCC datasets (e.g., the Land-Use Harmonization datasets; Hurtt et al., 2011; Hurtt et al., 2020) and numerical simulations. This results in the confidence in the quantitative impact of LUCC being highly reliant on the model’s representations of the LUCC-related processes and the accuracy of the data used to characterize LUCC (Prestele et al., 2017). Numerous studies have used reconstructed data or idealized LUCC scenarios (e.g., complete deforestation) to reveal the effects and mechanisms of historical LUCC on regional and global climate (e.g., Pitman et al., 2012; Chen and Dirmeyer, 2017; Li et al., 2017; Li et al., 2022). These studies generally reached similar conclusions: large-scale and high-intensity LUCCs had considerable regional effects on temperatures and the related extremes, while being relatively weak and more uncertain for precipitation. Due to the relatively coarse resolution of the global model, it is likely that LUCC effects on small-scale processes, such as local wind systems, convections, boundary layer processes and scale-interactions are ignored (Mahmood et al., 2014). Therefore, to better assess the role of LUCC in climate change, more refined representations and explanations of the realistic LUCC and its impacts and mechanisms on climate are needed. Meanwhile, Lawrence and Vandecar (2015) and Mahmood et al. (2016) also pointed out that the quantitative assessments derived from simulations using state-of-the-art mesoscale models and more realistic LUCC scenarios are helpful and useful for local policymakers.
After the 1980s, as satellite data accumulated, satellite-based LUCC datasets with the high resolution and long time series, were developed. For example, the Terra and Aqua combined Moderate Resolution Imaging Spectroradiometer (MODIS) yearly land cover type dataset (e.g., MCD12C1; Sulla-Menashe and Friedl, 2018), the European Space Agency (ESA)-Climate Change Initiative (CCI)-Land Cover (LC) dataset (ESA-CCI-LC; ESA, 2017) and the Global Land Surface Satellite Climate Data Records-derived land cover dataset (GLASS-GLC; Liu et al., 2020). Among these, the GLASS-GLC dataset is the most recent, longest time series and highest average accuracy product of the three popular LUCC datasets mentioned above (Liu et al., 2020). It also provides a reliable data source for the use of regional climate models to simulate the weather-climate effects of the realistic and long-term dynamics of LUCC. Based on the LUCC scenarios characterized by satellite data, a growing number of studies in recent years have also assessed the impacts of realistic LUCC using regional climate models (e.g., Chen et al., 2015; Hu et al., 2015; Zhang et al., 2021). For example, Hu et al. (2015) used the Weather Research and Forecasting (WRF) model to reveal that LUCC (1980 versus 2000s) cooled the surface air temperature in northern China by 0.3–0.5°C and increased summer precipitation in southern China by ∼6–7%. Zhang et al. (2021) also used the WRF model and similar LUCC scenarios and experiments to highlight that the impact of LUCC on precipitation in eastern China may be strongly influenced by the large-scale background climate. The vast majority of these studies have assessed the impacts of LUCC based on the comparison of the differences in climate state between the two fixed LUCC scenarios, with no consideration of the interannual variability of LUCC dynamics.
China has experienced the remarkable forest restoration over the last 3 decades, especially in southern China, leading the way in global greening (Chen et al., 2019). In terms of local ecological restoration, afforestation/reforestation significantly reverses land degradation and increases forest carbon sinks to potentially mitigate GHG-induced global warming (e.g., Pan et al., 2011; Bryan et al., 2018). However, afforestation/reforestation as a possible greenhouse gas mitigation strategy to meet climate targets (Grassi et al., 2017), the impacts of its biogeophysical effects (e.g., albedo, roughness and evapotranspiration) in the realistic LUCC scenario, also need to be fully assessed and understood (e.g., Betts, 2000; Bonan, 2008; Davin and de Noblet- Ducoudré, 2010; Perugini et al., 2017; Duveiller et al., 2018). In particular, the effects of forests on precipitation are largely unknown and uncertain, both in terms of their extent and physical mechanisms. This is where the previous researches were highly inadequate. Therefore, based on the above considerations and gaps, this paper explores the effects of realistic LUCC on precipitation over China by using the latest satellite-based LUCC dataset to conduct numerical simulations with a state-of-the-art regional climate model, focusing on: 1) The quantitative assessment of realistic LUCCs on precipitation, especially the relative contribution of convective and large-scale precipitation responses. 2) The associated physical mechanisms.
Data, Model and Methodology
Regional Climate Model
The state-of-the-art regional climate model used in this study to investigate the realistic LUCC effects in China is the Regional Climate Model system (RegCM) developed by the International Centre for Theoretical Physics (ICTP). We use RegCM version 4.8.2 and select the Community Land Model version 4.5 (CLM4.5; Oleson et al., 2013) from the United States National Center for Atmospheric Research (NCAR) as the land surface component. RegCM was originally developed by Dickinson et al. (1989) and Giorgi and Bates (1989) for dynamical downscaling in limited-area regional climate modeling. To date, RegCM has been updated to its fourth generation (Giorgi et al., 2012; Coppola et al., 2021) and the fifth generation (preview version can be found at https://github.com/ICTP/RegCM/tree/Version5) will be released soon. RegCM4 is one of the most widely used regional climate models in multiple fields over the last decades (e.g., Gao and Giorgi, 2017). Particularly for East Asia, RegCM4 has become one of the most popular tools for exploring regional climate change and projections, aerosols and LUCCs (e.g., Chen et al., 2015), because of its good capability to reproduce both mean and extreme climates (e.g., Ji and Kang, 2015; Hu et al., 2016). The up-to-date source code of RegCM4 can be obtained from https://github.com/ICTP/RegCM/.
Satellite Data and Pre-Processing Procedure
The GLASS-GLC land cover dataset is used to characterize a realistic LUCC scenario in our study, which contains the most recently released global annual land cover maps produced using machine learning techniques with a horizontal resolution of 5 km (Liu et al., 2020). The GLASS-GLC has the highest averaged accuracy and the longest time coverage compared to other popular satellite-based land cover datasets such as MCD12C1 and ESA-CCI-LC (Liu et al., 2020). This dataset has seven major land cover types, i.e., cropland, forest, grassland, shrubland, tundra, bare land, and snow/ice and covers a total of 34 global land cover maps for the period 1982–2015. Details of the production of GLASS-GLC can be found in Liu et al. (2020). The raw data can be downloaded from https://store.pangaea.de/Publications/LiuH-etal_2020/GLASS-GLC.zip.
The land surface component of RegCM4, i.e., CLM4.5, has the ability to simulate annual transient LUCC, updating not only the change in PFT percentage every day, but also the associated balance of mass and energy fluxes (Oleson et al., 2013). In order to extract and merge annual dynamic LUCC information from the original GLASS-GLC into the initial and boundary forcings of the land surface model of RegCM4 (i.e., CLM4.5), we need to address the following issues. 1) The conversions of land cover “type” data from the original GLASS-GLC to the plant function type (PFT) “percentage” data required by the CLM. 2) Minimizing the possible year-to-year fluctuations in the original satellite data; 3) Matching the LUCC information from GLASS-GLC as much as possible to the other initial and boundary conditions of CLM4.5 (e.g., leaf area index; LAI). Based on the above consideration, we preprocessed the GLASS-GLC data by closely following the similar procedures to that of Liu et al. (2021b). The detailed processes can be found in the Supporting Information (Supplementary Appendix S1). The final pre-processed GLASS-GLC-based land cover forcing data have exactly the same structure as the model default data for simulating dynamic LUCC (i.e., annually percentage information for 17 PFTs: bare ground, eight trees, three shrubs, three grasses and two crop types). In addition, the “urban” type is not included in the GLASS-GLC data, so the realistic LUCC scenario in our study only involves vegetation changes. The urban PFT information remains default and fixed throughout the simulation period. We also emphasize that only the PFT percentage information in the forcing data was changed in this study based on information from GLASS-GLC, and the associated grid-level vegetation parameters (e.g., LAI) changed with annual dynamic PFT-based updates. However, the prescribed PFT-specific vegetation structure values (e.g., LAI, stem area indices and canopy top and bottom heights) for calculating grid-level vegetation parameters remained unchanged.
We first fully examined the spatio-temporal characteristics of the realistic LUCC using two methods, namely the linear trends (Figure 1) and the empirical orthogonal function (EOF) leading modes (Supplementary Figure S1). Figure 1 shows the linear trends of four major PFTs (i.e., bare ground, grassland, forests and cropland) percentages during 1984–2013. In short, three evident LUCC regions are detected from the spatial modes: i.e., conversions from cropland to forest in southern China, conversions from grassland to cropland in northeastern China and the conversions from bare ground to grassland major in northwestern China (i.e., parts of Xinjiang province, Tibet and the Hetao region; Figures 1A–D). In addition, the EOF results also indicate that dominant spatio-temporal patterns for all types of LUCC in China during the past 30 years have been characterized by overall long-term trends.
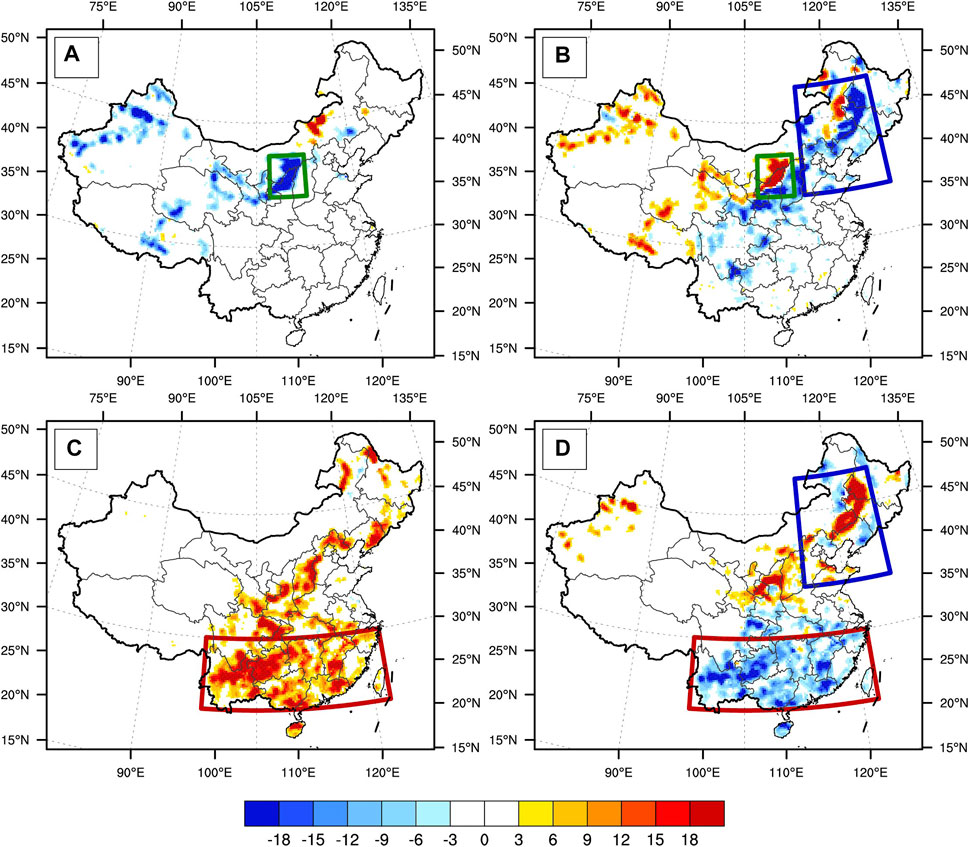
FIGURE 1. The linear trends of four major PFTs percentages during 1984–2013: (A) bare ground, (B) grassland, (C) forest and (D) cropland in China, units: %/30a. Note that the red, blue and green rectangles in the figure represent the main cropland-to-forest (21.5–30°N; 98–122°E), grassland-to-cropland (36–49°N; 114–127°E) and bare groud-to-grassland (36–41°N; 107–112.5°E) transition areas, respectively. All colored values in the plots are statistically significant at 95% confidence level.
Experimental Design
To investigate the transient LUCC effects and mechanisms on precipitation over China, we conduct two groups of long-term simulations (from 1983 to 2013) using RegCM4. 1) FIXED experiment: the simulation forced by land covers fixed at 1984; 2) TRANS experiment: simulations forced by annual transient land cover maps from 1984–2013. Additionally, to reduce the uncertainty in the results, two additional perturbation runs of the TRANS experiment, noted as TRANS_p1 and TRANS_p2, are performed with limited computational resources. These two perturbed runs randomly perturb the atmospheric temperature and humidity boundary conditions 6-hourly (i.e., add perturbations when update the boundary conditions), with the maximum amplitude being approximately 10−5 of the standard deviation of that variable. It should be noted that we change only the land cover maps between the two groups of experiments within China. The land cover information for the rest of the simulated domain (see Figure 2) outside of China (e.g., India and Mainland Southeast Asia) is fixed as the default land cover map (i.e., MODIS; Lawrence and Chase, 2007) through the whole simulation periods. All simulations (i.e., both FIXED and TRANS groups) are setup consistently according to the framework of the East Asia domain of the Coordinated Regional Downscaling Experiment (CORDEX) Phase II. In detail, we configure the RegCM computational domain based on the Rotated Mercator map projection centered at (35°N, 116°E) with a total of 280 (north-south) × 428 (west-east) grid points at 25 km spacing, as shown in Figure 2. The simulations are driven by the European Center for Medium-Range Weather Forecasts (ECMWF) Interim reanalysis (i.e., ERA-Interim; Dee et al., 2011), which initiate on 1 Jan 1983 and integrate continuously through 31 December 2013. The first year is considered as the spin-up time and is not included in the results below. The sea surface temperatures are prescribed from the monthly sea surface temperature from Hadley Centre (HadISST). The selections of other configurations and various physical parameterizations schemes are listed in Table 1. We chose combinations of these schemes because they have been proven to be the “best” combination for modeling the regional climate of East Asia (Han et al., 2015; Gao et al., 2016; Gao et al., 2017).
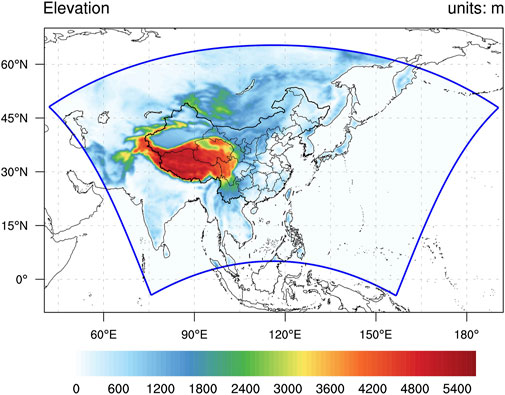
FIGURE 2. The simulation domain and elevations (units: m) of the model. The blue lines indicate the boundary of the simulation domain.
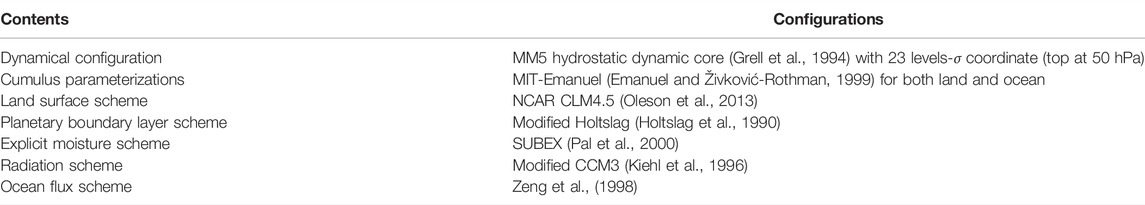
TABLE 1. The configurations of the model and the selections of the parameterization schemes.
To better interpret the changes in the PFT and their associated vegetation parameters, we also examined the linear trends of various vegetation parameters (e.g., LAI, surface roughness length and albedo) in the TRANS group, as shown in Figure 3. It is clear that the LAI and surface roughness (surface albedo) tend to increase (decrease) due to the reforestation in southern China (Figure 3). The conversions of bare ground to grassland in the Hetao area also resulted in a significant increase (decrease) in LAI (surface albedo). In addition, the conversion of grassland to cropland in northern China seems to have produced no change in vegetation parameters (Figure 3), probably because the vegetation structure values for grassland and cropland in the PFT-specific look-up tables are very close.
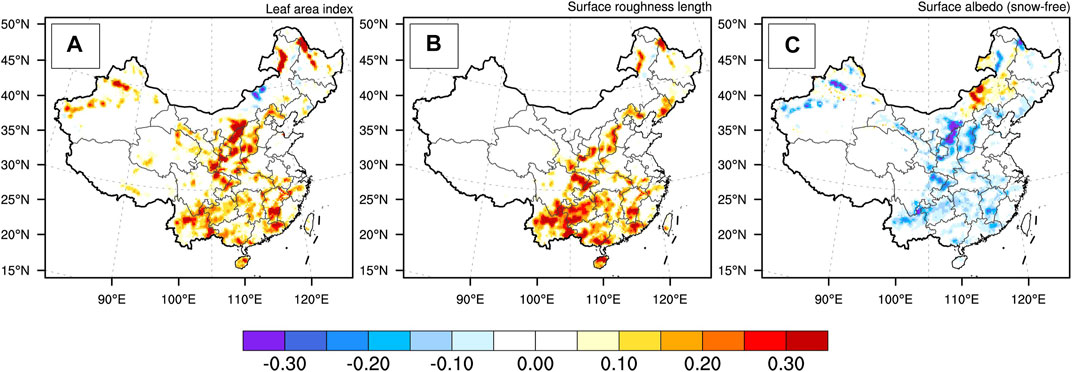
FIGURE 3. The linear trends of various vegetation parameters during 1984–2013 in the TRANS experiment: (A) leaf area index, units: m2 m−2/30a; (B) surface roughness length, units: m/30a; and (C) snow-free surface albedo, units: 10−1/30a. All colored values in the plots are statistically significant at 95% confidence level.
Other Methodology
To measure the significance of the differences between the two experiments (i.e., the LUCC effect), we use a two-tailed modified student t-test (Zwiers and von Storch, 1995). By subtracting FIXED simulation from each simulation in TRANS group, we can obtain the LUCC effects in each pair of simulations. Then, we can calculate the multiyear monthly/seasonal ensemble mean to quantify the effects of realistic LUCC. Note that the results in the following sections are represented by the ensemble means. The degrees of consistency (i.e., uncertainties) are defined as follows: “strong” when the LUCC-induced changes have the same sign and are statistically significant (at the 90% confidence level) in all three paired simulations; “moderate” when two of the simulations have the same sign as the ensemble mean and are statistically significant; “weak” when only one simulation is statistically significant; “insignificant” when none of the paired simulations are significant. In addition, some general statistical methods used in this paper (e.g., linear trend) will not be repeatedly described here.
Results
Previous studies had shown that LUCC effects on daily/monthly mean precipitation were weak and uncertain (e.g., Pitman et al., 2009), however, its effects on sub-daily precipitation may be non-neglighable (e.g., Wang et al., 2000; Chen and Dirmeyer, 2017). During the hot season (especially summer), precipitations often manifest distinct diurnal signals along the southeast coast of China, which are mainly associated with local convective afternoon rainfall events due to local secondary circulations (e.g., sea-land breezes). During the last 30 years, parts of the realistic LUCCs also coincide in southern China (Figures 1C,D), where afternoon convection events are frequent during the rainy season. Therefore, in contrast to previous studies that explored the influence of LUCC on precipitation from a daily mean perspective, we focus mainly on the variations of afternoon precipitation in the following results. Because of the wide range of regional longitudes (time zones) spanning in China, it is difficult to characterize the afternoon moment for the whole region with a specific moment at a coarse resolution of 6-hourly. So we define the moment when the daily maximum temperature occurs for a given day at a specific grid point as the local afternoon. All relevant variables, such as precipitation and temperature, shown in the following results refer to the values at that moment. It should also be noted that we separated the total afternoon precipitation into the large-scale and convective precipitation (short for LAR and CAR, respectively) for further investigations.
Seasonal Afternoon Precipitation Changes in Response to LUCC
We first examine the variations in monthly afternoon precipitation induced by realistic LUCCs over three regions with intense LUCCs, shown as multi-year monthly means of regional averages (Figure 4). In general, the responses of afternoon precipitation due to realistic LUCCs are limited. Among the three typical LUCC regions, only the reforestation in southern China have caused significant changes in CAR during the post-flood season of southern China (i.e., July-August-September, short for POF hereinafter), while the other LUCC conversions in the Hetao region (i.e., bare ground-to-grassland conversions) and northern China (i.e., grassland-to-cropland conversions) basically lead to slight and insignificant changes in the LAR and CAR (Figure 4). In detail for southern China, reforestation significantly increases the CAR during the POF season (POFCAR hereinafter), with the highest increases of 1.19 mm/day in August, followed by 0.56 mm/day in July and 0.52 mm/day in September, respectively (Figure 4A). Meanwhile, the inter-sample uncertainty of the LUCC-induced POFCAR responses is small, i.e., the averaged inter-sample standard deviation of the POFCAR is only 0.11 mm/day (Figure 4A). In other months, however, reforestation causes little change (within ± 0.15 mm/day) in CAR, even during the other rainy season in southern China (i.e., the pre-flood season, April-May-June, PRF hereinafter). Furthermore, for the LAR in southern China, reforestation has not caused considerable changes, and the responses to LAR are within ± 0.3 mm/day for all months (Figure 4A). In addition, bare ground-to-grassland conversions over the Hetao region induce moderate increases in CAR (∼0.3–0.5 mm/day) during part of summer and autumn months, but the responses are not significant (Figure 4B). For grassland-to-cropland conversions in northern China, no significant responses of LAR and CAR are detected and the LUCC-induced changes in precipitation are very slight (within ± 0.2 mm/day) in all months (Figure 4C).
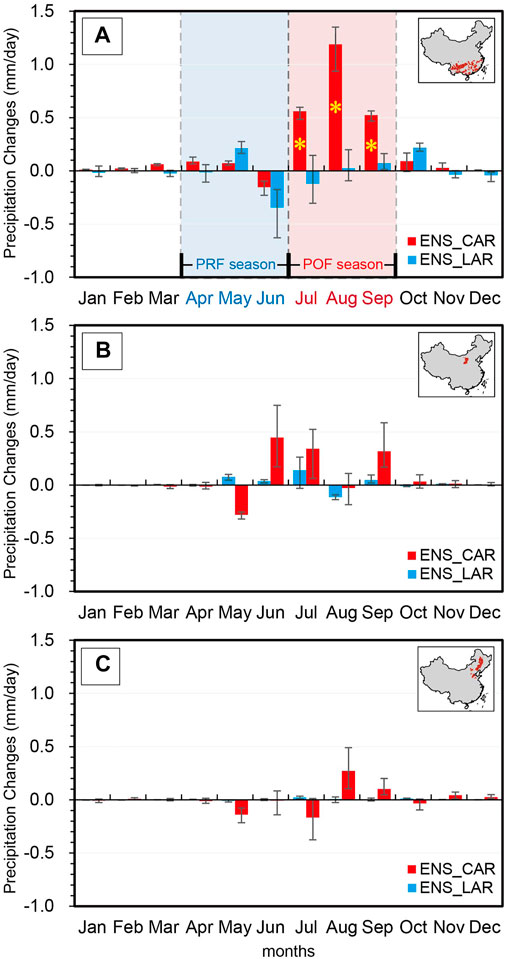
FIGURE 4. The multi-year mean monthly variations of the regional averaged realistic LUCC-induced changes in afternoon convective (red, “CAR”) and large-scale (blue, “LAR”) rainfall (units: mm/day) for three typical LUCC regions: (A) cropland-to-forest transitions in southern China, (B) bare ground-to-grassland transitions in Hetao region and (C) the grassland-to-cropland transitions in northeastern China. Note that the grids involved in the regional mean calculation are shown in the subplots in the top right corner of each figure. The bars with yellow asterisks inside indicate a greater than “moderate” degree of consistency among the results of the ensemble members. Error bars denote ensemble spread of the changes.
Interannual Variability of Afternoon Precipitation Responses to Reforestation in Southern China
Furthermore, since the realistic and transient LUCC scenario (i.e., the TRANS experiments) would cause the intensity of LUCC to increase over time when compared to the fixed LUCC scenario (i.e., the FIXED experiment), it is likely that the effect of LUCC would also be enhanced in the meantime (e.g., Li et al., 2017). Therefore, we also investigate the spatial patterns of LUCC effects on POFCAR at different decades and the regional averaged interannual variability of POFCAR over southern China due to reforestation to see whether there are enhanced LUCC effects over time. The results are shown in Figures 5, 6 respectively. It should be noted that we divided the 30-years simulation period into three sub-periods of equal length (i.e., 1984–1993, 1994–2003, 2004–2013). Figure 5 shows the spatial differences of LUCC-induced changes in POFCAR during three sub-periods (Figures 5A–C) and the entire simulation period (Figure 5D). Overall, the impacts of realistic LUCC on POFCAR do vary considerably at different periods (Figure 5). In detail, the spatial results show that among the three evident LUCC regions, indeed only the southern reforestation leads to significantly enhanced local POFCAR responses, regardless of whether they are averaged over the entire period (Figure 5D) or across the three different decades (Figures 5A–C). These results are also in good agreement with the previous regional averaging results. Moreover, the enhancement of LUCC-induced POFCAR over southern China does increase with intensified LUCC strength (Figures 5A–C). For example, during periods of weak (i.e., 1984–1993; Figure 5A) to moderate LUCC (i.e., 1994–2003; Figure 5B), although there are also some enhancements of POFCAR in southern reforestation areas, they are weak in both magnitudes and significances. In contrast, the responses of POFCAR to southern reforestation become very robust and significant during the period of intense LUCC (i.e., 2004–2013; Figure 5C). Specifically, reforestation-induced POFCAR show broad and significant enhancements across southern China during 2004–2013, with the magnitude can even exceed 2.4 mm/day (Figure 5C). For the entire simulation period, the southern reforestation regions similarly show significant POFCAR enhancements (∼1.6–2.0 mm/day) and are likely due to the contribution of the LUCC effects in the last decade (i.e., 2004–2013; Figure 5D). Moreover, we examined the percentage changes in CAR due to LUCC to confirm the robustness of the aforementioned absolute changes in CAR (Supplementary Figure S2). The results showed that the reforestation in southern China can increase CAR by 10%–20% (20%–30%) during 1984–2013 (2004–2013), which are indeed marked increases. In addition, the CAR responses have some sporadic and weak significant signals in other LUCC areas (e.g., along the Qinghai-Tibet Railway with significant decreases in CAR during 1994–2003). However, the interdecadal variations of such signal are large and not clearly related to the LUCC intensity, which may due to the internal noise of the model.
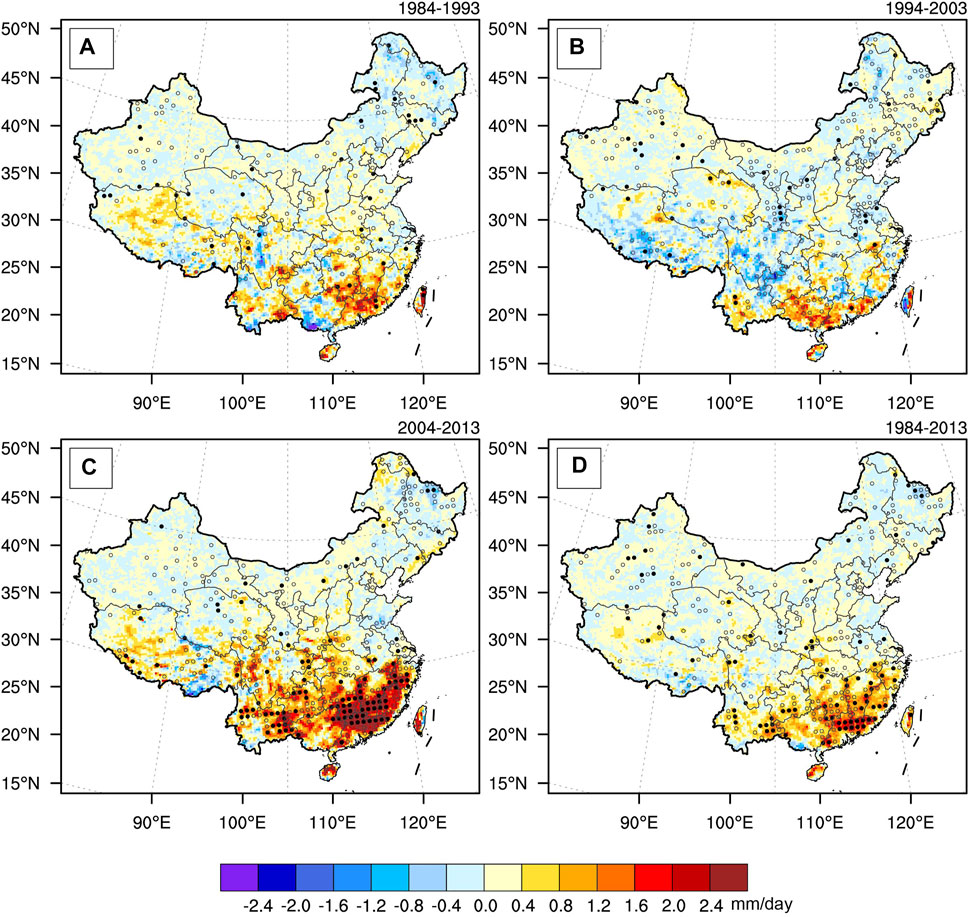
FIGURE 5. The ensemble mean results of realistic LUCC-induced changes in convective afternoon rainfall (CAR; units: mm/day) in the post-flood season (POF; July-August-September) during multiple periods over China: (A) 1984–1993, (B) 1994–2003, (C) 2004–2013, and (D) 1984–2013. The solid (hollow) black dots in the figures denote a greater than “moderate” (“weak”) degree of consistency among the results of the ensemble members.
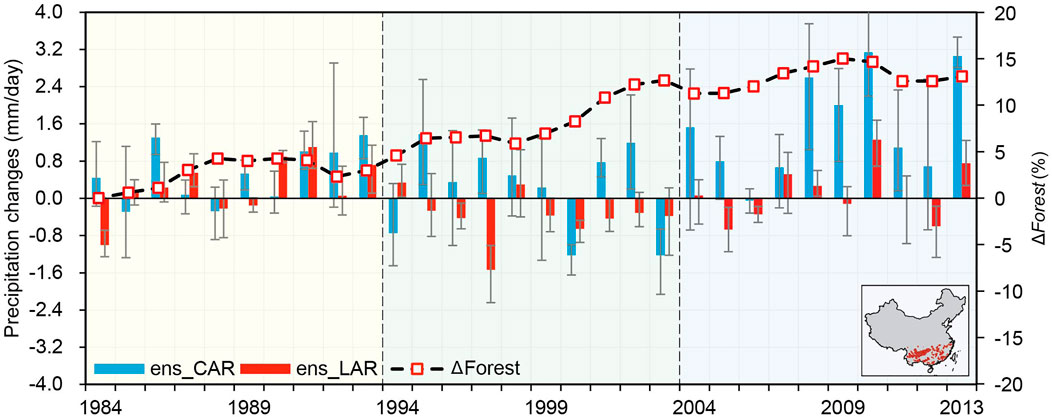
FIGURE 6. The interannual variations (bars) in the regional means of LUCC-induced changes in CAR (red) and LAR (blue) during POF season, units: mm/day, the corresponding uncertainties (error bars) and the intensity of forests (dash lines) over southern China. Note that the precipitation changes are corresponding to the y-axis on the left. The dash lines with red hollow square denote ΔForest (“Δ” denotes TRANS minus FIXED), corresponding to the y-axis on the right, units: %. The error bars are represented by the ensemble spread of the precipitation changes due to LUCC. The meaning of subplot at the bottom right corner is the same as Figure 3A. The different translucent backgrounds in the figure indicate decades with different LUCC intensities (light yellow: 1984–1993; light green: 1994–2003; light blue: 2004–2013).
Besides the CAR, we also examine the spatial patterns of LUCC-induced LAR during the POF season at different decades, and the responses of LAR show sporadic and insignificant variations during all periods (Supplementary Figure S3), which are also probably due to the internal noise. In addition, as we mentioned above, POFCAR only responded to reforestation in southern China, whereas the other intense LUCC regions and types (e.g., bare ground-to-grassland in Hetao area and grassland-to-cropland in northeastern China) did not cause significant changes in CAR (almost zero) at any time periods. This may be due to the weak changes in surface properties (e.g., surface roughness, Figure 3B) caused by the increase in grassland or the conversion of grassland to cropland when compared to reforestation, which in turn may not be able to produce pronounced changes in CAR through land-atmosphere interactions either.
Furthermore, we also investigate the interannual variability of the regional averaged LUCC-induced LAR and CAR during POF over the southern reforestation region, as shown in Figure 6. Obviously, the responses of POFCAR to reforestation are similar to the above findings, i.e., the reforestation-induced enhancement of POFCAR shows a clear increasing tendency over time, which is generally consistent with the intensity of reforestation (Figure 6). Meanwhile, the effect of reforestation appears to be effective only for the CAR and not for the LAR, and the LAR shows weak and highly uncertain responses due to reforestation (Figure 6). In conclusion, the overall impact of realistic LUCC on precipitation in China is limited, but for specific seasons (i.e., POF) and types of LUCC (i.e., reforestation), it can cause non-negligible changes in CAR. Several studies have also highlighted the effects of LUCC on precipitation from various perspectives and scenarios (e.g., Chen and Dirmeyer, 2017; Wang et al., 2020; Wang et al., 2021). In particular, Chen and Dirmeyer (2017) revealed that deforestation could lead to a reduction in precipitation and CAR, which are opposite to our LUCC scenario and sign of precipitation responses. This further suggests that the current results are intrinsically consistent with these previous findings. What are the mechanisms of the reforestation-induced enhancement of POFCAR in southern China? We will investigate this further in the next section.
Possible Causes of the Enhanced POFCAR in Southern China
Convective rainfall can theoretically be more effectively triggered by the release of more heat into the planetary boundary layer (PBL) on the one hand, which favors the development of the PBL and the formation of clouds. On the other hand, adding moisture to the lower atmosphere could also lead to moist convection initiations (Findell and Eltahir, 2003a; Findell and Eltahir, 2003b). Therefore, in order to interpret the enhanced POFCAR in southern China, we first examine the realistic LUCC-induced changes in temperature and humidity conditions during POF at the surface and lower atmosphere (i.e., the lowest model level).
Figure 7 shows the LUCC-induced changes in near-surface air temperature, canopy evapotranspiration, atmospheric temperature and specific humidity at the lowest model level during POF. Generally speaking, reforestation leads to a cooler (Figure 7A) and wetter (Figure 7B) surface condition in southern China, which probably due to the evaporative cooling effect of forests (Li et al., 2015; Bright et al., 2017; Zeng et al., 2017; Burakowski et al., 2018). In detail, for the surface air temperature, moderate coolings (−0.3∼−0.5°C) due to reforestation are generally observed only in the southern China, but their significances show weak and sporadic features (Figure 7A). The canopy evapotranspiration (ET) flux is significantly enhanced by 4–6 W m−2 due to reforestation in southern China. In addition, in parts of northwestern China, the conversion of bare ground to grassland also results in slight but significant increases of ET (Figure 7B). From changes in surface temperature and humidity, we can infer that the forests probably transport more surface moisture through the canopy and then release them into the atmospheric boundary layer. Furthermore, we also examine the LUCC-induced changes in temperature and humidity conditions at the lower atmosphere (Figures 7C,D). The results show that the cooling effect of reforestation in southern China is substantially weakened at the lower atmosphere, with only very slight responses (within ± 0.1°C) remaining (Figure 7C). However, for changes in humidity, the enhanced ET at the surface simultaneously results in significant increases in moisture in the lower atmosphere (up to 0.3 g/kg; Figure 7D). These results suggest that the enhanced humidity caused by reforestation not only changes the moisture condition at the surface, but also has a broader effect on the boundary layer and lower atmosphere, while the cooling of temperature is generally limited at the surface.
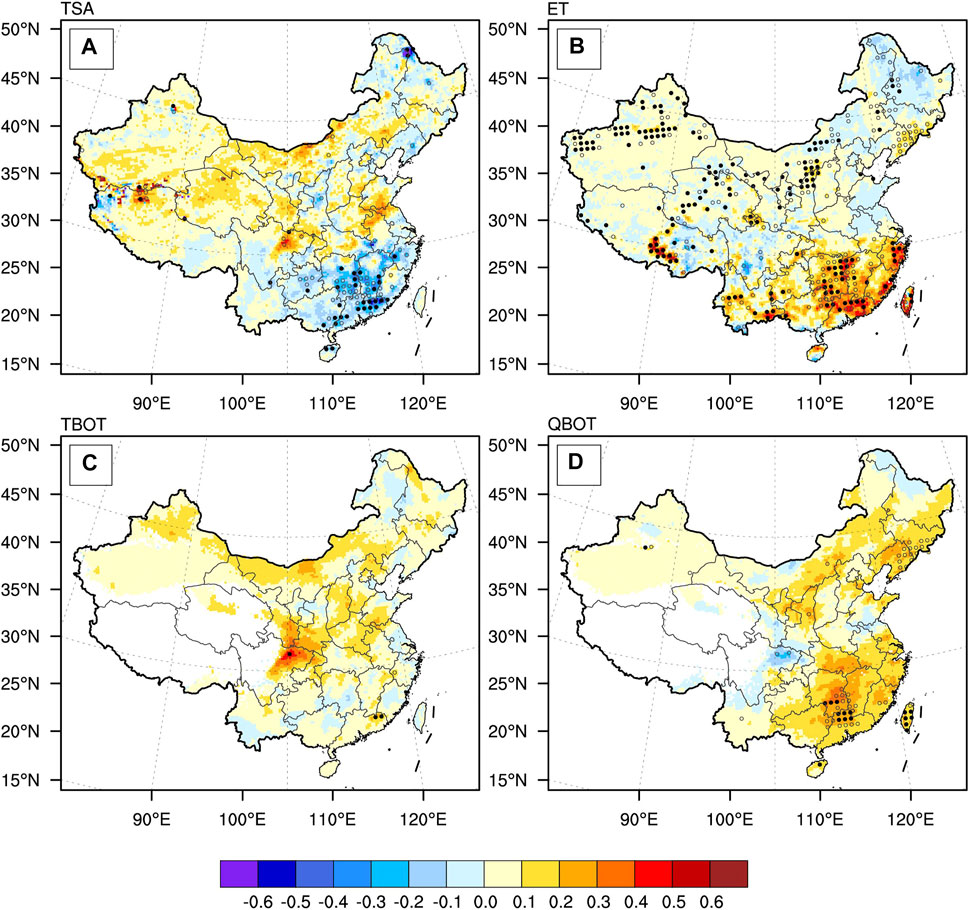
FIGURE 7. The ensemble mean results of realistic LUCC-induced changes in multiple near-surface temperature and humidity variables in POF season during 1984–2013: (A) 2 m air temperature (units: °C), (B) canopy evapotranspiration (units: 101 W m−2), (C) atmospheric air temperature at the lowest model level (units: °C) and (D) atmospheric specific humidity at the lowest model level (units: g/kg). The meaning of the solid (hollow) black dots is the same as in Figure 5. Note that the LUCC-induced changes in the area above 3000 m are masked.
To further understand the responses of reforestation-induced temperature and humidity states (expressed as specific humidity and equivalent potential temperature) in the low-to-mid atmosphere, longitude-height profiles (averaged over 21.5–30 °N) for the southern reforested regions are performed, as shown in Figure 8. In terms of water vapor, reforestation causes overall increases in humidity throughout the lower troposphere (i.e., 1000–500 hPa), with the greatest response detected at the surface, and the magnitude of the increase in humidity decreases with height (Figure 8A). This considerable increase in the humidity at the lower troposphere is highly corresponding to the previous result of enhanced ET caused by reforestation in southern China during POF (i.e., Figures 7B,D). It is noted that the increases in specific humidity provide the necessary moisture conditions for precipitation on the one hand, and on the other hand their vertical characteristics also favor the establishment of a “dry top and wet bottom” stratification, which has the potential to increase the convective instability energy. The equivalent potential temperature (θe) is an important parameter for representing the combined features of temperature and humidity, and it is also closely related to the convective available potential energy (CAPE; Machado et al., 2002; Parker 2002; Kalthoff et al., 2011). For the θe, it is clear that the highest warming is located at about 700 hPa (∼0.15 K; Figure 7A), which could lead to increased convective instability in the mid-to-upper troposphere and favoring the vertical stretching of the convection system.
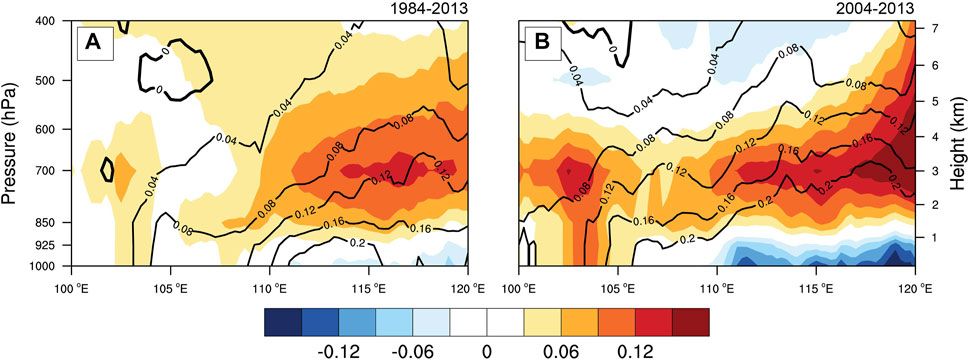
FIGURE 8. The meridional sections (longitude-height) of the LUCC-induced changes in equivalent potential temperature (filled color; units: K) and atmospheric specific humidity (contours; units: g/kg) for the southern China (averaged over 21.5–30 °N) in the POF season during (A) 1984–2013 and (B) 2004–2013.
Figure 9 shows the LUCC-induced changes in convective-related variables associated with the CAR, i.e., CAPE, convection inhibition energy (CIN), atmospheric water vapor content (PRW) and lifting condensation level (LCL). Not surprisingly, there are moderate increases in CAPE due to reforestation in southern China, with an averaged enhancement of approximately 40–60 J kg−1 (Figure 9A). This is highly correlated with the observed enhancement of CAR in southern reforested regions (i.e., Figures 4–6). These results indicate that more days have afternoon convective precipitation triggered when croplands are replaced by forests, leading to increased CAR over this region. In addition to this, we have also detected significant decreases in CAPE over the Yangtze-Huai River Basin, but there is no significant change in either CAR or temperature and humidity state parameters for this area, which is likely due to the remote effects of LUCC or to the internal noise of the model (Figure 9A). However, for CIN, little LUCC-induced changes are observed (Figure 9B), suggesting that the net instability energy is dominated by LUCC-induced changes in CAPE. The observed response of PRW also shows large increasements in the southern reforested regions, but the significance is relatively weak (Figure 9C). Moreover, the LUCC-induced changes in LCL are also examined, as shown in Figure 9D. It is clear that the changes of LCL height induced by LUCC strongly reduce by 40–60 m, indicating that the cloud base height is decreasing (Figure 9D), which may also favor the initiation of convection.
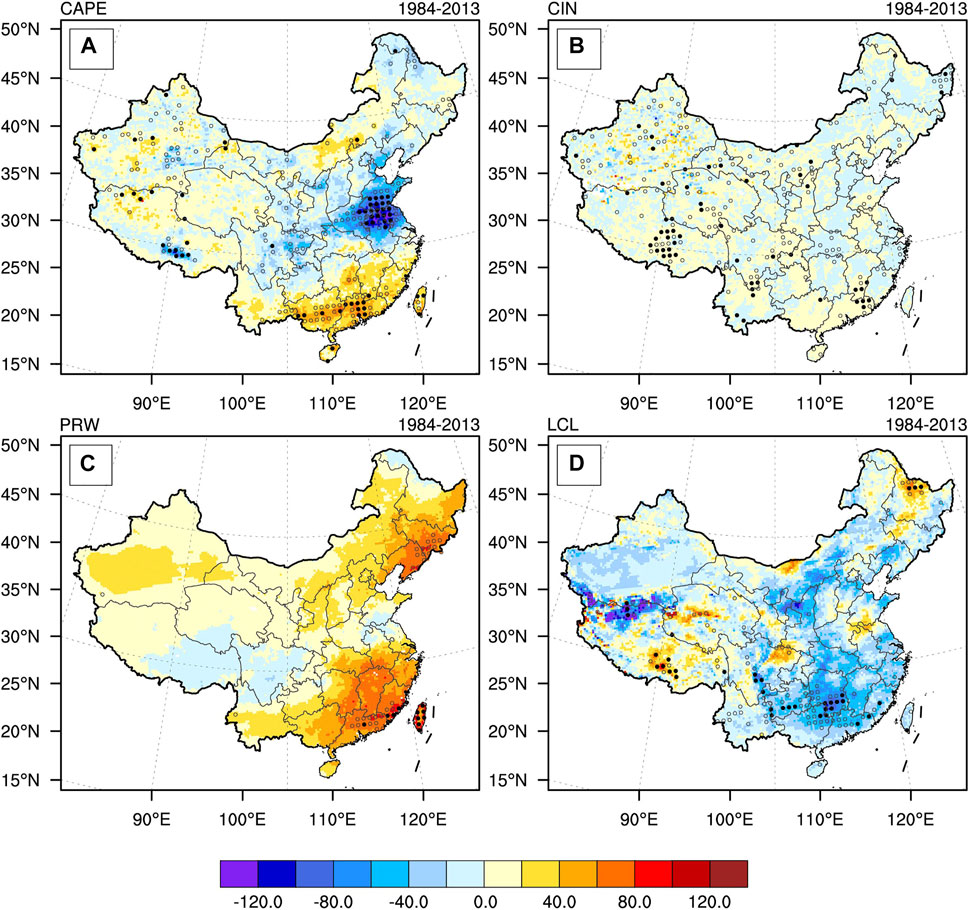
FIGURE 9. Same as Figure 7, but for (A) convective available potential energy (units: J/kg), (B) convection inhibition energy (units: J/kg), (C) atmospheric water vapor content (units: 10−2 mm) and (D) lifting condensation level (units: m). The meaning of the solid (hollow) black dots is the same as in Figure 5.
In conclusion, these convective-related variables presented above reflect the vertically integrated moisture, instability and condensation needed for the generation and development of CAR, with wetter atmosphere, higher CAPE and lower LCL favoring CAR more. The current mechanism is highly consistent with previous similar studies (e.g., Chen and Dirmeyer, 2017) in which LUCC-induced changes in CAPE dominate changes in convective precipitation.
Discussion
In the previous part, we modeled the effects of realistic LUCC on the CAR based on the GLASS-GLC-based annual dynamic LUCC information. We found a robust enhancement of POFCAR due to reforestation in southern China, mainly as a result of a combined increase in atmospheric humidity and convective instability energy. Although the current results highlight the non-negligible role of realistic LUCC on the change of CAR, there are still caveats and uncertainties that should be fully discussed. In this section, we will discuss the possible uncertainties of our finding in terms of data, model and mechanisms.
Firstly, the accuracy of LUCC data is crucial to the reliability of modeling results. Although the GLASS-GLC data we used are synthetically the relatively reliable data at present, other datasets do better than GLASS-GLC data in specific aspects. For example, according to Liu et al. (2020), for the cropland type, the accuracy of ESA-CCI-LC data (94.19%) is better than that of GLASS-GLC data (73.26%), when compared with FLUXNET test samples. However, the relatively low classification accuracy may lead to misclassification of the model’s grid-level PFT types, which is likely to cause significant changes in surface energy budget and repartitioning, ultimately involving uncertainty in the model’s temperature and precipitation responses (Ge et al., 2019). On the other hand, as the long-term series of LUCC information derived from GLASS-GLC data is limited to changes in the five major land cover types, other realistic land changes that may have potential impacts on climate (e.g., urbanization and irrigation) are not included in our study. For example, Zhong et al. (2017) highlighted that urban heat islands in the Yangtze River Delta urban cluster can increase extreme summer rainfall through enhanced afternoon convergence and updrafts. Liu et al. (2021a) revealed that the cooling and wetting effects of irrigation exerted opposite impacts on convective precipitation over China. To better assess the climate effects of realistic LUCCs, the effects of vegetation changes, urbanization and land management changes (e.g., irrigation) on regional climate need to be considered and quantified simultaneously in future studies.
Furthermore, while our study identified significant impacts of realistic LUCC on POFCAR and its corresponding mechanisms, it is also true that we based on the modeling results of a single regional climate model. Even though our use of limited ensemble simulations can enhance the confidence of the current conclusions, the impacts of LUCC on regional climate, especially on precipitation, are highly uncertain among the multi-models. Using the results of multi-model intercomparison projects (e.g., CMIP5/6 and LUCID), several studies have highlighted the high degree of uncertainty in multi-model quantifications of LUCC impacts (e.g., Pitman et al., 2009; Pitman et al., 2012; Li et al., 2018). In particular, for precipitation, most multi-model responses to LUCC, both in terms of its local and remote responses, were not consistent and significant over most of the globe (Pitman et al., 2009; Pitman et al., 2012). This is closely related to the inter-model descriptions of surface parameters (e.g., albedo, evapotranspiration), the land-atmosphere coupling strength and the selections of multiple parameterizations schemes specified by individual models (e.g., Koster et al., 2006; Pitman et al., 2009; Hirsch et al., 2014; Li et al., 2018). Specifically for RegCM, two additional caveats should be mentioned here. On the one hand, the empirical look-up tables used to determine PFT-specific vegetation parameters are actually inaccurate (Ge et al., 2021), which may further introduce uncertainties to the simulated climate effects of LUCC via influencing surface energy budget, etc. Several recent studies also highlighted the importance of changing vegetation parameters (e.g., LAI) on the regional climate of China, which are critical for improving the model performance in simulating realistic LUCC effects the (e.g., Li et al., 2020; Yu et al., 2020). On the other hand, regional climate models such as RegCM are noted to be less capable of modeling repartitioning effects between latent and sensible heat fluxes (e.g., Ge et al., 2021). This is highly crucial for the confidence of the modeling-derived effects of reforestation/afforestation. Hence, in order to assess the impact of realistic LUCC more accurately, parallel simulations of multiple improved models with multiple ensemble realizations are necessary in future studies. Recently, the Land Use and Climate Across Scales (LUCAS) initiative has been designed for integrating LUCC effects over Europe in RCMs. This is also the first RCM intercomparison project that will go from idealized (phase 1) to realistic high-resolution LUCC scenarios (phases 2 and 3), which is highly consistent with the views and insights expressed in our study. We emphasize the need for more parallel efforts to understand and quantify realistic LUCC impacts - as a potential pathway that could be useful for tackling future climate change. In addition, due to computational resource limitations, we can only conduct simulations of realistic LUCC effects at a relatively coarse (e.g., 25 km) horizontal resolution. It is feasible to describe subgrid-scale precipitation at such a resolution by selecting a convective parameterization scheme, however, this also means that the response of the CARs we have found may depend entirely on the parameterization that we have chosen. In future studies, simulations at a convective-permitting resolution (e.g., <3 km) are also needed in order to better understand the mechanisms of realistic LUCC effects on the convective precipitation.
Last but not least, the current responses of CAR due to reforestation in southern China seem to be valid only during POF, why not for the other seasons or periods? In addition to the POF results presented in the previous section, we carried out the same analysis for atmospheric hydrothermal conditions during the PRF season (Supplementary Figures S4 and S5). The results show that for the PRF, the reforestation in southern China does not exert a significant influence on surface and atmospheric humidity and instability energy as it does during the POF period. Thus, in comparison, the weak changes in CAR during the PRF period may be mainly due to the lack of moisture and instability energy conditions that is critical for the development of the convections. This also implies that the alteration of surface energy budget by LUCC can be significantly distinct in the context of different seasonal atmospheric environmental conditions. The influence of the climatic background on LUCC effects has also been widely noted (e.g., Pitman et al., 2011; Hua and Chen, 2013; Li et al., 2018). The detailed mechanisms will need to be examined more specifically in future studies. Furthermore, the effects of reforestation on CAR that we have identified in this study appear to be dominated by local effects. It should be noted that the prescribed sea surface temperatures were used as oceanic forcings in our regional climate simulations, which in fact ignored the indirect effects of LUCC via ocean-atmosphere interactions (e.g., de Noblet-Ducoudré et al., 2012). Ma et al. (2013) also highlighted the significant hydrologic responses in East China to afforestation only occurred when land-ocean-atmosphere coupling was involved. This further implies that the effects (mostly the nonlocal effects) of LUCC are likely underestimated by the current study. Besides, the effects and mechanisms of forests on precipitation, particularly their indirect and remote responses, are still largely unknown. For example, forests are known to be more efficient than the open lands in transporting sensible and latent heat fluxes from the ground to the boundary layer through canopy (Wang et al., 2000; Fisch et al., 2004; Li et al., 2015). As a result, de-/reforestation can not only exert considerable impacts on local climate, but can also cause remote impacts through modulating the atmospheric circulation (e.g., van der Ent et al., 2010). However, the above-mentioned effects of forests show large divergence in the multi-model results particularly for the remote effects, which may be due to large differences in evapotranspiration and atmospheric moisture responses (e.g., Pitman et al., 2009). Besides, a recent study by Xu et al. (2022) also revealed that forests may have completely opposite effects on cloudiness in different areas, which was linked to their specific small-scale heterogeneous landscapes. In short, in addition to the uncertainties mentioned above, our study obtained certain signals in precipitation in the realistic and dynamic LUCC scenario from numerical experiments, which are helpful for understanding and assessing the real impact of LUCC. A comprehensive understanding of the quantitative impacts of realistic LUCC on regional climate will therefore require detailed researches to further advance.
Despite all the caveats mentioned above, the most important added value of the current study is the uncovering of a non-negligible response of CAR due to LUCC in a realistic scenario. This provides a new insight to revisit the regional climate effects of LUCC and especially its impact on precipitation at sub-daily scale.
Conclusion
This paper used the state-of-the-art regional climate model RegCM4.8.2 to simulate and investigate the impact of annual dynamic realistic LUCC on precipitation in China based on the GLASS-GLC satellite data. Overall, the realistic LUCC has occurred in three main areas over the past 3 decades: the cropland-forest transition zone in southern China, the grassland-cropland transition zone in northeastern China and the bare ground-grassland transition zone in northwestern China. In the context of such realistic LUCC scenario, through the ensemble comparative experiments we found robust enhancements of POFCAR in the LUCC-induced reforestation areas of southern China, with increases in CAR magnitudes of up to 2 mm/day. In contrast, the changes in large-scale precipitation in the afternoon were less pronounced. We also found that this increase in reforestation-induced CAR was enhanced with increasing LUCC intensity in terms of interannual variations. Further analysis revealed that the increase in CAR was most pronounced in the years 2004–2013 (i.e., the decade of greatest LUCC intensity), both in terms of the spatial extent of its significant changes (in almost all southern reforestation areas) and its intensity (which can exceed 2.4 mm/day). However, apart from the above responses, no significant changes in both large-scale and convective precipitation were observed in the other considerable LUCC areas.
Furthermore, we explored the possible mechanisms for the enhanced POFCAR induced by reforestation. Results showed that the changes in POFCAR can be attributed to two possible factors: On the one hand, the reforestation significantly enhanced the evapotranspiration at the surface, resulting in a significant increase in water vapor at the surface and in the lower atmosphere, which provided favorable moisture conditions for the generation of CAR. On the other hand, the enhancement of water vapor was more evident in the lower atmosphere than in the higher atmosphere, thus leading to an unstable “dry-on-top, wet-on-bottom” state of the atmosphere’s stratification. In addition, the simultaneous decreases in LCL, the increases in CAPE and the tendency for the equivalent potential temperature to decrease with height all matched such unstable stratification and provided instability energy conditions for the CAR generation. Finally, a wetter atmosphere, higher CAPE and lower LCL induced by intense reforestation produced more CAR.
In summary, our current study uncovered significant effects of realistic LUCC on CAR in southern China. To date, our study is one of the few to use dynamic LUCC forcing rather than fixed LUCC forcing in regional climate simulations to study the climate impacts of regional LUCC in China. Although our study is only the result of a single model, we again emphasize the importance of anthropogenic interventions in forest changes as a potentially critical strategy for tackling climate change. In future studies, multi-model ensemble comparisons under a unified framework are required to better assess the biogeophysical effects of historical and future LUCC and forest changes.
Data Availability Statement
The data analyzed in this study is subject to the following licenses/restrictions: The GLASS-GLC data is openly available at https://store.pangaea.de/Publications/LiuH-etal_2020/GLASS-GLC.zip. The ERA-interim and HadISST data used for running the model can be obtained from https://apps.ecmwf.int/datasets/data/interim-full-daily/levtype=pl/ and https://www.metoffice.gov.uk/hadobs/hadisst/data/download.html, respectively. The source code of the RegCM model can be obtained from https://github.com/ICTP/RegCM/. We thank the relevant institutions for offering the data and codes. The raw model data supporting the conclusions of this article will be made available by the authors, without undue reservation.
Author Contributions
XnL, HM, WH, HC, and XW contributed to conception and design of the study. XP and XZ organized the database. XnL, XaL, WZ, and YL performed the statistical analysis. XnL and XaL wrote the first draft of the manuscript. XnL, HM, and WH wrote sections of the manuscript. All authors contributed to manuscript revision, read and approved the submitted version.
Funding
This study was jointly supported by the Shanghai Sailing Program (19YF1443800), the National Natural Science Foundation of China (41905065, 41905080), the Natural Science Foundation of Jiangsu Province (BK20200096), the Joint Open Project of KLME and CIC-FEMD, NUIST (KLME202002), the Scientific Research Foundation of CUIT (KYTZ202124, KYTZ202123) and the Innovation Team Fund of Southwest Regional Meteorological Center, China Meteorological Administration.
Conflict of Interest
The authors declare that the research was conducted in the absence of any commercial or financial relationships that could be construed as a potential conflict of interest.
Publisher’s Note
All claims expressed in this article are solely those of the authors and do not necessarily represent those of their affiliated organizations, or those of the publisher, the editors and the reviewers. Any product that may be evaluated in this article, or claim that may be made by its manufacturer, is not guaranteed or endorsed by the publisher.
Supplementary Material
The Supplementary Material for this article can be found online at: https://www.frontiersin.org/articles/10.3389/fenvs.2022.942974/full#supplementary-material
References
Arneth, A., Denton, F., Agus, F., Elbehri, A., Erb, K., Osman Elasha, B., et al. (2019). “Framing and Context,” in Climate Change and Land: An IPCC Special Report on Climate Change, Desertification, Land Degradation, Sustainable Land Management, Food Security, and Greenhouse Gas Fluxes in Terrestrial Ecosystems. Editors P. R. Shukla, J. Skea, E. Calvo Buendia, V. Masson-Delmotte, H.-O. Pörtner, D. C. Robertset al. In press. https://www.ipcc.ch/site/assets/uploads/sites/4/2019/12/04_Chapter-1.pdf.
Betts, R. A. (2000). Offset of the Potential Carbon Sink from Boreal Forestation by Decreases in Surface Albedo. Nature 408 (6809), 187–190. doi:10.1038/35041545
Bonan, G. B. (2008). Forests and Climate Change: Forcings, Feedbacks, and the Climate Benefits of Forests. Science 320 (5882), 1444–1449. doi:10.1126/science.1155121
Bright, R. M., Davin, E., O’Halloran, T., Pongratz, J., Zhao, K., and Cescatti, A. (2017). Local Temperature Response to Land Cover and Management Change Driven by Non-radiative Processes. Nat. Clim. Change 7 (4), 296–302. doi:10.1038/nclimate3250
Bright, R. M. (2015). Metrics for Biogeophysical Climate Forcings from Land Use and Land Cover Changes and Their Inclusion in Life Cycle Assessment: a Critical Review. Environ. Sci. Technol. 49 (6), 3291–3303. doi:10.1021/es505465t
Bryan, B. A., Gao, L., Ye, Y., Sun, X., Connor, J. D., Crossman, N. D., et al. (2018). China's Response to a National Land-System Sustainability Emergency. Nature 559 (7713), 193–204. doi:10.1038/s41586-018-0280-2
Burakowski, E., Tawfik, A., Ouimette, A., Lepine, L., Novick, K., Ollinger, S., et al. (2018). The Role of Surface Roughness, Albedo, and Bowen Ratio on Ecosystem Energy Balance in the Eastern United States. Agric. For. Meteorology 249, 367–376. doi:10.1016/j.agrformet.2017.11.030
Chen, C., Park, T., Wang, X., Piao, S., Xu, B., Chaturvedi, R. K., et al. (2019). China and India Lead in Greening of the World through Land-Use Management. Nat. Sustain 2 (2), 122–129. doi:10.1038/s41893-019-0220-7
Chen, H., Li, X., and Hua, W. (2015). Numerical Simulation of the Impact of Land Use/land Cover Change over China on Regional Climates during the Last 20 Years. Chin. J. Atmos. Sci. (in Chinese) 39 (2), 357–369. doi:10.3878/j.issn.1006-9895.1404.14114
Chen, L., and Dirmeyer, P. A. (2016). Adapting Observationally Based Metrics of Biogeophysical Feedbacks from Land Cover/land Use Change to Climate Modeling. Environ. Res. Lett. 11 (3), 034002. doi:10.1088/1748-9326/11/3/034002
Chen, L., and Dirmeyer, P. A. (2017). Impacts of Land-Use/land-Cover Change on Afternoon Precipitation over North America. Journal of Climate 30 (6), 2121–2140. doi:10.1175/jcli-d-16-0589.1
Cherubini, F., Bright, R. M., and Strømman, A. H. (2012). Site-specific Global Warming Potentials of Biogenic CO 2 for Bioenergy: Contributions from Carbon Fluxes and Albedo Dynamics. Environ. Res. Lett. 7 (4), 045902. doi:10.1088/1748-9326/7/4/045902
Ciais, P., Sabine, C., Bala, G., Bopp, L., Brovkin, V., Canadell, J., et al. (2013). “Carbon and Other Biogeochemical Cycles,” in Climate Change 2013: The Physical Science Basis. Contribution of Working Group I to the Fifth Assessment Report of the Intergovernmental Panel on Climate Change. Editors T. F. Stocker, D. Qin, G.-K. Plattner, M. Tignor, S. K. Allen, J. Boschunget al. (Cambridge, United Kingdom and New York, NY, USA: Cambridge University Press), 465–570. doi:10.1017/CBO9781107415324.015
Claussen, M., Brovkin, V., and Ganopolski, A. (2001). Biogeophysical versus Biogeochemical Feedbacks of Large-Scale Land Cover Change. Geophys. Res. Lett. 28 (6), 1011–1014. doi:10.1029/2000gl012471
Coppola, E., Stocchi, P., Pichelli, E., Torres Alavez, J. A., Glazer, R., Giuliani, G., et al. (2021). Non-Hydrostatic RegCM4 (RegCM4-NH): Model Description and Case Studies over Multiple Domains. Geosci. Model. Dev. 14 (12), 7705–7723. doi:10.5194/gmd-14-7705-2021
Davin, E. L., and de Noblet-Ducoudré, N. (2010). Climatic Impact of Global-Scale Deforestation: Radiative versus Nonradiative Processes. Journal of Climate 23 (1), 97–112. doi:10.1175/2009jcli3102.1
de Noblet-Ducoudré, N., Boisier, J.-P., Pitman, A., Bonan, G. B., Brovkin, V., Cruz, F., et al. (2012). Determining Robust Impacts of Land-Use-Induced Land Cover Changes on Surface Climate over North America and Eurasia: Results from the First Set of LUCID Experiments. Journal of Climate 25 (9), 3261–3281. doi:10.1175/JCLI-D-11-00338.1
Dee, D. P., Uppala, S. M., Simmons, A. J., Berrisford, P., Poli, P., Kobayashi, S., et al. (2011). The ERA-Interim Reanalysis: Configuration and Performance of the Data Assimilation System. Q.J.R. Meteorol. Soc. 137 (656), 553–597. doi:10.1002/qj.828
Devaraju, N., Bala, G., and Nemani, R. (2015). Modelling the Influence of Land-Use Changes on Biophysical and Biochemical Interactions at Regional and Global Scales. Plant Cell. Environ 38 (9), 1931–1946. doi:10.1111/pce.12488
Devaraju, N., de Noblet-Ducoudré, N., Quesada, B., and Bala, G. (2018). Quantifying the Relative Importance of Direct and Indirect Biophysical Effects of Deforestation on Surface Temperature and Teleconnections. Journal of Climate 31 (10), 3811–3829. doi:10.1175/jcli-d-17-0563.1
Dickinson, R. E., Errico, R. M., Giorgi, F., and Bates, G. T. (1989). A Regional Climate Model for the Western United States. Climatic Change 15 (3), 383–422. doi:10.1007/bf00240465
Duveiller, G., Forzieri, G., Robertson, E., Li, W., Georgievski, G., Lawrence, P., et al. (2018). Biophysics and Vegetation Cover Change: A Process-Based Evaluation Framework for Confronting Land Surface Models With Satellite Observations. Earth Syst. Sci. Data. 10 (3), 1265–1279. doi:10.5194/essd-10-1265-2018
Emanuel, K. A., and Živković-Rothman, M. (1999). Development and Evaluation of a Convection Scheme for Use in Climate Models. J. Atmos. Sci. 56 (11), 1766–1782. doi:10.1175/1520-0469(1999)056<1766:daeoac>2.0.co;2
ESA (2017). Land Cover CCI Product User Guide Version 2. Available at: https://maps.elie.ucl.ac.be/CCI/viewer/download/ESACCI-LC-Ph2-PUGv2_2.0.pdf. (Accessed June 29, 2022).
Findell, K. L., and Eltahir, E. A. B. (2003a). Atmospheric Controls on Soil Moisture-Boundary Layer Interactions. Part I: Framework Development. J. Hydrometeor 4 (3), 552–569. doi:10.1175/1525-7541(2003)004<0552:acosml>2.0.co;2
Findell, K. L., and Eltahir, E. A. B. (2003b). Atmospheric Controls on Soil Moisture-Boundary Layer Interactions. Part II: Feedbacks within the Continental United States. J. Hydrometeor 4 (3), 570–583. doi:10.1175/1525-7541(2003)004<0570:acosml>2.0.co;2
Fisch, G., Tota, J., Machado, L. A. T., Silva Dias, M. A. F., Lyra, R. F. d. F., Nobre, C. A., et al. (2004). The Convective Boundary Layer over Pasture and Forest in Amazonia. Theoretical and Applied Climatology 78 (1), 47–59. doi:10.1007/s00704-004-0043-x
Gao, X.-J., Shi, Y., and Giorgi, F. (2016). Comparison of Convective Parameterizations in RegCM4 Experiments over China with CLM as the Land Surface Model. Atmospheric and Oceanic Science Letters 9 (4), 246–254. doi:10.1080/16742834.2016.1172938
Gao, X., and Giorgi, F. (2017). Use of the RegCM System over East Asia: Review and Perspectives. Engineering 3 (5), 766–772. doi:10.1016/j.eng.2017.05.019
Gao, X., Shi, Y., Han, Z., Wang, M., Wu, J., Zhang, D., et al. (2017). Performance of RegCM4 over Major River Basins in China. Adv. Atmos. Sci. 34 (4), 441–455. doi:10.1007/s00376-016-6179-7
Ge, J., Pitman, A. J., Guo, W., Wang, S., and Fu, C. (2019). Do uncertainties in the Reconstruction of Land Cover Affect the Simulation of Air Temperature and Rainfall in the CORDEX Region of East Asia? J. Geophys. Res. Atmos. 124 (7), 3647–3670. doi:10.1029/2018jd029945
Ge, J., Qiu, B., Chu, B., Li, D., Jiang, L., Zhou, W., et al. (2021). Evaluation of Coupled Regional Climate Models in Representing the Local Biophysical Effects of Afforestation over Continental China. Journal of Climate 34 (24), 9879–9898. doi:10.1175/jcli-d-21-0462.1
Giorgi, F., and Bates, G. T. (1989). The Climatological Skill of a Regional Model over Complex Terrain. Mon. Wea. Rev. 117 (11), 2325–2347. doi:10.1175/1520-0493(1989)117<2325:tcsoar>2.0.co;2
Giorgi, F., Coppola, E., Solmon, F., Mariotti, L., Sylla, M., Bi, X., et al. (2012). RegCM4: Model Description and Preliminary Tests over Multiple CORDEX Domains. Clim. Res. 52, 7–29. doi:10.3354/cr01018
Grassi, G., House, J., Dentener, F., Federici, S., den Elzen, M., and Penman, J. (2017). The Key Role of Forests in Meeting Climate Targets Requires Science for Credible Mitigation. Nature Clim Change 7 (3), 220–226. doi:10.1038/nclimate3227
Grell, G. A., Dudhia, J., and Stauffer, D. R. (1994). A Description of the Fifth-Generation Penn State/NCAR Mesoscale Model (MM5). Boulder, CO: NCAR.
Han, Z., Gao, X., Shi, Y., Wu, J., Wang, M., and Giorgi, F. (2015). Development of Chinese High Resolution Land Cover Data for the RegCM4/CLM and its Impact on Regional Climate Simulation. Journal of Glaciology Geocryology (in Chinese) 37 (4), 857–866. doi:10.7522/j.issn.1000-0240.2015.0095
Hirsch, A. L., Guillod, B. P., Seneviratne, S. I., Beyerle, U., Boysen, L. R., Brovkin, V., et al. (2018). Biogeophysical Impacts of Land-Use Change on Climate Extremes in Low-Emission Scenarios: Results from HAPPI-Land. Earth's Future. 6 (3), 396–409. doi:10.1002/2017ef000744
Hirsch, A. L., Pitman, A. J., and Kala, J. (2014). The Role of Land Cover Change in Modulating the Soil Moisture-Temperature Land-Atmosphere Coupling Strength over Australia. Geophys. Res. Lett. 41 (16), 5883–5890. doi:10.1002/2014gl061179
Holtslag, A. A. M., De Bruijn, E. I. F., and Pan, H.-L. (1990). A High Resolution Air Mass Transformation Model for Short-Range Weather Forecasting. Mon. Wea. Rev. 118 (8), 1561–1575. doi:10.1175/1520-0493(1990)118<1561:ahramt>2.0.co;2
Houghton, R. A., House, J. I., Pongratz, J., van der Werf, G. R., DeFries, R. S., Hansen, M. C., et al. (2012). Carbon Emissions from Land Use and Land-Cover Change. Biogeosciences 9 (12), 5125–5142. doi:10.5194/bg-9-5125-2012
Hu, Y., Zhang, X.-Z., Mao, R., Gong, D.-Y., Liu, H.-b., and Yang, J. (2015). Modeled Responses of Summer Climate to Realistic Land Use/cover Changes from the 1980s to the 2000s over Eastern China. J. Geophys. Res. Atmos. 120 (1), 167–179. doi:10.1002/2014jd022288
Hu, Y., Zhong, Z., Lu, W., Zhang, Y., and Sun, Y. (2016). Evaluation of RegCM4 in Simulating the Interannual and Interdecadal Variations of Meiyu Rainfall in China. Theoretical and Applied Climatology 124 (3), 757–767. doi:10.1007/s00704-015-1459-1
Hua, W., and Chen, H. (2013). Recognition of Climatic Effects of Land Use/land Cover Change under Global Warming. Chin. Sci. Bull. 58 (31), 3852–3858. doi:10.1007/s11434-013-5902-3
Hurtt, G. C., Chini, L. P., Frolking, S., Betts, R. A., Feddema, J., Fischer, G., et al. (2011). Harmonization of Land-Use Scenarios for the Period 1500–2100: 600 Years of Global Gridded Annual Land-Use Transitions, Wood Harvest, and Resulting Secondary Lands. Climatic Change 109 (1), 117. doi:10.1007/s10584-011-0153-2
Hurtt, G. C., Chini, L., Sahajpal, R., Frolking, S., Bodirsky, B. L., Calvin, K., et al. (2020). Harmonization of Global Land Use Change and Management for the Period 850-2100 (LUH2) for CMIP6. Geosci. Model. Dev. 13 (11), 5425–5464. doi:10.5194/gmd-13-5425-2020
Ji, Z., and Kang, S. (2015). Evaluation of Extreme Climate Events Using a Regional Climate Model for China. Int. J. Climatol. 35 (6), 888–902. doi:10.1002/joc.4024
Kalthoff, N., Kohler, M., Barthlott, C., Adler, B., Mobbs, S. D., Corsmeier, U., et al. (2011). The Dependence of Convection-Related Parameters on Surface and Boundary-Layer Conditions Over Complex Terrain. Q. J. R. Meteorol. Soc. 137 (S1), 70–80. doi:10.1002/qj.686
Kiehl, J. T., Hack, J. J., Bonan, G. B., Boville, B. A., Briegleb, B. P., Williamson, D. L., et al. (1996). Description of the NCAR Community Climate Model (CCM3). Technical Note. Boulder, CO: NCAR.
Koster, R. D., Sud, Y. C., Guo, Z., Dirmeyer, P. A., Bonan, G., Oleson, K. W., et al. (2006). GLACE: The Global Land-Atmosphere Coupling Experiment. Part I: Overview. Journal of Hydrometeorology 7 (4), 590–610. doi:10.1175/jhm510.1
Lawrence, P. J., and Chase, T. N. (2007). Representing a New MODIS Consistent Land Surface in the Community Land Model (CLM 3.0). J. Geophys. Res. 112 (G1), G01023. doi:10.1029/2006JG000168
Lawrence, D., and Vandecar, K. (2015). Effects of Tropical Deforestation on Climate and Agriculture. Nature Clim Change 5 (1), 27–36. doi:10.1038/nclimate2430
Lee, X., Goulden, M. L., Hollinger, D. Y., Barr, A., Black, T. A., Bohrer, G., et al. (2011). Observed Increase in Local Cooling Effect of Deforestation at Higher Latitudes. Nature 479 (7373), 384–387. doi:10.1038/nature10588
Li, X., Chen, H., Liao, H., Hua, W., Sun, S., Ma, H., et al. (2017). Potential Effects of Land Cover Change on Temperature Extremes over Eurasia: Current versus Historical Experiments. Int. J. Climatol 37 (S1), 59–74. doi:10.1002/joc.4976
Li, X., Chen, H., Wei, J., Hua, W., Sun, S., Ma, H., et al. (2018). Inconsistent Responses of Hot Extremes to Historical Land Use and Cover Change Among the Selected CMIP5 Models. J. Geophys. Res. Atmos. 123 (7), 3497–3512. doi:10.1002/2017jd028161
Li, Y., Brando, P. M., Morton, D. C., Lawrence, D. M., Yang, H., and Randerson, J. T. (2022). Deforestation-induced Climate Change Reduces Carbon Storage in Remaining Tropical Forests. Nat Commun 13 (1), 1964. doi:10.1038/s41467-022-29601-0
Li, Y., Piao, S., Chen, A., Ciais, P., and Li, L. Z. X. (2020). Local and Teleconnected Temperature Effects of Afforestation and Vegetation Greening in China. National Science Review 7 (5), 897–912. doi:10.1093/nsr/nwz132
Li, Y., Zhao, M., Motesharrei, S., Mu, Q., Kalnay, E., and Li, S. (2015). Local Cooling and Warming Effects of Forests Based on Satellite Observations. Nat Commun 6 (1), 6603. doi:10.1038/ncomms7603
Liu, G., Wang, W., Shao, Q., Wei, J., Zheng, J., Liu, B., et al. (2021a). Simulating the Climatic Effects of Irrigation over China by Using the WRF-Noah Model System with Mosaic Approach. Journal of Geophysical Research Atmospheres 126 (15), e2020JD034428. doi:10.1029/2020jd034428
Liu, H., Gong, P., Wang, J., Clinton, N., Bai, Y., and Liang, S. (2020). Annual Dynamics of Global Land Cover and its Long-Term Changes from 1982 to 2015. Earth Syst. Sci. Data 12 (2), 1217–1243. doi:10.5194/essd-12-1217-2020
Liu, S., Liu, X., Yu, L., Wang, Y., Zhang, G. J., Gong, P., et al. (2021b). Climate Response to Introduction of the ESA CCI Land Cover Data to the NCAR CESM. Climate Dynamics 56 (11), 4109–4127. doi:10.1007/s00382-021-05690-3
Lohila, A., Minkkinen, K., Laine, J., Savolainen, I., Tuovinen, J.-P., Korhonen, L., et al. (2010). Forestation of Boreal Peatlands: Impacts of Changing Albedo and Greenhouse Gas Fluxes on Radiative Forcing. J. Geophys. Res. 115 (G4), G04011. doi:10.1029/2010jg001327
Ma, D., Notaro, M., Liu, Z., Chen, G., and Liu, Y. (2013). Simulated Impacts of Afforestation in East China Monsoon Region as Modulated by Ocean Variability. Climate Dynamics 41 (9), 2439–2450. doi:10.1007/s00382-012-1592-9
Machado, L. A. T., Laurent, H., and Lima, A. A. (2002). Diurnal March of the Convection Observed During TRMM-WETAMC/LBA. J. Geophys. Res. 107 (D20), 8064. doi:10.1029/2001JD000338
Mahmood, R., Pielke, R. A., Hubbard, K. G., Niyogi, D., Dirmeyer, P. A., McAlpine, C., et al. (2014). Land Cover Changes and Their Biogeophysical Effects on Climate. Int. J. Climatol. 34 (4), 929–953. doi:10.1002/joc.3736
Mahmood, R., Pielke, R. A., and McAlpine, C. A. (2016). Climate-relevant Land Use and Land Cover Change Policies. Bulletin of the American Meteorological Society 97 (2), 195–202. doi:10.1175/bams-d-14-00221.1
IPCC (2021). “Summary for Policymakers,” in Climate Change 2021: The Physical Science Basis. Contribution of Working Group I to the Sixth Assessment Report of the Intergovernmental Panel on Climate Change. Editors V. Masson Delmotte, P. Zhai, A. Pirani, S. L. Connors, C. Péan, S. Bergeret al. (Cambridge, United Kingdom: Cambridge University Press). In Press. https://www.ipcc.ch/report/ar6/wg1/downloads/report/IPCC_AR6_WGI_SPM_final.pdf
Oleson, K., Lawrence, D., Bonan, G., Drewniak, B., Huang, M., Koven, C., et al. (2013). Technical Description of Version 4.5 of the Community Land Model (CLM). Boulder, CO: NCAR.
Pal, J. S., Small, E. E., and Eltahir, E. A. B. (2000). Simulation of Regional-Scale Water and Energy Budgets: Representation of Subgrid Cloud and Precipitation Processes within RegCM. J. Geophys. Res. 105 (D24), 29579–29594. doi:10.1029/2000jd900415
Pan, Y., Birdsey, R. A., Fang, J., Houghton, R., Kauppi, P. E., Kurz, W. A., et al. (2011). A Large and Persistent Carbon Sink in the World's Forests. Science 333 (6045), 988–993. doi:10.1126/science.1201609
Parker, D.J. (2002). The Response of CAPE and CIN to Tropospheric Thermal Variations. Q. J. R. Meteorol. Soc. 128 (579), 119–130. doi:10.1256/00359000260498815
Perugini, L., Caporaso, L., Marconi, S., Cescatti, A., Quesada, B., de Noblet-Ducoudré, N., et al. (2017). Biophysical Effects on Temperature and Precipitation Due to Land Cover Change. Environ. Res. Lett. 12 (5), 053002. doi:10.1088/1748-9326/aa6b3f
Pielke, R. A. (2005). Land Use and Climate Change. Science 310 (5754), 1625–1626. doi:10.1126/science.1120529
Pielke Sr, R. A., Pitman, A., Niyogi, D., Mahmood, R., McAlpine, C., Hossain, F., et al. (2011). Land Use/land Cover Changes and Climate: Modeling Analysis and Observational Evidence. WIREs Clim Change 2 (6), 828–850. doi:10.1002/wcc.144
Pitman, A. J., Avila, F. B., Abramowitz, G., Wang, Y. P., Phipps, S. J., and de Noblet-Ducoudré, N. (2011). Importance of Background Climate in Determining Impact of Land-Cover Change on Regional Climate. Nature Clim Change 1 (9), 472–475. doi:10.1038/nclimate1294
Pitman, A. J., de Noblet-Ducoudré, N., Avila, F. B., Alexander, L. V., Boisier, J.-P., Brovkin, V., et al. (2012). Effects of Land Cover Change on Temperature and Rainfall Extremes in Multi-Model Ensemble Simulations. Earth Syst. Dynam. 3 (2), 213–231. doi:10.5194/esd-3-213-2012
Pitman, A. J., de Noblet-Ducoudré, N., Cruz, F. T., Davin, E. L., Bonan, G. B., Brovkin, V., et al. (2009). Uncertainties in Climate Responses to Past Land Cover Change: First Results from the LUCID Intercomparison Study. Geophys. Res. Lett. 36 (14), L14814. doi:10.1029/2009gl039076
Prestele, R., Arneth, A., Bondeau, A., de Noblet-Ducoudré, N., Pugh, T. A. M., Sitch, S., et al. (2017). Current Challenges of Implementing Anthropogenic Land-Use and Land-Cover Change in Models Contributing to Climate Change Assessments. Earth Syst. Dynam. 8 (2), 369–386. doi:10.5194/esd-8-369-2017
Reyers, B., O’Farrell, P. J., Cowling, R. M., Egoh, B. N., Le Maitre, D. C., and Vlok, J. H. J. (2009). Ecosystem Services, Land-Cover Change, and Stakeholders Finding a Sustainable Foothold for a Semiarid Biodiversity Hotspot. Ecology and Society 14 (1), 38. doi:10.5751/es-02867-140138
IPCC (2013). “Summary for Policymakers,” in Climate Change 2013: The Physical Science Basis. Contribution of Working Group I to the Fifth Assessment Report of the Intergovernmental Panel on Climate Change. Editors T. F. Stocker, D. Qin, G.-K. Plattner, M. Tignor, S. K. Allen, J. Boschunget al. (Cambridge, United Kingdom and New York, NY, USA: Cambridge University Press), 1–30.
Sulla-Menashe, M., and Friedl, M. A. (2018). User Guide to Collection 6 MODIS Land Cover (MCD12Q1 and MCD12C1) Product. USGS Doc. 28. Available at: https://lpdaac.usgs.gov/documents/101/MCD12_User_Guide_V6.pdf. (Accessed June 29, 2022).
van der Ent, R. J., Savenije, H. H. G., Schaefli, B., and Steele-Dunne, S. C. (2010). Origin and Fate of Atmospheric Moisture over Continents. Water Resources Research 46 (9), W09525. doi:10.1029/2010wr009127
Wang, J., Bras, R. L., and Eltahir, E. A. B. (2000). The Impact of Observed Deforestation on the Mesoscale Distribution of Rainfall and Clouds in Amazonia. J. Hydrometeor 1 (3), 267–286. doi:10.1175/1525-7541(2000)001<0267:tioodo>2.0.co;2
Wang, Q., Yan, M., Liu, J., and Ning, L. (2021). Impacts of Land Use/cover Change on Spatial Patterns of Summer Precipitation at Decadal Scale over Eastern China. Intl Journal of Climatology 41 (3), 1939–1951. doi:10.1002/joc.6939
Wang, X., Zhang, B., Xu, X., Tian, J., and He, C. (2020). Regional Water-Energy Cycle Response to Land Use/cover Change in the Agro-Pastoral Ecotone, Northwest China. Journal of Hydrology 580, 124246. doi:10.1016/j.jhydrol.2019.124246
Ward, D. S., Mahowald, N. M., and Kloster, S. (2014). Potential Climate Forcing of Land Use and Land Cover Change. Atmos. Chem. Phys. 14 (23), 12701–12724. doi:10.5194/acp-14-12701-2014
Winckler, J., Reick, C. H., and Pongratz, J. (2017). Robust Identification of Local Biogeophysical Effects of Land-Cover Change in a Global Climate Model. Journal of Climate 30 (3), 1159–1176. doi:10.1175/jcli-d-16-0067.1
Xu, R., Li, Y., Teuling, A. J., Zhao, L., Spracklen, D. V., Garcia-Carreras, L., et al. (2022). Contrasting Impacts of Forests on Cloud Cover Based on Satellite Observations. Nat Commun 13 (1), 670. doi:10.1038/s41467-022-28161-7
Yu, L., Liu, Y., Liu, T., and Yan, F. (2020). Impact of Recent Vegetation Greening on Temperature and Precipitation over China. Agricultural and Forest Meteorology 295, 108197. doi:10.1016/j.agrformet.2020.108197
Zeng, X., Zhao, M., and Dickinson, R. E. (1998). Intercomparison of Bulk Aerodynamic Algorithms for the Computation of Sea Surface Fluxes Using TOGA COARE and TAO Data. J. Climate 11 (10), 2628–2644. doi:10.1175/1520-0442(1998)011<2628:iobaaf>2.0.co;2
Zeng, Z., Piao, S., Li, L. Z. X., Zhou, L., Ciais, P., Wang, T., et al. (2017). Climate Mitigation from Vegetation Biophysical Feedbacks during the Past Three Decades. Nature Clim Change 7 (6), 432–436. doi:10.1038/nclimate3299
Zhang, X., Chen, J., and Song, S. (2021). Divergent Impacts of Land Use/cover Change on Summer Precipitation in Eastern China from 1980 to 2000. Int J Climatol 41 (4), 2360–2374. doi:10.1002/joc.6963
Zhong, S., Qian, Y., Zhao, C., Leung, R., Wang, H., Yang, B., et al. (2017). Urbanization-induced Urban Heat Island and Aerosol Effects on Climate Extremes in the Yangtze River Delta Region of China. Atmos. Chem. Phys. 17 (8), 5439–5457. doi:10.5194/acp-17-5439-2017
Keywords: land use and cover change, regional climate modeling, convective precipitation, GLASS-GLC, southern China
Citation: Li X, Li X, Ma H, Hua W, Chen H, Wen X, Zhang W, Lu Y, Pang X and Zhang X (2022) Reforestation in Southern China Enhances the Convective Afternoon Rainfall During the Post-flood Season. Front. Environ. Sci. 10:942974. doi: 10.3389/fenvs.2022.942974
Received: 13 May 2022; Accepted: 20 June 2022;
Published: 13 July 2022.
Edited by:
Bo Huang, Norwegian University of Science and Technology, NorwayReviewed by:
Jun Ge, Nanjing University, ChinaLian Chen, Shanghai Institute of Satellite Engineering, China
Copyright © 2022 Li, Li, Ma, Hua, Chen, Wen, Zhang, Lu, Pang and Zhang. This is an open-access article distributed under the terms of the Creative Commons Attribution License (CC BY). The use, distribution or reproduction in other forums is permitted, provided the original author(s) and the copyright owner(s) are credited and that the original publication in this journal is cited, in accordance with accepted academic practice. No use, distribution or reproduction is permitted which does not comply with these terms.
*Correspondence: Xing Li, TFhfQ1VJVEAxNjMuY29t