 Jeremy Spearman
 Thomas Benson
- HR Wallingford Ltd, Wallingford, United Kingdom
In many parts of the world, ports and harbours lie adjacent to ecologically important areas of coastal habitat. In such areas port authorities, coastal managers and regulators are required to negotiate the tension between the demands of making ports ever more efficient, with wider and deeper approaches to accommodate vessels of deeper draft and larger handling areas, and the preservation of coastal habitats which are vitally important for bird and fish populations and which help protect the coast from flooding and erosion. The deepening of approach channels and berths usually results in an increased rate of sedimentation and maintenance dredging. There is an increasing recognition that such dredged sediment is a resource which should be utilised beneficially for human development activities and/or enhancement of ecological habitats. One form of beneficial use of dredged material, is termed “sediment recycling” or “strategic placement”. This form of beneficial use consists of the placement of cohesive sediment into the water column or onto the bed in such a way so that currents and waves then transport the released sediment onto the desired habitats. Sediment recycling is less widely practiced because the changes in bed level resulting from placement are generally of the order of a few centimetres/year or less and it is difficult to demonstrate whether such recycling is successful. This paper describes a methodology for the assessment of the effectiveness sediment recycling, implementing the methodology on a case study of a large-scale sediment recycling scheme in the Stour/Orwell Estuary system in the United Kingdom, designed to offset the identified adverse effects of an approach channel deepening on the estuary system. The study represents a major contribution to the consideration of non-direct beneficial use of cohesive sediment. For the first time a methodology for reliably evaluating the effects of sediment recycling, separating the effects of natural changes in morphology from the beneficial use, has been shown to be effective. This method, which is applicable anywhere where there are sufficient data, allows a robust evaluation of the effectiveness of such methods and crucially enables these methods to be tested and optimised using modelling before implementation.
1 Introduction
In many parts of the world, large ports and harbours lie adjacent to ecologically important areas of coastal habitat. In such areas port authorities, coastal managers and regulators are required to negotiate the tension between the demands of making ports ever more efficient, with wider and deeper approaches to accommodate vessels of deeper draft (Tchang, 2020) and larger handling areas (Hanson and Nicholls, 2020) on the one hand, and in preserving and restoring coastal habitats on the other. These coastal habitats provide several valuable ecosystem services - they are highly productive areas feeding large numbers of predatory birds (JNCC, 2008a; Ausden et al., 2018), they provide feeding, spawning and nursery areas for fish populations (Beck et al., 2003; Seitz et al., 2014; Sheaves et al., 2015), they absorb nutrients and improve water quality (Agaton and Guila, 2023), and they help protect the coast from flooding and erosion (Kirwan and Megonigal, 2013; Temmerman et al., 2013; Spalding et al, 2014; Möller et al., 2014). These habitats also act as efficient carbon sinks, contributing significantly to the sequestration of global carbon dioxide (Mcleod et al., 2011; Rogers et al., 2019) and they provide livelihoods to communities from shellfisheries to tourist industries (McCartney et al., 2015; RAMSAR Convention on Wetlands, 2021).
The deepening of approach channels and berths to accommodate larger vessels usually results in an increased rate of sedimentation and maintenance dredging. As ports and harbours consider how to manage this dredging in a manner that is sustainable for neighbouring wetlands, part of this consideration includes the possibility that the dredged sediment can be used beneficially in and around wetland areas to improve habitat and ecosystem functioning. The form that such improvements to habitat and functioning can take varies, but this paper gives the examples of the use of sediment recycling to prevent the erosion and loss of muddy habitat (supporting internationally important bird populations, see Section 2.1) and also the use of direct placement of dredged material to mitigate coastal erosion and flooding (see Section 5.3). The desirability for beneficial use is given additional weight in those countries which are signatories of the London Convention and Protocol (the international treaties promoting the effective control of all sources of marine pollution caused by disposal at sea, http://docs.imo.org). In this treaty there is an obligation to examine the potential for beneficial placement of sediment before offshore disposal is considered. Additionally consideration of beneficial use is given added weight in circumstances where the deepening itself is perceived to result in some level of impact on the wetlands.
Often, the beneficial use of sediment for habitat improvement is found to be unviable due to the increased costs of placement, achieving consent and monitoring, and the problems involved in demonstrating benefit (Murray, 2008; Brils et al., 2014; Ulibarri et al., 2020). However, there is an increasing recognition that dredged sediment is a resource which should be utilised beneficially for human development activities and/or enhancement of ecological habitats (CEDA, 2019; Gailani et al., 2019). The need to seek beneficial use opportunities has been identified as a priority within the International Maritime Organisation London Convention and London Protocol (IMO, 2014) and other dredged material management reviews and guidance (e.g., IADC, 2009; CEDA, 2010; OSPAR, 2014;; HELCOM, 2015) and more recently in the COP26 Climate Change and Sediment Management Pledge (SEDNET, 2021).
The beneficial use of dredged sediment has grown dramatically over the last 30 years for a range of uses: to maintain the integrity of local wetland habitats, as a source of material for flood defence, as a source of reclamation fill, to aid the clean-up of contaminated or old mining sites and as building material (e.g., CEDA, 2019). In the US, for instance, the United States Army Corps of Engineers (USACE) have been world leaders in the use of dredged material for habitat creation, using around 33% of the 200 million cubic yards of coastal navigation channels dredged by the USACE every year are used beneficially (Gailani, 2019), proving successfully that dredged sediment can be used to restore create valuable that provide critical habitat for wildlife (Ausden et al., 2018). This increased emphasis on beneficial use arises partly due to recognition of the symbiosis of coastal development and the environment as encapsulated by concepts such as Engineering with Nature© (https://ewn.erdc.dren.mil) or Building with Nature (https://building-with-nature.eu).
Beneficial use of dredged material for habitat creation, also termed “sediment recycling”, can take many forms: direct placement to form intertidal areas (Suedel et al., 2014; Suedel et al., 2021); the direct placement of sediment onto intertidal areas (e.g., HR Wallingford, 2008; Virginia Institute of Marine Science, 2014; Thorne et al., 2019), as well as subtidal (e.g., Baptist et al., 2019) or water column placement (as in this paper) of sediment at strategic locations so that the sediment will subsequently transported onshore by currents and waves. The scales of beneficial use vary from a few thousand m3/year dredged by backhoe (e.g., at Lymington Harbour, United Kingdom; Lymington Harbour Commissioners, 2021) to many million m3/year (e.g., for the coastal Mississippi, USACE, 2014).
This paper is specifically concerned with sediment recycling, specifically non-direct or “strategic” placement of cohesive sediment, arising from ongoing water column recharge in the Stour-Orwell Estuary system in the southeast of the United Kingdom. The discharge is implemented using a slowly moving small trailer suction hopper dredger (TSHD) pumping a sediment water mixture from the hopper into the adjacent waters. This estuary system is the location of the Port of Felixstowe and sediment recycling has been ongoing since 1998 and is designed to promote benefit to intertidal habitats with the estuary system (see Section 2.1.2). Non-direct beneficial use has the advantages that there is a much-reduced potential for negative effects arising from placement—i.e., no initial smothering of the bed—and that it can, as shown here, be built into the regime of dredging operations. However, the method involves increasing the turbidity and suspended sediment concentration in the waters between the placement location and the intertidal habitats that the method is intended to benefit. The method may not, therefore, be suitable where the local ecology is sensitive and would be negatively affected by such increases. In the Stour-Orwell example considered in this paper, any such increases are minimised by applying small and frequent placements, which mitigate a perceived reduction in suspended sediment concentrations resulting from harbour deepening (See Section 2.1.2).
Direct placement beneficial use generally involves significant changes in bed level that can be measured, either through the use of direct point measurements or through standard topographic/bathymetric surveying (e.g., HR Wallingford, 2008; Lymington Harbour Commissioners, 2021). However, for non-direct or strategic placement of cohesive sediment, the changes in bed level resulting from placement are generally of the order of a few centimetres/year or less, and are more widely distributed, varying spatially (e.g., Baptist et al., 2019, and this paper). Measurements of change in this case are further complicated by.
• The stochastic nature of winds and waves can lead to rapid changes in accretion/erosion following placement and monitoring periods which are insufficiently long to be representative.
• It can be difficult to separate the changes resulting from non-direct beneficial use from the natural background changes. Baptist et al. (2019), for instance, found that the greatest rates of accretion occurred during a period of reduced rate of placement and a direct link between the amounts of beneficial placement and observed intertidal sedimentation could not be made.
These difficulties in establishing the magnitude of change resulting from non-direct placement make it difficult to assess or optimise the effectiveness of a specific scheme. We propose a method for evaluation of the success of non-direct beneficial use of dredged cohesive sediment based upon long-term monitoring and detailed modelling. This approach, as discussed below, allows the contributions of background processes and beneficial placement to be separated and the relative benefits of the scheme to be identified in the context of the background trend. The approach is applied here to a particular case study but can be applied for any location where there are adequate data.
2 Case study of sediment recycling
2.1 The Stour/Orwell estuary system
The Stour/Orwell system (Figure 1) is meso-tidal (3.6 m mean spring tidal range at the estuary mouth). The fluvial input into the system is low compared to other estuaries from the (the mean total fluvial discharge into the Stour and Orwell Estuaries is less than 5 m3/s (based on Environment Agency data and the United Kingdom National River Flow Archive). With the exception of Harwich Harbour (which is the name given to the confluence of the Stour and Orwell Estuaries, at the estuary mouth) waves inside the estuary system are locally wind-generated. Typical wave heights are 0.2–0.3 m in the Stour and 0.1–0.2 m in the Orwell (HR Wallingford, 1994; Spearman et al., 2014). During strong westerly winds however, waves can rise up to 1 m in significant wave height throughout much of the Stour Estuary (HR Wallingford, 2001a). Waves in the Orwell are generally lower because of the reduced fetch lengths.
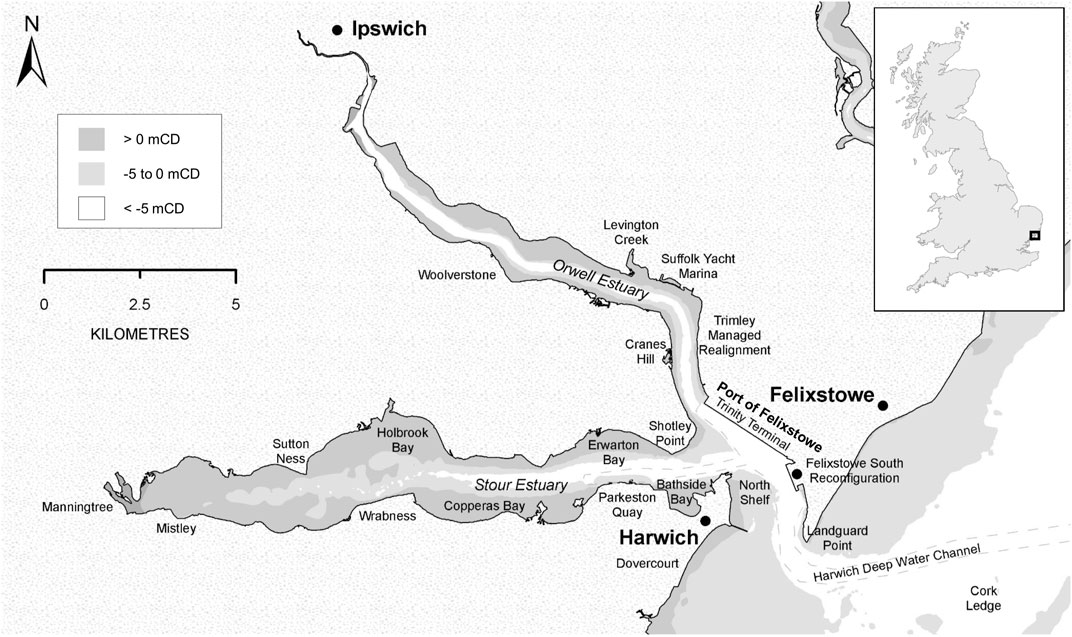
FIGURE 1. Stour/Orwell estuary system.
The Port of Felixstowe is located on the east side of Harwich Harbour. Harwich Haven Authority (HHA) annually undertakes maintenance dredging of 2.4 Mm3/year of soft mud from the harbour (this is the average maintenance requirement over the period 1996–2017, based on HHA data). Until 2020 the mud was principally dredged by TSHD, aided by plough dredging in the berths. This material is disposed at Inner Gabbard, around 30 km offshore of the estuary entrance. The sediment supplied to the estuary is almost all from offshore marine sources (Spearman et al., 2014) and predominantly enters from the near-shore zone north of the entrance along the Suffolk Coast.
The Stour and Orwell estuaries have extensive muddy flats which are protected (Special Protected Area/Ramsar status) because they support nationally important numbers of wintering wildfowl and waders as well as internationally important populations of migratory bird species: Common redshank, Dark-bellied brent goose, Northern pintail, Grey plover, Red knot, Dunlin and Black-tailed godwit (JNCC, 2008b).
The Stour/Orwell Estuary system has experienced much erosion of its intertidal mudflats since the 1920s when much of the prevalent eel-grass population, which had a binding effect on sediment died off due to a fungal disease. This binding effect occurs through dissipation of wave energy and reduction in current and wave oscillatory velocities (Fonseca and Cahalan, 1992), which reduces erosion (Chen et al., 2007), and through trapping of sediment particles (Hendriks et al., 2008) and the specific binding effect of the roots and rhizomes below the seabed (Marin-Diaz et al., 2020). It is estimated that 15 Mm3 of net intertidal erosion occurred within the Stour/Orwell Estuary system over the last century (Beardall et al., 1991). More recently, the presence and coverage of eel grass (Z. angustifolia and Z. Noltei) in the estuaries has continued to decline - from 345 ha in 1973 to just 5.4 ha in 2020, a 98% reduction (Gardiner, 2021). The erosion of mudflats has been accompanied a reduction in saltmarsh coverage. The changes in saltmarsh coverage in the estuary system over the period 1973–2015 are shown in Table 1. The results indicate substantial loss of saltmarsh over this period, with most of the loss taking place before 1997. The observed trend in loss of saltmarsh area can be traced back prior to 1973—based on tithe maps from the 1840s Beardall et al. (1991) report that the saltmarsh in the Orwell Estuary in the 19th century was twice that in 1991.
TABLE 1. Observed saltmarsh area in the Stour and Orwell Estuaries, 1973 to 2015.
2.2 The sediment recycling strategy
Sediment recycling was instigated within the Stour/Orwell Estuary system as a condition of consent for the 1998/2000 deepening of the approach channel to Felixstowe Port from −12.5 mCD to −14.5 mCD (Posford Duvivier Environment and HR Wallingford, 1998). There was a concern that the deepening of the harbour -causing trapping of more sediment within the harbour because of reduced currents and enhanced deposition, and because this trapped sediment would then be dredged and disposed offshore -could reduce the supply of sediment to intertidal areas within the estuary system (HR Wallingford, 1998). At the time of the of the Environmental Impact Assessment (EIA) studies for the 1998/2000 harbour deepening, bathymetric surveying indicated that overall, the intertidal area of the estuary system was eroding. The intertidal area of the Stour Estuary was eroding at a rate of 13 ha/year, while the intertidal area of the Orwell Estuary was increasing in area slightly. Overall, the designated (protected) intertidal area of the estuary system was declining at a rate of 10 ha/year (HR Wallingford, 1998). Given that the Stour and Orwell were eroding prior to the harbour deepening, and given that there was a risk that deepening would lead to a reduction in supply of sediment to intertidal areas, there would be a need for mitigation to any increase in the overall erosion rate of intertidal habitat. The mitigation proposed to offset this risk was sediment recycling—also known as trickle charging or strategic beneficial placement. The idea is (as explained by Gailani et al., 2019) that the release of dredged material into the water column would increase suspended solids, and hence increase the deposition, over intertidal habitat. This recycling was the first of its kind in the United Kingdom (Spearman et al., 2014), and possibly worldwide—although as noted in Gailani et al. (2019) historical strategic placement of mud has not always been well documented.
Sediment recycling began in 1998 and has continued to the present day. Initially, concern about whether the sediment recycling would be effective led to much higher rates of placement than those used today with more than 200,000 tonnes dry solids (TDS) per year being placed between 2002 and 2008. By 2008, however, local fishermen identified that accumulations of silt had occurred in several subtidal locations within and just outside the estuary system leading to changes in substrate and reductions in fishing take (HR Wallingford, 2007). In addition, further bathymetric information and modelling had also led to reduced concerns about the extent of any increase in intertidal erosion rate (HR Wallingford, 2001a; Spearman et al., 2014). This was because bathymetric surveys (which were all that was available in the early years of recycling) only provided information over a limited part of the intertidal area. In effect the (upper) limit of bathymetric surveys was +1 mCD at most. This mean that much of the intertidal areas were poorly described in terms of elevation. As the recycling continued, LiDAR measurements of intertidal elevation become available and, as a result, measurements of intertidal elevation and of the rate of change of intertidal elevation were able to extend over the whole intertidal area. This improved data resulted in a reduced estimate of the rate of change of intertidal volume and allowed the models to become more accurate in their estimates of current and wave erosion. For these reasons the annual amount of sediment recycling was reduced to the level of 50,000 TDS/year, which is still used today.
Sediment recycling can occur in the Stour/Orwell at any time of the year but it is normal for 3 sediment recycling campaigns to be carried out annually. Sediment recycling campaigns typically occur over a 4 or 5 day period with 3–5 placement operations on each flood tide. Typically placement occurs at each of the three placement sites (Erwarton Bay, Copperas Bay and the Lower Orwell—see Figure 2) in succession.
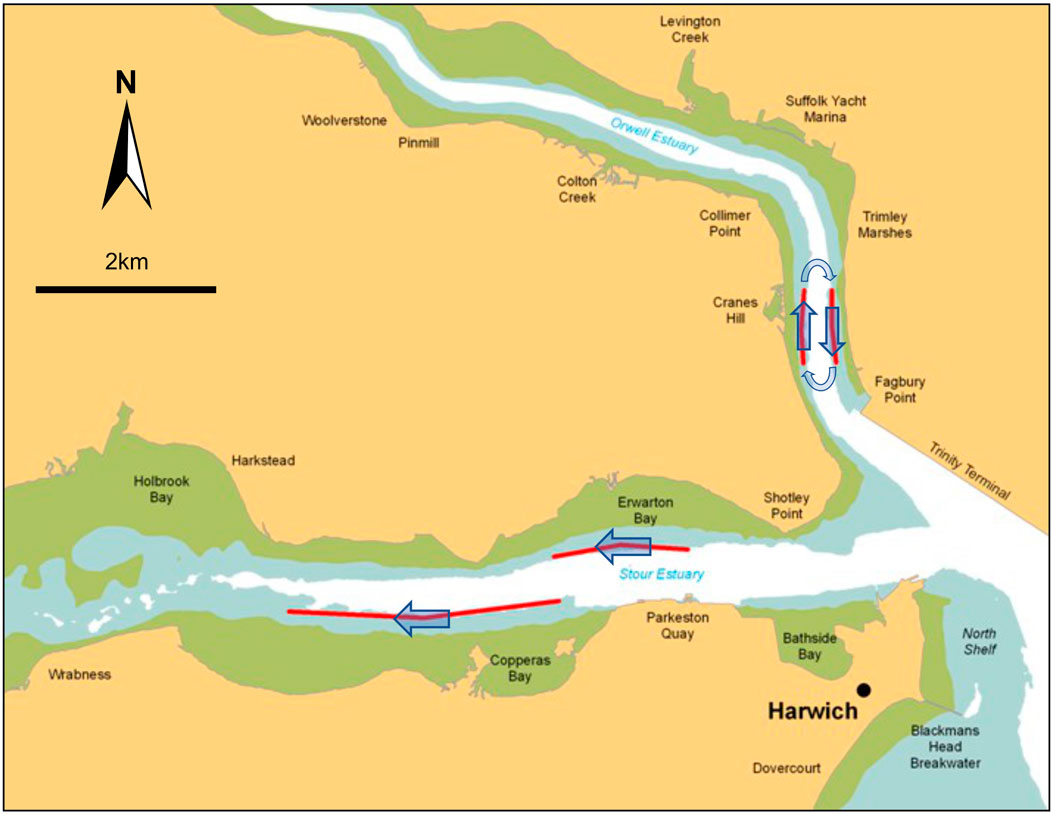
FIGURE 2. Sediment recycling methodology.
Placement typically occurs over a period of around 20 min with the dredger (hopper capacity: 1,500 m3) moving landwards at an over-the-ground speed of 2–2.5 m/s (about four to five knots). Typically each placement discharges an average of 560–570 TDS each over this 20 min period. The intention is to release the sediment slowly into the water column to enhance the mixing of the placed sediment (Figure 3). To date this modified mitigation (representing placement of approximately 4% of the maintenance dredging mass/volume) appears to be successful in enhancing intertidal habitat whilst not causing adverse effects on fishery interests. At the time of writing an estimated 2.3 Mtonnes, representing the in situ volume of around 4.6 Mm3, has been recycled.
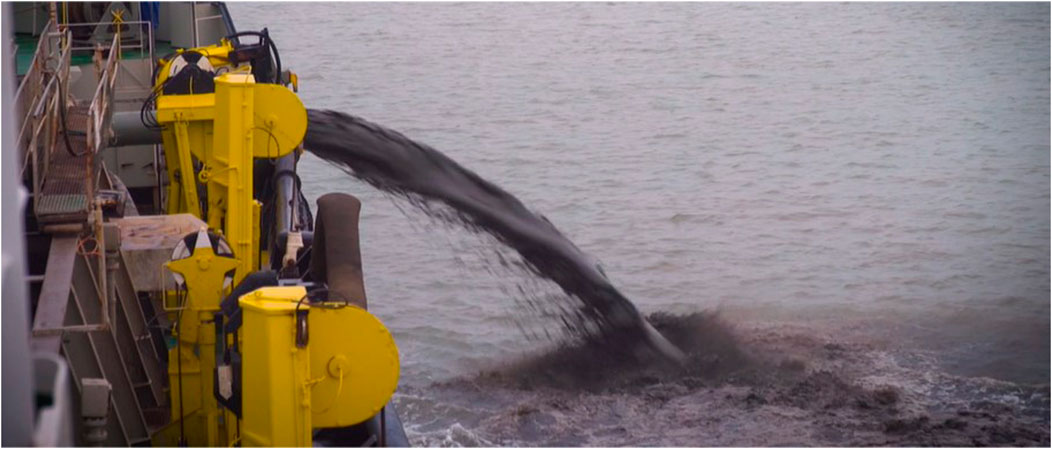
FIGURE 3. Water column recharge by TSHD.
The mitigation described in Section 2.1.2 represented the first large-scale mitigation of its type in the United Kingdom and was monitored carefully. As part of the consent agreement for the approach channel deepening a package of monitoring tasks was implemented, including subtidal bathymetric surveys over the whole estuary system and LiDAR measurements over the whole of the intertidal areas every 5 years. Surveys of the subtidal (using multibeam) and intertidal bed levels (using flown LiDAR) were undertaken in 2005/6 and 2015/6 by Harwich Haven Authority. Surveys were also undertaken in 2010 but the 2010 LiDAR survey was found to be of a lower quality and less reliable and so these 2010 surveys have not been used. The 2005/6 and 2015/6 surveys were combined to produce representations of the subtidal tidal and intertidal bathymetry in the Stour and Orwell estuary system for 2005 and 2015. The LiDAR data sets were double-checked against known land-based hard-points (suitable buildings, roads, tennis courts, etc.) and were corrected on area-by-area basis as necessary. The two bathymetry datasets have been used in this study within the morphological modelling and the changes in bed levels over the period 2005–2015 (shown in Figure 4) have been used as a basis for calibration of the morphological model.
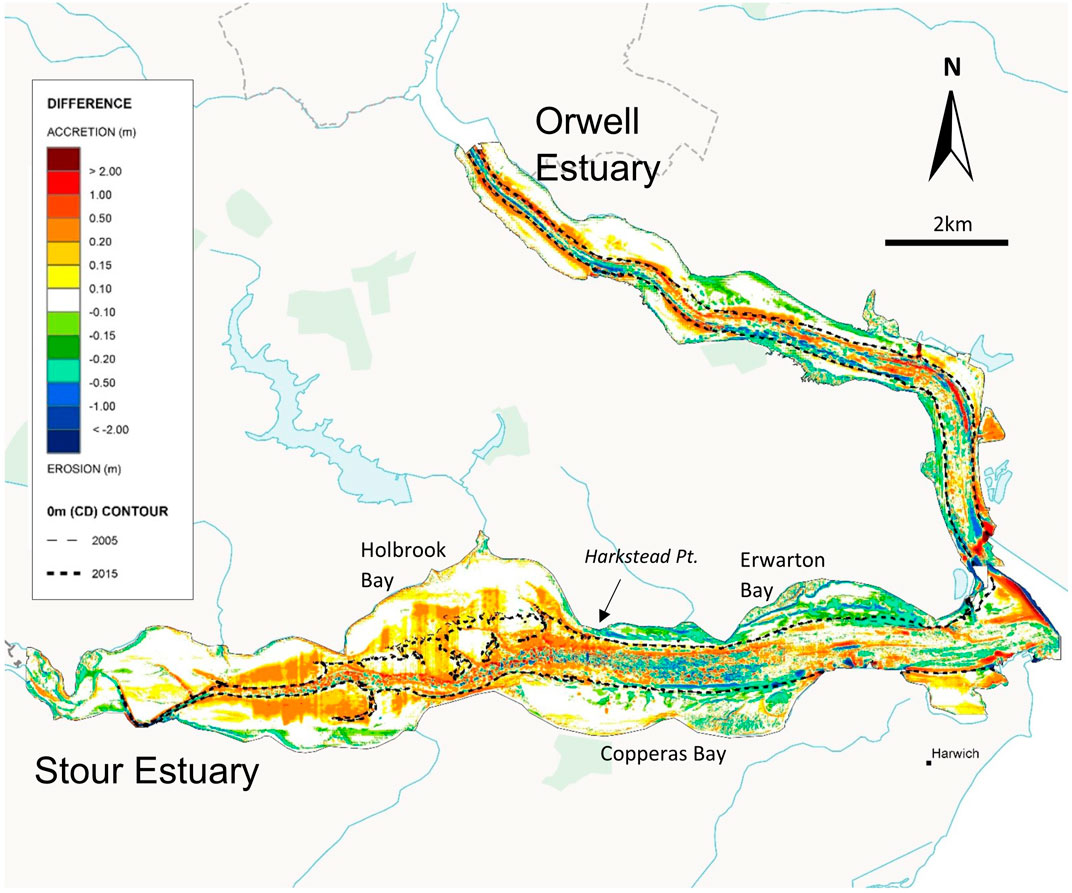
FIGURE 4. Measured change in bathymetry over the period 2005–2015.
3 Materials and methods
3.1 Tidal discharge and sediment flux measurements
Data on water discharge and sediment flux were collected during a survey commissioned by HHA carried out in February 2001 during a set of spring tides (HR Wallingford, 2001b) and, more recently, repeat surveys on 21 October 2020 (spring tide conditions) and 25 October 2020 (neap tide conditions) (HR Wallingford, 2021). Profiles of current velocity and acoustic backscatter were collected along transects using a vessel mounted Acoustic Doppler Current Profiler (ADCP). From this information, the cross-sectionally integrated volume of water passing through the transect per second can be obtained. Sediment flux data were also derived from the ADCP transects using the SEDIVIEW method (Land et al., 1997; Land and Jones, 2001; Taylor et al., 2013). Under this method, the acoustic backscatter is calibrated by means of filtered water samples and rapid deployment profilers to provide estimates of fine sediment concentration which are then combined with the velocity measurements and integrated along the transect to give the sediment flux through the transect. Figure 5 shows the location of the ADCP transects used to collect discharge and flux data at regular intervals through a spring tide in February 2001 and October 2020.
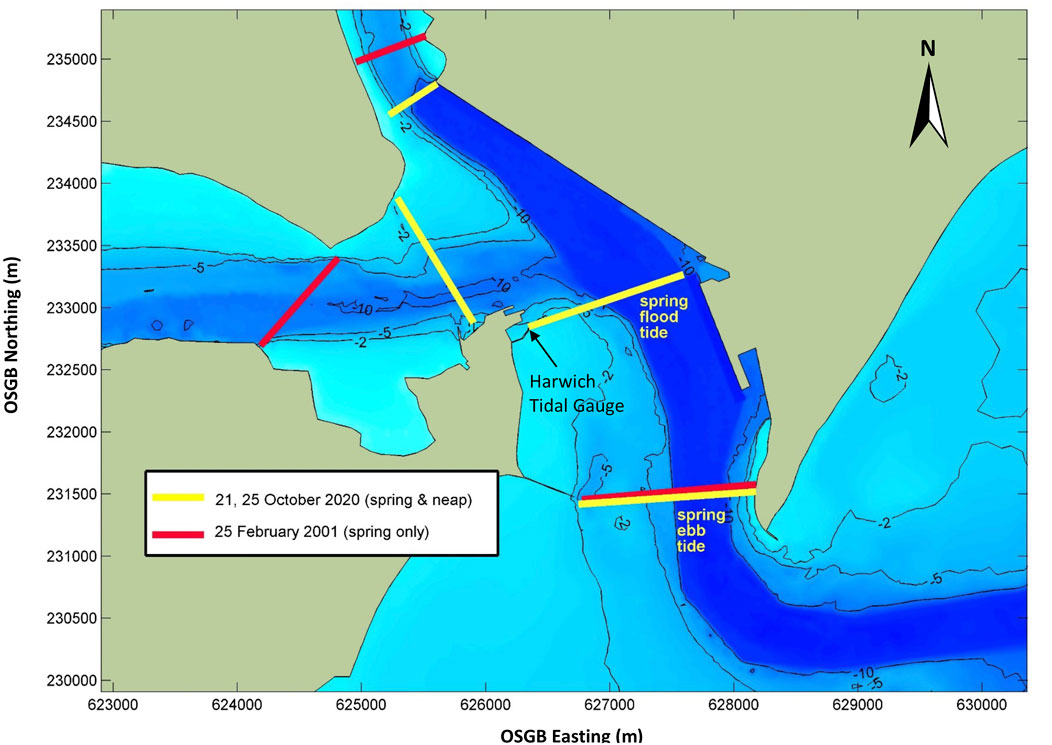
FIGURE 5. ADCP transect locations for 2001 and 2020 surveys. Coordinates are Ordnance survey of Great Britain (OSGB).
3.2 Water level measurements
Water level measurements for validation of the flow component of the sediment transport model were obtained from the Tide Gauge at Harwich and were provided by HHA. In particular, the model was compared against water levels for the 16 February to 2 March 2001 and 12 October to 10 November 2020.
3.3 Survey comparisons
The results of the bathymetry/LiDAR surveys undertaken in 2005 and 2015 (by HHA) indicate a gain of 2.3 ha/year of intertidal area in the Stour and a gain of intertidal area in the Orwell of 2.1 ha/year (at the 0 mCD level) (HR Wallingford, 2017). The gain in intertidal volume in the Stour is principally the result of net accretion in the upper Stour in Holbrook Bay and west of this on the lower intertidal between the 0 mCD and +1 mCD contours. Erosion principally occurs in the lower Stour in Erwarton Bay, east of Harkstead Point on the north bank, and in the east of Copperas Bay on the south bank. The main feature in the Orwell Estuary is the loss in the volume of intertidal areas above +1 mCD (which principally occurs between 2005 and 2010 as indicated by the less reliable 2010 HHA surveys, not shown). Again considerable accretion occurs between the 0 mCD and +1 mCD contours, causing an increase in intertidal area, but in volumetric terms this was outweighed by intertidal erosion higher in the intertidal profile.
A discussion of the potential for error in the survey measurements is included in the additional information. In summary, this discussion concludes that only the systematic errors in the survey measurements are important and, in the case of the surveys described in this study, any systematic errors are small compared to the changes in intertidal elevation observed over the period of 10 years between the surveys.
3.4 Modelling
3.4.1 Overview
A morphological model was developed, based on a combination of a flow model, a wave model and a sediment transport model. All three models were coupled together. The term morphological model will be used to describe the use of the combined, coupled models.
3.4.2 Flow model set up
The TELEMAC-3D code (www.opentelemac.org) is a finite-element model which solves the 3D free surface flow equations (with or without the hydrostatic pressure assumption) and the transport-diffusion equations of intrinsic quantities (such as temperature, salinity, tracer concentration). The TELEMAC-3D code uses an unstructured mesh made of triangular prisms and the vertical includes both sigma and flat layering as well as generalised layering. Its meshing design provides utmost flexibility for coastal modelling purposes, allowing horizontal and vertical resolution to be increased where required in an optimal fashion. Figure 6 shows the model domain and mesh used in the present study. The resolution of the mesh is coarsest in the middle of the domain, away from coastal boundaries, with an element size of about 5 km. Resolution within the outer channel was approximately 90 m reducing to 40 m or finer inside the Harbour (Figure 7). Resolution within the Stour and Orwell estuaries was set to approximately 80 m or finer.
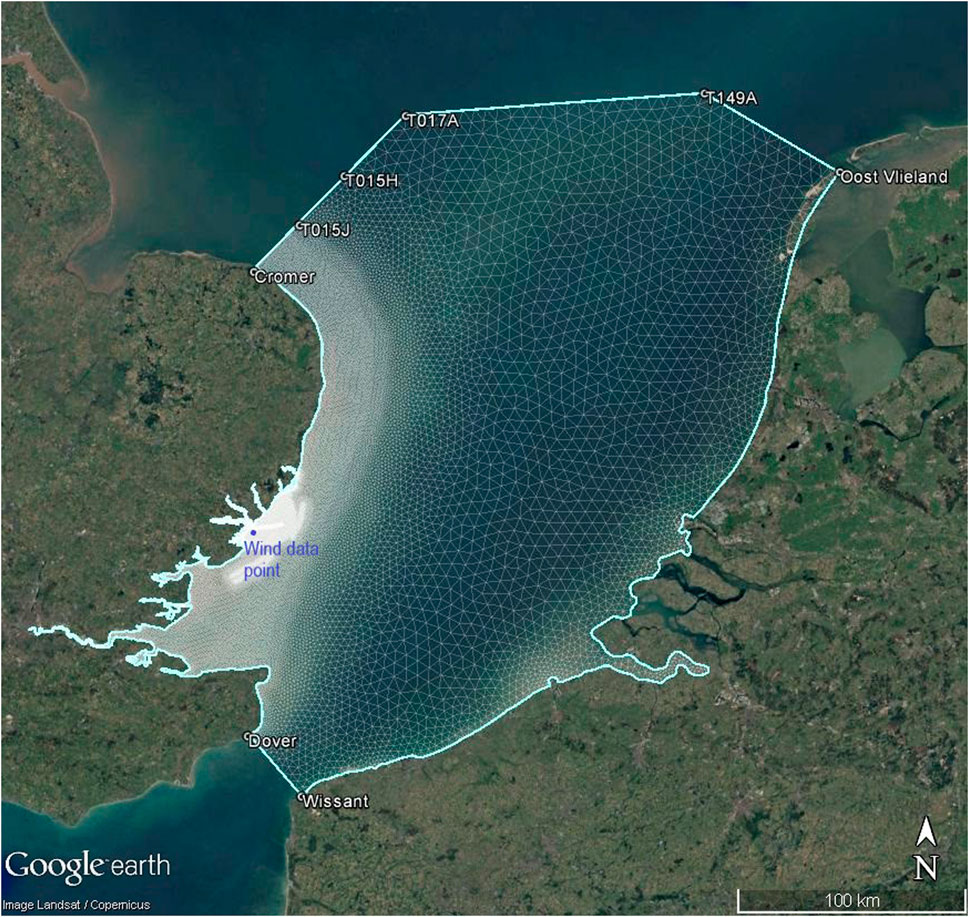
FIGURE 6. Model domain and mesh, showing locations of Admiralty tide gauge stations used.
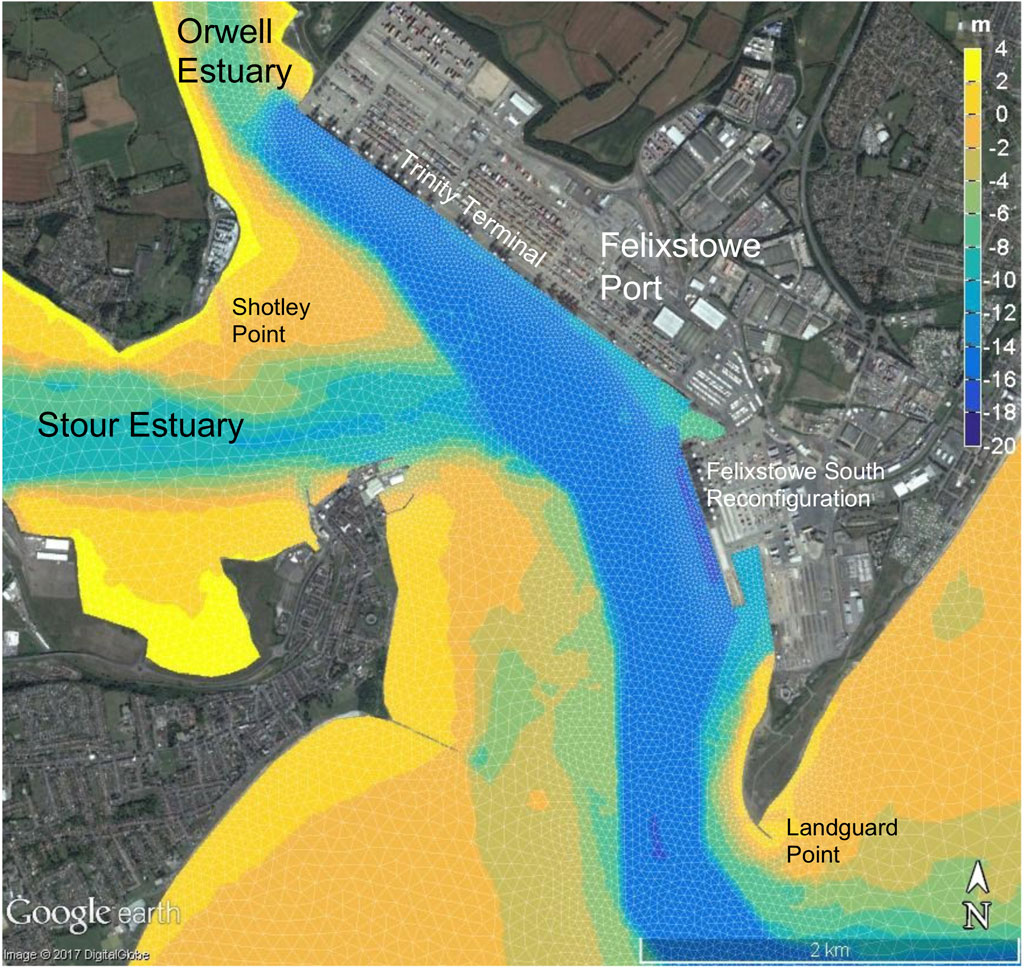
FIGURE 7. Model geometry and mesh within Harwich Harbour.
The flow model was driven on the boundaries of the model using predicted tides for a spring-neap cycle provided by the Admiralty’s TotalTide© software. A total of 8 tidal station locations were used, labelled in Figure 6, and the levels between each tidal station were linearly interpolated along the length of each of the tidal boundaries. The freshwater flow input to the Stour and Orwell Estuaries is generally very low and so no freshwater runoff was included in the model.
3.4.3 Wave model set up
The wave model SWAN was used to consider the processes of wave generation by local wind conditions and wave transformation. SWAN is a third generation spectral wave model, which simulates the transformation of random directional waves including wave shoaling; wave refraction; depth-induced breaking, bottom friction and whitecapping; Wave growth due to wind; wave reflections from structures or rocky shorelines; and far-field wave diffraction. The SWAN model has been extensively validated (Holthuijsen et al., 1997; Booij et al., 1999; Ris et al., 1999) and is widely used for coastal wave modelling.
The SWAN model was configured so that the model mesh was identical to the TELEMAC-3D mesh (Figure 6). The SWAN wave model was driven by application of wave conditions to the boundaries of the model and by a spatially varying wind over the model domain. Wind data were obtained from Met Éireann’s MÉRA reanalysis (Gleeson et al., 2017; Whelan et al., 2018) for a point offshore from Felixstowe at 51.9°N 1.328°E (for location see Figure 6). These wind conditions were analysed to derive representative wind conditions (see below) for eight direction sectors. The spatial variability of the wind was modelled using the WAsP model (Mortensen et al., 2001).
Offshore wave conditions were derived from the ERA5 global wave hindcast produced by the European Centre for Medium-range Weather Forecasting (ECMWF). Wave conditions were associated with the wind conditions from MÉRA by correlation by direction sector.
The variation in wave direction, wave height and period was characterised into 8 “representative” wave conditions which represent the “average” wave from each of 8 different directions (as shown in Figure 8). “Average” here means the wave whose contribution to fine sediment transport is average across the whole range of wave conditions experienced from this direction. These representative waves are sometimes referred to as “morphological” waves and the methodology used to derive the representative wave is described in Chesher and Miles. (1992). An explanation of how these waves are derived is included in the additional information. The representative or “morphological” waves are presented in Table 2.
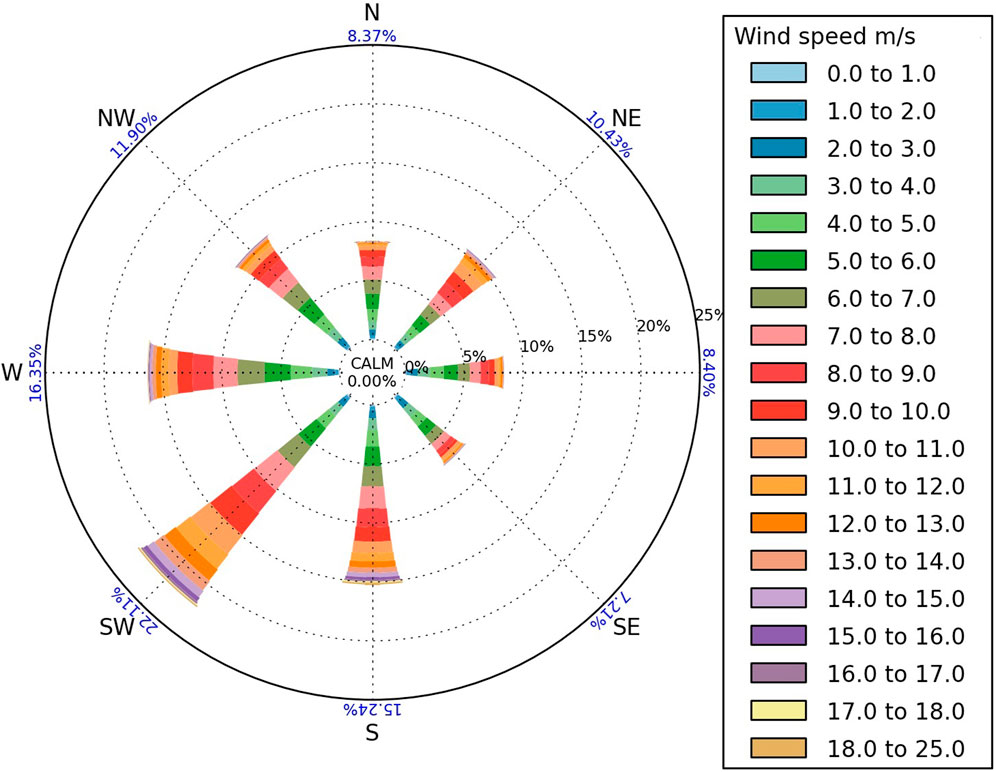
FIGURE 8. Wind rose for 2005–2015.
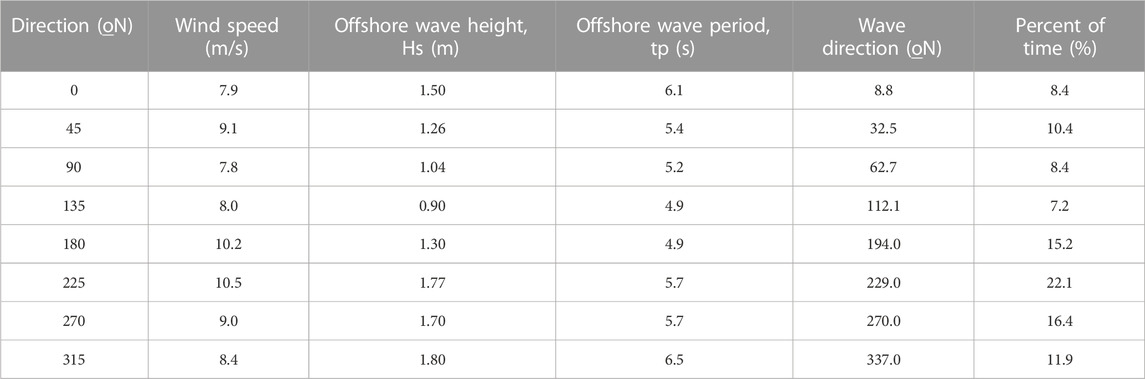
TABLE 2. Morphological wind and wave conditions.
For each wave simulation in the morphological model, the water levels within the SWAN wave model were varied according to the water level predicted by the flow model. This allowed the effects of the reduced fetch and reduced water depth resulting from Low Water, and the resulting reduction in wave action, to be represented within the morphological model.
The additional bed shear stress due to wave stirring was computed using the method of Soulsby and Smallman. (1986) and combined with the bed shear stress from tidal currents using the approach of Soulsby and Clarke. (2005).
3.4.4 Sediment transport model set up
The sediment transport model used in this study was the TELEMAC-3D model—i.e., the same model as the flow model. This enables the sediment and flow to be fully coupled and able to influence each other at the time-step level. Settling of the suspended mud was parameterised using the formula for settling of suspended cohesive sediment developed by Soulsby et al. (2013). This formula estimates the median settling velocity of macroflocs and microflocs and the respective weighting of these two components of the spectrum of floc sizes and has been validated against several detailed data sets in different NW European estuaries. The formula is based on the shear stress and suspended sediment concentration and thus gives a spatially and time-varying representation of flocculation of suspended mud particles. Hindered settling was represented by the formula given in Whitehouse et al. (2000) which is based on the equation developed by Richardson and Zaki. (1954) for fine sediment particles. At high concentrations the density of the suspended mud in suspension starts to become sufficient to cause some stratification of the density of water through the water column. At this point the suspended mud starts to contribute to the (negative) buoyancy effect and introduces damping of the vertical mixing, leading to potential increases in the near-bed concentrations. This mechanism is included in the model using the formulation of Munk and Anderson. (1948).
A two-layer bed model was used for modelling the bed exchange processes in the model. In the bed model, the uppermost sediment layer represents mobile material that is readily eroded each tide by the combined action of currents and waves. Net erosion or deposition occurs in the model depending on the balance between the erosion flux from the bed and the deposition flux. Deposition of sediment from the water column is assumed to occur continuously into the top sediment layer at a rate equal to the product of the settling velocity and the near bed suspended concentration. For the top bed layer, a critical shear stress for erosion of 0.2 N/m2 was set everywhere. When this threshold is exceeded by the combined effect of waves and currents flows, erosion is initiated and material erodes from the top bed layer at a rate predefined by the erosion rate constant (Partheniades, 1965) and in this case the constant was calibrated to be 0.001 kg/m2/s. This value is within the range used by other researchers generally found in the literature (Whitehouse et al., 2000). The underlying bed layer represented the in situ sediment that has experienced previous consolidation. The critical shear stress for erosion for this layer was parameterised with spatially varied values (for more details see the additional information). The dry density for the lower layer was set to a higher value of 750 kg/m3 (bulk density of approx. 1470 kg/m3) representing consolidated cohesive material.
3.4.5 Application of the morphological model to the Stour/Orwell
For this study the sediment transport model was run to reproduce the morphological change in the estuary system over the period 2005–2015, including the effect of the sediment recycling over this period. Over this period (which included larger placements occurring before 2008) placement as assumed to be (on average) about 66,000 TDS/year with about 44,000 placed into the Stour and about 22,000 TDS/year being placed into the Orwell. The simulation represented the moving discharge of sediment into the water column on the flood tide in the lower Stour and lower Orwell as described in Section 1.4.
Simulations of sediment transport over a month-long period were undertaken for each of the wave conditions in Table 2, and the wave conditions were chosen to be representative of the period 2005–2015. The modelling was then repeated without sediment recycling (making 16 simulations in total). The predicted changes in morphology over the course of these 16 simulations were then combined and weighted to provide the (mean) annual deposition both with sediment recycling (i.e., for 3 campaigns per year) and without any sediment recycling.
3.4.6 Objective assessment of model performance
Skill scores, such as the Briers Skill Score (BSS), provide an objective method for assessing the performance of morphological models (Van Rijn et al., 2003; Sutherland et al., 2004; Bosboom et al., 2014). Skill scores are considered to represent a more critical test of a model because they represent measurement of performance in relation to a baseline prediction—which normally in morphodynamic modelling is an assumption of “no change” (Sutherland et al., 2004). Here we use a BSS based on the mean square error,
Where
A BSS value of 1 indicates a perfect model. A BSS value of 0 indicates that the model is no better than the null hypothesis of “no change”. A negative BSS score means that the model performs worse than assuming no change. Sutherland et al., 2004 defined a classification table enabling broad rating of the performance of a model based upon the BSS score (Table 3). A BSS of >0.5 is considered as excellent.

TABLE 3. Classification of model performance according to Sutherland et al. (2004) for the BSS based on Mean square error (Equation 1)
4 Results
The results presented here relate to (a) the morphodynamic model’s ability to reproduce the observed intertidal morphological change over the period 2005–2015; and (b) the difference in morphological evolution resulting from the sediment recycling. Model results relating to validation of the hydrodynamics and background sediment transport are provided in the additional material.
4.1 Model prediction of observed intertidal morphological change over the period 2005–2015
The model prediction of bathymetric change is shown in Figure 9. The figure of predicted change matches that of the observed change well in Figure 3. Figure 10 shows a more detailed comparison of intertidal change in different regions of the estuary system (as shown in Figure 11). The figures show that the model does a good job of reproducing the distribution of intertidal volume changes that occurred over the course of the 2005–2015 period. There are some discrepancies: notably the underestimation by the model of deposition in zone 1 (on the north side of the upper Stour) and in zones 8&9 in the upper Orwell and zones 14 and 15 in the lower Orwell. However, an objective evaluation of the model performance as a whole using the Briers Skill Score gives a value of 0.89, which can be considered as an excellent model performance (see Section 3.3.5).
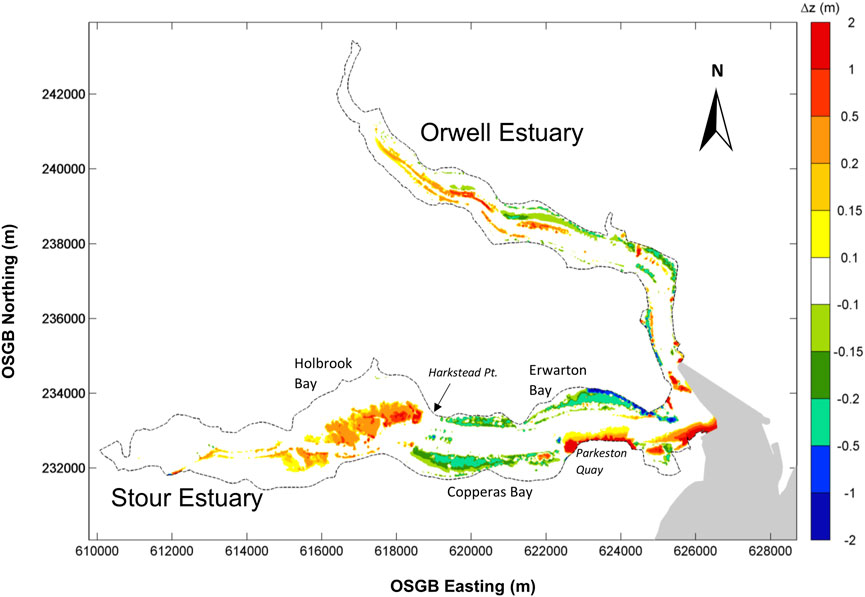
FIGURE 9. Predicted change in the rate of bed level in the Stour and Orwell 2005–2015.
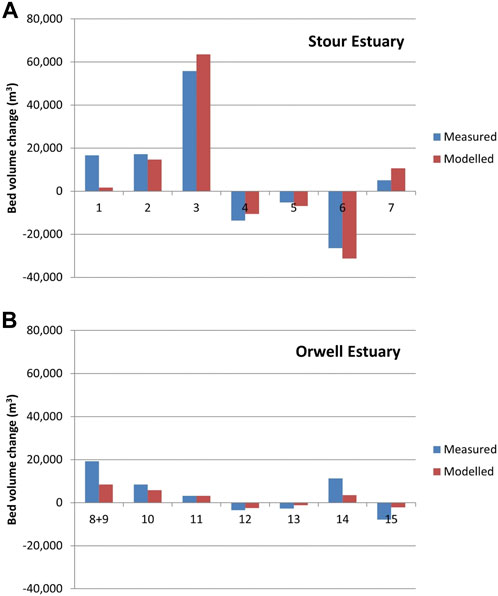
FIGURE 10. Comparison of the observed and predicted mean annual deposition (+ve) or erosion (-ve) in the (A) Stour and (B) Orwell, in each of the zones highlighted in Panel 10.
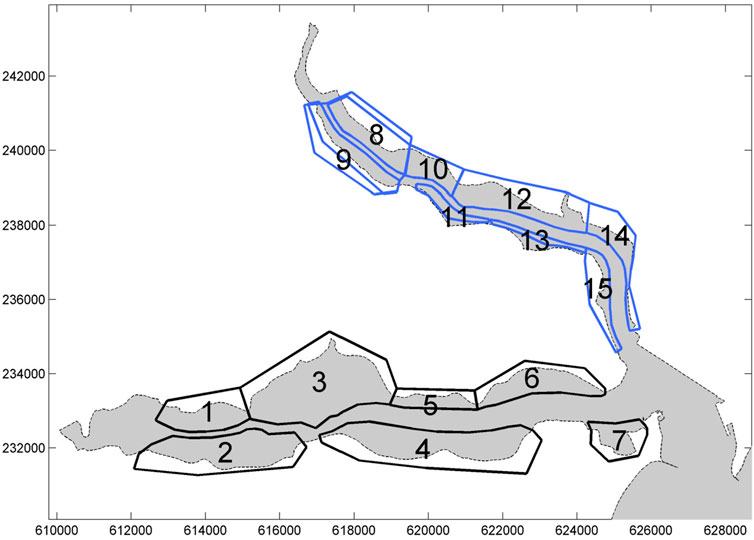
FIGURE 11. Zones used in comparisons between surveys and modelling of the intertidal erosion/deposition rate throughout the estuary system.
4.2 Morphological evolution resulting from the sediment recycling
The validated model results discussed in Section 4.1 allowed the morphodynamic model to be used as a tool to assess the difference in morphodynamic evolution that occurred as a result of the sediment recycling alone over the period 2005–2015. The assessment of morphological change described in Section 4.1, which included the effect of sediment recycling, was repeated but now without the effects of sediment recycling. By comparing the predicted morphological change with and without sediment recycling, it was thus possible to estimate the effects of the sediment recycling itself. For simplicity from now on, we refer to the results in terms of the average annual change (over 2005–2015).
The additional annual deposition (or reduced erosion) resulting from the sediment recycling is summarised in Figure 12 which shows the spatial distribution of the annual net deposition arising from sediment recycling. The model results indicate the following.
• The main area fed by the sediment recycling is the lower part of the intertidal profile, and the shallow subtidal areas of Holbrook Bay.
• Much more intertidal deposition results in the Stour Estuary than the Orwell Estuary. 21% of the recycled sediment settles on the intertidal and shallow subtidal (defined as above −1 mCD) in the estuaries with percentages of 17.5% (Stour) and 3.5% (Orwell)
• In the estuary system as a whole, subtidal deposits (defined here as below −1 mCD), representing 8% of the placed material, are distributed roughly equally between the Stour and the Orwell.
• A substantial proportion of the recycled sediment (47%) deposits in the maintained areas of Parkeston Quay and the maintained areas of the approaches and berths to the Port of Felixstowe. However, this only represents a 2% increase in the overall maintenance dredging requirement of these areas.
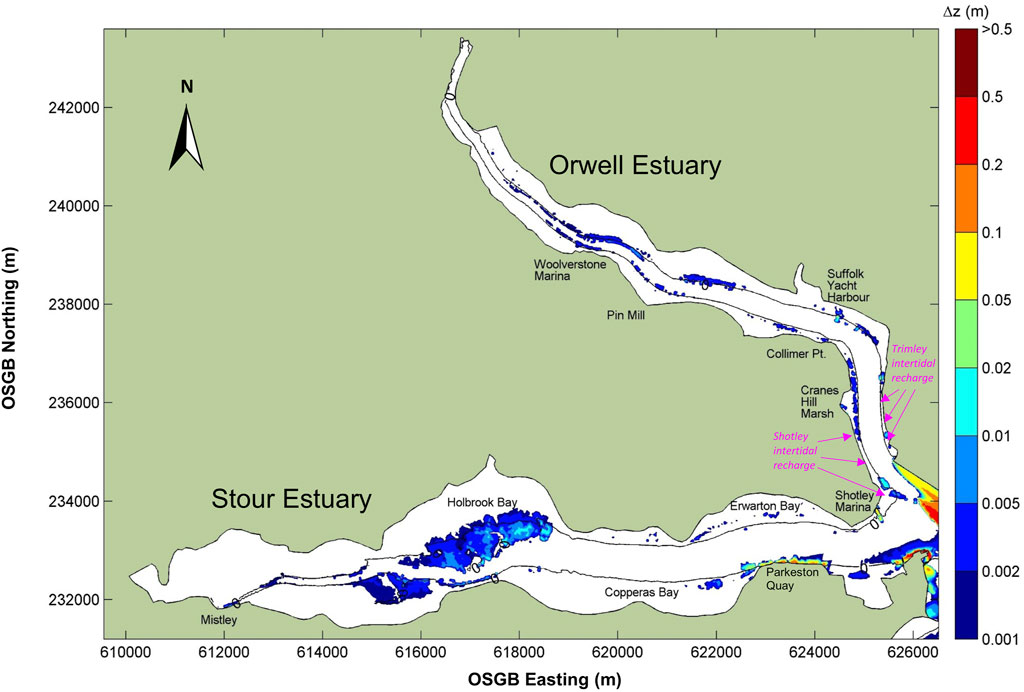
FIGURE 12. Predicted changes to the annual evolution of the estuary system due to the effect of sediment recycling (the iso-contour shown is the 0 mCD contour).
In terms of in the shallow subtidal and intertidal volume change Table 4 shows that the placement greatly increases the overall annual rate of accretion in the Stour (i.e., higher positive values) and significantly reduces the overall erosion within the Orwell (i.e., negative values of smaller magnitude) and changes the overall balance in the estuary system from erosion to overall accretion.

TABLE 4. Predicted annual changes in volume (m3/year) above the −1 mCD contour in the Stour and Orwell Estuary.
In terms of change in intertidal area Tables 5 and Tables 6 summarise the effects of the placement above CD and also above Mean Low Water (MLW). MLW is the level above which the intertidal area is designated as a Special Protected Area. The figures show that the placement causes an increase of 1.7 ha/year above CD but results in a smaller increase of 0.8 ha/year above MLW. The sediment recycling contributes a significant proportion of the year by year increase in intertidal area in the estuary system as a whole.

TABLE 5. Predicted annual changes in intertidal area above Chart Datum in the Stour and Orwell Estuary (ha/year).
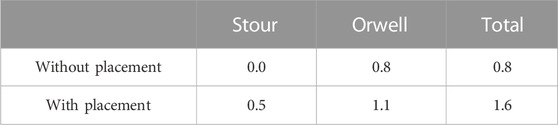
TABLE 6. Predicted annual changes in intertidal area above MLW (ha/year) in the Stour and Orwell Estuary.
5 Discussion
5.1 Methodology
This study has quantified the effect of non-direct placement in the Stour/Orwell Estuary system and for the first time the monitoring and modelling undertaken in this study has produced robust evidence that long term non-direct placement can be used to significantly increase intertidal accretion and to improve intertidal habitats. The implemented modelling methodology reliably evaluates the effects of non-direct beneficial use of cohesive sediment, separating the effects of natural changes in morphology from the effects of the beneficial use. This allows a robust evaluation of the effectiveness of such methods, instilling confidence in regulators and stakeholders regarding their use, and crucially enables these methods to be tested and optimised using modelling before implementation.
The modelling methodology used depends on an extensively validated morphological model—validated in terms of hydrodynamics, sediment transport and ability to reproduce long term changes in morphology—and accurate surveys of the intertidal areas. Ideally these surveys should be sufficiently far apart in time that the observed changes in morphology between surveys are significantly larger than the short term variation caused by tides and storms and significantly larger than the potential systematic errors in the survey measurements.
5.2 The distribution of depositing sediment
Around 21% of the placed material is predicted to deposit on intertidal areas or in adjacent shallow subtidal areas in the Stour and Orwell. This result offers clear evidence that sediment recycling approaches of fine sediment can offer substantial benefit. The placement in the Stour was more efficient than in the Orwell with 27% of the Stour placement depositing on intertidal or adjacent shallow subtidal areas, compared to 11% in the Orwell. It is considered that the main reasons for this difference lie in the differences in geometry and hydrodynamics between the two estuaries (plots of the current velocities at times of peak flood and peak ebb are included in the additional information). Deposition of the placed material within the Stour does not occur within the intertidal areas adjacent to placement but rather within those shallow upstream areas of the Stour (in and to the west of Holbrook Bay) where sedimentation occurs naturally—i.e., where the effect of friction on the tidal wave (e.g., Friedrichs et al., 1998) results in flood-dominant currents and hence sediment trapping. These upstream parts of the Stour are also where the fetch of the most dominant waves in the Stour (i.e., from westerly winds) is shortest. In the Orwell the upper channel is maintained by the Port of Ipswich (to −5.6 mCD) and this estuary therefore has less of the extensive intertidal/shallow subtidal areas which are present in the upper Stour. In the Orwell, the placement was predicted to settle along the lower parts of the intertidal/shallow subtidal alongside the channel.
As was found for the Mud Motor experiment in Baptist et al. (2019), we found that the sediment recycling was found to be most efficient in areas where the currents and waves were low enough to allow accumulation of fine sediment. In the Stour the sediment recycling primarily deposited in locations where sediment naturally accretes. This was true in the Orwell as well although some areas close to the placement location were predicted to receive a small net benefit (millimetres/year) in the form of reduced erosion. Unlike the Baptist et al. (2019) findings, the highest rates of intertidal accretion (from placement) were predominantly found to be on the lower parts of the intertidal profile (rather than, as they found, on the upper part of the profile).
In spite of the clear effect of the sediment recycling in the vicinity of Holbrook Bay in the Stour, the resulting deposition was not found to significantly change the nature of intertidal muddy sediment, or the nature of the benthic species present in the sediment (Unicomarine, 2016). Over the monitoring period 1997–2015 the sediment was found to be consistent and mainly composed of Ragworms & bivalves (Hediste diversicolor and Macoma balthica). This consistency is likely to be because the deposition resulting from sediment recycling predominantly occurred in locations which were already sinks for background muddy sediment.
5.3 The limitations of sediment recycling in Harwich Harbour for estuary management
It is noted that the natural trend (Figure 3) in the Stour Estuary is to erode in the intertidal areas of the lower estuary (Erwarton and Copperas Bays) and that of the Orwell is to erode on the west shore of lower Orwell and on the upper part of the intertidal profiles in the upper Orwell. Since the surveyed changes and the morphological model prediction both indicate continuing net erosion in Erwarton and Copperas Bays, and the model prediction shows that there is negligible deposition of the recycled sediment in those areas, it can reasonably be deduced that the erosion in these areas is unaffected by the sediment recycling and that these areas will continue to erode. This is primarily because of longer fetch (and hence larger waves) that exists for the lower Stour Estuary with regard to westerly wave conditions, although there is some evidence that the development of the harbour over the last 50 years (i.e., the deepening of the harbour and the increased reflection of waves from quay walls) has led to additional wave energy passing from offshore, through the harbour mouth and into Erwarton Bay (HR Wallingford, 2001c). Despite the erosion observed in Copperas and Erwarton Bays, sediment recycling significantly influences the overall net balance of intertidal/shallow subtidal erosion/deposition within the estuary because of the enhanced siltation further upstream in the Stour Estuary.
Preventing or significantly reducing erosion in these eroding areas will likely require greater levels of intervention and, given the experience of recycling larger volumes of sediment which was found to create issues for fishery stakeholders (see Section 2.1.2), any feasible intervention for these areas would likely be required to take the form of direct beneficial use approaches, rather than significantly greater levels of sediment recycling. Direct beneficial use, for instance, was carried out in the lower Orwell in 1997, with top ups in 2000 and 2003, to protect the seawall (which had shown signs of failing) and also to try and restore the eroded mud and saltmarsh habitats fronting the sea wall (French and Burningham, 2009). The beneficial use took place along a 2 km stretch of intertidal upstream of Shotley and on the opposite shore at Trimley (for locations see Figure 12), in the form of gravel and clay bunds which were then filled with soft, muddy maintenance material (HR Wallingford, 2008). On the west shore (at Shotley) the bunds exhibited significant rollover as a result of wave action which led to a reduction in area covered by the placement, but also, as the bunds were pushed up the intertidal profile, the mud placement was pushed upwards and achieved elevations supporting saltmarsh (including Salicornia europea, Suaeda maritima, Atriplex.
Portulacoides and Aster tripolium). The mudflat, subsequently left unprotected as the bunds moved landwards, was found to return to its pre-placement levels (French and Burningham, 2009). The eastern shore (Trimley) placement was not affected by rollover and remained as mudflat, albeit elevated with respect to pre-placement (OMReg, 2023).
5.4 Future steps
Although this paper has established that the sediment recycling is effective, it still may not be the most optimal method for managing dredging within the estuary, either environmentally or on grounds of dredging efficiency. This is because of the current requirement for offshore disposal of the vast majority of the maintenance dredged material. The offshore disposal results in long dredging cycles (around 4 h, based on data provided by HHA) and, given that loading times are short (in the region of 35 min, HHA data) the overall production rate of the TSHDs, is relatively low. Furthermore, the long travel distance leads to high fuel costs and hence high CO2 emissions. To address these economic and climate-related costs HHA is developing an agitation dredging approach, which they have termed Dredging with Nature® (Dredging Today, 2022). The idea is for a small agitation dredger dredging over extensive periods, to release sediment into the water column at a relatively low productivity, but releasing much greater proportion of the dredged sediment into the water column to feed the intertidal areas. Releasing sediment into the water column at a low rate over extensive periods has the aim that a much larger proportion of the dredged sediment (than the 4% used at present) can feed the intertidal areas of the estuary system whilst resulting in modest suspended sediment increases that would not cause adverse impact on ecology. Since no sediment has to be placed offshore, a lower dredging productivity is still adequate for maintaining the harbour. In addition, the much lower fuel costs associated with the agitation dredging solution result in a much smaller CO2 footprint for the maintenance dredging.
Investigation of the effectiveness of the use of agitation dredging as a means of sediment recycling is ongoing using the methodology described in this paper.
6 Conclusion
This study has quantified the effect of non-direct placement in the Stour/Orwell Estuary system using long-term bathymetric and LiDAR surveying, together with detailed and well-validated sediment modelling, and produced robust evidence that long term non-direct placement can be used to significantly increase intertidal accretion and to improve intertidal habitats. The quantification method has great potential to allow non-direct methods of placement to be refined and optimised.
Sediment recycling has been undertaken in the Stour/Orwell Estuary system since 1998. The methodology implemented in this study has enabled the effectiveness of this sediment recycling to be identified with 21% of the release material permanently depositing on the intertidal and shallow subtidal areas.
This result offers clear evidence that sediment recycling approaches of fine sediment can offer substantial benefit. However, whilst this method is effective in stable or more quiescent areas, this sediment recycling does not represent a solution in areas of the estuary system which are eroding more rapidly. For such areas, any effective beneficial placement would need to be in the form of direct placement.
Data availability statement
The original contributions presented in the study are included in the article/Supplementary Material, further inquiries can be directed to the corresponding author.
Author contributions
JS designed and led the study. TB developed, validated and ran the numerical model. JS wrote the first draft of the manuscript. JS and TB both contributed to manuscript revision, and read, and approved the submitted version.
Funding
Harwich Haven Authority (HHA) provided the funds for the research submitted, HHA is the conservator for the Stour/Orwell Estuary System. The funds for the open access publication fee came from HR Wallingford.
Conflict of interest
The authors were employed by HR Wallingford Ltd., which has Independent Research Group status in the UK.
The authors declare that this study received funding from Harwich Haven Authority. The funder was involved in the study design and collection of the multibeam and density profile data and gave permission for this data to be published. The funder was not involved in the analysis, interpretation of data, the writing of this article or the decision to submit it for publication.
Publisher’s note
All claims expressed in this article are solely those of the authors and do not necessarily represent those of their affiliated organizations, or those of the publisher, the editors and the reviewers. Any product that may be evaluated in this article, or claim that may be made by its manufacturer, is not guaranteed or endorsed by the publisher.
Supplementary material
The Supplementary Material for this article can be found online at: https://www.frontiersin.org/articles/10.3389/feart.2023.1084054/full#supplementary-material
References
Agaton, C. B., and Guila, P. M. C. (2023). Ecosystem services valuation of constructed wetland as a nature-based solution to wastewater treatment. Earth 4, 78–92. doi:10.3390/earth4010006
Ausden, M., Dixon, M., Lock, M., Miles, L., Richardson, R., and Scott, C. (2018). SEA change in the beneficial use of dredged sediment, technical report for the Royal Society for the Protection of Birds, may 2018. Avaliable At: https://www.rspb.org.uk/globalassets/downloads/documents/conservation-projects/seabuds-report.pdf.
Baptist, M. J., Gerkema, T., van Prooijen, B. C., van Maren, D. S., van Regteren, M., Schulz, K., et al. (2019). Beneficial use of dredged sediment to enhance salt marsh development by applying a ‘Mud Motor’. Ecol. Eng. 127, 312–323. doi:10.1016/j.ecoleng.2018.11.019
Beardall, C. H., Dryden, R. C., and Holzer, T. J. (1991). Suffolk estuaries, Suffolk wildlife trust. Colchester: Segment Publications.
Beck, M. W., Heck, K. L., Able, K. W., Childers, D. I., Eggleston, D. B., Gillanders, B. M., et al. (2003). The role of nearshore ecosystems as fish and shellfish nurseries. Issues Ecol. 11, 1–12. doi:10.1201/b14821-2
Booij, N., Ris, R. C., and Holthuijsen, L. H. (1999). A third-generation wave model for coastal regions, Part I: Model description and validation. J.Geoph.Res. 104, 7649–7666. doi:10.1029/98JC02622
Bosboom, J., Reniers, A. J. H. M., and Luijendijk, A. P. (2014) On the perception of morphodynamic model skill. Coast. Eng. 94, 112–125. doi:10.1016/j.coastaleng.2014.08.008
Brils, J., de Boer, P., Mulder, J., and de Boer, E. (2014). Soils Sediments. Reuse dredged material as a way Tack. Soc. challenges. 14, 1638–1641. doi:10.1007/s11368-014-0918-0
Burd, F. (1992). “Erosion and vegetation change on the saltmarshes of essex and north kent between 1973 and 1988,” in Research and survey in nature conservation (Peterborough: Nature Conservancy Council).
CEDA (2010). Dredged material as a resource: Options and restraints’, CEDA information paper. Avaliable At: https://dredging.org/documents/ceda/downloads/publications-2010-6-ceda_information-paper-dredgedmaterialasaresource.pdf.
CEDA (2019). Sustainable management of the beneficial use of sediments. Information paper. Avaliable At: http://www.dredging.org/media/ceda/org/documents/resources/cedaonline/2019-05-BUS-ip.pdf.
Chen, S., Sanford, L. P., Koch, E. W., Shi, F., and North, E. W. (2007). A nearshore model to investigate the effects of seagrass bed geometry on wave attenuation and suspended sediment transport. Estuar. Coast 30, 296–310. doi:10.1007/bf02700172
Chesher, T. J., and Miles, G. V. (1992). “The concept of a single representative wave,” in Hydraulic environmental modelling: Coastal waters. Editors R. A. Falconer, S. N. Chandler-Wilde, and S. Q. Liu (Brookfield: Ashgate), 271–380.
Cooper, N. J., Cooper, T., and Burd, F. (2001). 25 years of salt marsh erosion in Essex: Implications for coastal defence and nature conservation. J. Coast. Conservation 7 (1), 31–40. doi:10.1007/bf02742465
Dredging Today (2022). HHA presents the tiamat – dredging with nature, march 2022. Avaliable At: https://www.dredgingtoday.com/2022/03/31/hha-presents-the-tiamat-dredging-with-nature/.
Fonseca, M. S., and Cahalan, J. A. (1992). A preliminary evaluation of wave attenuation by four species of seagrass. Estuar. Coast Shelf Sci. 35, 565–576. doi:10.1016/s0272-7714(05)80039-3
French, J. R., and Burningham, H. (2009). Restoration of an eroded estuarine foreshore using cohesive dredge material, Orwell estuary. J. Coast. Res. 56, 1444–1448.
Friedrichs, C. T., Armbrust, B. D., and de Swart, H. E. (1998). Hydrodynamics and equilibrium sediment dynamics of shallow, funnel-shaped tidal estuaries, Physics of Estuaries and Coastal Seas. Rotterdam: Balkema.
Gailani, J. (2019). “Beneficial use of muddy dredged sediment in the U.S,” in 11th international SedNet conference (Dubrovnik: Croatia). Avaliable At: https://sednet.org/wp-content/uploads/2019/05/J.-Gailani-ppt.pdf.
Gailani, J., Brutsché, K. E., Godsey, E., Wang, P., and Hartman, M. A. (2019). Strategic placement for beneficial use of dredged material, USACE engineer research and development center report SR-19-3, june 2019. Avaliable At: https://www.academia.edu/63604795/Strategic_placement_for_beneficial_use_of_dredged_material.
Gardiner, T. (2021). The state of dwarf eelgrass zostera noltei in the Stour and Orwell estuaries. Essex Nat. 38, 243–255.
Gleeson, E., Whelan, E., and Hanley, J. (2017). Met Éireann high resolution reanalysis for Ireland. Adv. Sci. Res. 14, 49–61. doi:10.5194/asr-14-49-2017
Hanson, S. E., and Nicholls, R. J. (2020). Demand for ports to 2050: Climate policy, growing trade and the impacts of sea-level rise. Earth's Future 8, e2020EF001543. doi:10.1029/2020ef001543
HELCOM (2015). HELCOM guidelines for management of dredged material at sea, baltic marine environment protection commission (helsinki commission - HELCOM). Avaliable At: https://dredging.org/media/ceda/org/documents/guidance/various/helcom-guidelines-for-management-of-dredged-material-at-sea.pdf.
Hendriks, I. E., Sintes, T., Bouma, T. J., and Duarte, C. M. (2008). Experimental assessment and modeling evaluation of the effects of the seagrass Posidonia oceanica on flow and particle trapping. Ser 356, 163–173. doi:10.3354/meps07316
Holthuijsen, L. H., Booij, N., Ris, R. C., Andorka Gal, J. H., and de Jong, J. C. M. (1997) “A verification of the third-generation wave model "SWAN" along the southern North Sea coast,” in Proceedings 3rd international symposium on ocean wave measurement and analysis (Virginia Beach, Virginia: ASCE), 49–63.
HR Wallingford (2001a). “Bathside Bay development studies,” in Impact of proposed scheme on sediment transport and estuary morphology (Royal Haskoning: Bathside Bay Container Port Planning Applications, Environmental Statement).
HR Wallingford (2001b). “Bathside Bay development studies,” in ADCP measurements of currents and sediment flux in Harwich harbour (february 2001) (Royal Haskoning: Bathside Bay Container Port Planning Applications, Environmental Statement).
HR Wallingford (2021). Harwich agitation dredging, Numerical modelling of effects of agitation dredging. HR Wallingford Report DER6373-RT003-R03-00.
HR Wallingford (2001c). “Harwich harbour strategic studies,” in The effect of past changes in the Stour Estuary on wave conditions, HR Wallingford Report EX 4411 (Royal Haskoning: Bathside Bay Container Port Planning Applications, Environmental Statement).
HR Wallingford (1998). Harwich haven approach channel deepening environmental statement. HR Wallingford Report EX 3791.
HR Wallingford (2017). HHA 2015 five yearly review - comparison of LiDAR and bathymetry data sets. HR Wallingford Report DLM7531-RT001-R02-00.
HR Wallingford (2008). Large scale use of muddy dredged materials for sustainable flood defences and habitat management, Summary Report, Defra Research Project AE0260 HR Wallingford Report SR685, Release 2.0, January 2008. Avaliable At: https://eprints.hrwallingford.com/670/3/HRWallingford-dredged-materials-SR685_Rel2.pdf.
HR Wallingford (2007). Review of sediment replacement activities in the Stour and Orwell. HR Wallingford Report EX5651.
IADC (2009). Facts about dredged material as a resource an information update from the IADC – number1–2009. Avaliable At: https://www.iadc-dredging.com/wp-content/uploads/2016/07/facts-about-dredged-material-as-a-resource.pdf.
IMO (2014). “Revised Specific Guidelines for the assessment of dredged material,” in International Maritime organization (London, UK: IMO). Avaliable At: https://www.gc.noaa.gov/documents/gcil_imo_dmwag.pdf.
JNCC (2008b). Information sheet on ramsar wetlands. Avaliable At: https://jncc.gov.uk/jncc-assets/RIS/UK11081.
Kirwan, M. L., and Megonigal, J. P. (2013). Tidal wetland stability in the face of human impacts and sea-level rise. Nature 504, 53–60. doi:10.1038/nature12856
Land, J. M., and Jones, P. D. (2001). “Acoustic measurement of sediment flux in river and near-shore waters,” in Proc. 7th federal interagency sedimentation conf (Reno: Navada), 127–134.
Land, J. M., Kirby, R., and Massey, J. B. (1997). “Development in the combined use of acoustic Doppler current profilers and profiling siltmeters for suspended solids monitoring,” in Cohesive sediments – proceedings of INTERCOH conference. Editors N. Burt, R. Parker, and J. Watts (Wallingford, England: John Wiley & Son), 187–196.
Lymington Harbour Commissioners (2021). Lymington saltmarsh recharge by bottom placement: 2021 monitoring report, updated bathymetric survey review produced in fulfilment of condition 5.2.11 of marine licence L/2014/00396/2. Report.
Marin-Diaz, B., Bouma, T. J., and Infantes, E. (2020). Role of eelgrass on bedload transport and sediment resuspension under oscillatory flow. Limnol. Oceanogr. 65, 426–436. doi:10.1002/lno.11312
McCartney, M., Rebelo, L. M., and Sellamuttu, S. (2015). “Wetlands, livelihoods and human health,” in Wetlands and human health. Wetlands: Ecology, conservation and management. Editors C. Finlayson, P. Horwitz, and P. Weinstein (Dordrecht: Springer). doi:10.1007/978-94-017-9609-5_7
Mcleod, E., Chmura, G. L., Bouillon, S., Salm, R., Björk, M., Duarte, C. M., et al. (2011). A blueprint for blue carbon: Toward an improved understanding of the role of vegetated coastal habitats in sequestering CO 2. Environ 9, 552–560. doi:10.1890/110004
Möller, I., Kudella, M., Rupprecht, F., Spencer, T., Paul, M., van Wesenbeeck, B. K., et al. (2014). Wave attenuation over coastal salt marshes under storm surge conditions. Nat. Geosci. 7, 727–731. doi:10.1038/ngeo2251
Mortensen, N. G., Landberg, L., Rathmann, O., Frank, H. P., Troen, I., and Petersen, E. L. (2001). “Wind atlas analysis and application program (WAsP),” in Wind energy department (Roskilde: Risø National Laboratory, Scientific and technical progress). Avaliable At: https://core.ac.uk/download/pdf/13771248.pdf.
OMReg (2023). OMReg data base, Trimley foreshore. Avaliable At: https://www.omreg.net/query-database/139-trimley-foreshore.
OSPAR (2014). OSPAR guidelines for the management of dredged material at sea. Avaliable At: https://www.ospar.org/documents?d=34060.
Parthenaides, E. (1965). Erosion and deposition of cohesive soils. J. Hydraulic Div. ASCE91, HY1 91, 105–139. doi:10.1061/JYCEAJ.0001165
Posford Duvivier Environment and HR Wallingford (1998). Harwich haven approach channel deepening, mitigation and monitoring package, Report prepared by Posford Duvivier Environment and HR Wallingford for Harwich Haven Authority.
RAMSAR Convention on Wetlands (2021). Wetlands and livelihoods factsheet. Avaliable At: https:www.ramsar.org/sites/default/files/ramsar_50_factsheet_livelihoods_english_as_v7.
Richardson, J. F., and Zaki, W. N. (1954). Sedimentation and fluidization: Part I. Trans. Instn. Chem. Engrs. 32, 35–53. doi:10.1016/S0263-8762(97)80006-8
Ris, R. C., Booij, N., and Holthuijsen, L. H. (1999). A third-generation wave model for coastal regions: 2. Verification. J.Geoph.Res. 104 (C4), 7667–7681. doi:10.1029/1998jc900123
Rogers, K., Kelleway, J. J., Saintilan, N., Megonigal, J. P., Adams, J. B., Holmquist, J. R., et al. (2019). Wetland carbon storage controlled by millennial-scale variation in relative sea-level rise. Nature 567, 91–95. doi:10.1038/s41586-019-0951-7
Royal Haskoning (2019). Mitigation and monitoring for the Stour and Orwell estuaries SPA and hamford water SPA: Annual report 2015-2016, january 2019. Avaliable At: https://hha.co.uk/wp-content/uploads/2020/03/Mitigation-and-Monitoring-Review-2015-16.pdf.
SEDNET (2021). COP26 climate change and sediment management Pledge. Avaliable At: https://sednet.org/climate-change-and-sediment-management-pledge.
Seitz, R. D., Wennhage, H., Bergström, U., Lipcius, R. N., and Ysebaert, T. (2014). Ecological value of coastal habitats for commercially and ecologically important species. ICES J. Mar. Sci. 71 (3), 648–665. doi:10.1093/icesjms/fst152
Sheaves, M., Baker, R., Nagelkerken, I., and Connolly, R. M. (2015). True value of estuarine and coastal nurseries for fish: Incorporating complexity and dynamics. Estuaries Coasts 38, 401–414. doi:10.1007/s12237-014-9846-x
Soulsby, R. L., and Clarke, S. (2005). Bed shear-stresses under combined waves and currents on smooth and rough bed, HR Wallingford Report TR137, August 2005. Avaliable At: https://eprints.hrwallingford.com/558/1/TR137.pdf.
Soulsby, R. L., Manning, A. J., Spearman, J., and Whitehouse, R. J. S. (2013). Settling velocity and mass settling flux of flocculated estuarine sediments. Mar. Geol. 339, 1–12. doi:10.1016/j.margeo.2013.04.006
Soulsby, R. L., and Smallman, J. V. (1986). A direct method of calculating bottom orbital velocity under waves, HR Wallingford, Report SR76. Avaliable At: https://eprints.hrwallingford.com/112/1/SR76-method-calculating-orbital-velocity-waves.pdf.
Spalding, M. D., Mcivor, A. L., Beck, M. W., Koch, E. W., Möller, I., Reed, D. J., et al. (2014). Coastal ecosystems: A critical element of risk reduction. Conserv. Lett. 7, 293–301. doi:10.1111/conl.12074
Spearman, J., Baugh, J., Feates, N., Dearnaley, M., and Eccles, D. (2014). Small estuary, big port – progress in the management of the stour-orwell estuary system. Estuary Coast. Shelf Sci. 150, 299–311. doi:10.1016/j.ecss.2014.07.003
Suedel, B. C., Fredette, T. J., and Corbino, J. M. (2014). Island building in the atchafalaya river, Louisiana USA: An engineering with nature demonstration project. World Dredg. 48 (9/10), 14–16.
Suedel, B. C., McQueen, A. D., Wilkens, J. L., Saltus, C. L., Scott, G. B., Gailani, J. Z., et al. (2021). Beneficial use of dredged sediment as a sustainable practice for restoring coastal marsh habitat. Integr. Environ. Assess. Manag. 18, 1–2. doi:10.1002/ieam.4501
Sutherland, J., Peet, A. H., and Soulsby, R. L. (2004). Evaluating the performance of morphological models. Coast. Eng. 51, 917–939. doi:10.1016/j.coastaleng.2004.07.015
Taylor, J. A., Manning, A. J., and Crossouard, N. (2013). “Developments in the SediView Technique for the processing of ADCP backscatter data to extract suspended sediment concentration profiles in flocculated sediments,” in The 12th international conference on cohesive sediment transport processes (INTERCOH) (Gainesville, Florida, USA: University of Florida).
Tchang, G. S. (2020). The impact of ship size on ports’ nautical costs. Marit. Policy & Manag. 47 (1), 27–42. doi:10.1080/03088839.2019.1657972
Temmerman, S., Meire, P., Bouma, T. J., Herman, P. M., Ysebaert, T., and De Vriend, H. J. (2013). Ecosystem-based coastal defence in the face of global change. Nature 504, 79–83.
Thorne, K. M., Freeman, C. M., Rosencranz, J. A., Ganju, N. K., and Guntenspergen, G. R. (2019). Thin-layer sediment addition to an existing salt marsh to combat sea-level rise and improve endangered species habitat in California, USA. Ecol. Eng. 136, 197–208. doi:10.1016/j.ecoleng.2019.05.011
Ulibarri, N., Goodrich, K. A., Wagle, P., Brand, M., Matthew, R., Stein, E. D., et al. (2020). Barriers and opportunities for beneficial reuse of sediment to support coastal resilience. Ocean Coast. Manag. 195, 105287–105691. doi:10.1016/j.ocecoaman.2020.105287
Unicomarine (2016). Stour and Orwell Estuaries benthic monitoring programme: Review of macrobenthic data from 1997 to 2015. Report.
USACE (2014). Corps maximizes Mississippi River beneficial use of dredged material in 2014, USACE Press Release 3 September 2014. Avaliable At: https://www.mvn.usace.army.mil/Media/News-Releases/Article/496516/corps-maximizes-mississippi-river-beneficial-use-of-dredged-material-in-2014.
Van Rijn, L. C., Walstra, D. J. R., Grasmeijer, B., Sutherland, J., Pan, S., and Sierra, J. P. (2003). The predictability of cross-shore bed evolution of sandy beaches at the time scale of storms and seasons using process-based Profile models. Coast. Eng. 47, 295–327. doi:10.1016/s0378-3839(02)00120-5
Virginia Institute of Marine Science (2014). Thin-layer sediment addition of dredge material for enhancing marsh resilience. Virginia Institute of marine science, college of william and mary. Avaliable At: https://core.ac.uk/download/pdf/235397414.pdf.
Whelan, E., Gleeson, E., and Hanley, J. (2018). An evaluation of MÉRA, a high-resolution mesoscale regional reanalysis. J. Appl. Meteorology Climatol. 57 (9), 2179–2196. doi:10.5194/ASR-14-49-2017
Keywords: sediment recycling, beneficial use, monitoring, cohesive sediment, morphological modelling
Citation: Spearman J and Benson T (2023) Detailed modelling to evaluate the effectiveness of sediment recycling on coastal habitat. Front. Earth Sci. 11:1084054. doi: 10.3389/feart.2023.1084054
Received: 29 October 2022; Accepted: 23 March 2023;
Published: 04 April 2023.
Edited by:
Alex Kirichek, Delft University of Technology, NetherlandsReviewed by:
Henry Bokuniewicz, The State University of New York (SUNY), United StatesManish Pandey, National Institute of Technology Warangal, India
Copyright © 2023 Spearman and Benson. This is an open-access article distributed under the terms of the Creative Commons Attribution License (CC BY). The use, distribution or reproduction in other forums is permitted, provided the original author(s) and the copyright owner(s) are credited and that the original publication in this journal is cited, in accordance with accepted academic practice. No use, distribution or reproduction is permitted which does not comply with these terms.
*Correspondence: Jeremy Spearman, ai5zcGVhcm1hbkBocndhbGxpbmdmb3JkLmNvbQ==
†These authors have contributed equally to this work and share first authorship