 Wenyuan He1,2,3*
94% of researchers rate our articles as excellent or good
Learn more about the work of our research integrity team to safeguard the quality of each article we publish.
Find out more
ORIGINAL RESEARCH article
Front. Earth Sci. , 09 January 2023
Sec. Economic Geology
Volume 10 - 2022 | https://doi.org/10.3389/feart.2022.999135
This article is part of the Research Topic The Relationship between Petroleum Accumulation and Mineralization in Sedimentary Basins View all 19 articles
The Qingshankou Formation in the Gulong Sag has attracted significant attention due to its rich shale oil reserves. However, several fundamental geological problems associated with shale from the Qingshankou Formation remain unresolved. The Qingshankou Formation in the Gulong Sag is a set of deep-lake and semi-deep-lake fine-grained deposits primarily composed of mudstone and shale. Recent studies have shown that tempestites and storm deposits commonly occur in the Qingshankou Formation. Fine liquefaction veins often occur at the bottom of the tempestite, indicating that storm-shaking liquefaction is expected in the swale structure. Meanwhile, the mudstone and shales primarily have a sand structure with fine grain size, indicating that the environment is exposed to an undercurrent activity, with a water flow velocity of 20–55 cm s−1. Unlike previous studies, we posit that the ancient water depth was only 20–30 m or shallower. These phenomena have significance for understanding the formation environment and diagenetic process of shale in the first member of the Qingshankou Formation, which provides a reference for oil and gas exploration and development.
Storm deposits and tempestites are not new concepts. Kelling and Mullin (1975) proposed the idea of storm (flow) deposits, and Aigner (1980) defined storm deposits as tempestites. Allen (1981), Dott and Bourgeois (1982), Aigner and Reineck (1982), and Aigner (1980), Aigner (1985a), Aigner (1985b) conducted systematic studies on the characteristics of tempestites, the genesis of hummocky stratification, and the vertical sequence of tempestites.
Based on a summary of the palaeogeographic distribution of storm deposition in the Paleozoic and Mesozoic, Klein and Marsaglia (1987) suggested that the hurricane zone was limited to a latitude range of 25°–45° in the western margin of the ocean. This region is characterized by the combined activities of hurricanes and winter storms. The Paleozoic storm sedimentation system shows that 70% occurred in the paleo-hurricane and winter storm belt. Next, tempestites and storm deposits were concentrated in carbonate environments. Only in the last 30 years have domestic scholars focused on tempestites and storm deposits, primarily concentrating on lacustrine tempestites (Zhang et al., 1988; Jiang et al., 1990; Chen et al., 2008; Yang et al., 2009; Zheng et al., 2010; Fang et al., 2011; Feng et al., 2011; Guo and Guo, 2011; Liu et al., 2012; Zhong et al., 2018, 2020a,b).
The presence of hummocky and swale cross-bedding is the most important marker for distinguishing tempestites from storm deposits. Hummocky cross-bedding is also known as “concave cross-bedding,” a construction first discovered, described and explained by Gilbert (1899). In the 1970s, studies confirmed this phenomenon as a genesis perspective, which was thought to form via storm activity. Due to its shape, this is referred to as “hummocky cross-bedding.” This bedding was previously called “crazy-bedding” or “truncated wave ripple lamination.” Identifying knoll cross-bedding will be inaccessible if the knoll shape’s presence is insufficient, at which time it must be combined with the internal structure. Various international studies have termed the weak hummocky shape, with a surface <1 cm in the very thin silt layer with a cm-scale thickness, as hummocky cross-bedding (Osamu and Takanobu, 2007). However, after observing many samples, various uncertainties have arisen in the term and concept of hummocky cross-bedding.
Tempestites and storm sediments have two types of hummocky bottoms. The first is constructive hummocky bottoms formed via storm sediments, characterized by hummocky bottoms and internal or hummocky cross-bedding. The second is a destructive storm eroded hummocky bottom shape, which has a domal bottom shape. However, the internal structure does not have typical bedding characteristics. This shape is unstable in the thin layer, yet shows a dome shape at the bottom and interior of the structure with the influence of a storm. This often occurs without any internal bedding structure. Hummocky bottoms formed via storm erosion are common in the tempestites and storm deposits from the Ordos Basin, Mentougou (Beijing), and the Qingsong Cement plant (east of Urumqi, Xinjiang) (Fang et al., 2011; Zhong et al., 2020a). Therefore, “hummocky structure” is typically preferred for describing storm-formed sedimentary structures developed via storm erosion without hummocky cross-bedding. The hummocks can form via storm deposition or storm erosion. There are also many cases in the Gulong Sag.
Storm deposits and tempestites were first discovered in marine facies. However, they have also been recently found in the lacustrine facies. Storm deposits and tempestites in lakes were first discovered in cores (Greenwood and Sherman, 1986), with several follow-up studies (Zhang et al., 1988; Jiang et al., 1990; Feng et al., 2011; Liu et al., 2012). Allen (1981) probably first discovered lake storm deposits but was unsure about them. Detecting HSC (hummocky cross-stratification) and SCS (swale cross-stratification) on a core of approximately 10 cm in diameter is difficult and requires careful observation. Greenwood and Sherman. (1986) performed observational experiments on storm deposition in the Canadian Great Lakes, characterizing the relationship between typical HCS and SCS layers and their combinations and storm flow parameters. There was also a significant storm in 2016 at Lake Erie. Every November, winds around the Great Lakes can reach 45–50 km h−1, while the surface temperature remains approximately 11°C, and lake waves can reach a maximum of 25 m. However, the recent discovery of a storm on Lake Erie (passing storm) contradicts this theory. The development of storm sedimentary structures and bodies is objective, based on the characteristics of lake sediments; therefore, we confirm that the development of lake storm sediments and tempestites is indisputable.
Typical hummocky and swale structures are small in scale, ranging from tens of centimeters to 1–2 m (Allen, 1981; Dott and Bourgeois, 1982), and may be a remnant of a base eroded by a storm. Many tempestites and hummocky structures in storm deposits do not have hummocky cross-beddings. Additionally, there are two types of knoll cross-beddings: classic knoll cross-bedding with the interface of a fine layer and the knoll, and knoll cross-bedding for which the thin layer is parallel to the hillock interface. Swale cross-bedding is less developed in areas where tempestites or storm deposits are developed than hummocky cross-bedding. In theory, swale structure and hummocky cross-bedding should develop equally. However, this is not the case: hummocky cross-bedding tends to have a flat bottom between them, which differs from swale cross-bedding.
Storm deposits are helpful indicators for facies and palaeogeographic analysis (Aigner, 1980, 1985a, b; Myrow et al., 2008; Immenhauser, 2009). Additionally, tempestites are essential reservoirs for stratigraphic traps (Aigner, 1985a,b; Mohseni and Al-Aasm, 2004). Therefore, studies on tempestites and storm deposits are of great significance. Additionally, there are relatively few studies on storm deposits and tempestites at the core scale; therefore, performing research in this discipline is highly necessary and significant. This is especially the case for the cores in the study area, which can be used for three-dimensional (3-D) observations and descriptions. Therefore, based on core observations, this study discussed typical storm deposits and tempestites of the Qingshankou Formaiton in the Gulong Sag.
The Qingshankou Formation in the Songliao Basin is rich in shale oil with 15.3 billion tons reserves, a crucial replacement resource for the Daqing Oilfield. The K2qn shale has >90% oil-source/reservoir ratio and <0.20 m single sand body thickness generally, which is a typical pure (type III) shale oil (Wang et al., 2020). Many vital advancements have been made while examining the formation, reservoirs, and shale oil in the Qingshankou Formation (Liu et al., 2012; Sun, 2020; Wang et al., 2020; He et al., 2021, 2022a,b; He, 2022). However, some basic geological problems remain unresolved, including the sedimentary environment. It is unclear whether a simple deep-lake, semi-deep-lake facies with quiet water sediments, or more complex environmental differentiation occurred, which is not similar to the other shale-oil-bearing basins in China (Xue et al., 2020; Cui et al., 2021; Liu et al., 2021, 2022; Nie et al., 2021; Tao et al., 2021; Zhi et al., 2021). This paper discusses an influential, unrecognized phenomenon known as storm deposition and tempestite. This phenomenon is significant for understanding the formation environment and diagenetic process of the K2qn1 shale, providing a reference for oil and gas exploration and development.
The discovery of mudstone oil in the Gulong Sag in the Daqing Oilfield occurred quite early. Gao (1984) first reported the fractured mudstone oil reservoir in the Gulong Sag, which was later examined by Chen et al. (1988), providing a prelude to the discovery, exploration, and development of shale oil in the Gulong Sag. The recently constructed Wells Songye Oil 1HF and Guye Youping one have led to breakthroughs in shale oil exploration, especially the Well Guye Youping, which has substantial strategic significance (Sun., 2020). The northern Songliao Basin, with an area of 11.95 × 10⁴ km2, is a Meso–Cenozoic inland fault-swale structure superimposed basin that can be divided into five first-order tectonic units: the central swale structure, western slope, northern dip, northeast uplift, and southeast uplift areas (Figure 1).
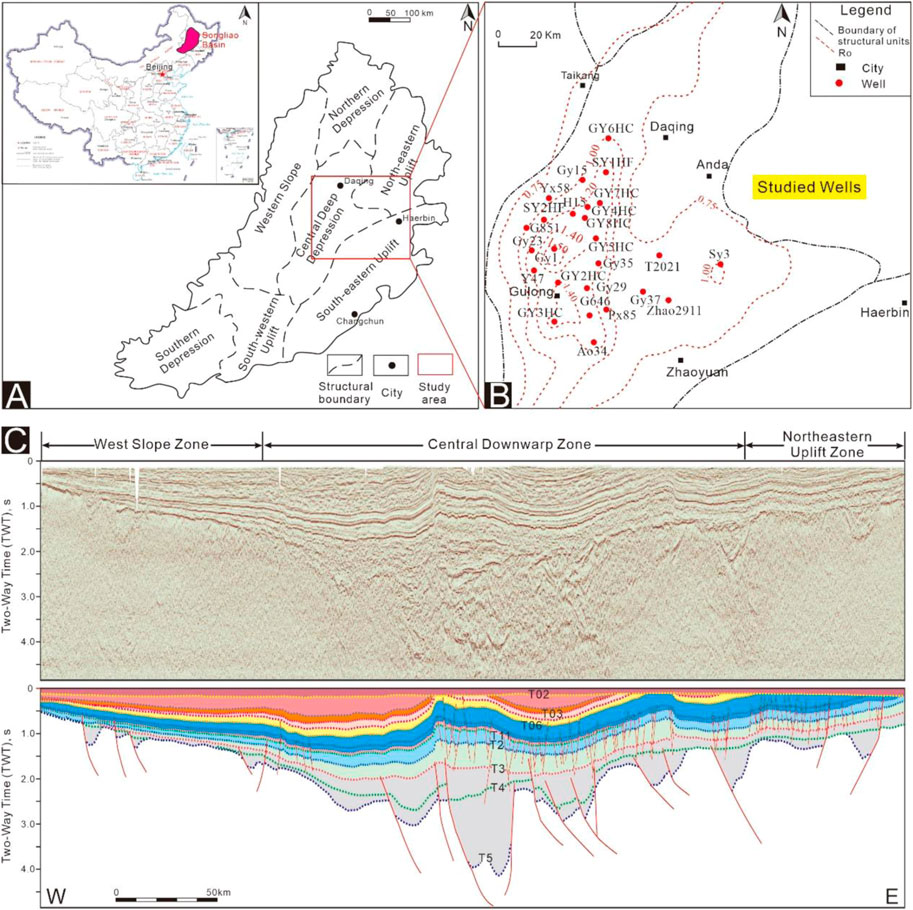
FIGURE 1. Geological background of the study area. (A) The structural units of the Songliao Basin. (B) The Ro (%) contour map of the Qingshankou Formation. (C) EW-trending seismic profile and its interpretation in the Songliao basin (T2–T11) are the Qingshankou Group.
The Songliao Basin is a Cenozoic development in the Paleozoic and a former Paleozoic metamorphic rock series with a base of large proliferous basins. Its development was a breakthrough, with a swale structure and inversion during three tectonic evolutionary stages, forming a series of stretching, squeezing, and inversion tectonics. The tectonic deformation of the geometry and kinematics characteristics substantially influenced sedimentation. The tectonic inversion occurred at the end of the Nenjiang Formation. Consequently, the Songliao Basin changed from extensional subsidence to compressive uplift (Figure 1), resulting in the uplift and folding of the Sifangtai, Mingshui, Yi’an, Da’an, and Taikang Formations, as well as the development of four unconformities. Here the NWW–SEE compression caused the development of a series of NNE anticlines, as represented by the Changyuan and Aogula. The Qingshankou Formation (K2qn) in the Gulong Sag, adjacent to the Aogula and Changyuan anticlines, suffered from a strong NWW–SEE lateral compression (Figure 1). A series of conjugate shear fractures and bedding slips formed by the NWW–SEE extrusion developed, yielding many bedding fractures, which significantly improved the reservoir capacity of the K2qn shale.
We examine the influence of the tectonic movement on the deposition, diagenesis, and accumulation of the Qingshankou Formation, as well as its impact and control over the bedding shear fracture and lateral compression-conjugate fracture in the Qingshankou Formation based on previous studies. From the Quantou to the Nenjiang Formations, the Songliao Basin is dominated by swale structures; deep-water and semi-deep-water fine-grained sediments rich in organic matter, as represented in the Qingshankou and Nenjiang Formations, established a solid foundation for the formation of shale oil in the Songliao Basin.
Two significant lake transgressions occurred during the sedimentary period of the swale structure; a large area from the deep to the semi-deep lake was generated in the central area of the basin (Figure 2), forming two sets of large-scale lacustrine deposits in the Qingshankou and Nenjiang Formations. These were the basin’s primary periods for source rock deposition and the primary shale oil development horizon. The Qingshankou Formation is the main shale oil development interval. Meanwhile, the first member of the Qingshankou Formation (K2qn1) is mainly composed of black-gray–black mud shale (Figure 2) with high organic matter content and three or four layers of shale at the bottom, representing the primary shale oil development interval.
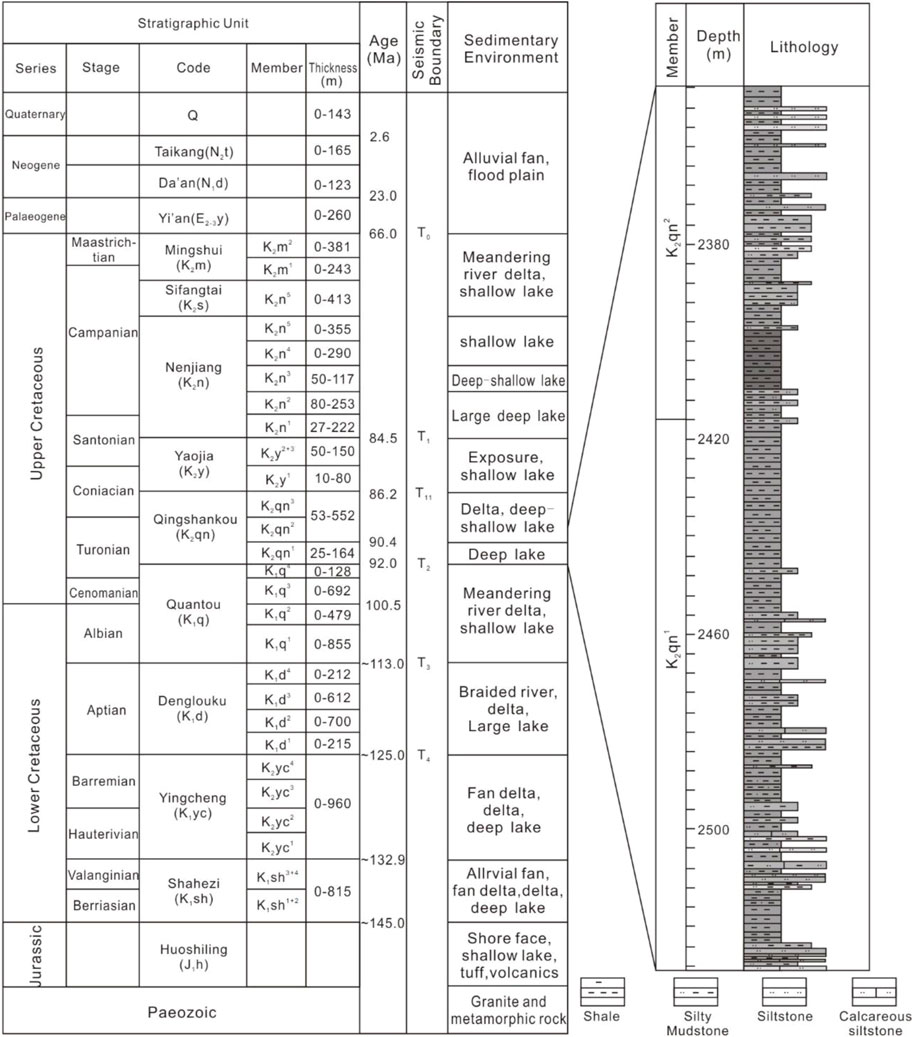
FIGURE 2. Generalized stratigraphic column of the Songliao Basin (modified from Zhao et al., 2020)
The primary basis for determining storm deposition is the cross-bedding on a hummocky or swale structure. However, such characteristics are absent in some storm deposits and tempestites (Zhong et al., 2018). Therefore, the identification and differentiation of storm deposits and tempestites cannot be solely based on the development of hummocky or swale cross-bedding.
Tempestites were discovered in the Songliao Basin (Liu et al., 2012) more than 1 decade ago. However, evidence regarding the cause of these deposits appears to be limited. Therefore, obtaining more reliable evidence is necessary, especially for the K2qn black shale of the Gulong Sag with >100 m thickness. The development of the tempestite must provide sufficient evidence because the shale oil formation occurs under continuous sedimentary reduction. Storm characteristics can affect the growth or even terminate hydrocarbon source rocks. Therefore, the oil content of the K2qn shale is negatively affected. Based on many core observations, we can conclude that the K2qn deposits in the Gulong Sag have the following characteristics.
The cross-bedding on a hummocky or swale structure is an essential symbol for storm deposits and tempestites, often observed in the K2qn1, Gulong Sag (Figure 3). The fine layers in the hummocky and swale structures are thin and converge at the edge, revealing the attenuation of storm waves. The two hummocks of the cross-bedding in Figure 3 are thicker at the “ridge” and thinner at the edge, most noticeably at the region that converted to the sag cross-bedding, distinguishing them from ordinary sand wave-bedding and sand wave lenses. The hummocky structures are often easily eroded by the next storm due to the intense erosion effect of storm deposition; the top of the hummocky structures often erode, thin out, and lose their vital characteristics (Figures 3C,D). This phenomenon is even more pronounced during the storm deposition on Lingshan Island, Qingdao, Shandong Province (Zhong et al., 2020a,b).
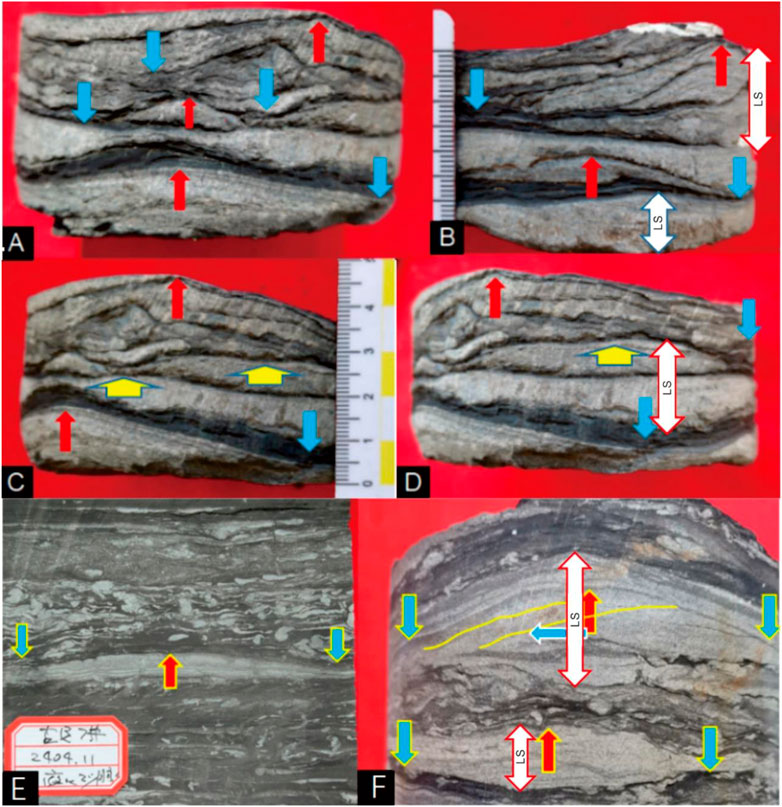
FIGURE 3. HSC and WSC structures of the K2qn shale in the Gulong Sag (LS, lenticular structures). (A) Hummocky and swale structures; three hummocky structures (red arrows), with the largest and better-developed base, approximately 10 cm wide with a 2 cm high symmetry. The hummocky structure consists of gray calcareous silty sand in the lower region and black clay in the upper region. The bottom has an erosional wash surface. Hummocky cross-bedding is developed in the upper part of the thin gray siltstone layer. The swale structure (blue arrow) is slightly smaller in width at 6–7 cm and a height of 1–2 cm. (B) Back view of core in(A). The slope structure changes along the side, and an erosional scour surface develops. The lenticular bodies of the hummocks suddenly and thinly pinch out within a few centimeters, revealing that the hummocks are isolated lenticular structures formed over a black mud bottom. The lateral variation in the sand lenses in the swale structure is as sharp as that in the hummocky structure. A lenticular or ocular structure forms when a 180° phase difference is superimposed. (C) Left 45° rotation of (A) showing slight lateral changes in the hummocky and swale structures. (D) (A) rotated 90° to the left, showing continuous lateral changes in the hummocky and swale structures. The lower swale structures are well-formed; unlike the hummocks, they have reverse grain sequences, with black clay at the base and gray calcareous silty sand at the top. The concave base is convex, and the top is flat; the concave structure is convex and lenticular. Lenticular or ocular structures were formed when a 180° phase difference was superimposed. (E) Hummocky cross-bedding, highly slender, but well developed. Convergent merging on both sides, especially thinning on the right side where convergent merging is optimal. There are 56 vertical fine liquefied sand veins. (F) Hummocky cross-bedding. Under the influence of compound flow from right to left (solid yellow line), fore deposit cross-bedding developed. However, the symmetry of the dome was not destroyed; the dome cross-bedding enveloped the top.
Additionally, small core sizes can only be partially preserved, thus making it challenging to observe a perfect hummocky cross-bedding. Figure 3E shows that the entire bedding has a highly symmetrical lenticular shape, which is raised in the center and thinner and pinched on both sides while converging to a point. This reflects the inflection point from the storm’s crest to the power’s trough. Figure 3F shows a dome-like structure formed by storm compound flow. The lower portion is a one-way cross-bedding with a fore deposit, related to storm wave drift from right to left. The upper layer has hummocky bedding. In addition to the hummocky and depressed-shaped cross-bedding formed by storms, the fine layers are hummocky and convex on the top or depressed-shaped and concave on the bottom. The key is convergence and thinning on both sides, forming a point or line.
A hummocky or depression cross-bedding was observed in the storm deposits and rocks in the Qingshankou Formation of the Gulong Sag (Figure 4), with the following characteristics: 1) The hummocky shape is poor with an overall small size, and the height is approximately 1 cm, and width of several centimeters to >10 cm. Notably, some flat bedding strip silt layers may be larger hummocky structures, i.e., the core diameter is too small to show the overall structural characteristics. 2) Unlike hummocky or swale cross-bedding, the layers are thin and merge at the edges. Consequently, the thin layers are eroded and truncated at the top, even when pinched out (Figure 4B). 3) There is an erosional cross-section at the bottom, indicating that erosion may occur at the beginning of the storm. 4) Common hilly structures occur as inverted wide “U” and “buckled” shapes on the dark mudstone (Figures 4E,F), which do not converge to a single point but spread out and are distributed along a plane. This phenomenon is also common on Lingshan Island, Qingdao (Zhong et al., 2020a,b). In contrast, Zalmai and Schieber (2017) suggested that this structure forms via sliding shear. 5) Symmetrical flow forms wavy stratification without convergence (Figures 4G,H) or cross-stratification via unidirectional flow (Figure 4H). 6) Dark sand-grade mud is expected in the fine layers or lamina, accounting for more than half of all particles, revealing the intense erosion, transport, and mixing of lake-bottom mud due to the storm’s activity.
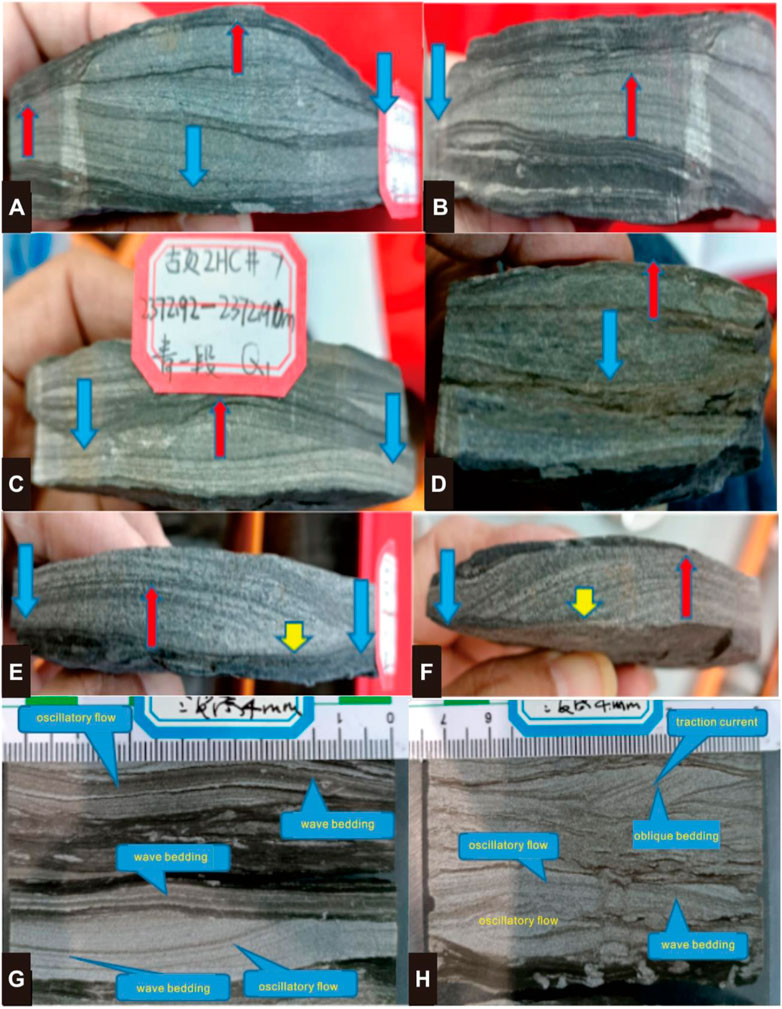
FIGURE 4. Hummocky structures and cross-bedding of the K2qn1 shale in the Gulong Sag. (A) Hummocky and swale cross-bedding. The three layers cut into each other and developed in the gray siltstone but contain half of the sand-grade mud particles, with fine storm erosion of the lake-bottom ooze. (B) Continuation behind the lower series in (A). Imperfect hummocky cross-bedding, which pinches out on the left, formed via the erosion of the upper hummocky structure. There are abundant sand-grade mud particles in the fine layer, which formed via erosion of the lake-bottom ooze from fine storm activity. (C) Hummocky and swale cross-bedding: there is abundant sand mud in the fine layer. Fine storm erosion formed the lake-bottom ooze. (D) The reverse side of (C). Three layers can be observed: the lower two are swale structure cross-beddings, and the upper is a hummocky cross-bedding. (E) Hummocky cross-bedding. The right and fine layers are suddenly in contact with the grayish-black mudstone system below (yellow arrows), formed via the oscillation of the storm crest over the mud deposits. The layers that are at 90° laterally in (E) and (F) show the fine layers and the abrupt contact of these layers with the lower gray mud-leaf layers (yellow arrows). There is a large amount of sand-grade mud clastic in the fine layer, i.e., >50%. (G) Wave-bedding and oscillating flow did not converge in the hummocky and swale cross-bedding. (H) Wave-bedding and oscillating flow did not converge with the hummocky and swale cross-bedding.
The hummocky structure and hummocky sag cross-bedding observed on the core facade cannot be easily distinguished from the sand lens and sand wave-bedding. Therefore, the characteristics of the plane should be combined. Small hummocky and swale structures can also be observed in the plane. Unlike the sand-wave lens formed by lakeside waves, the sand-wave lens formed by storms has an equiaxed 3-D convex shape, a linear sand bar in three dimensions, and notably exhibits linear extending peaks and troughs. Only a few sand lenses occur on the core’s facade, whereas three raised hummocky structures can be observed on the plane (Figure 5). Hence, these sand lenses are quasi-equiaxed hummocky structures in three dimensions, which further shows that the waves forming these dunes are equiaxed oscillatory flows formed by storms rather than ordinary linear waves. Each silty lens is separated by gray-black mudstone owing to intermittent “still water” deposits formed via small or stagnant waves between the storms.
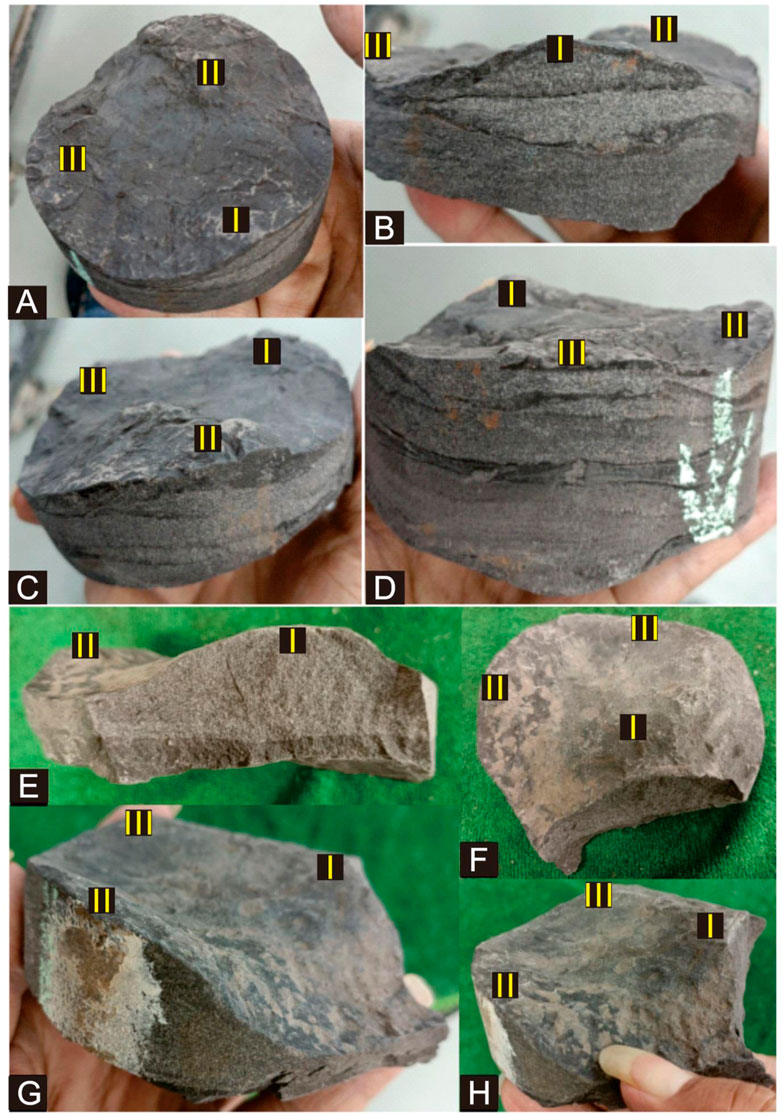
FIGURE 5. Three-dimensional hummocky structure and related structures formed via storm activity (LS: lenticular structures). (A) Three hummocky structures and their interlaying swale structures are 4–5 cm in diameter and 0.5 cm in height. (B) The hummocky type is notable on the side of the hummocky structure I in the middle of (A). Sandwiched between the three hummocks is a distinct swale (blue arrow). (C) On the side and top of the hummocky structure II in the middle of (A), the hummocky structure is notable, while the silty sand body has been pinched out and has disappeared. (D) On the side and top of the hummocky structure III in the middle of (A), the hummocky type, which may have been eroded, is not evident and flat. (E) The hummocky structure is dense and massive without any cross-bedding, revealing that the silty sand at the bottom of the lake is sufficient. (F) The top surface of E shows a highly symmetrical small hummocky shape (∼6–7 cm in diameter), not a sand wave bread shape. A distinct swale structure (blue arrow) is sandwiched between the three hummocks. (G) Three other hummocky structures are sandwiched by a swale structure (blue arrow). (H) A 90° view on the right side of (G) shows notable swale structures.
An out-of-phase superposition creates complex sand formations that yield a pod-like storm sequence (Figures 4A–D). Lenticular or ocular structures can form when the difference is 180° (Figures 4B,D,F, 5B), i.e., the thickness will suddenly increase or decrease when the hummocky and swale structures of the two storm systems are superimposed. For example, between 2,408.00 and 2,408.10 m in the Well Gupage 7, the maximum thickness can reach 4.5 cm when the difference between the hummocky and swale structures is 180°, whereas the lateral thickness of 4 cm thins to 3 cm and the thickness decreases by 1.5 cm (Figure 5B). A further 90° lateral rotation shows that the thickness of the swale structure decreases sharply in the center and on both sides, from 1.5 to 4 cm laterally to 0.0 cm, while the thickness decreases by 1.5 cm (Figure 5B), yielding the pod-like swale structure. The superimposed relationship of the thin sand layer is highly complicated, and the thickness changes significantly since hummocky and swale structures are frequently superimposed in different phases. Moreover, the thickness, shape, and continuity of the single hummocky structure change considerably due to the storm activity’s erosion and cutting. This is a piece of critical evidence that distinguishes the storm’s activity from ordinary wave activity.
In addition to hummocky or swale cross-bedding, storm sediments have some associated and symbiotic bedding (Figure 6), such as parallel-bedding (Figures 4, 6A,D,J), cross-bedding with notable lateral deposition (Figure 6F), bidirectional bedding (Figures 6G,H), and sand wave bedding, among others, revealing and recording the changes in the storm flow. In summary, the stratification of storm deposits is complex, indicating complex changes in the flow direction and velocity. However, it is generally characterized by oscillating flow: fine layers dip bidirectionally in the vertical plane and multi-directionally in the 3-D plane. The storm-calcareous siltstones in Figure 6A develop erosional scour surfaces, parallel-bedding, and complex low-angle cross-bedding, revealing an intense storm wave activity, rapid underflow, and abundant silt. The erosion and scour surface has fine gravel development and contains many Ostracoda and its debris (Figures 6B,C).
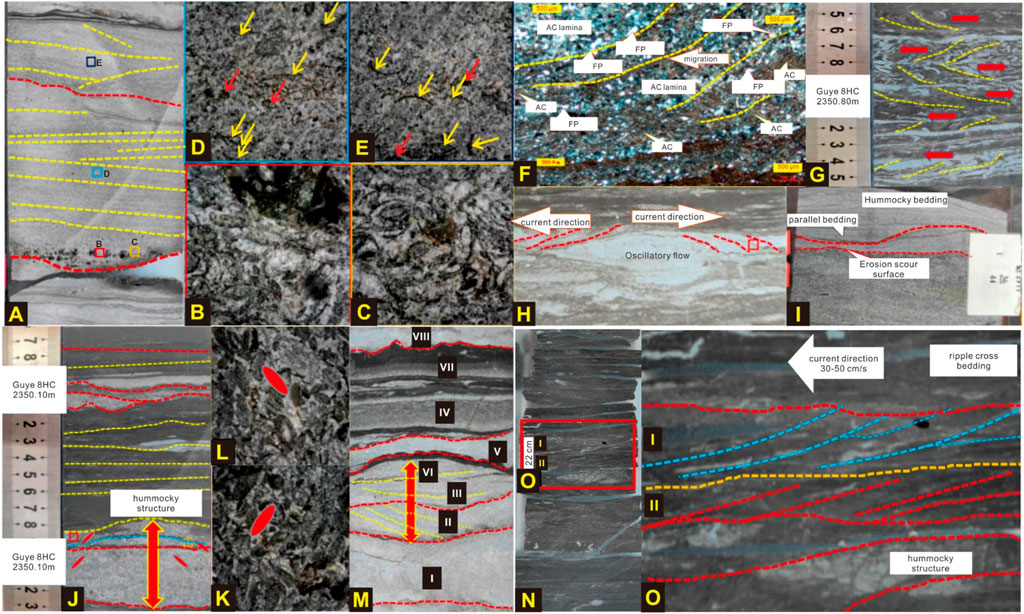
FIGURE 6. Beddings associated with a storm deposit in the K2qn shale of Well Guye 8HC, Gulong Sag (AC: Algea-clastic; FP: Felsic particle). (A) Storm-calcareous siltstone, developed with an erosional surface, parallel-bedding, complex low-angle cross-bedding, fine gravel, and Ostracoda fossils. (B,C) Dense Ostracoda fossils in the red and yellow boxes in (A) are mostly intact. (D) Green box in (A) magnified ×30. Siltstones containing Ostracoda fragments (red arrows). A large amount of black silt-grade mud is also visible. (E) The basket in (A) magnified ×30. Siltstones containing Ostracoda fragments: some are complete (yellow arrows) and a few incomplete (red arrows). There is also a large amount of black silt-grade mud. (F) Bidirectional oblique bedding and oscillating flow. (G) Unidirectional oblique bedding, slightly increasing, reflecting rich sediments and a weak water flow capacity. (H) Bidirectional oblique bedding, showing the formation of inlet and backward flows. (I) Erosional scour surface, parallel-bedding, and hummocky bedding. (J) Parallel-bedding, erosion surfaces, and hummocky and swale structures formed via storm activity. Ostracods are arranged in a hedged imbricate shape on both sides of the hummocky structure. (K,L) The ostracods on both sides of (J) are arranged in a hedged imbricate structure with a steep dip angle between 45° and 50°, which is larger than the dip angle of the imbricate structures formed via traction flow (34°). (M) A complete storm sequence, decaying rapidly. The scour surface at the bottom is developed, the sequence thickness is large, and the grain size decreases sharply upward. Inclined and swale structure bedding, formed via traction flow, are developed in the middle part, reflecting the activities of compound flow. (N) Strom deposits (O) in background sediment of gray-black shale. (O) Strom deposits, showing hummocky cross-stratification grow upwards to uni-directional micro cross-stratification deposited by waning current flow.
Erosion and scour surfaces are essential features of storm activity. These surfaces are developed in almost all areas characterized by storm activity (Zhong et al., 2020a,b). This phenomenon is expected in the Qingshankou Formation of the Gulong Sag, in which erosional and scour surfaces occur at the bottom of almost every swale structure (Figures 6A,I,J,M, 7). The interaction between the storm and wave is the base level, i.e., the original depth of more significant “standing water” fine particle deposition (clay and mud mass particles) erosion. This transports the original fine-grained sediment (Figure 7), as well as intraclasts and crumbs (including shallow algae crumbs and Ostracod debris), mixed deposits, thus forming a storm deposit at the bottom of the erosional scour surface (Figure 7). Sedimentation begins as the storm abates, forming hummocky structures and associated bedding. Erosional and scour surfaces develop at the bottom of each storm sequence and are often uneven (Figures 6A,I,J,M, 7), so the sediment size is coarser, and felsic and algal debris are more common (Figure 7). Silt is also the primary component.
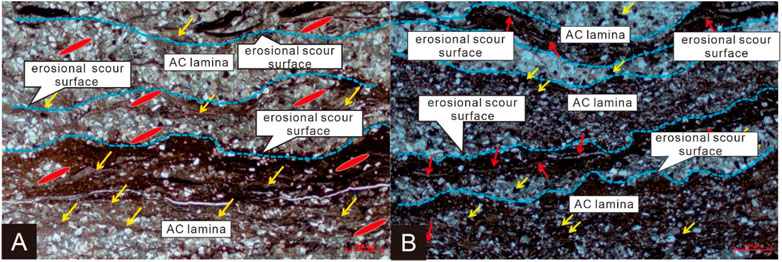
FIGURE 7. Erosional surface of an algal tempestite (dotted blue line).
Storm activity is a concept characterized by specific time and space constraints. Specifically, the storm activity in a lake has a process of occurrence and extinction. This process forms via a combination of several sub-storm deposits: each sub-storm deposit is a tiny stage of a significant storm deposit. High-energy erosion is dominated at the bottom, and storm deposits begin to form on the erosional and scouring surface. Coarser particles are deposited first due to the corresponding storm’s high energy. Fine gravel with a diameter of 2–3 mm can sometimes be observed in the Gulong Sag (Figure 6A). Moreover, we can occasionally observe 1–2 cm diameter or large boulders ranging from 1 to >10 cm in diameter. The sediment size gradually becomes smaller as the storm weakens, transforming into black or gray-black fine grain deposits at the top (Figures 6M, 7, and 8). In the storm deposits of the Qingshankou Formation, each storm sequence is composed of multiple to several centimeter-level normal cycles (Figure 7). A complete storm deposit generally has 7–9 cycles. Each sequence is usually 1–2 cm thick, with the largest reaching 3–5 cm or >10 cm. Many storm-deposited calcareous silty layers are thin lamellar beds rather than lenticular (Figures 9E,F). Most liquefied sand veins are developed at the bottom, indicating that they are storm deposits resulting from wave oscillation (Figure 9F). Generally, the sequence at the bottom is thicker and coarser, with a normal grain sequence.
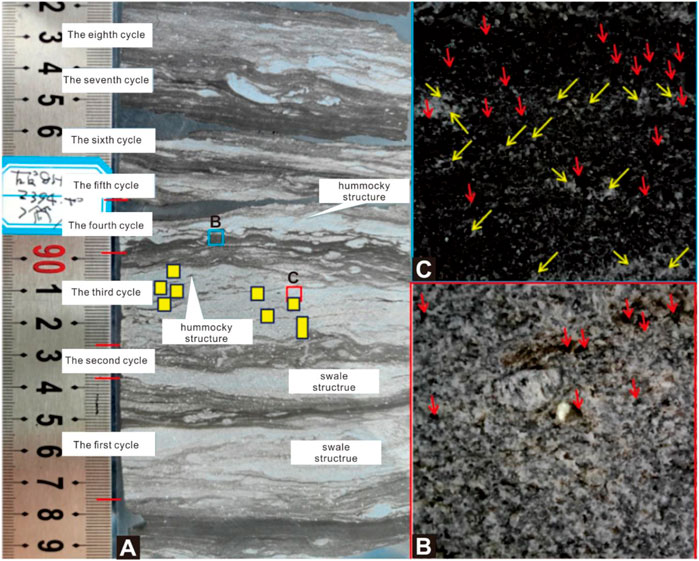
FIGURE 8. Cycle and structures of a storm deposition for the K2qn shale in the Gulong Sag. (A) A storm’s sedimentary sequence is composed of eight relatively complete cycles, among which the lower two are swale structures formed via the oscillating currents of storm troughs, whereas the upper two are hummocky structures formed via the oscillations of storm peaks. Each cycle is composed of two elements: the lower coarse-grained element and the upper fine-grained element, corresponding to the high and quiet periods of the storm, respectively. For example, the third cycle develops via the superposition of eight sub-cycles. (B) In the third sequence, the magnified photo of the red box at ×30 magnification shows two types of black and white particles, most ranging from 0.01 to 0.03 mm. The black particles are primarily clay (red arrows), and the white particles are calcite or dolomite and exist as cement. In terms of the area ratio, the content of black mud particles is ≥50%, and the content of the white calcite or dolomite particles is also approximately 50%. (C) Magnified view of the blue box in (A); the apparently uniform and dense mudstone is also composed of a series of silty clays (red arrows) often coated with calcite (yellow arrows).
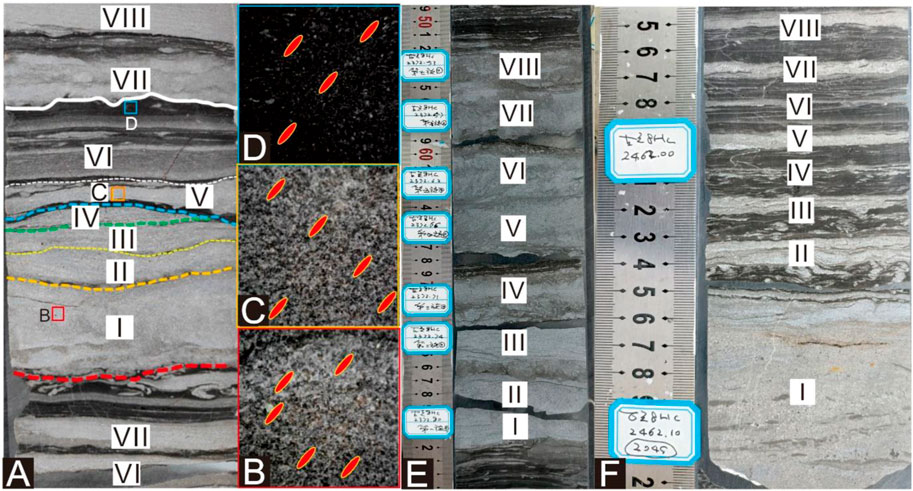
FIGURE 9. Complete storm sequence for the K2qn shale in the Gulong Sag. (A) When the storm is at its most intense activity, the energy is at a maximum, wave oscillation yields liquefied sand, falling sand veins form at the bottom, and the liquefaction and drainage deformation form on the interior. There are approximately eight secondary sequences. (B) The red box in the first storm sequence in (A) magnified ×30, with abundant gray-black silty silt in the calcareous silt. The flake minerals have a notable left-leaning preponderance arrangement, revealing wave washing from left to right. (C) The orange box in the V storm sequence in (A) magnified ×30, which also has a left-leaning imbricated arrangement with a large amount of gray-black silt-grade mud. (D) The blue box at the top of the VI storm sequence magnified ×30, with substantial silty mud clastic and lamellar minerals, which have a weak left-imbricated structure. (E) The inner liquefaction of the silty sand is strong, and the bedding disappears. The bottom erosional surface is still well developed. (F) The first sequence at the bottom is the most developed, up to 7 cm thick, with discontinuous oblique bedding. A good liquefaction sand vein is developed at the bottom of the second sequence. There is also significant liquefaction at the bottom of sequences III and IV. Several of the upper sequences also have liquefied sand veins, indicating that these thin flat calcareous silts, without storm cross-bedding and dune structures, also formed during the storm.
Typically, the storm sequence has a notable normal grain sequence. Above the erosional surface is gray calcareous siltstone, sometimes containing fine gravel, with gray-brown or gray-black mud shale above it. The grain size is smaller than the gray calcareous siltstone at the bottom, sometimes containing fine gravel (Figure 9A).
During the storm deposition, particles have certain arrangement rules; most have imbricated structures (Figures 9B–D), which reveals that, in most cases, storm waves are not simple oscillations of symmetry but have specific unidirectional and composite flow properties. However, sometimes visible ostracods are arranged in an “A” shape, and fossil ostracods hedge into a reverse imbricate structure on both sides of the dome structure, similar to an “A” shape (red ellipse in Figures 10A–C). This reveals the role of oscillation flow: high structure types occur in the cyclone storm flow on both sides of the high structure hedge. Fossil ostracods produced are in response to the oscillating flow against the imbricate structure.
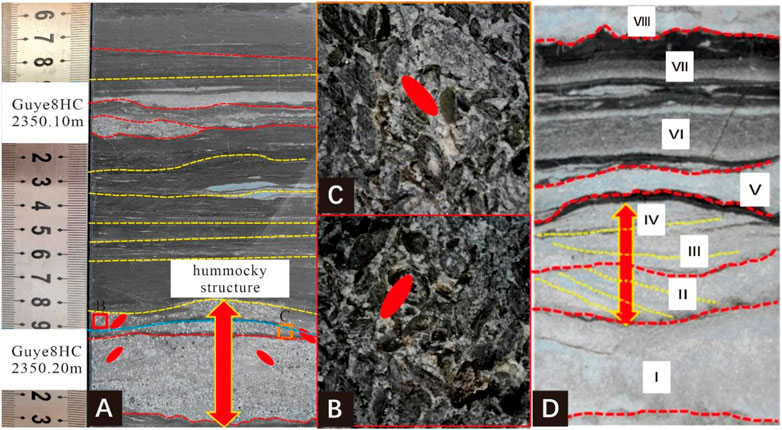
FIGURE 10. Hummocky structures with Ostracoda on either side arranged in reverse imbricated structures for the K2qn shale in the Gulong Sag. (A) The storm formed an Ostracoda limestone hummock with a significant erosional surface and normal grain sequence. Ostracoda on both sides of the hummocky structure is inversely imbricated. (B) Magnified view of the red box in (A) showing that the Ostracoda fossils have a distinct left-imbricated structure. (C) Magnified view of the orange square in (A) showing the Ostracoda fossils with a right-leaning imbricate structure. (D) Storm deposits with distinct hummocky and swale structures. Sequences ⅱ and ⅲ have notable unidirectional oblique bedding formed via a composite flow.
In the Qingshankou Formation, Gulong Sag, sand-grade mud clastic is generally developed in the storm deposits as gray-light gray siltstone formed via storm activity, sometimes reaching more than 50% content. The particle size of the sand-grade mud clastic mostly ranges from 0.01 to 0.03 m, within the range of the coarse silty sand. Therefore, a unique phenomenon occurs; the sandstone has some of the mineralogical and chemical composition of the clay while being classified structurally only as sandstone. This is a highly homogeneous mudstone at the macroscopic level but highly heterogeneous at the microscopic level. It can be divided into three distinct components: silty mud, argillaceous felsic silt, and a large amount of algal and Ostracoda debris. Sand and mud are reversed; mud has a silt size and silt has a mud size. Therefore, the siltstone formed via storms can intercalate with poorer physical properties than mudstone (Lu et al., 2020).
The diameter of most mud clastic is approximately 0.01–0.03 mm, which is between the coarse silt and is more significant than the felsic particles. The black and brown slivers on the sliders indicate that the two have different origins. The black sliders are derived from deep-water areas inside the swale structure, while the brown sliders originate from shallow water areas in the swale structure. Felsic and carbonate particles surround the mud clastic, forming a unique “Tangyuan structure (hard shell and soft core),” which requires further analysis concerning its influence on reservoirs and fracturing.
There is a large amount of silty mud in the mudstone, which can be divided into two types according to the color: organic-rich mud with black edges near the center of the swale structure and brown rounded silty mud, which originates in the organic-poor mud at the edge of the swale structure and is transported into the swale structure via turbidity currents (Figure 11).
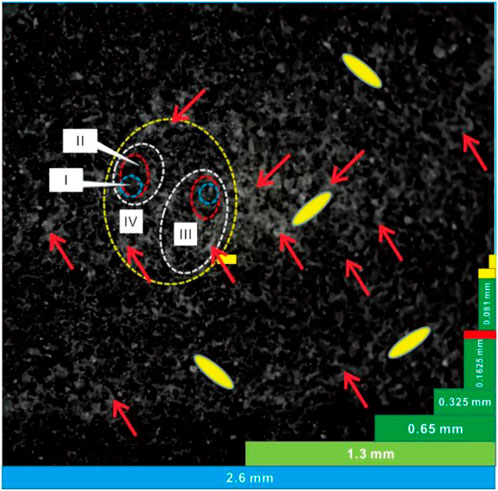
FIGURE 11. Silt-grade fragments and structure of sand-grade mud particles from Ⅰ to IV.
Except for the hummocky structure and cross-bedding developed at the bottom of the K2qn in a set of sandstones, the hummocky structure and cross-bedding characteristics of the Qingshankou Formation are all developed as a set of dark gray or gray-black mud shale, indicating that the storm deposits formed via a reduction of clay in the lake deposits. Reducing clays are in situ deposits, whereas storm deposits are ectopic deposits. Due to abundant silty mud and calcareous cementation, the porosity and permeability of the storm sediments in the Gulong Sag are poorer than that of the shale, which forms special intercalation. In the K2qn shale oil reservoir, the proportion of gray calcareous siltstone deposited by storms is only approximately 5%, primarily developed in the second and third members of the Qingshan Formation (K2qn2 and K2qn3), especially in the K2qn3; the proportion is relatively small in the K2qn1. Therefore, calcareous siltstones deposited by such storms have a negligible influence on hydrocarbon generation and storage.
This phenomenon cannot be observed in ordinary storm deposits or tempestites but is expected in the Qingshankou Formation. Liquefaction sandstone veins often occur at the bottom of a storm’s sedimentary system (Figure 12), characterized as follows: 1) Generally small in size; the diameter of sand veins in the core is 1–2 mm; the larger is 3–4 mm, and some are 7–8 mm or even >1 cm (Figures 12A,B) and >10 cm. 2) The vertical surface of the core is mostly intestinal, primarily due to compaction. This vein has a curved plate shape (Figure 12). 3) Contains a prolific gray-black mud shale, often from the bottom of the silt to the bottom of the fine dark mud shale, with several occurring in thin (cm-scale) sandstones (Figures 12C,D) and occasionally in dolomite nodules. 4) A gut shape is visible on the core facade, while a strip or wide worm-like shape is present on the core layer (Figures 12E,F). 5) Normally inclined characteristics, indicating that sand veins were subjected to bedding shear after their formation (He et al., 2021, 2022a,b,He, 2022). 6) Few gravity falling veins pass through two or three mud shale beds or even 3–4 silt beds. Additionally, due to prevalent liquefication wave oscillation or storm layer liquefaction, storm deposits often develop at the bottom of the silt layer with subsided liquefied sand veins (Figure 12) rather than from the bottom up as is common with general sand vein injections (Zhong et al., 2020a,b), referred to as “sand liquefaction gravity fall veins” or “vein of liquefied sand fall” (Figure 12).
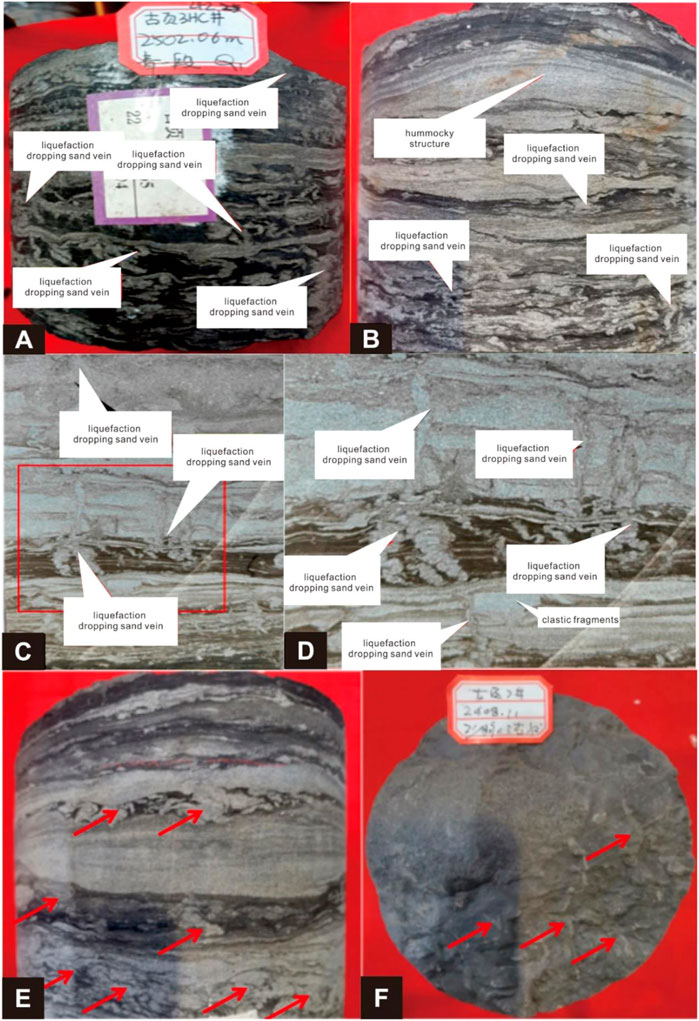
FIGURE 12. Veins of liquefied gravity falling sand formed via storm activity. (A) Hummocky and swale structures, but the hummocky and swale cross-bedding is not well developed. Liquefied sand veins at the bottom (red arrow) are well developed, indicating that the sediment at the bottom experienced oscillatory liquefaction of the storm and is soft; deposition during the low energy period between storms. (B) (A) rotated 90°: liquefied sand veins are at the bottom of each layer. Due to erosion at the storm’s peak, the development of gray-black mud shale at the bottom is not good or the erosion is too strong and thin, which is ideal for developing liquefied sand veins. (C) Veins of liquefied sand, which pass through the silty sand, reveal that the silty sand was also liquefied simultaneously and into the gray-black shale. The vertical veins of sand are greatly shortened and overlapped to form chitterlings (red arrow) due to intense compaction. (D) A magnified view of the red box in (C) shows that the liquefied sand penetrates the thin layer of silty sand into the gray-black mud shale, forming intestinal veins. (E) Thin silty layer of liquefied sand veins curled and folded into chitterlings (red arrow) at the bottom, resulting from intense compaction. This also reveals that the grayish-brown mudstone with sand veins has a high compaction rate. (F) Sand veins at the base of the storm deposits (red arrows), projecting downward into a worm-like pattern, indicating denser subsidence.
Sand veins rarely developed at the bottom of storm siltstones in the Qingshankou Formation. This is an essential feature of the shale oil reservoir in the Gulong Sag. Various mechanisms exist for sand liquefaction (Zhong et al., 2020a, b). However, the small, liquefied sand veins at the bottom of the storm deposits in the Gulong Sag form via subsidence from top to bottom under gravity, which is opposite to that of high-pressure filling from the bottom to the top in most sand veins. Primarily, this vein of liquefied sand falls from the top down (Figure 12). The continuous activities of storm oscillation on the deposited fine silt allow it to liquefy and lose its internal viscosity, resulting in flow and liquefaction deformation. This can result in liquefaction flow in the sand layer and an upward flow of discharge water. Due to its increased density, it then falls into the lower mud or silt layer, forming liquefied sand veins (Figures 12C,D). Such liquefied sand veins are often mistaken for insect tracks. Additionally, there are negligible liquefied sand veins, often mistaken for seismites. This phenomenon is rare elsewhere.
Storm oscillation liquefaction occurs via wave fluctuation; small deformation bedding formed by wave oscillation is often observed in modern sediments of the Yellow River (Zhong et al., 2018). Macquaker et al. (2010) also observed that wave oscillation could enhance sediment gravity flow, which is partially related to oscillation liquefaction. Therefore, wave oscillation liquefaction is plausible.
One of the most critical factors regarding storm deposition is its magnitude. Therefore, the K2qn formation conditions are significant, i.e., the storm wave size (wave height and wave width) and water depth during the formation. Storm waves and their dynamic characteristics have been recovered by examining their hilly cross-bedding. Studies have shown that the orbital radius, D0, at the bottom of the waves controls the wavelength, λ0, of hummocky cross-bedding (or hummocky bodies); this relationship is represented by Eq. 1 (Dumas et al., 2005):
The simplest means of estimating the wavelength and wave height is to equate the hummocky structure’s crest and trough to the bottom orbit of the wave.
We used the general width of the hummocky structure in the core of the Gulongqing section as a parameter for simple calculation. The typical width was 0.05 m (Figures 3–5). The core has 0.10 m maximum diameter (Figures 3–5), with a radius of ∼0.05 cm. Substituting the latter value into Eq. 1 yielded a λ0 ratio of 38.53 cm.
Therefore, a storm with a wave width of 0.10 m (Figures 3–5) would have a wavelength of ∼0.39 m, i.e., approximately four times the width of the hummocks. The maximum orbital velocity (Komar, 1998) under shallow and moderate water depths can be represented as Eq. 2:
where Uw denotes water velocity. Therefore, the wave period (T) must be calculated for the velocity. Immenhauser (2009) proposed a formula to calculate the storm wave period, i.e., L0 ≈ 1.56 T2, where L0 is the wavelength and T is the storm wave cycle, yielding the following:
This formula calculates the period according to the wavelength of deep water, which is more consistent with the characteristics of the Gulong Sag. If we substitute a storm wavelength of 0.43 m, we obtain a wave period (T) of 0.50, which is reasonable. We substituted this value into Eq. 2 and obtained a Uw value of 0.55 m s−1. This is the bottom flow velocity caused by storm waves that form small hummocky structures in the Qingshankou Formation.
According to the base-shape stability diagram proposed by Dumas et al. (2005), the wave velocity during the formation of the HCSs generally does not exceed 1 m s−1. Therefore, Uw can be set as 1 m s−1, and d0 = 0.43 m can be substituted into Eq. 2, yielding the following:
Using this value in Eq. 2, we obtained the following:
A value of 0.0139 m s−1 can also be obtained using the formula proposed by Allen (1981). We used the methods of Lowe (1975) and Allen (1981) to calculate the minimum fluidization velocity (Vmf) from silt to gravel with a diameter of 4 cm. Table 1 shows that the Vmf decreases from gravel to fine sand and silt by 5–6 orders of magnitude. It should be noted that Vmf values of silt and fine sand are almost zero and may represent a storm moving away from the source area (Shore lake) of the silt deposited near the storm wave base plane, forming the lower fine-grained hummocky cross-bedding (Figures 3–5). To determine the extent to which the bottom gravel layer forms under reflux with upward suspension, we obtained several empirical formulas based on our experiments, among which D = 0.0954 V1.7627 had the highest correlation of 0.9969. In this formula, D is the particle diameter (m), and V is the minimum upward movement velocity of the water flow (m·s−1). Therefore, from our experimental results (Table 1), we can see that Vmf increased by more than 40 times from silt to 4 mm diameter gravel, which is much smaller than the results of Allen (1981) and Lowe (1975).
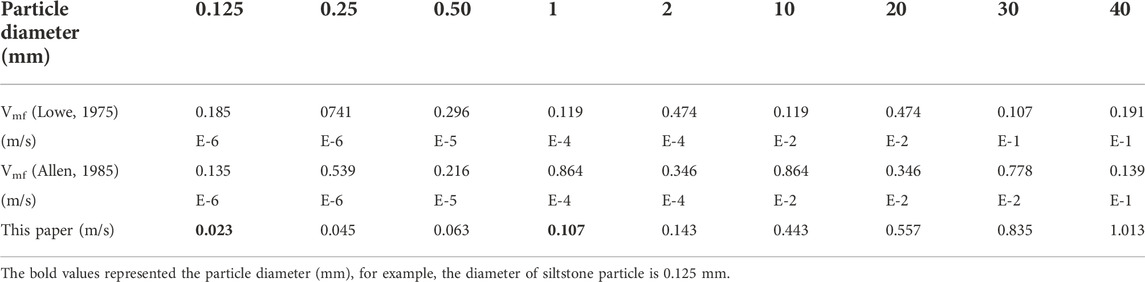
TABLE 1. Vmf values of particles with different particle sizes.
To determine the horizontal component of the upward velocity of the wave or current, the velocity of water points can be obtained by calculating the ellipse of the water points:
where X and Y represent the position of the water quality point in the horizontal and vertical directions, respectively. For example, to establish a model based on the parameters of the hummocky structure or cross-bedding in Figures 3–5, we substituted the values a = 0.05 m and b = 0.01 m into Eq. 7:
To obtain the velocity of the mass point, the first derivative of time, T, was needed, thus yielding Eq. 9:
Based on this, we obtained the following:
Dividing both sides by dt, we obtained:
If we substitute Y = 0.023, as the negative sign only represents the direction, it has no practical significance. Therefore, we obtained the X and Y values as 0.0575 m s−1 and 0.023 m s−1, respectively.
Therefore, the storm flow velocity is 0.0575 m s−1 and 0.023 m s−1 in the horizontal and vertical directions, respectively when forming silt-sand mini-hummocky structures at the bottom of the shale in the Gulong Sag. The velocity along the lake bottom is 0.0575 m s−1, indicating that the horizontal motion is 2.5 times faster than vertical motion. In the K2qn shale, clay particles with a diameter of 1 mm acting on medium sand particles are often observed. Therefore, based on Table 1, Y = 0.107 m/s and X = 0.107 × 0.0575/0.023 = 0.2675 (m·s−1).
During the deposition of the Qingshankou Formation, the horizontal and vertical velocities of the bottom water in the ancient lake ranged from 0.0575 to 0.2675 m s−1; the transport velocity of 1 mm particles was nearly consistent with the Jurstrom diagram, at approximately 0.18–55 m s−1. It can be seen that the horizontal velocity of transporting 1 mm particles obtained through experiments and calculations is 0.2675 m s−1, which is close to the lower velocity of 1 mm particles shown in the Jurstrom diagram. These velocities will significantly increase if we consider the clay particle’s surface viscosity.
Based on the Jurstrom diagram, the transport velocities of the 0.0039 to 0.0001 mm mud particles ranged from 0.30 to 3.5 m/s, revealing that the particle size of clay is inversely proportional to the transport velocities due to the viscosity. Moreover, using the silt particles (0.005–0.05) in the K2qn, the water flow velocity was 20–55 cm s−1 (Zalmai and Schieber, 2017). Therefore, the depositional velocity of the K2qn3 in the Gulong Sag was at least 20–55 cm s−1.
Strong recombination flows are likely to form asymmetric HCSs (Arnott and Southard, 1990; Dumas and Arontt, 2006). Composite wave marks are distinguished from wave marks formed via oscillating flow by their circular ridges, convex hyperboloid, and strong local erosion (square box shape) on the inflow surface.
The water depth for the formation of hummocky cross-bedding has always been a topic of debate in storm sediment and tempestite studies (Bourgeois, 1980; Hunter and Clifton, 1981). Bourgeois (1980) suggested that the maximum water depth of ocean tempestite was 50 m, while others have proposed depths of >10 m. Hunter and Clifton. (1982) established a relationship diagram between the storm wave period, wave height, and water depth. For a particular wave height, a longer wave period corresponds to a larger water depth (Myrow et al., 2008), implying that the height of the hummocky structure is related to both the wave size and water depth. Long-period waves can form in deeper water, whereas short-period waves can form hummocky structures of the same height in shallower water. Therefore, water depth cannot be simply evaluated by the height of the hummocky structure. Additionally, from Eqs 1, 2, we can infer that under a specific wave height, the greater the wavelength, the greater the water depth. Therefore, the hummocky structure’s height and width should be considered when examining water depth from a hummocky structure perspective.
Makoto et al. (2001) proposed that the wavelength of such bedding increases with an increase in the thickness of storm sediments. However, it decreases with an increase in the paleo-water depth. Its wavelength was considered a function of the bottom oscillating water flow track diameter caused by the storm surge. The effective storm wave base depth was one-third of the storm wavelength (Alberto and Fernando, 2012). However, this information does not allow us to infer the water depth of the Gulong Sag from a hummocky structure scale.
Greenwood and Sherman (1986) observed that typical hummocky cross-bedding with a wave height of several centimeters and 0.3–0.6 m wavelength could form in a lake at a 2.0 m depth. The ripple index ranged from 8 to 10, and the ratio of the water depth to the HSC wave height was approximately 1/30 (calculated in this study). 1:100 was used for reliability; the water depth for hummocky cross-bedding at 0.02 m height should be approximately 2.00 m. Therefore, the water depth of the Gulong Sag during the K2qn sedimental period should be approximately 2.00 m, which may not be consistent with the situation at that time. Nevertheless, this indirectly reveals that the depth of the Gulong Sag at that time was not great. Based on studies of wave activity in the modern Yellow River, the ratio of the sand wave height to the water depth is approximately 10–20. Therefore, this provides evidence that the depth of the K2qn1 is not overly large. Recently, five current closed lakes near Daqing were investigated; clay deposits at the bottom of the lakes were in a reductive phase when the water depth was shallow. When fresh, the clay deposits were black and smelled like hydrogen sulfide and ammonia. This information was insufficient to distinguish deep water based on the fine grain size and high matrix content of the sediments. Bourgeois (1980) indicated that the maximum depth of Gulong Lake does not exceed 50 m. Therefore, the ancient water depth of Gulong Lake during the Qingshankou stage should have been 2–50 m.
In conclusion, restoring the water depth through HSCs is significant for lake palaeography, paleodeposition, and the development of source rocks. Through this study, we propose a model diagram of storm deposition of the K2qn shale oil reservoir in the Gulong Sag (Figure 13).
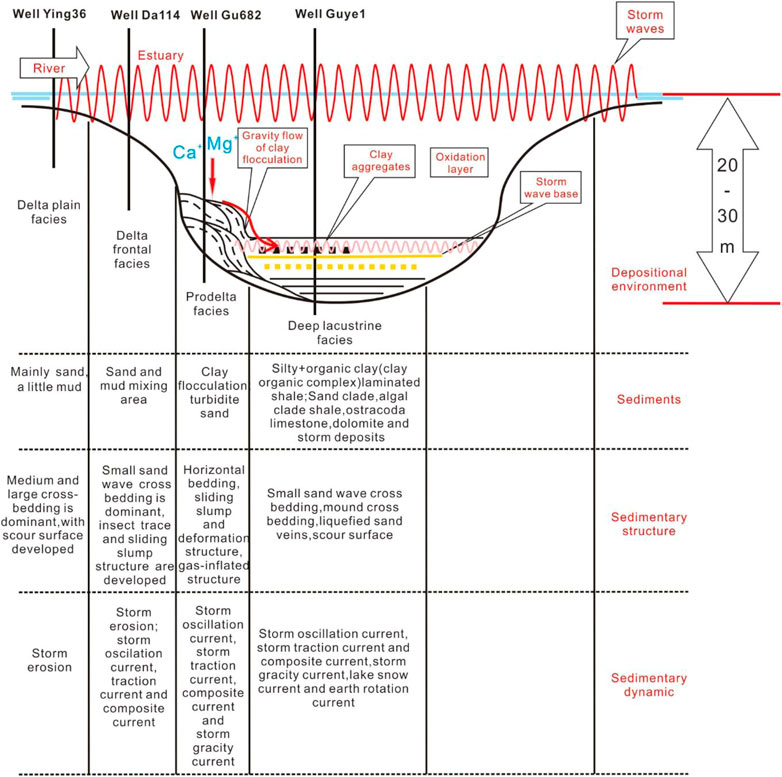
FIGURE 13. Model of salt lake storm deposition in the Qingshankou Formation, Gulong Sag.
Many storm deposits are developed in the Qingshankou Formation, Gulong Sag, primarily composed of gray calcareous silt, silty mud, ostracods, and algal debris. Storms that affected the Qingshankou Formation formed many small hummocky structures and cross-beddings, with a width of several centimeters and height of <1 cm. The width of the largest bedding was 10 cm, with a 2 cm height. There were also many relatively hummock/swale structures and hummocky/swale cross-bedding as flat thin siltstones. The storm sediments of the Qingshankou Formation have abundant silt-sized mud, which formed via the re-fragmentation of lake-bottom mud disturbed by the storm. Tiny veins of liquefied silt developed at the bottom of most storm-deposited silt layers. The silty veins formed via gravity deposition after the liquefaction of the silty storm layer, rather than classic liquefaction overpressure injection from the bottom to the top. Black and gray-black mud shale symbiosis with, or adjacent to, storm deposits also had a sand structure. The mud particles mostly ranged between 0.01 and 0.03 mm, unique internal debris formed by storm stirring and crushing. Storm activity and deposition significantly influenced the shale oil reservoir in the Gulong Sag. Even the grayish-brown, grayish-black, and black shales in the gray siltstone without storm deposition all had sand structures, indicating that storms and other bottom currents significantly influenced lakeside deposits. The sub-lacustrine flow velocity due to storm waves in the Qingshankou Formation was between 0.20 and 0.55 cm s−1.
The original contributions presented in the study are included in the article/supplementary material, further inquiries can be directed to the corresponding authors.
WH: Conceptualization, Resources, Project administration JZ: Writing Original Draft, Formal analysis NS: Investigation, Data Curation.
This work was supported by National Natural Science Foundation of China (Grant No.42072138; 41572088).
We gratefully acknowledge the Research Institute of Exploration and Development, Daqing Oilfield Company Limited for providing geological data and samples. Special thanks give also to the editor and reviewers for handing our manuscript and for the constructive comments.
Author WH was employed by Daqing Oilfield Co., Ltd., PetroChina and China National Oil and Gas Exploration and Development Company Ltd.
The remaining authors declare that the research was conducted in the absence of any commercial or financial relationships that could be construed as a potential conflict of interest.
All claims expressed in this article are solely those of the authors and do not necessarily represent those of their affiliated organizations, or those of the publisher, the editors and the reviewers. Any product that may be evaluated in this article, or claim that may be made by its manufacturer, is not guaranteed or endorsed by the publisher.
Aigner, T. A., and Reineck, H. E. (1982). Proximality trends in modern storm sands from the Helgoland Bight (North Sea) and their implications for basin analysis. Senckenberg. Marítima 14, 83
Aigner, T. A. (1985b). Storm depositional systems: Dynamic stratigraphy in modern and ancient shallow-marine sequences: Berlin. Lect. Notes Earth Sci. 3, 174.
Aigner, T. (1980). Storm deposits as a tool in facies analysis. Abstracts: International Association of Sedimentologists 1st European Meeting, 44
Alberto, P., and Fernando, P. (2012). Tempestite facies models for the epicontinental triassic carbonates of the betic cordillera (southern Spain). Sedimentology 59, 646–678. doi:10.1111/j.1365-3091.2011.01270.x
Allen, P. A. (1981). Wave-generated structures in the Devonian lacustrine sediments of southeast Shetland and ancient wave conditions. Sedimentology 28, 369–379. doi:10.1111/j.1365-3091.1981.tb01686.x
Arnott, R. W. C., and Southard, J. B. (1990). Exploratory flow experiments on combined flow bed configurations, and some implications for interpreting storm 2 event stratification. J. Sediment. Petrology 60, 211
Bourgeois, J. (1980). A transgressional shelf sequence exhibiting hummocky stratification: The Cape Sebastian Sandstone (Upper Cretaceous), southwestern Oregon. J. Sediment. Res. 50, 681–702. doi:10.1306/212f7ac2-2b24-11d7-8648000102c1865d
Chen, H., Tian, J. C., Jiang, Y. Q., YouZhang, L. W, X., and Kang, J. W. (2008). Sedimentary characteristics and significance of the storm deposits in the two and four stages of the Sichuan basinXinjiang. Pet. Geol. 29, 581–584. (in Chinese with English abstract)
Chen, Z. M., Zhang, S. K., and Wan, L. G. (1988). The formation of structural fissures in the mudstone in Qingshankou group in the northern part of Gulong Sag and a forecast of the distribution of oi and gas pools. Acta Pet. Sin. 9, 7–15. (in Chinese with English abstract).
Cui, J. W., Zhang, Z. Y., Liu, J. L., Liu, G. L., Huang, X., Qi, Y. L., et al. (2021). Hydrocarbon generation and expulsion quantification and contribution of multiple source rocks to hydrocarbon accumulation in yanchang formation, ordos basin, china. J. Nat. Gas Geoscience 6, 375–391. doi:10.1016/j.jnggs.2021.12.001
Dott, R. H., and Bourgeois, J. (1982). Hummocky stratification: Significance of its variable bedding sequences. Geol. Soc. Am. Bull. 93, 663–680. doi:10.1130/0016-7606(1982)93<663:hssoiv>2.0.co;2
Dumas, S., and Arnott, R. W. C. (2006). Origin of hummocky and swaley cross-stratification–The controlling influence of unidirectional current strength and aggradation rate. Geol. 34, 1073–1076. doi:10.1130/g22930a.1
Dumas, S., Arontt, R. W. C., and Southard, J. B. (2005). Experiments on oscillatory-flow and combined-flow bed forms: Implications for interpreting parts of the shallow-marine sedimentary record. J. Sediment. Res. 75, 501–513. doi:10.2110/jsr.2005.039
Fang, S. X., Hou, F. H., Yang, X. Y., He, J., Shen, Z. G., Qiao, L., et al. (2011). The tempestites in the two lower subsection of the middle triassic in the ordos basin. Acta Sedimentol. Sin. 29, 23–30. doi:10.14027/j.cnki.cjxb.2011.01.002
Feng, X. L., Ma, L. X., Deng, H. W., and Lin, H. X. (2011). Dawangbei subsag of lacustrine sedimentary characteristics of beach bar sand storm. Xinjiang Geol. 29, 80–85. (in Chinese with English abstract). doi:10.3969/j.issn.1000-8845.2011.01.017
Gao, R. Q. (1984). Characteristics of petroleum generation and expulsion in abnormal pressure shale zones and the formation of fractured shale reservoirs. Petroleum Geol. Oilfield Dev. Daqing 3, 160–167. (in Chinese with English abstract).
Gilbert, G. K. (1899). Ripple-marks and cross-bedding. Geol. Soc. Am. Bull. 10, 135–140. doi:10.1130/gsab-10-135
Greenwood, B., and Sherman, D. J. (1986). Hummocky cross-stratification in the surf zone: Flow parameters and bedding Genesis. Sedimentology 33, 33–45. doi:10.1111/j.1365-3091.1986.tb00743.x
Guo, F., and Guo, L. (2011). Lacustrine facies tempestites in the Western qaidam basin. Xinjiang Geol. 29, 125–129. (in Chinese with English abstract). doi:10.3969/j.issn.1000-8845.2011.02.002
He, W. Y., Cui, B. W., Wang, F. L., Wang, Y. Z., Meng, Q. A., Zhang, J. Y., et al. (2022b). Study on the shale fissures, shale calcite veins and oil-state of Qingshankou formation from Gulong Sag. Geol. Rev. 68, 693–741. (in Chinese with English abstract). doi:10.16509/j.georeview.2021.12.001
He, W. Y. (2022). Discovery of nm pores and nm fractures in Gulong shale oil reservoir and its significances. Petroleum Geol. Oil develepment Daqing 41, 1–15. (in Chinese with English abstract). doi:10.19597/J.ISSN.1000-3754.202112019
He, W. Y., Meng, Q. A., Feng, Z. H., Zhang, J. Y., and Wang, R. (2022a). In-situ accumulation theory and exploration and development practice of Gulong shale oil in Songliao Basin. Acta Pet. Sin. 43, 1–14. (in Chinese with English abstract). doi:10.7623/syxb202201001
He, W. Y., Meng, Q. A., and Zhang, J. Y. (2021). Controlling factors and their classification-evaluation of Gulong shale oil enrichment in Songliao Basin. Petroleum Geol. Oil develepment Daqing 40, 1–12. (in Chinese with English abstract). doi:10.19597/J.ISSN.1000-3754.202107045
Hunter, R. E., and Clifton, E. H. (1982). Cyclic deposits and hummocky cross-stratification of probable storm origin in upper cretaceous rocks of the cape sebastian area, southwestern Oregon. J. Sediment. Petrology 52, 027
Immenhauser, A. (2009). Estimating palaeo-water depth from the physical rock record. Earth. Sci. Rev. 96, 107–139. doi:10.1016/j.earscirev.2009.06.003
Jiang, Z. X., Zhao, C. L., Liu, M. H., and Yuan, Z. W. (1990). A preliminary study on the east sag web lacustrine storm deposits. Acta Sedimentol. Sin. 8, 107–114. (in Chinese with English abstract).
Kelling, G., and Mullin, P. R. (1975). Graded limestones and limestone-quartzite couplets: Possible storm-deposits from the Moroccan carboniferous. Sediment. Geol. 13, 161–190. doi:10.1016/0037-0738(75)90019-6
Klein, G. D., and Marsaglia, K. M. (1987). Hummocky cross-stratification, tropical hurricanes, and intense winter storms. Sedimentology 34, 333–337. doi:10.1111/j.1365-3091.1987.tb00781.x
Komar, P. D. (1998). Beach processes and sedimentation. Upper Saddle River, New Jersey: Prentice-Hall, 544.
Liu, Q. Y., Li, P., Jin, Z. J., Liang, X. P., Zhu, D. Y., Wu, X. Q., et al. (2021). Preservation of organic matter in shale linked to bacterial sulfate reduction (BSR) and volcanic activity under marine and lacustrine depositional environments. Mar. Petroleum Geol. 127, 104950. doi:10.1016/j.marpetgeo.2021.104950
Liu, Q. Y., Pi, P., Jin, Z. J., Sun, Y. W., Hu, G., Zhu, D. Y., et al. (2022). Organic-rich formation and hydrocarbon enrichment of lacustrine shale strata: A case study of chang 7 member. Sci. China Earth Sci. 65, 118–138. doi:10.1007/s11430-021-9819-y
Liu, X., Zhong, J. H., Rodney, G., Bian, S. H., and Liang, C. (2012). Late cretaceous tempestite in northern Songliao basin, China. J. Asian Earth Sci. 56, 33–41. doi:10.1016/j.jseaes.2012.02.007
Lowe, D. R. (1975). Water escape structures in coarse-grained sediments. Sedimentology 22, 157–204. doi:10.1111/j.1365-3091.1975.tb00290.x
Lu, C., Ma, L., Guo, J. C., Xiao, S. W., Zheng, Y. C., and Yin, C. B. (2020). Effect of acidizing treatment on microstructures and mechanical properties of shale. Nat. Gas. Ind. B 7, 254–261. doi:10.1016/j.ngib.2019.10.007
Macquaker, J. H. S., Bentley, S. J., and Bohacs, K. M. (2010). Wave-enhanced sediment-gravity flows and mud dispersal across continental shelves: Reappraising sediment transport processes operating in ancient mudstone successions. Geology 38, 947–950. doi:10.1130/g31093.1
Makoto, I., Asako, I., Toru, N., Takahiro, S., and Takahiro, S. (2001). Temporal variation in the wavelength of hummocky cross-stratification: Implications for storm intensity through Mesozoic and Cenozoic. Geol. 29, 87–89. doi:10.1130/0091-7613(2001)029<0087:tvitwo>2.0.co;2
Mohseni, H., and Al-Aasm, I. S. (2004). Tempestite deposits on a storm-influenced carbonate ramp: An example from the pabdeh formation (paleogene), zagros basin, swiran. J. Pet. Geol. 27, 163–178. doi:10.1111/j.1747-5457.2004.tb00051.x
Myrow, P. M., Lukens, C., Lamb, M. P., Houck, K., and Strauss, J. (2008). Dynamics of a Transgressive Prodeltaic System: Implications for Geography and Climate Within a Pennsylvanian Intracratonic Basin, Colorado, U.S.A. J. Sediment. Res. 78, 512–528. doi:10.2110/jsr.2008.061
Nie, H., Chen, Q., Zhang, G., Sun, C., Wang, P., Lu, Z., et al. (2021). An overview of the characteristic of typical Wufeng–Longmaxi shale gas fields in the Sichuan Basin, China. Natural Gas Industry B. 83 (3), 217–230. doi:10.1016/j.ngib.2021.04.001
Sun, L. D. (2020). Shale oil in Gulong Sag. Petroleum Geol. Oilfield Dev. Daqing 39, 1–7. (in Chinese with English abstract). doi:10.19597/J.ISSN.1000-3754.202005037
Tao, H. F., Xu, J., Zhang, Z. N., Wang, X. F., Liu, H. T., and Guo, W. H. (2021). Experimental studies on nanopore evolution in organic matter-rich shales. J. Nat. Gas Geoscience 6, 231–243. doi:10.1016/j.jnggs.2021.07.002
Wang, G. Y., Wang, F. L., Meng, Q. A., and Gu, S. F. (2020). Stratgic significance and research direction for Gulong shale oil. Petroleum Geol. Oil develepment Daqing 39, 8–19. (in Chinese with English abstract). doi:10.19597/J.ISSN.1000-3754.202005036
Xue, P., Zhang, L. X., Liang, Q. S., Sun, X. N., Zhao, Q. P., and Qi, P. W. (2020). Thermodynamic characteristics of CH4 adsorption by continental shale: A case study of the Upper Triassic Yanchang shale in the Yanchang Gasfield, Ordos Basin. Nat. Gas. Ind. B 7, 269–277. doi:10.1016/j.ngib.2019.10.009
Yang, W., Tian, J. C., Zhu, Y. T., and Wang, F. (2009). Two characteristics of Permian Shiqianfeng Formation in Dengfeng area of Henan storm deposits. Sediment. Geol. Tethyan Geol. 29, 55. doi:10.3969/j.issn.1009-3850.2009.01.011
Zalmai, Y., and Schieber, J. (2017). On the origin of silt laminae in laminated shales. Sediment. Geol. 360, 22–34. doi:10.1016/j.sedgeo.2017.09.001
Zhang, J. L., Shou, J. F., and Zhao, C. L. (1988). The storm deposits in Dongpu sag sand three section. Acta Sedimentol. Sin. 6, 50–57. (in Chinese with English abstract).
Zheng, N., Jiang, Z. X., Li, T. D., Geng, S. F., You, G. Q., and He, Y. B. (2010). The basic characteristics of sediments in Bohai Bay Basin in Gunan sag storm and its geological significance. Geol. China 37, 1191–1198. (in Chinese with English abstract).
Zhi, D. M., Tang, Y., He, W. J., Guo, X. G., Zheng, M. L., and Huang, L. L. (2021). Orderly coexistence and accumulation models of conventional and unconventional hydrocarbons in Lower Permian Fengcheng Formation, Mahu sag, Junggar Basin. Petroleum Explor. Dev. 48, 43–59. doi:10.1016/s1876-3804(21)60004-6
Zhong, J. H., Ni, L. T., Sun, N. L., Hao, B., Xue, C. Q., Shao, Z. F., et al. (2020a). Lacustrine storm and tempestite of Lower Cretaceous in the Lingshan Island, Qingdao, Shandong. Acta Geol. Sin. 94, 3036–3061. (in Chinese with English abstract). doi:10.19762/j.cnki.dizhixuebao.2020040
Zhong, J. H., Ni, L. T., Wang, L. D., Song, Q. Y., Sun, N. L., Song, G. X., et al. (2020b). Discovery of large sand dykes in the Lower Cretaceous of southern Beilaishi, Lingshan Island, Qingdao, and their formation dynamics. Geol. Rev. 66, 1457–1475. (in Chinese with English abstract). doi:10.16509/j.georeview.2020.06.001
Zhong, J. H., Song, G. X., Ni, L. T., Sun, N. L., Hao, B., Sim, Y. Z., et al. (2018). Modern non-seismically induced deformation bedding in the lower reaches of the Yellow river and Yellow river Delta. Acta Sedimentol. Sin. 37, 239–253. (in Chinese with English abstract). doi:10.14027/j.issn.1000-0550.2018.168
Keywords: tempestite, storm deposit, shale oil, Qingshankou Formation, Gulong Sag
Citation: He W, Zhong J and Sun N (2023) Discovery and significance of tempestites and storm deposits in the Qingshankou Formation of the Gulong Sag, northeastern China. Front. Earth Sci. 10:999135. doi: 10.3389/feart.2022.999135
Received: 20 July 2022; Accepted: 28 September 2022;
Published: 09 January 2023.
Edited by:
Hao Zou, Chengdu University of Technology, ChinaReviewed by:
Ziliang Liu, Chengdu University of Technology, ChinaCopyright © 2023 He, Zhong and Sun. This is an open-access article distributed under the terms of the Creative Commons Attribution License (CC BY). The use, distribution or reproduction in other forums is permitted, provided the original author(s) and the copyright owner(s) are credited and that the original publication in this journal is cited, in accordance with accepted academic practice. No use, distribution or reproduction is permitted which does not comply with these terms.
*Correspondence: Wenyuan He, hewenyuan@petrochina.com.cn; Jianhua Zhong, 957576033@qq.com
Disclaimer: All claims expressed in this article are solely those of the authors and do not necessarily represent those of their affiliated organizations, or those of the publisher, the editors and the reviewers. Any product that may be evaluated in this article or claim that may be made by its manufacturer is not guaranteed or endorsed by the publisher.
Research integrity at Frontiers
Learn more about the work of our research integrity team to safeguard the quality of each article we publish.